
A Smart Voltage and Current Monitoring System for Three Phase Inverters Using an Android Smartphone Application


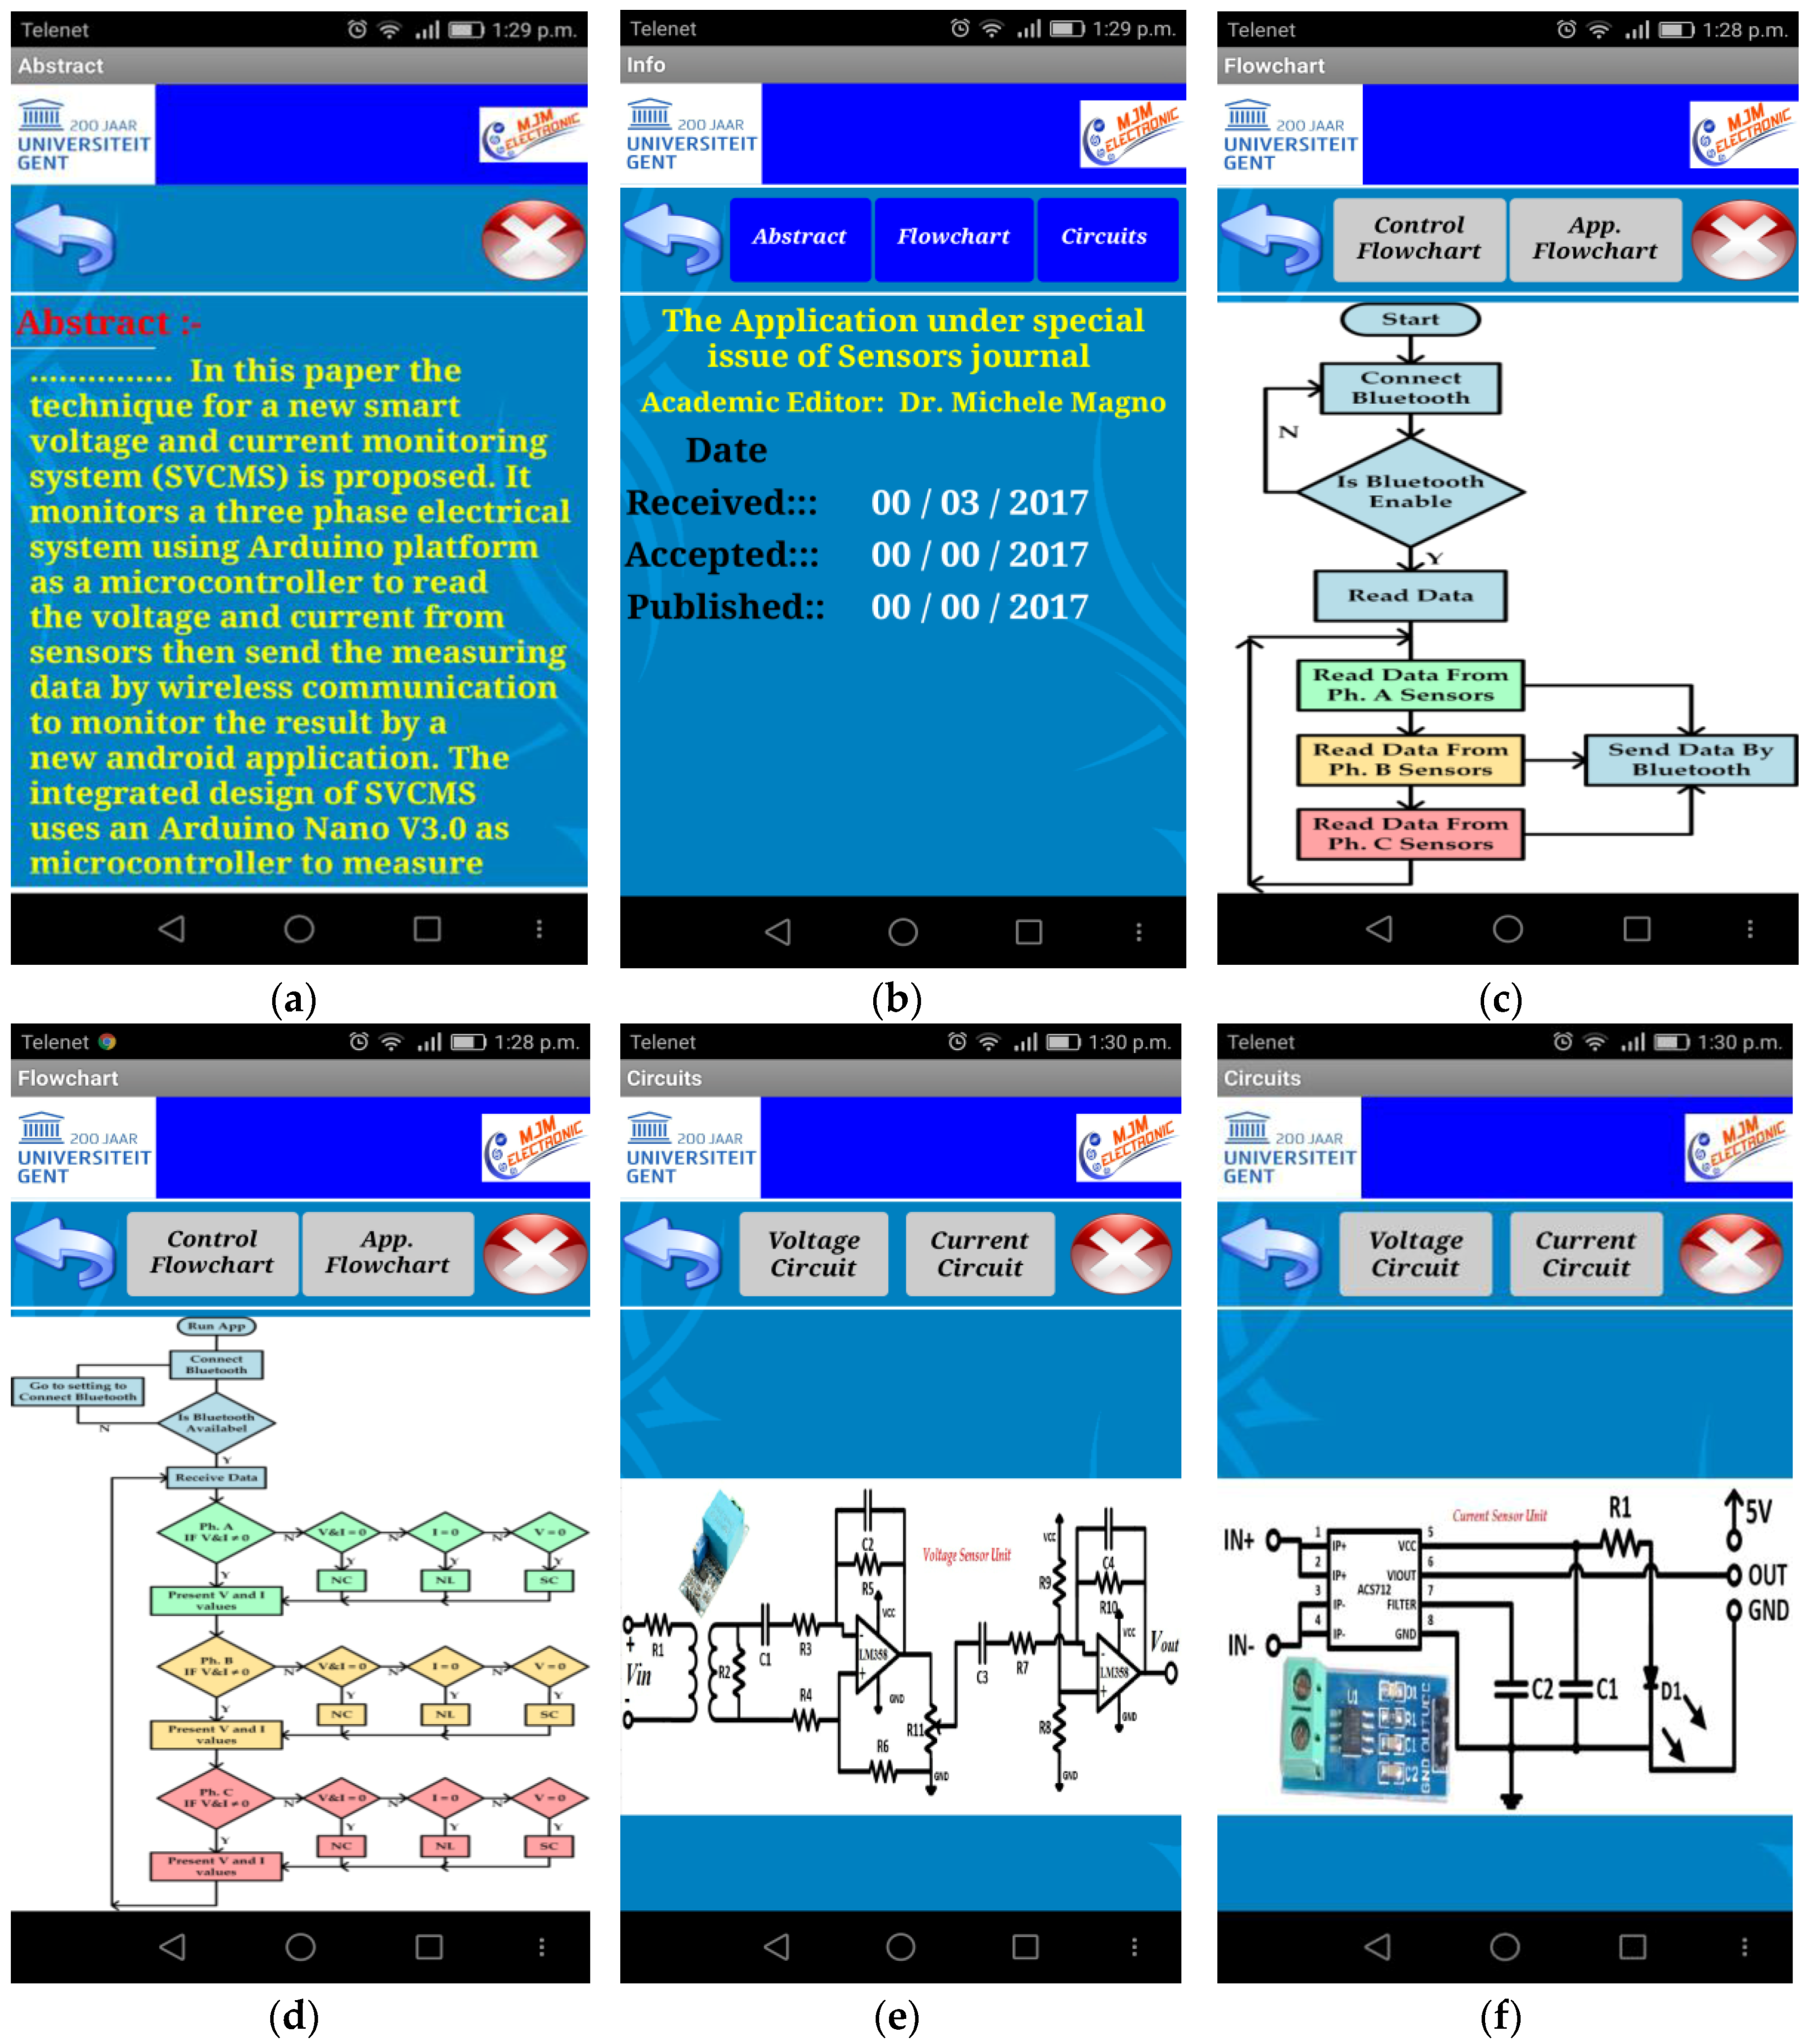
Abstract
:1. Introduction
2. Related Work
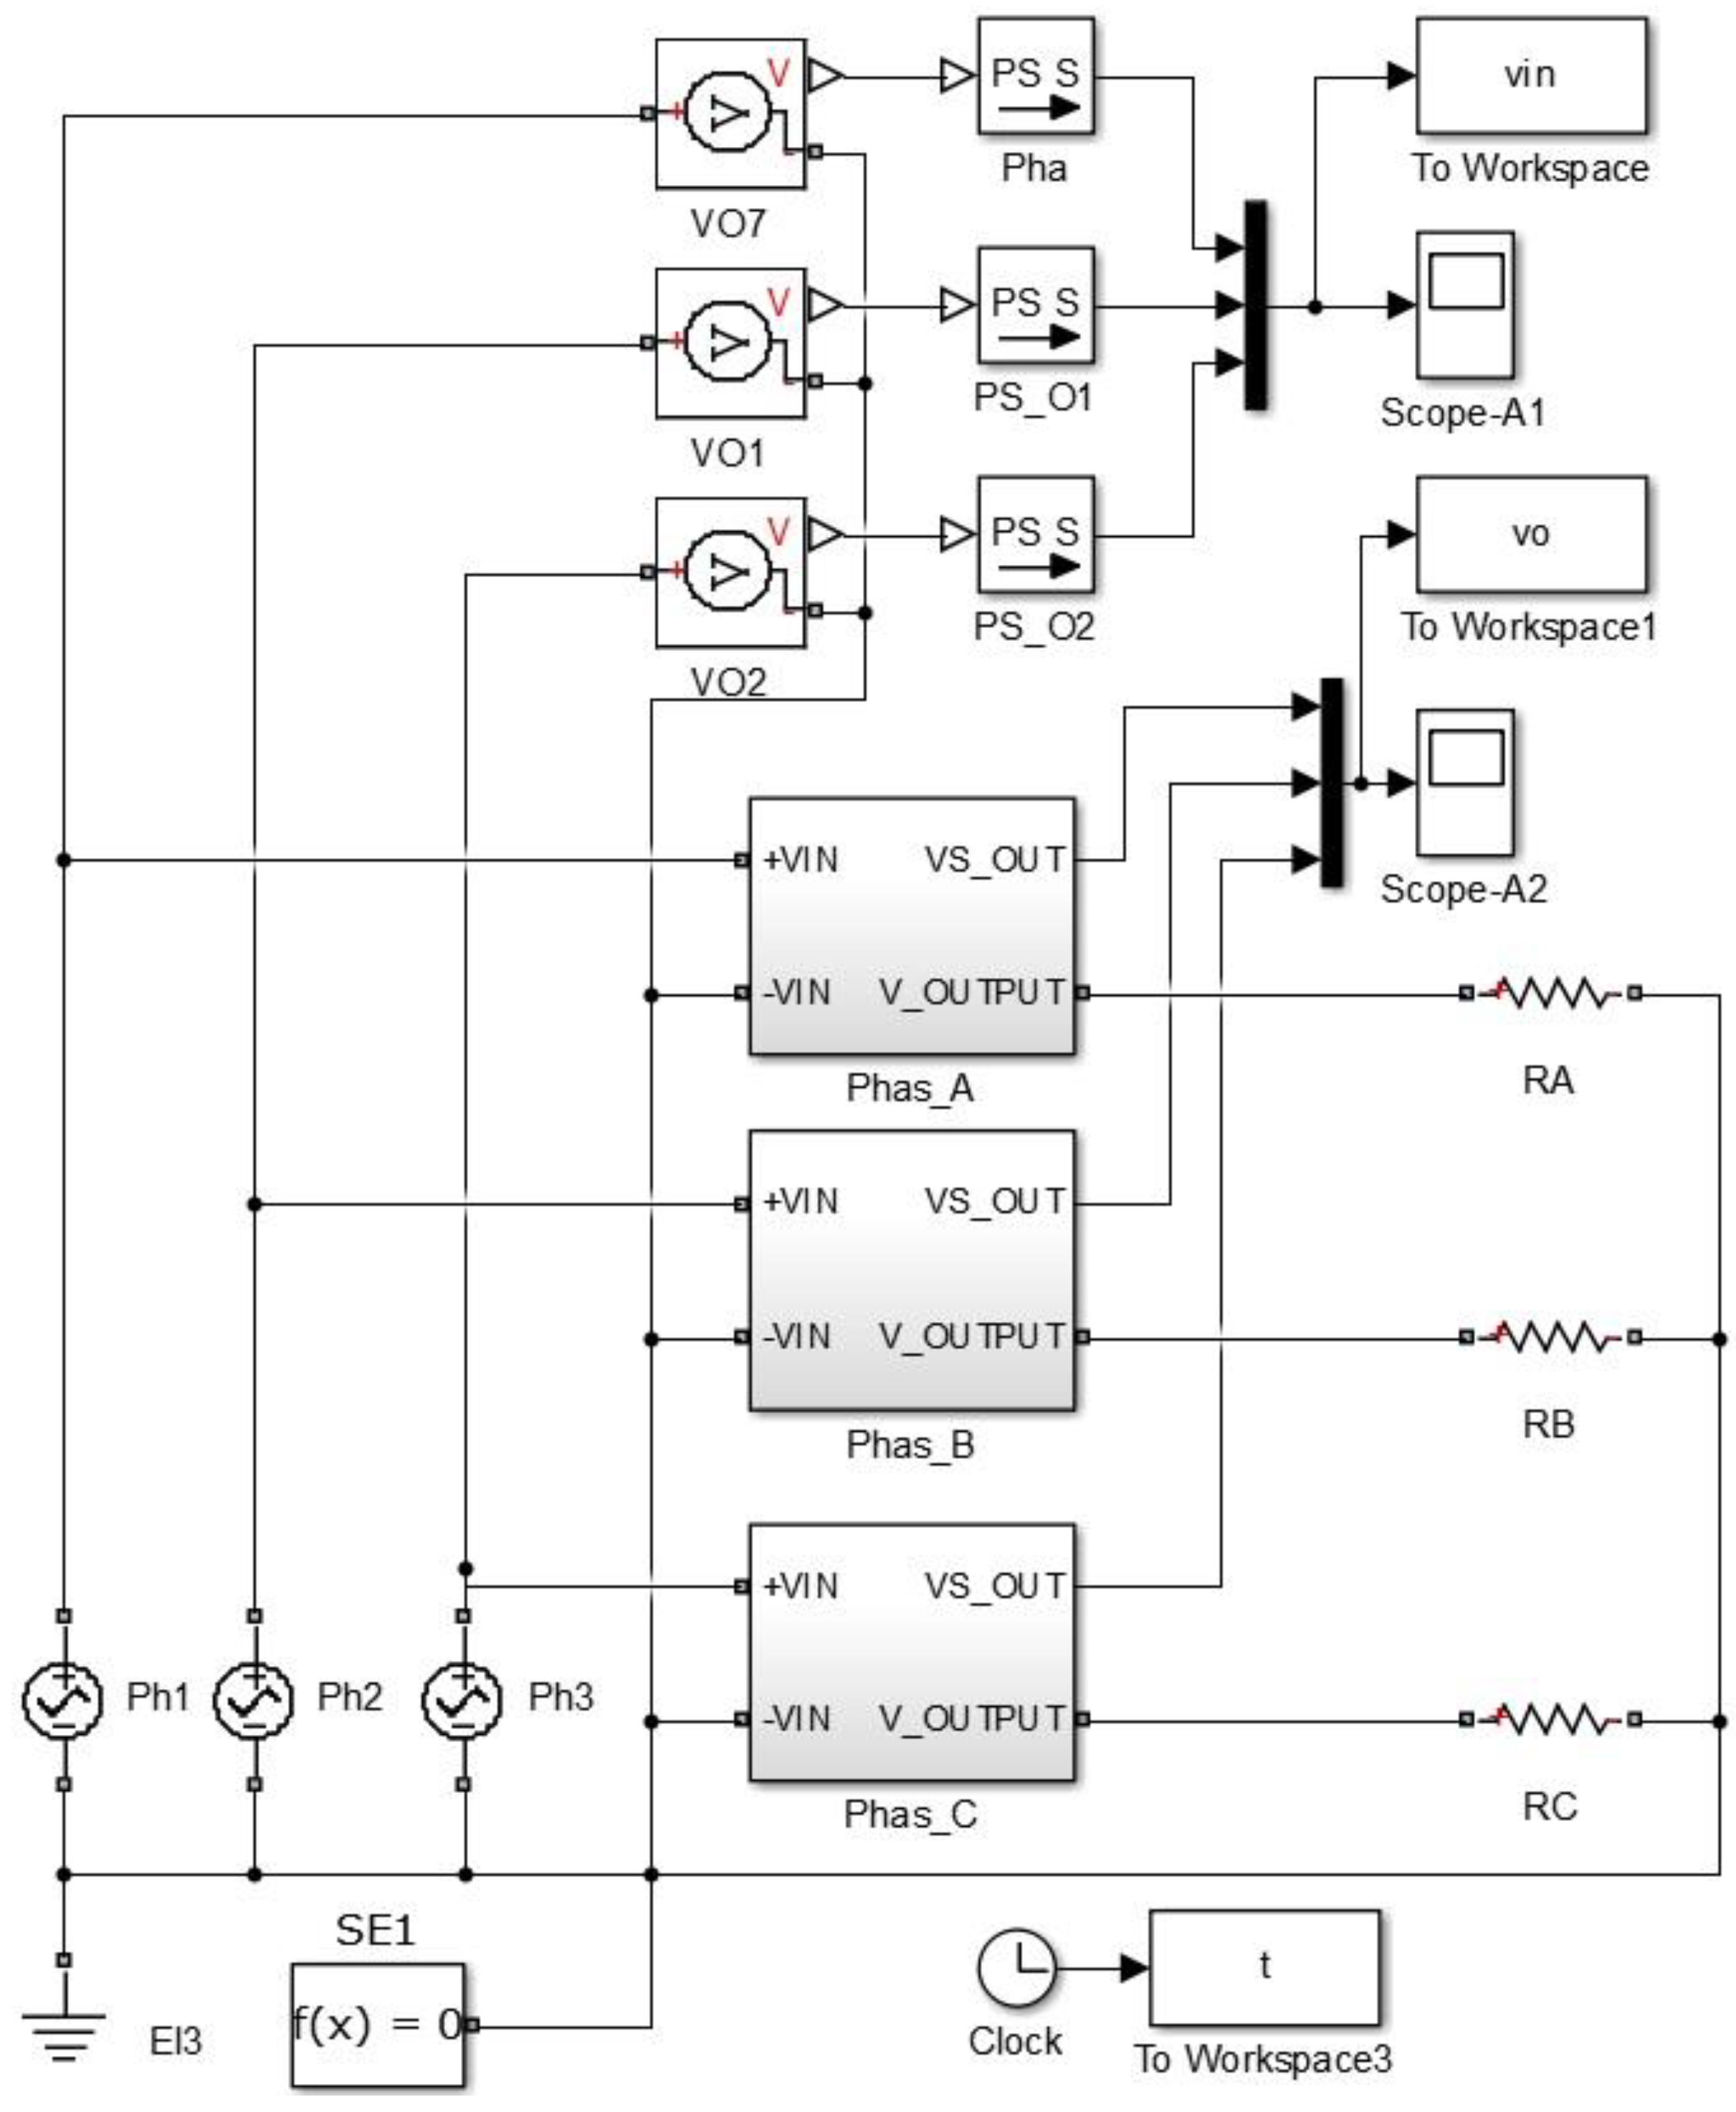
3. SVCMS Design
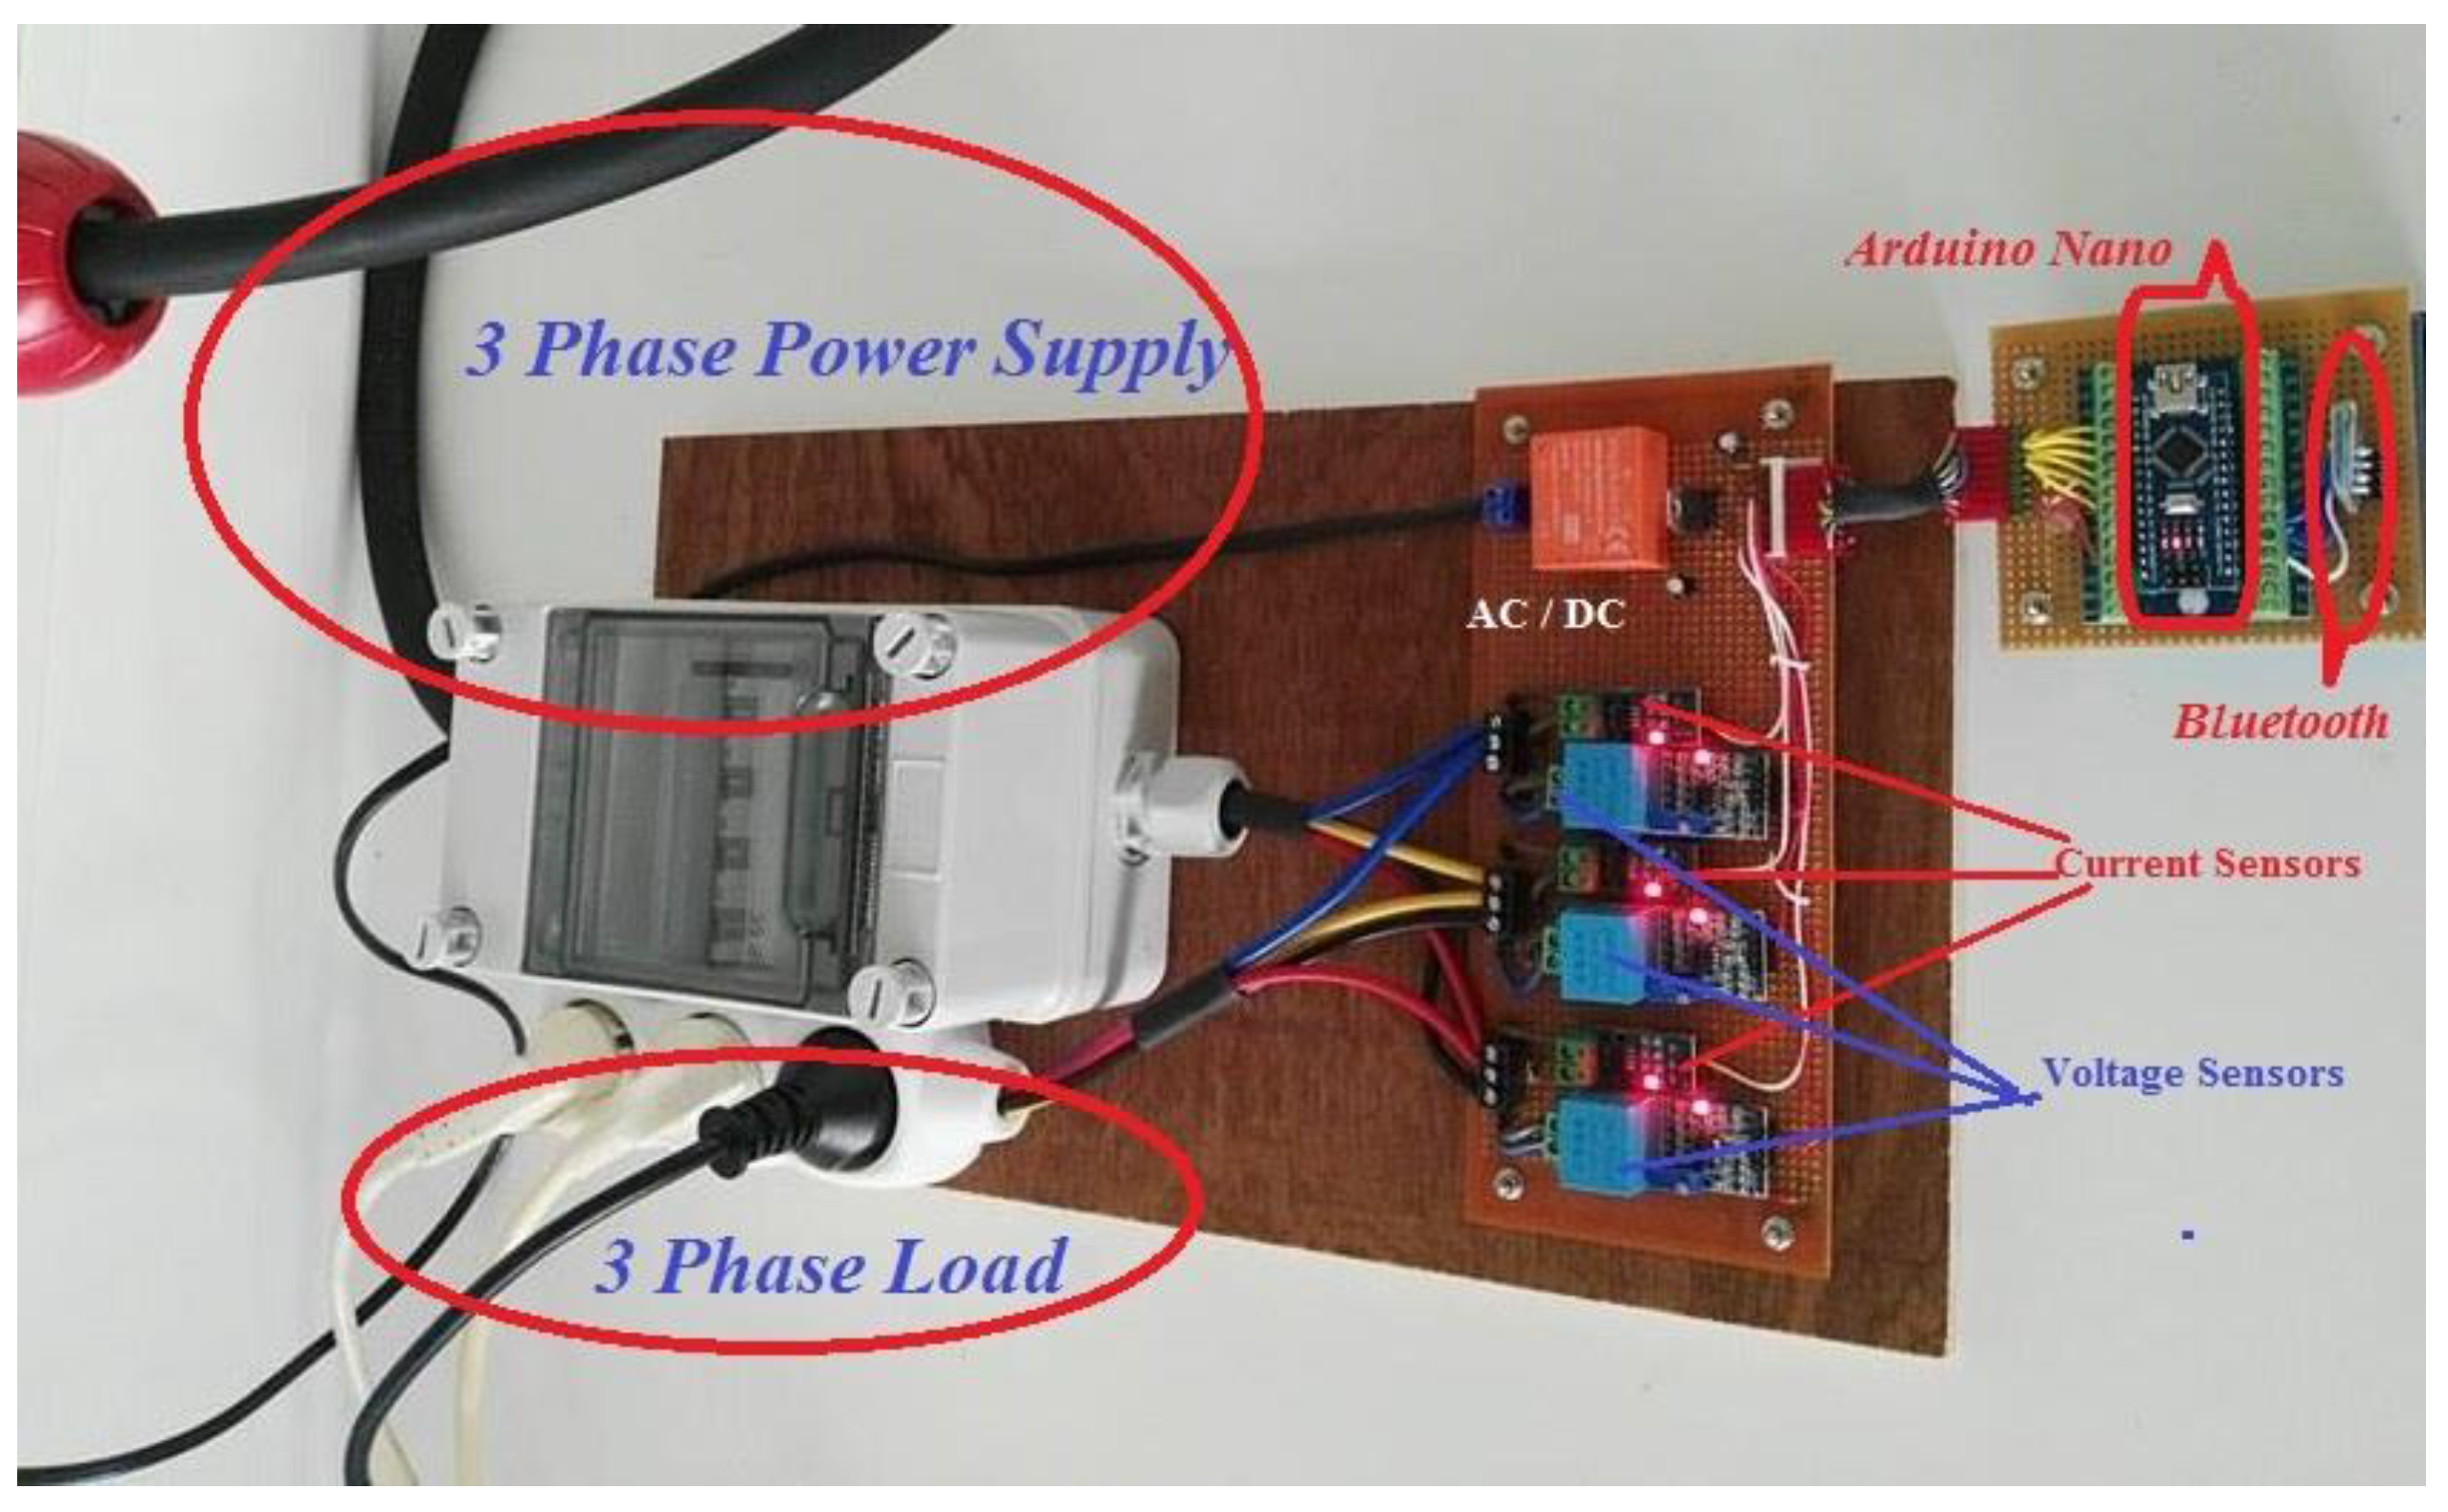
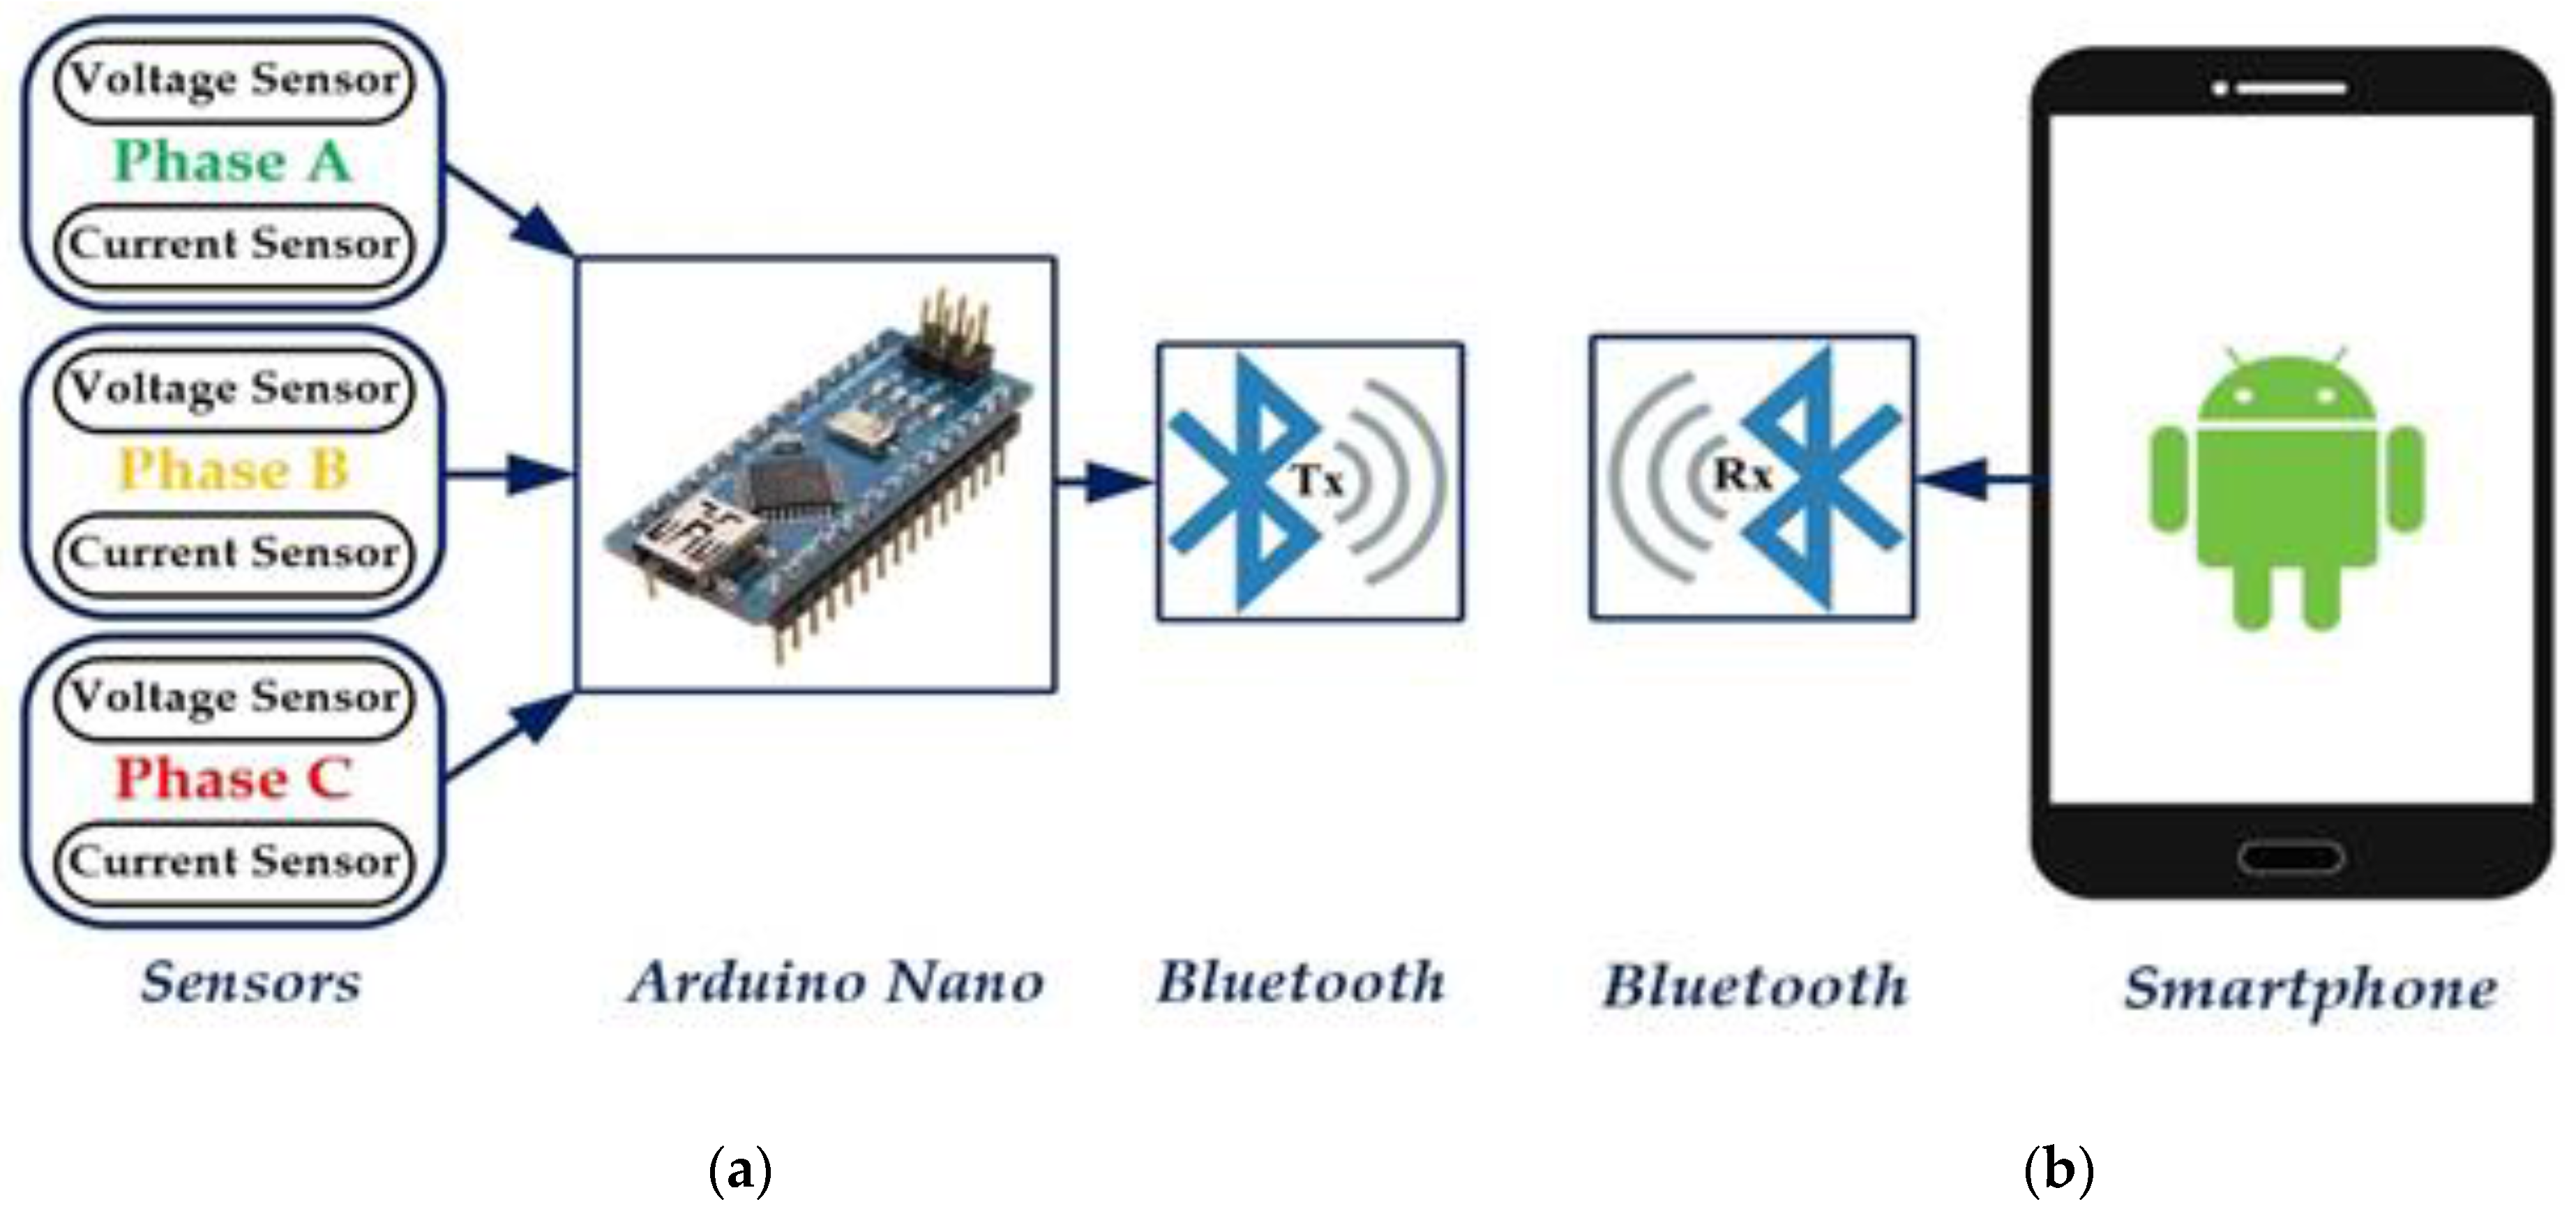
3.1. Control System (Hardware Design)
- Voltage sensor unit
- Current sensor unit
- Microcontroller unit
- Wireless communication unit
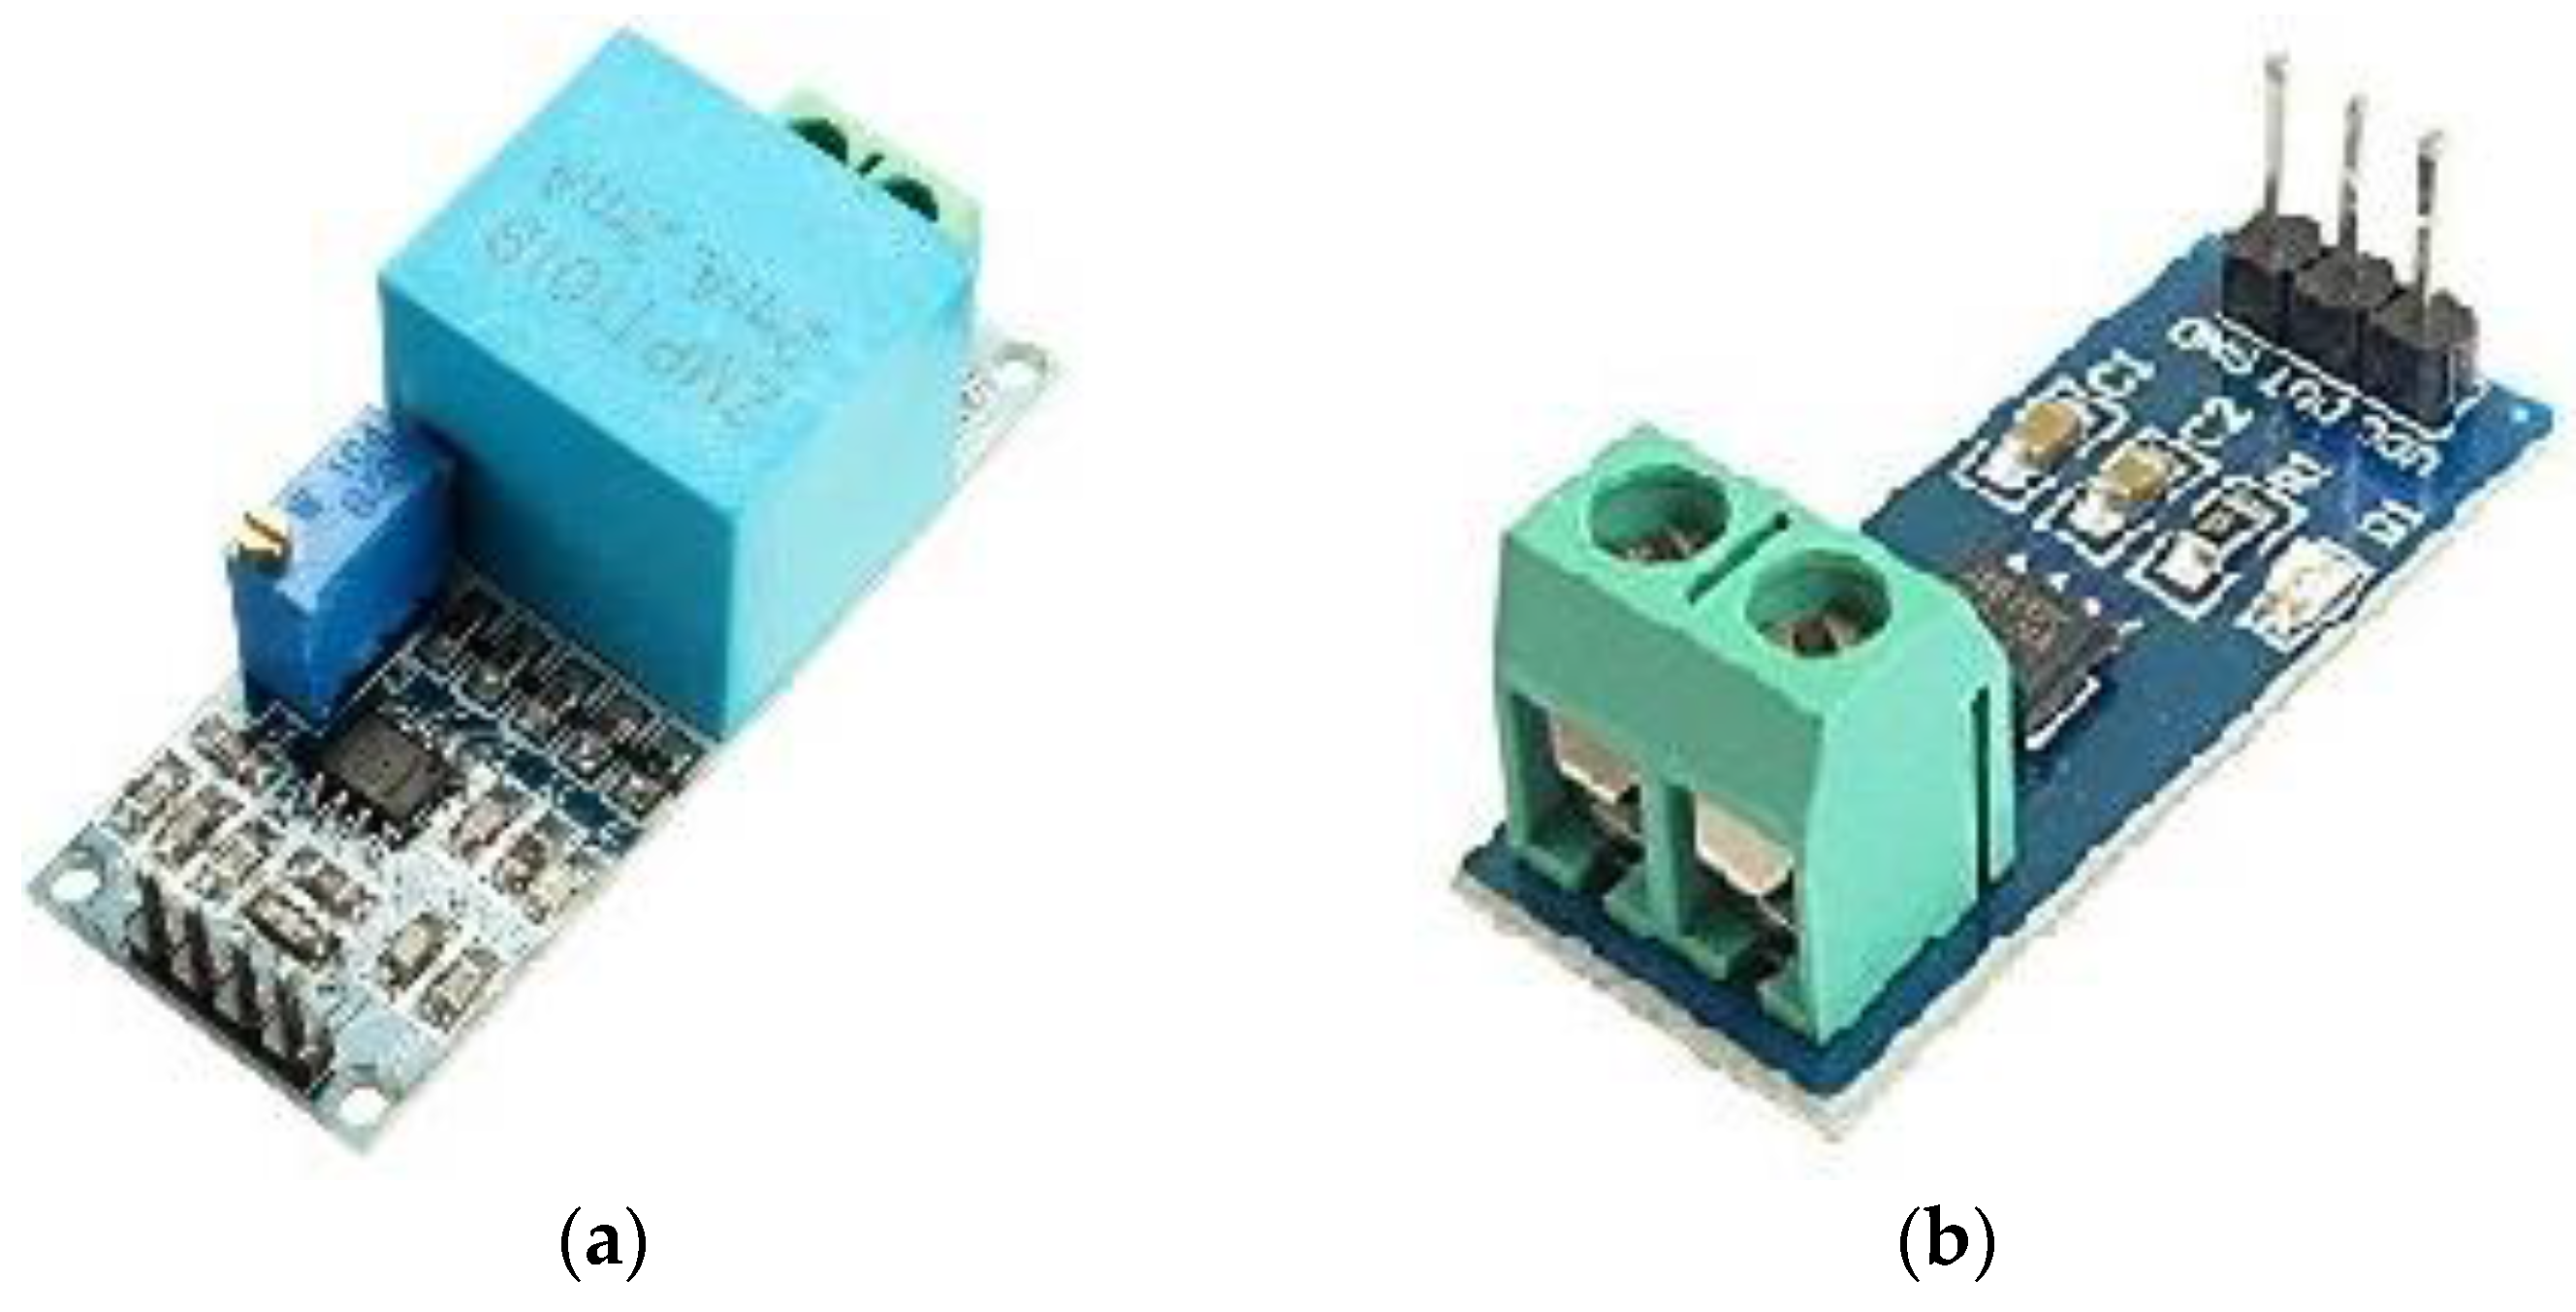
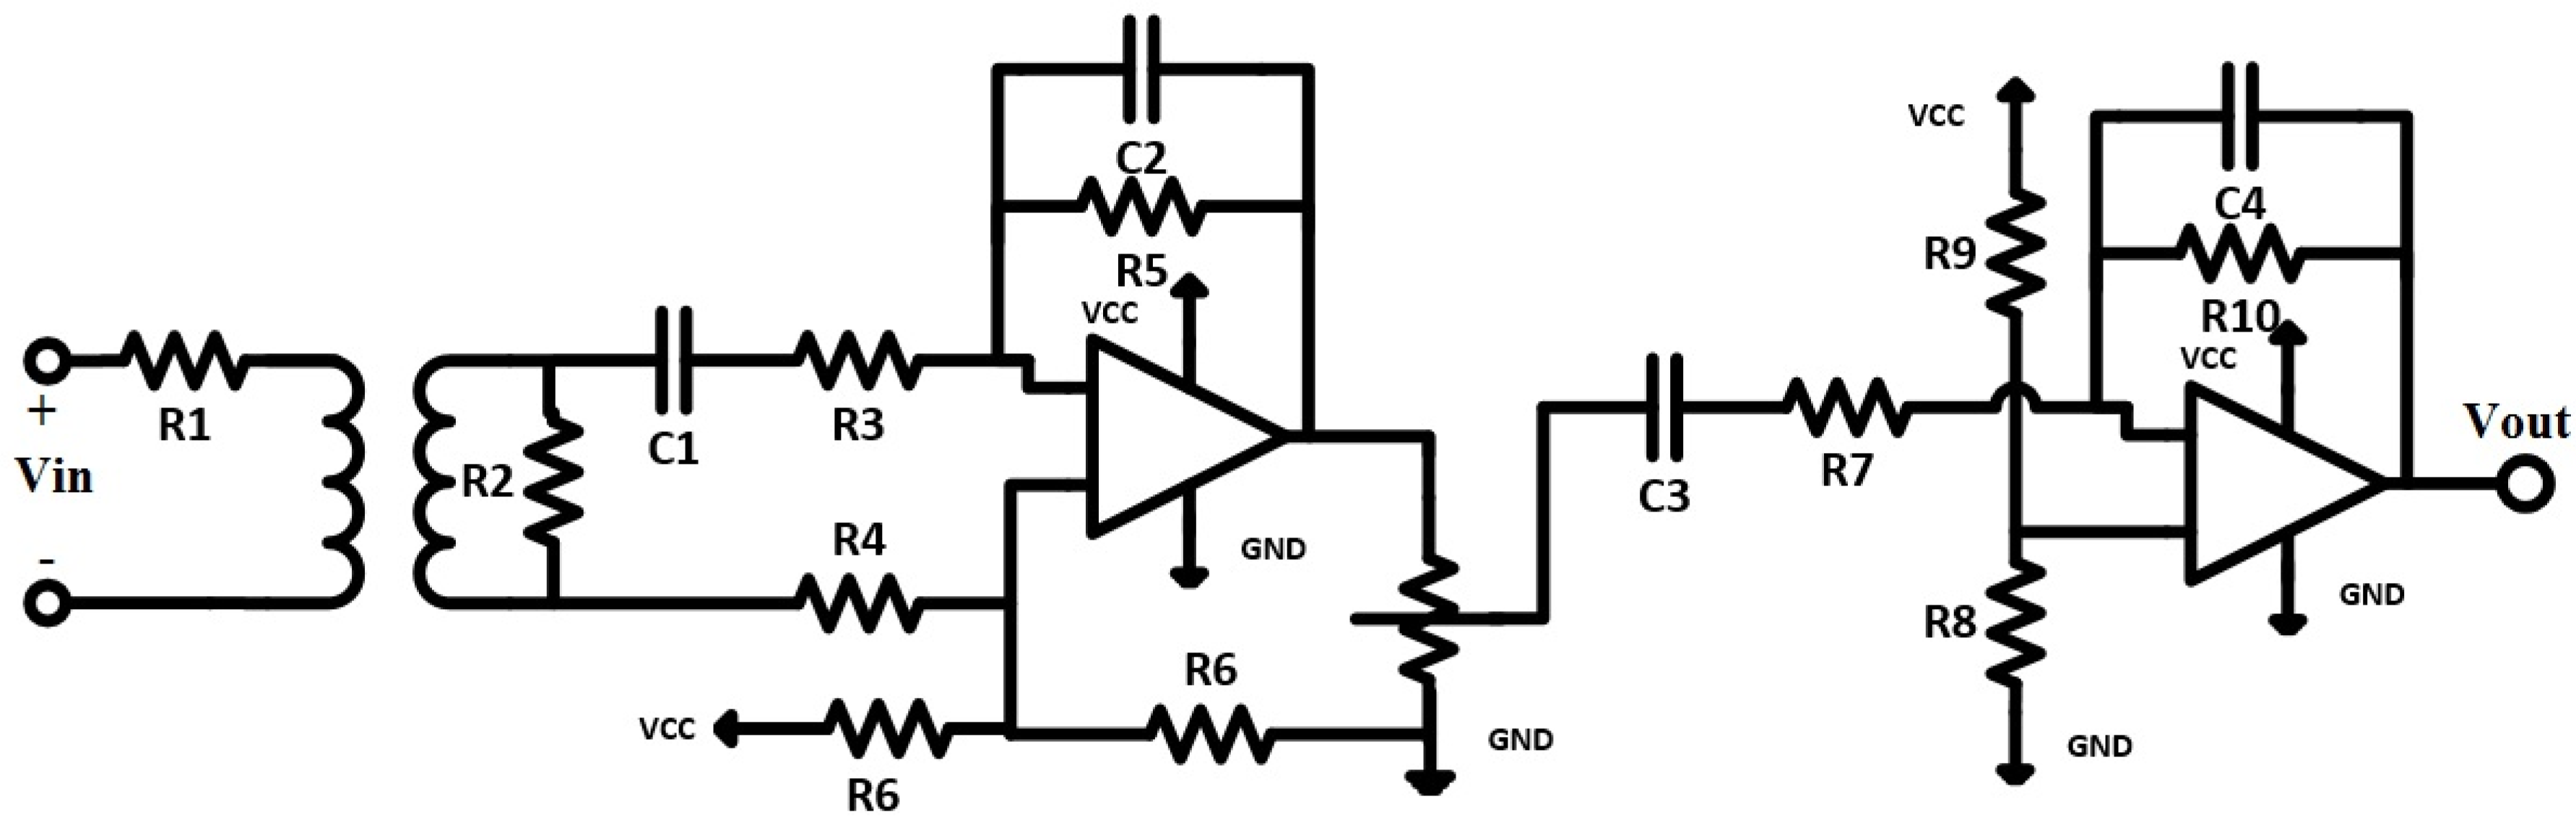
3.1.1. Voltage Sensor Unit
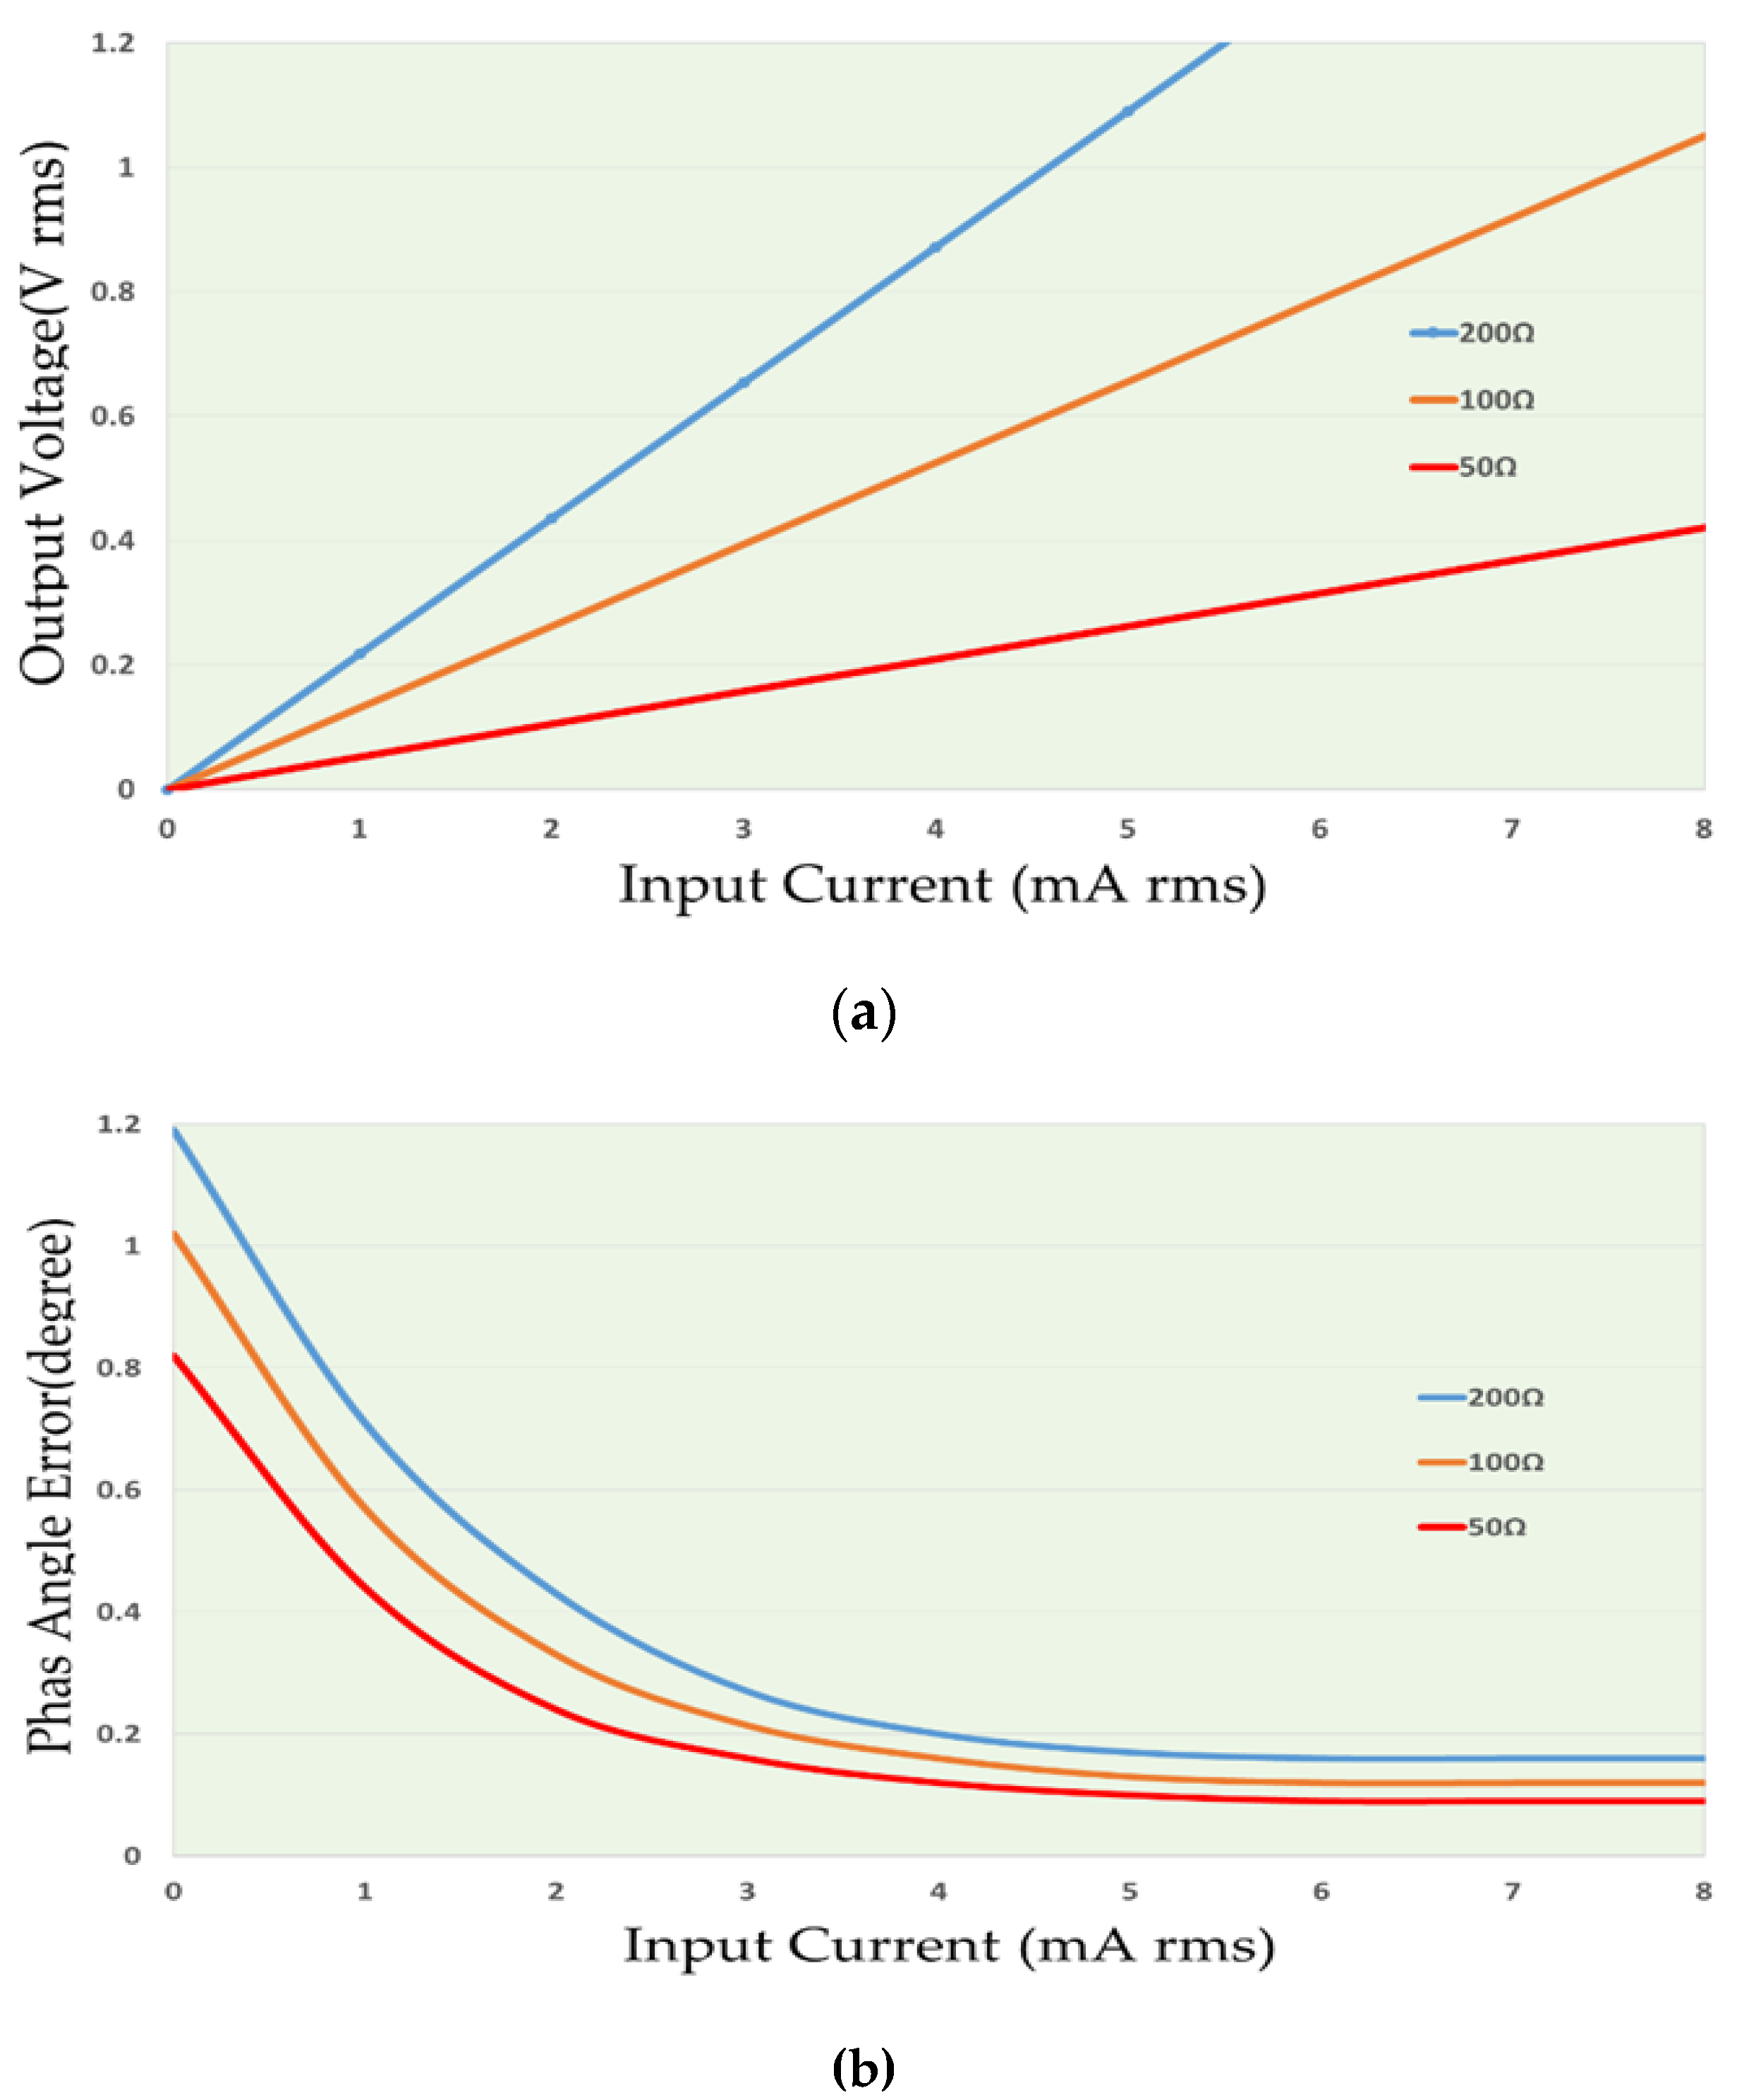
- A ZMPT101B current transformer (Interplus Industry Co. Ltd., Shenzhen, China) [15] with low impedance load (R2). The ZMPT101B is a small size current transformer with good consistency and isolation for voltage measurements. The main properties of the transformer are explained in Table 2 [15] and the output characteristics are shown in Figure 4. Two curves show in the Figure 4 depended to the input resistance of ZMPT101B, Figure 4a shows the relation between the RMS input current and RMS output voltage and Figure 4b shows the relation between the RMS input current and phase angle error of the output signal (the input resistance R1 is connected in series with the transformer).
- Two stages of bandpass-amplifier are based on LM358 IC [16]. This chip consists of two operation amplifiers with the properties of:
- Low power consumption
- A wide single power supply (3 V to 32 V)
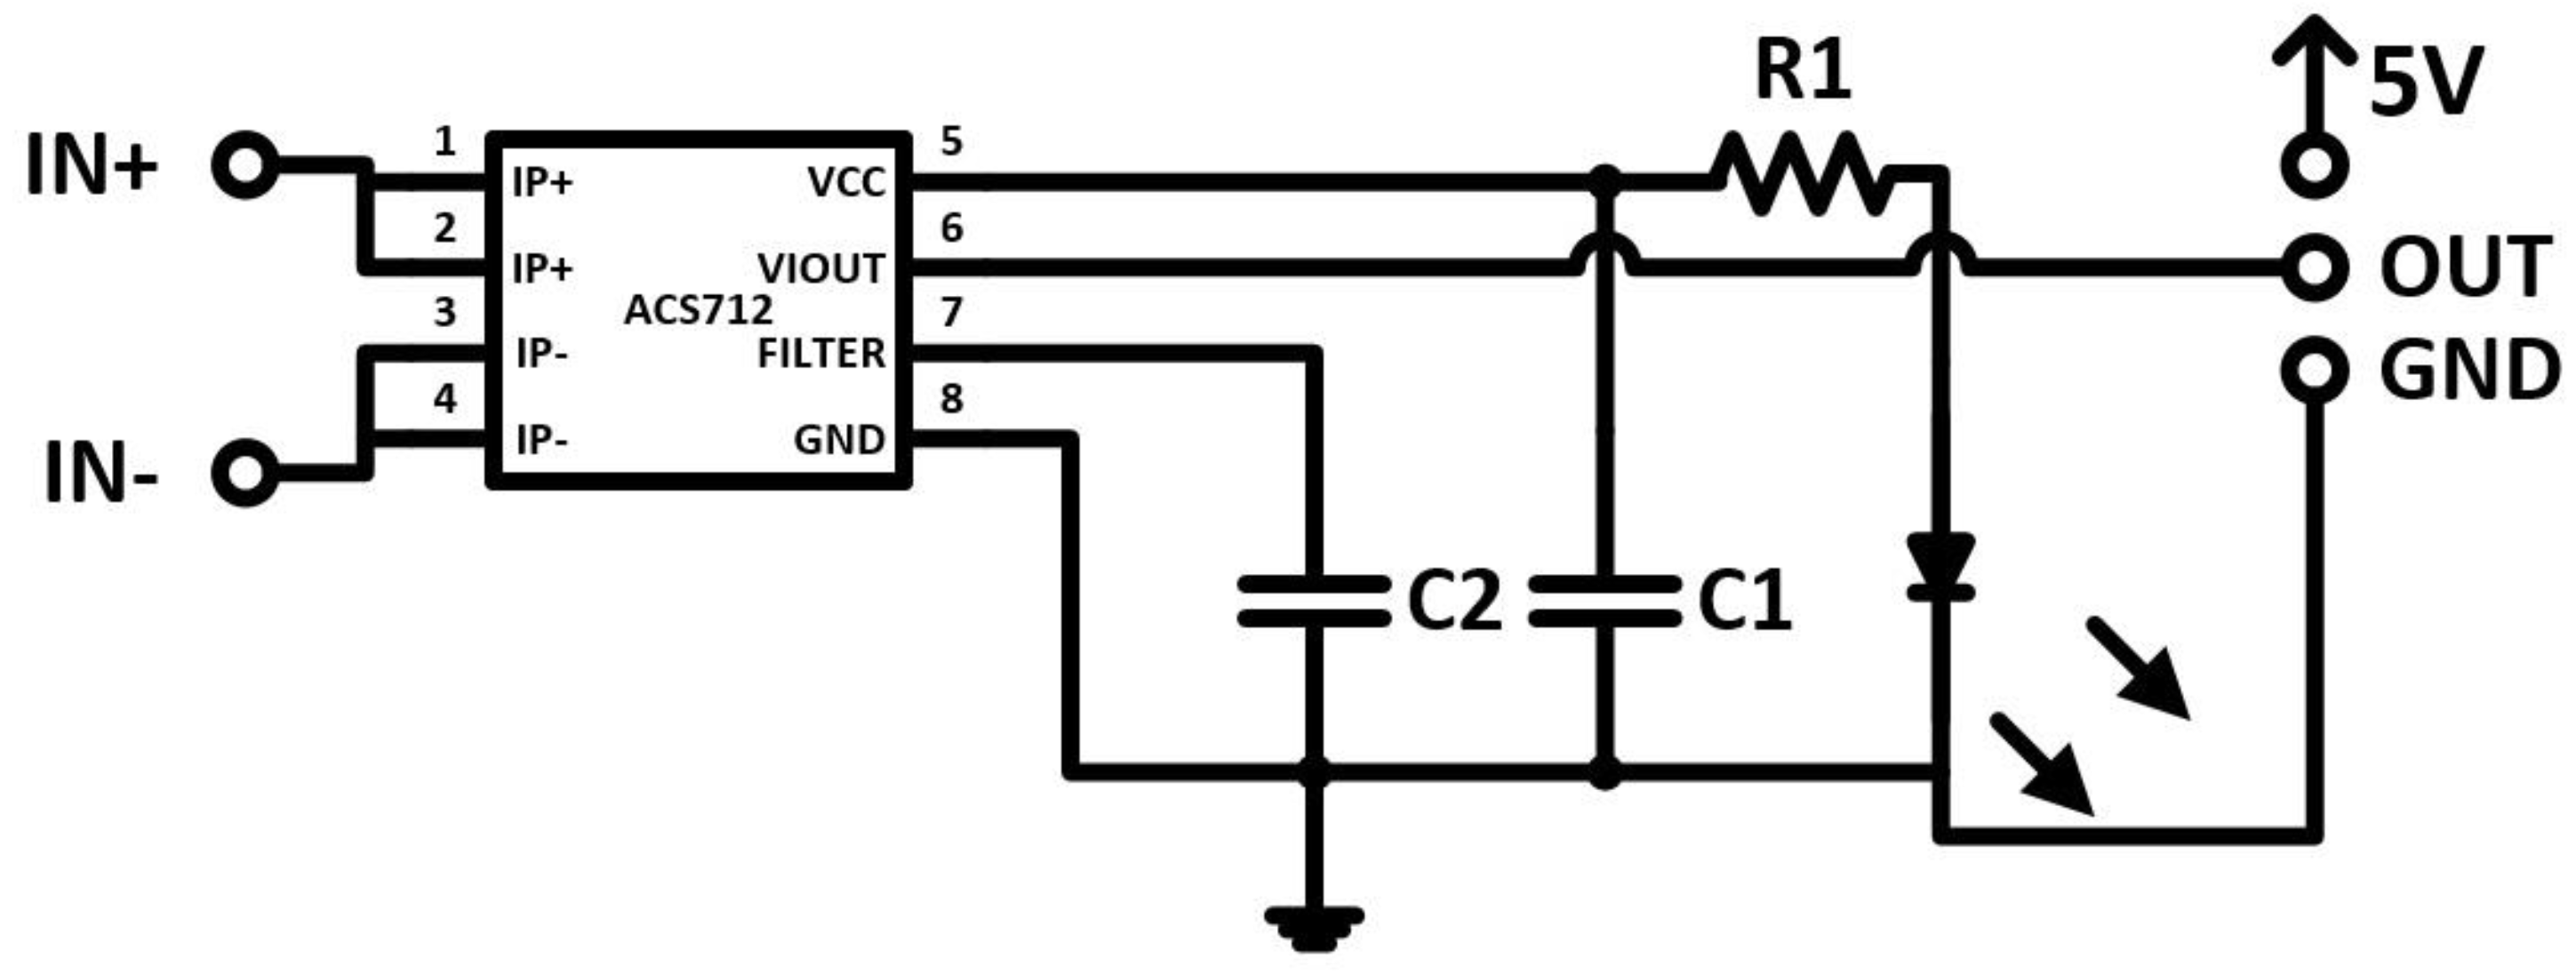
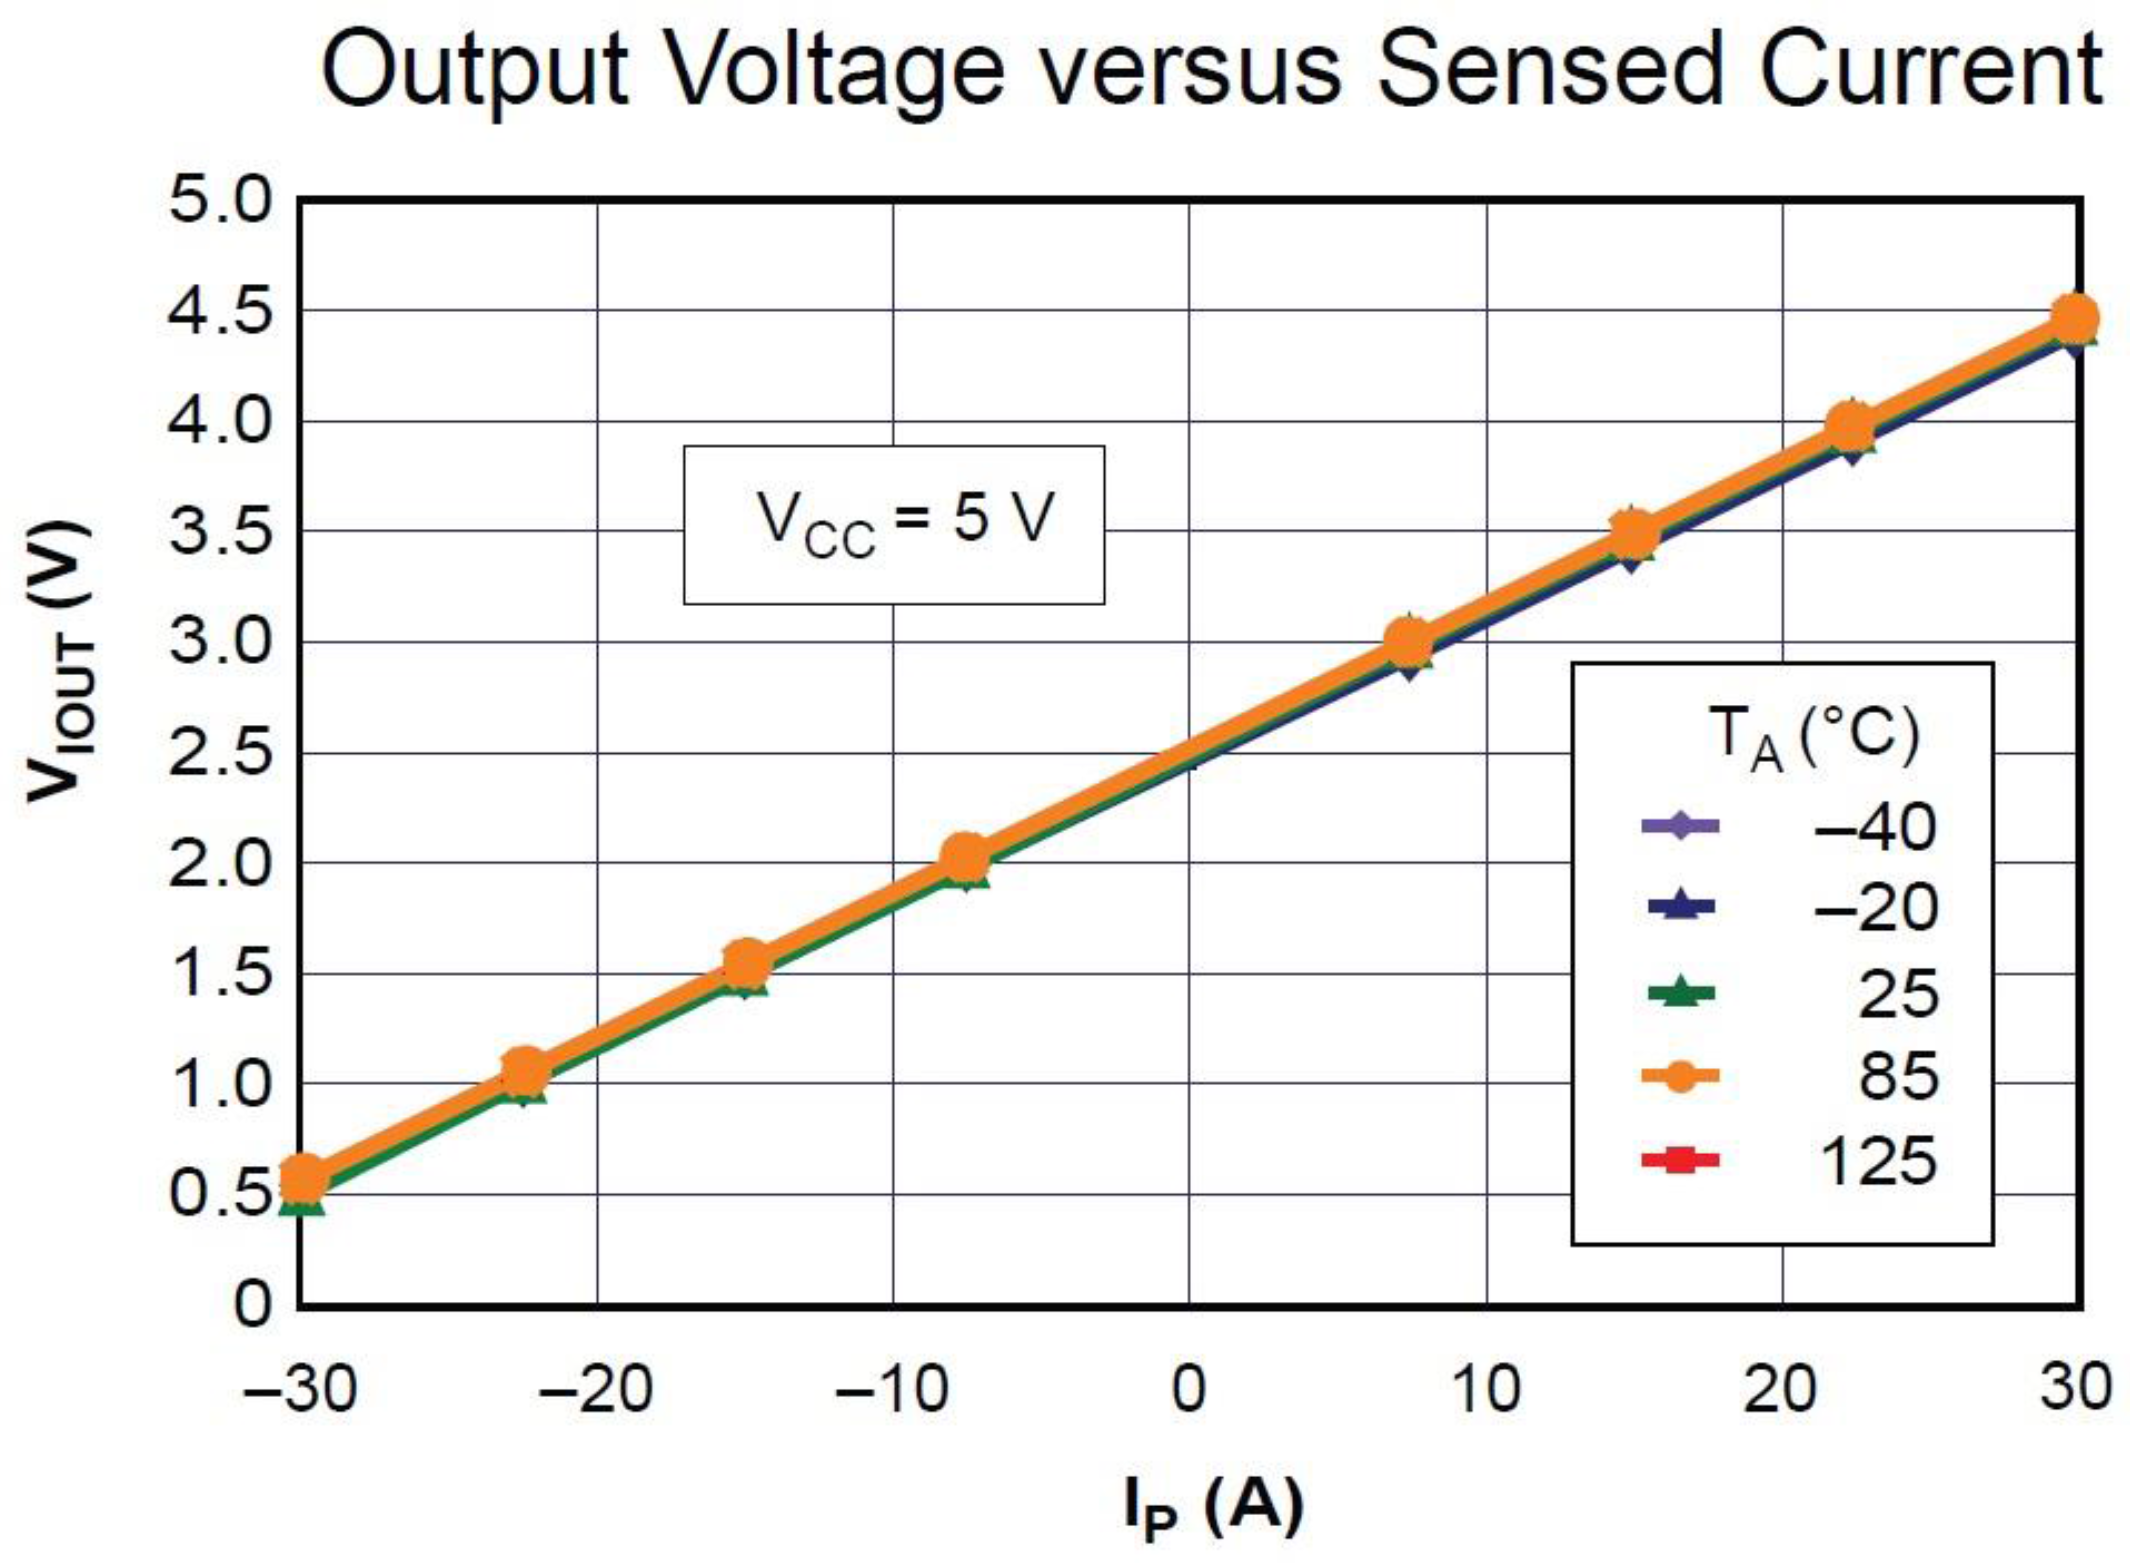
3.1.2. Current Sensor Unit
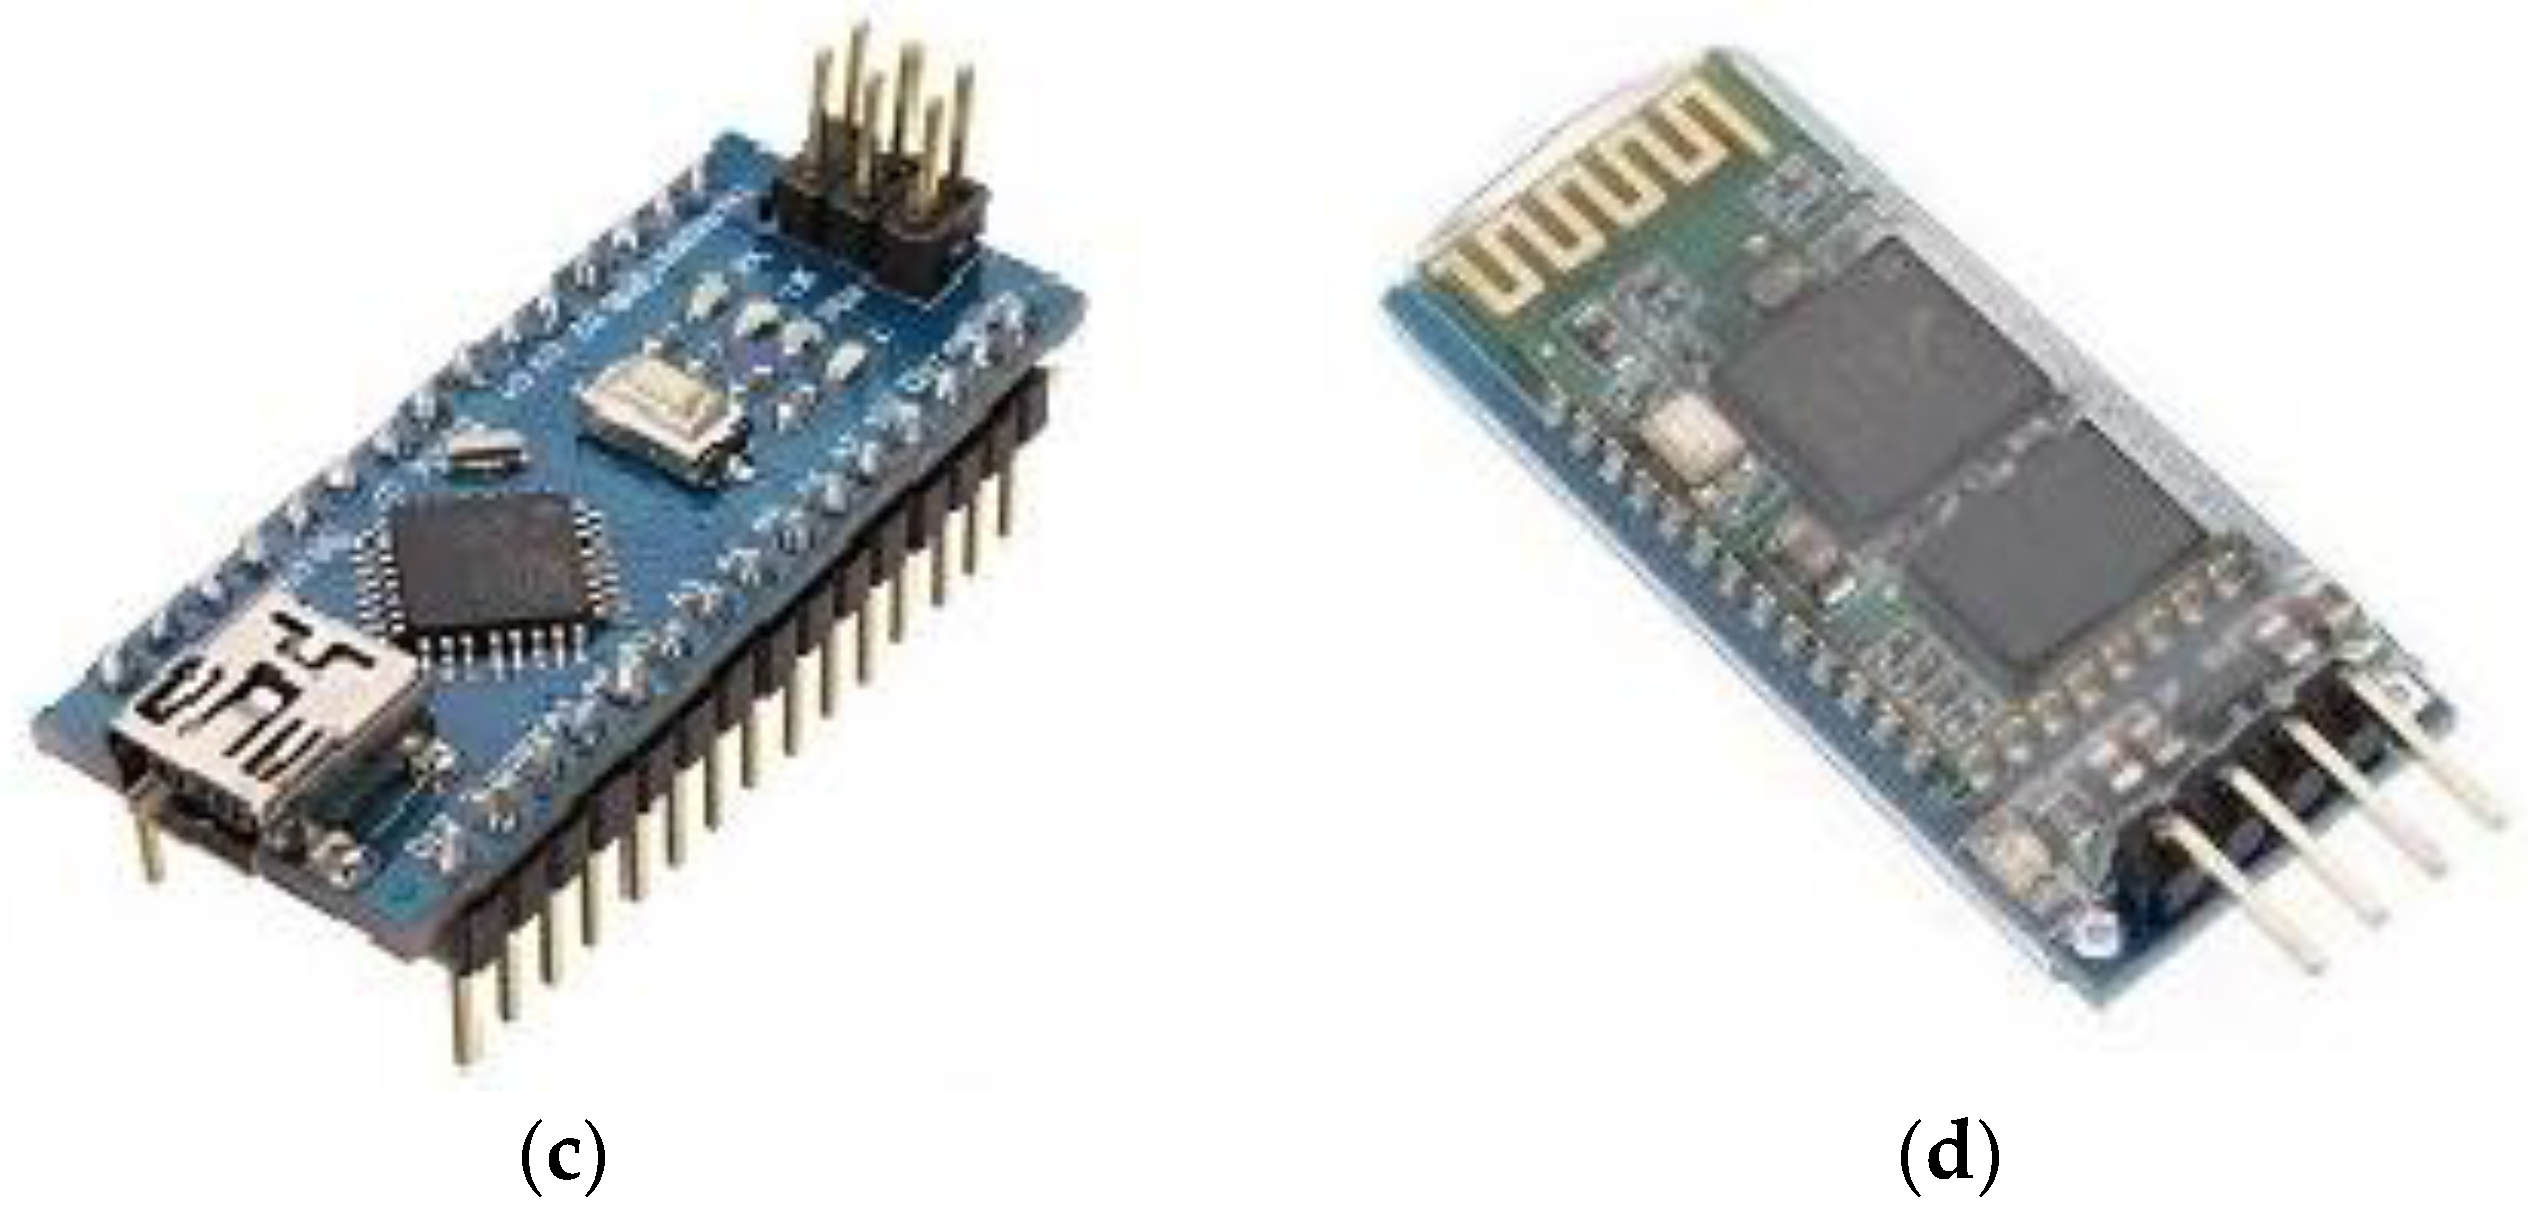
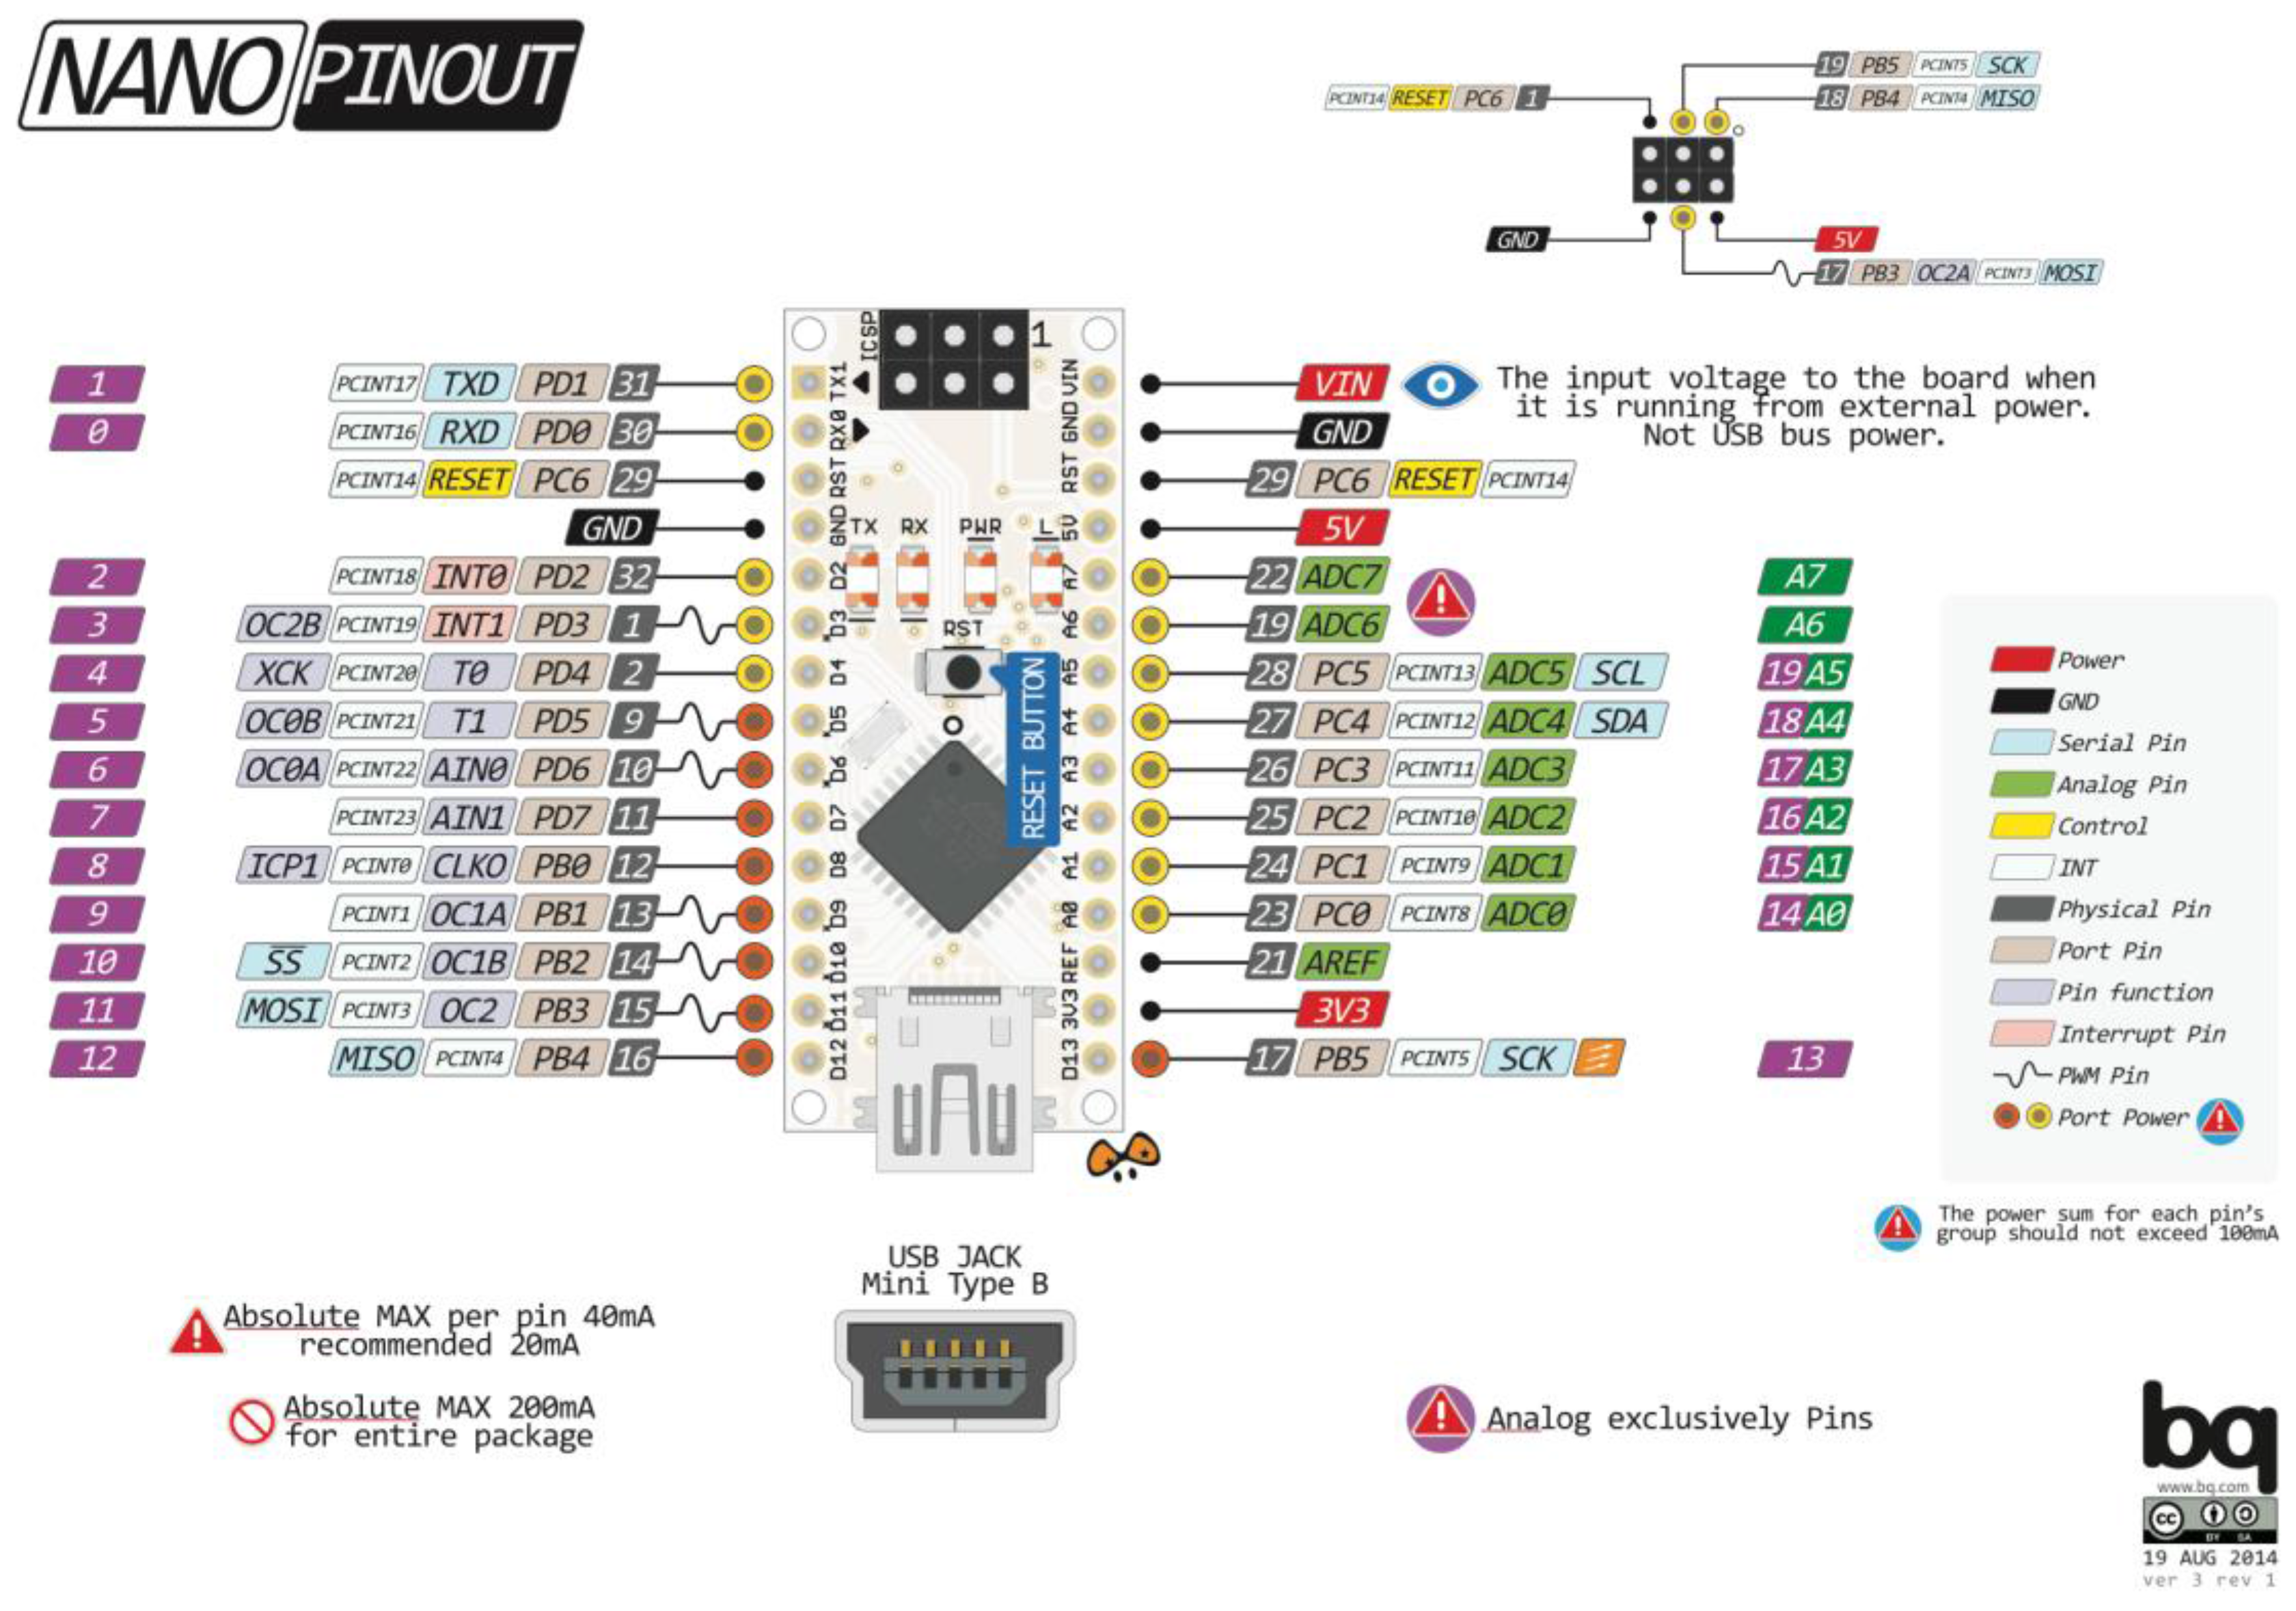
3.1.3. The Microcontroller
3.1.4. Wireless Communication
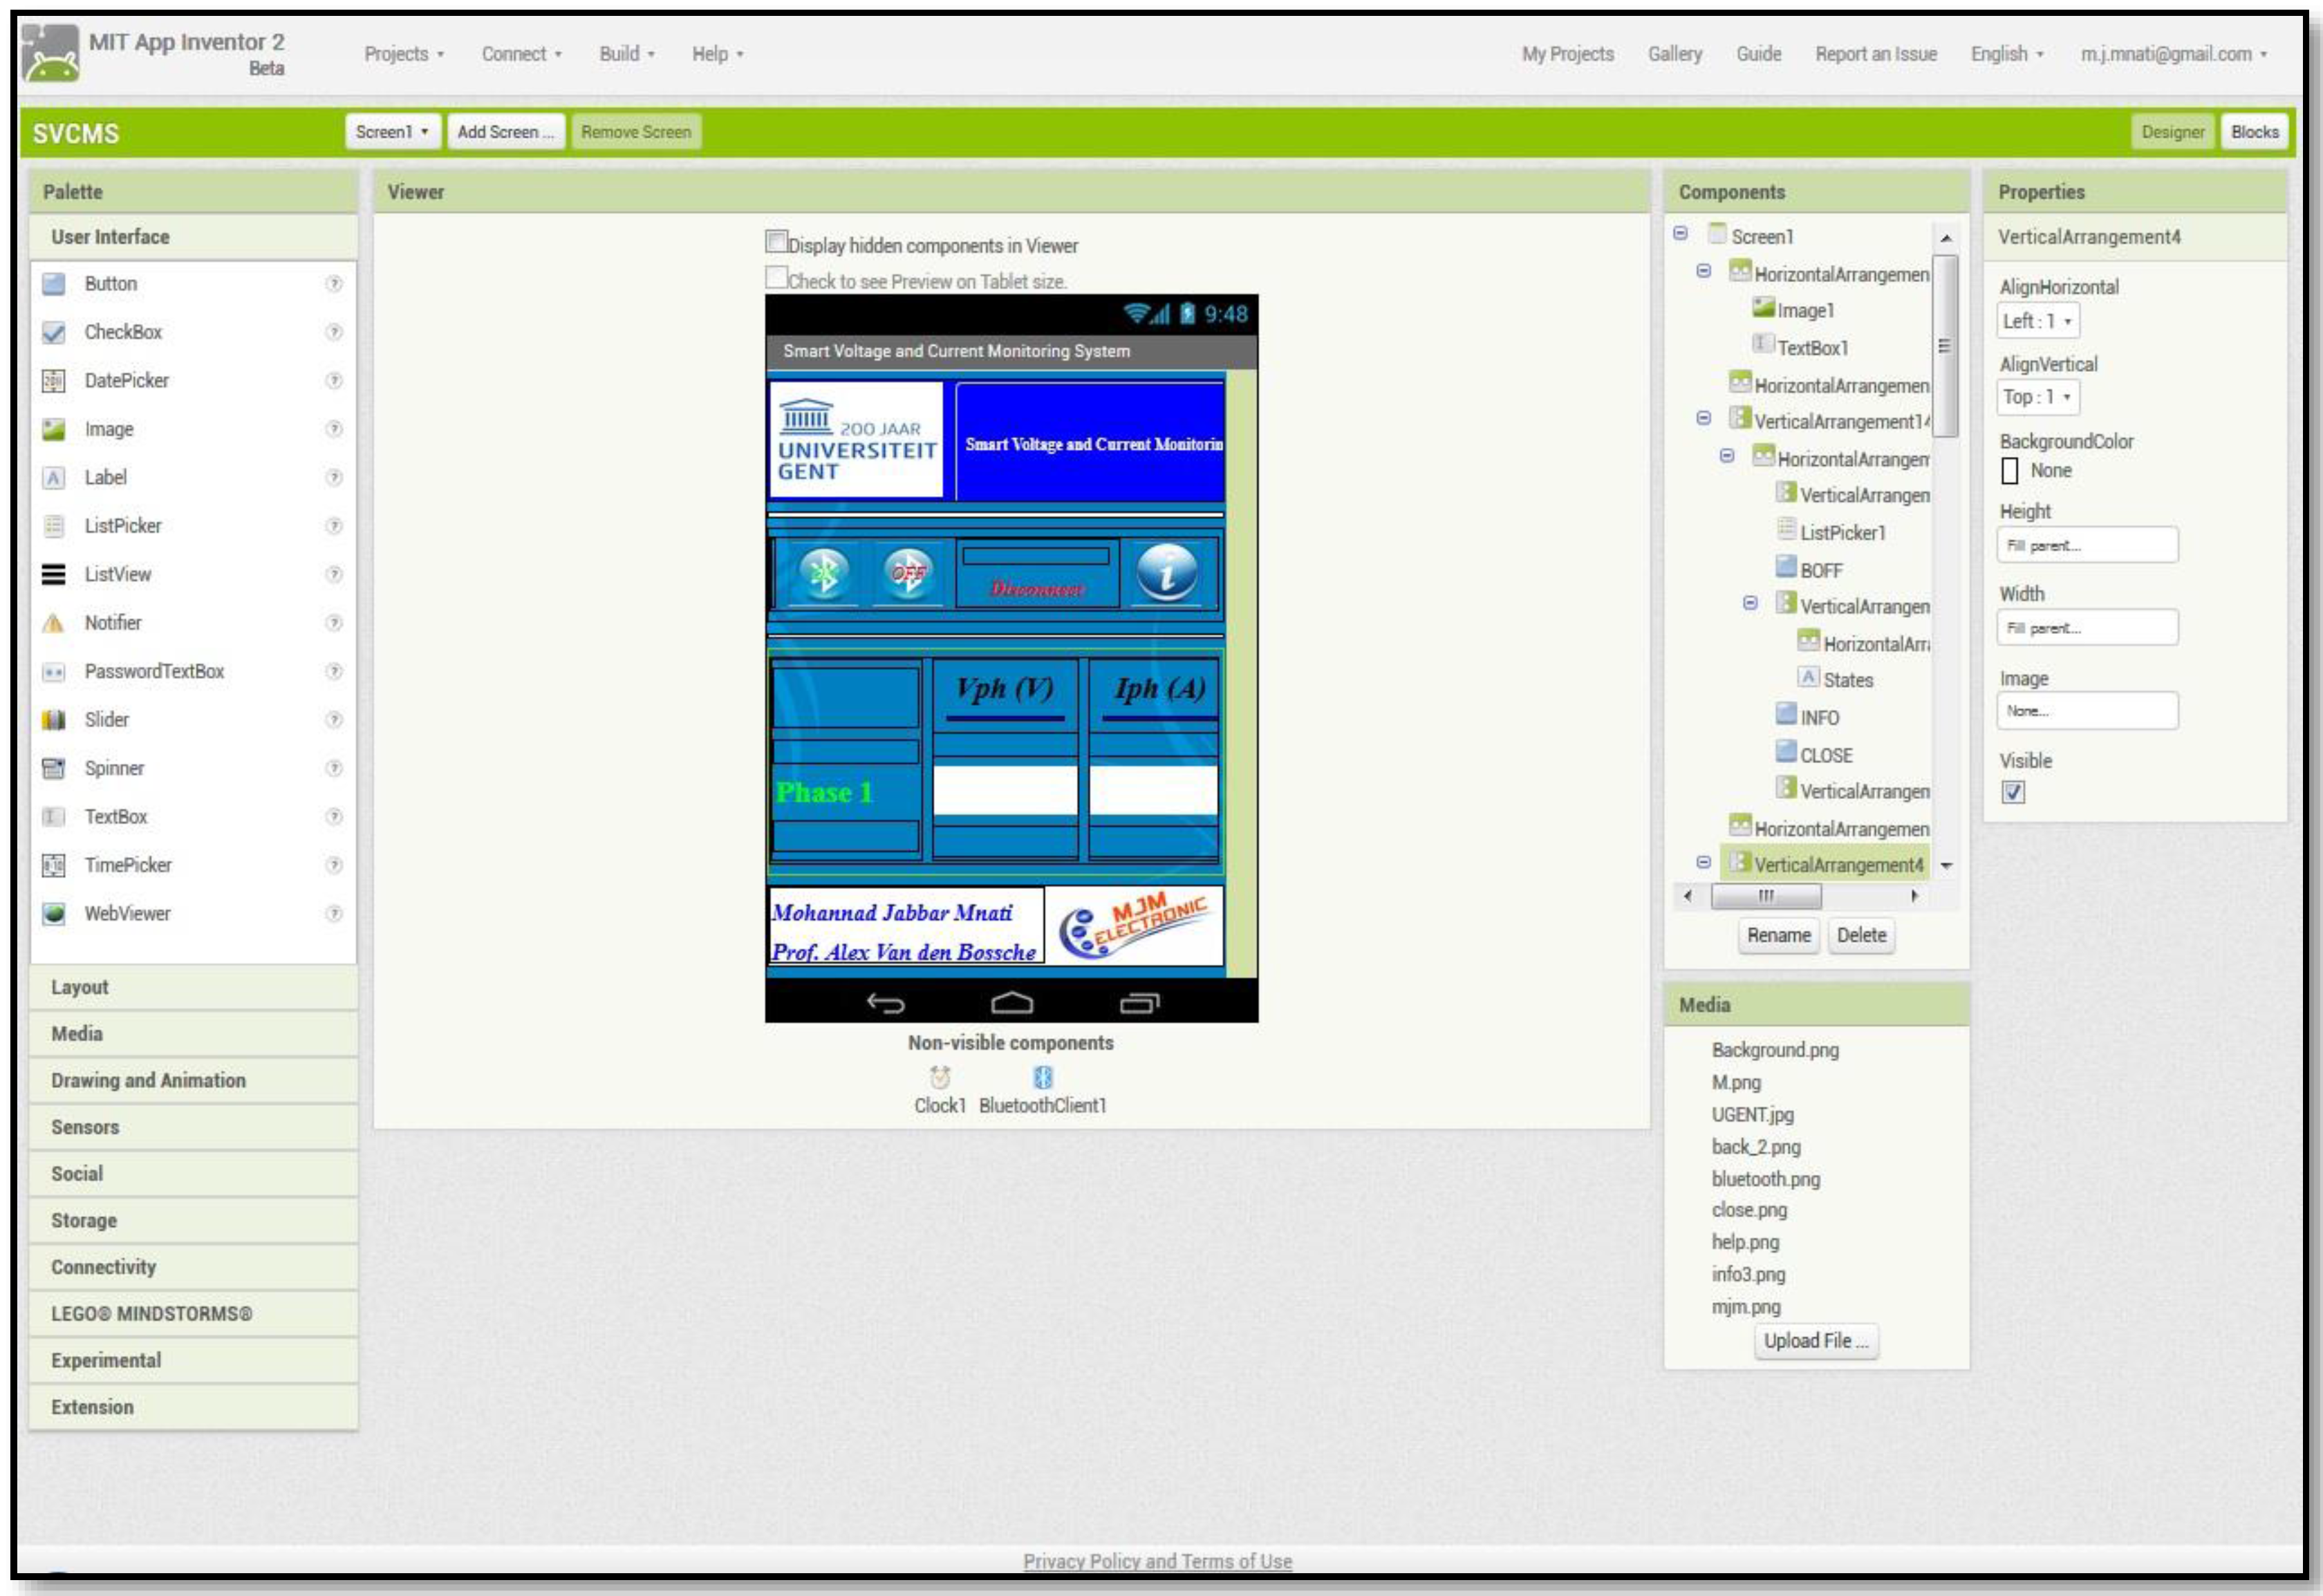
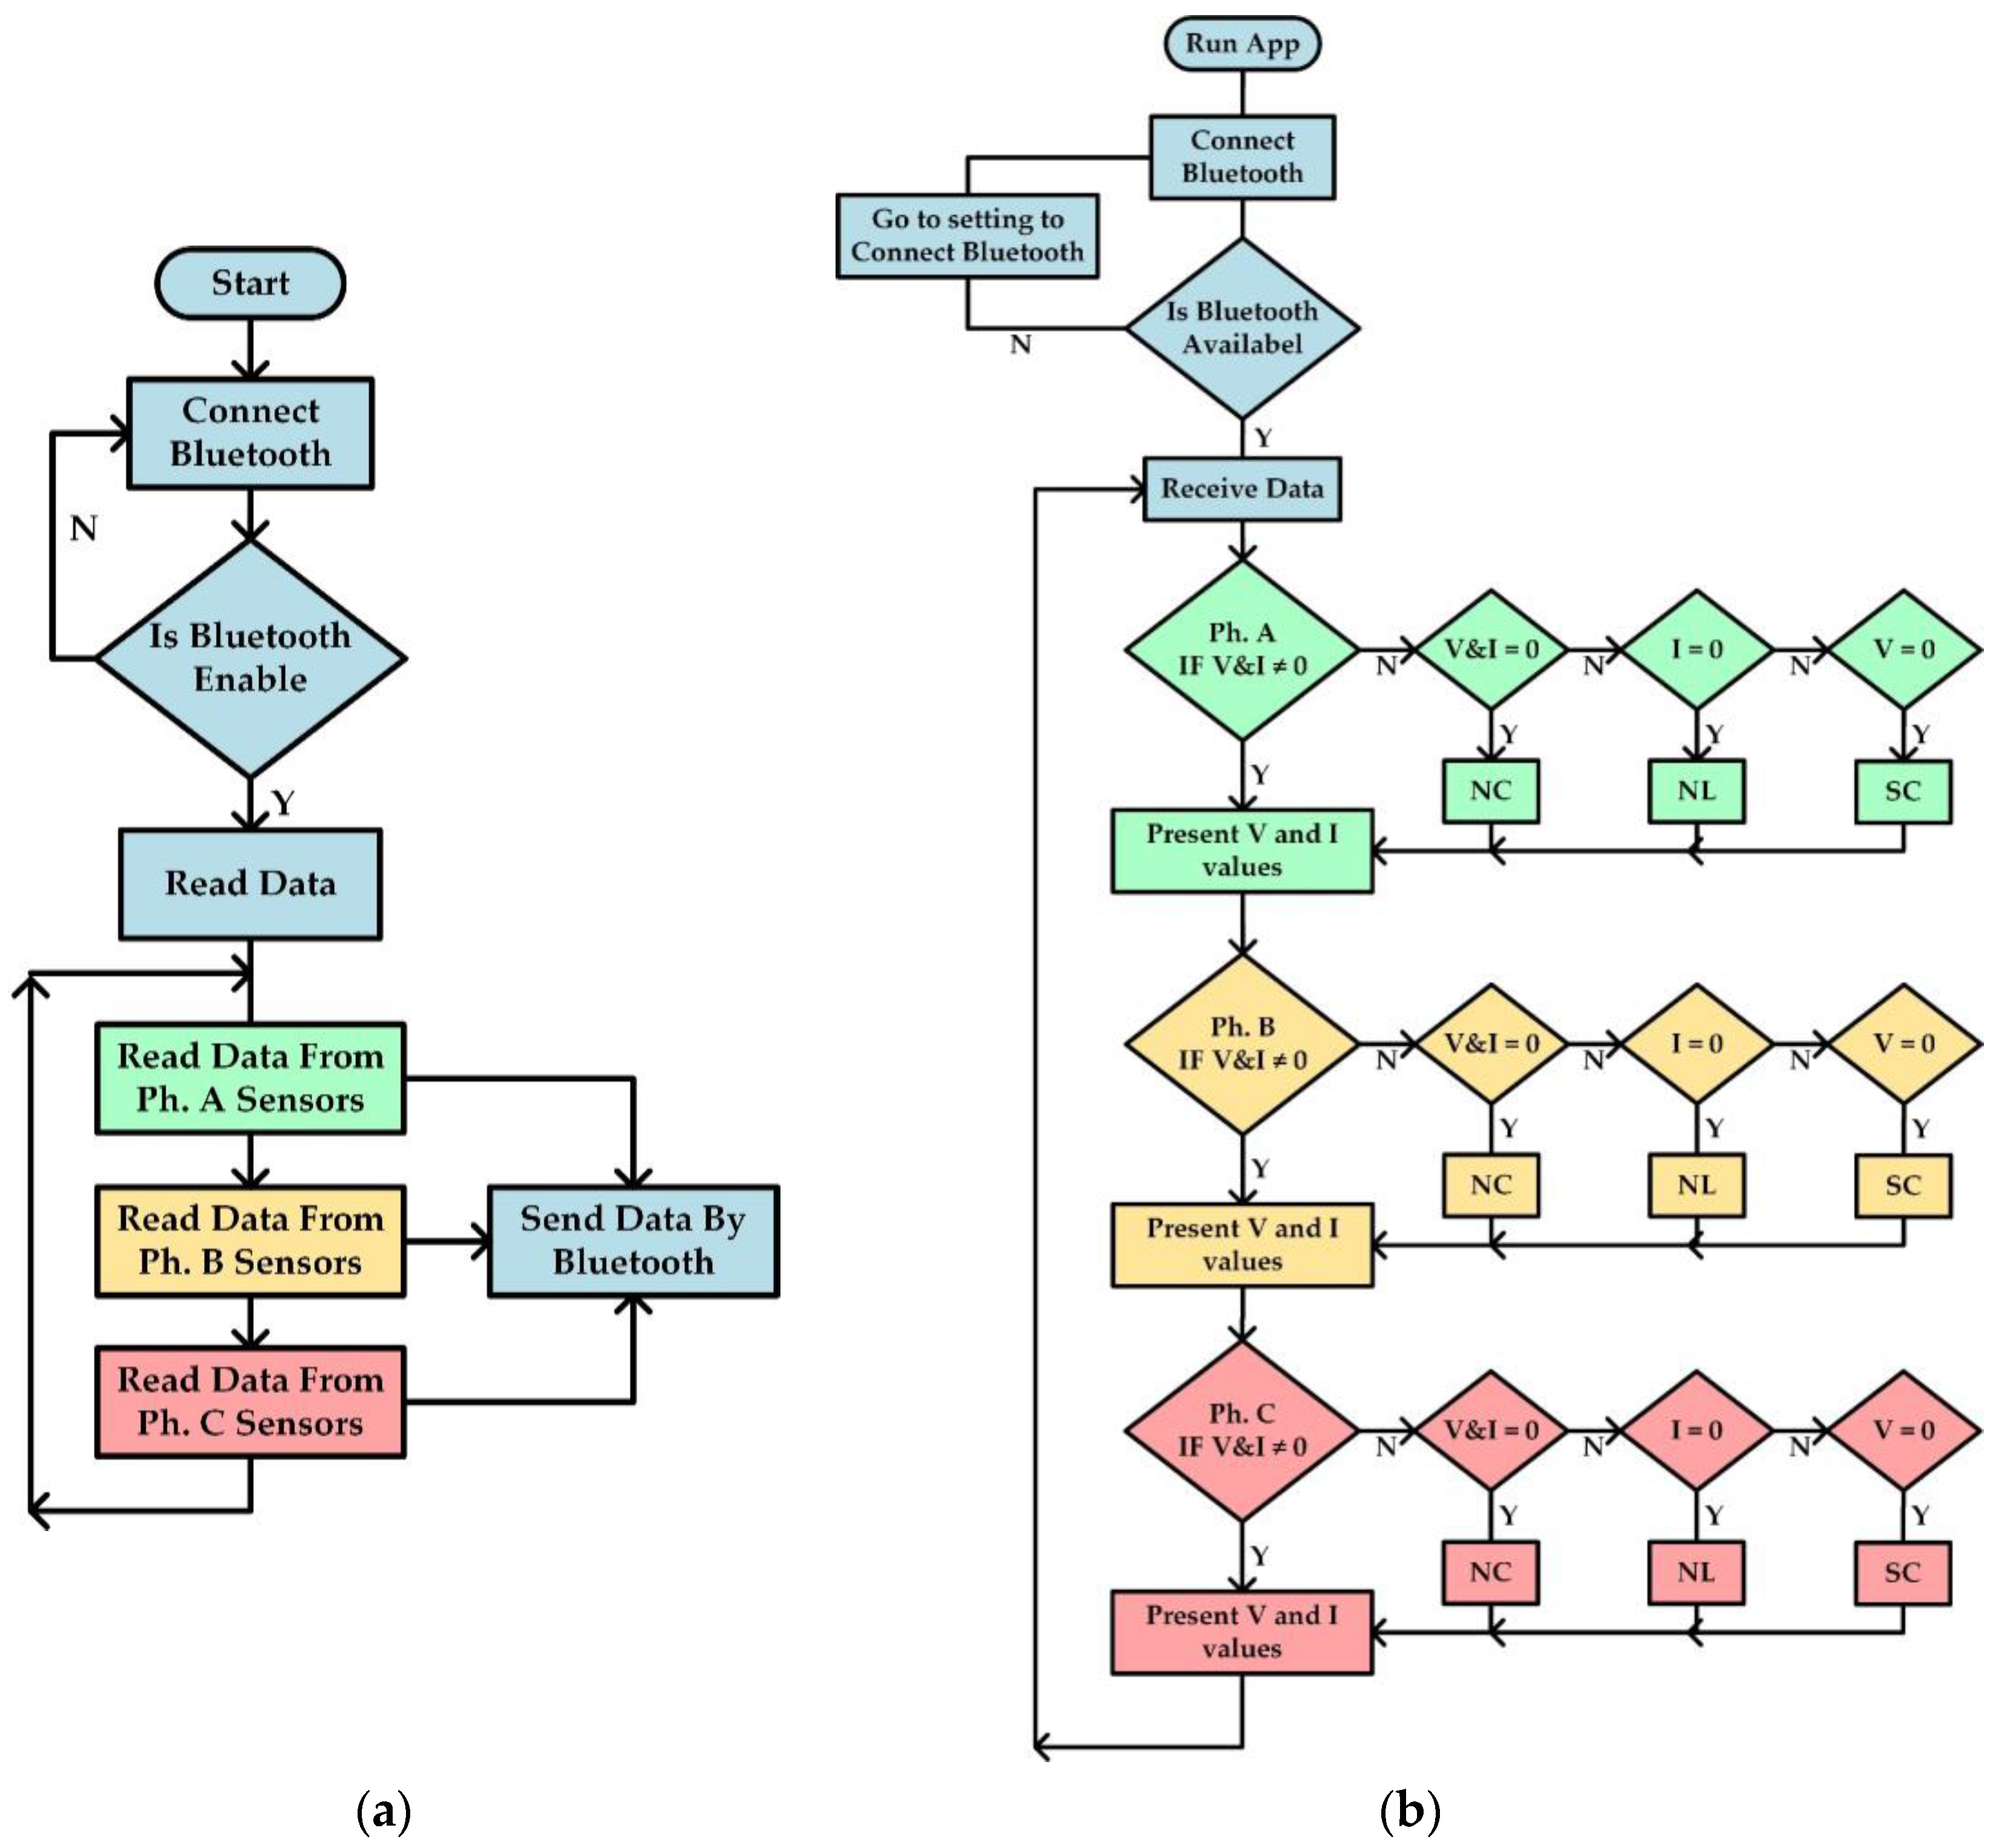
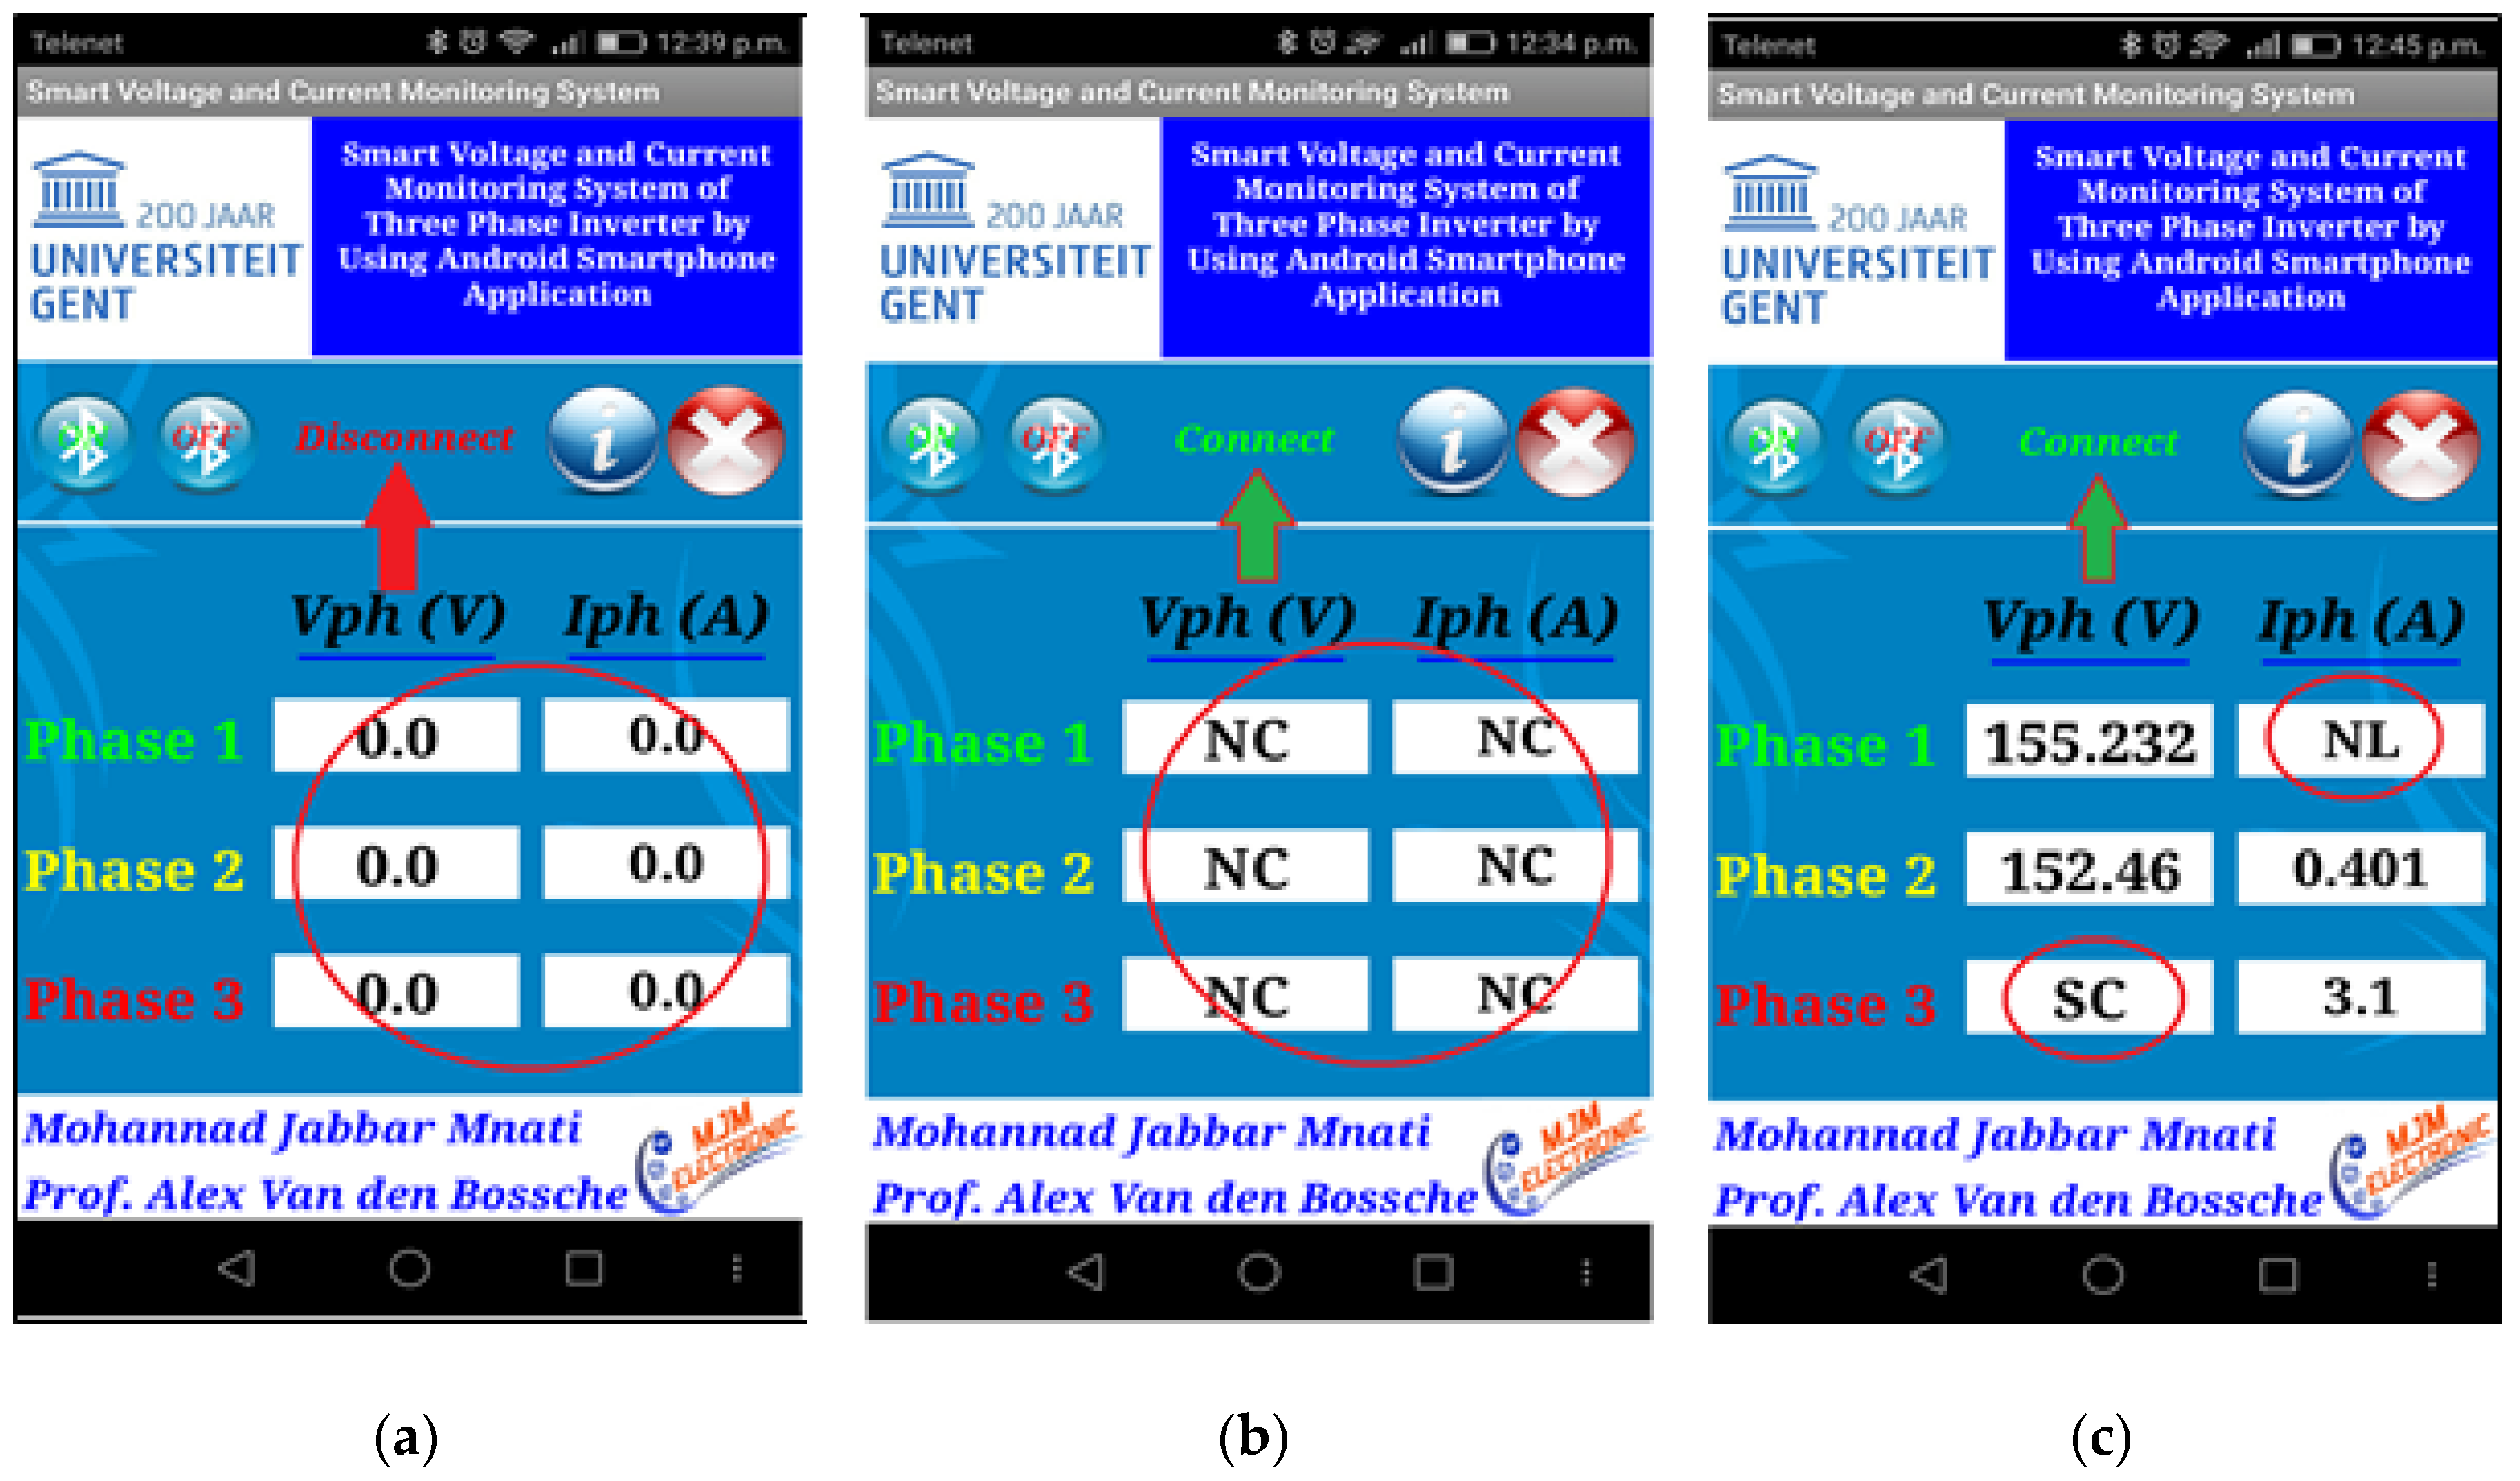
3.2. Monitoring System (Software Design)
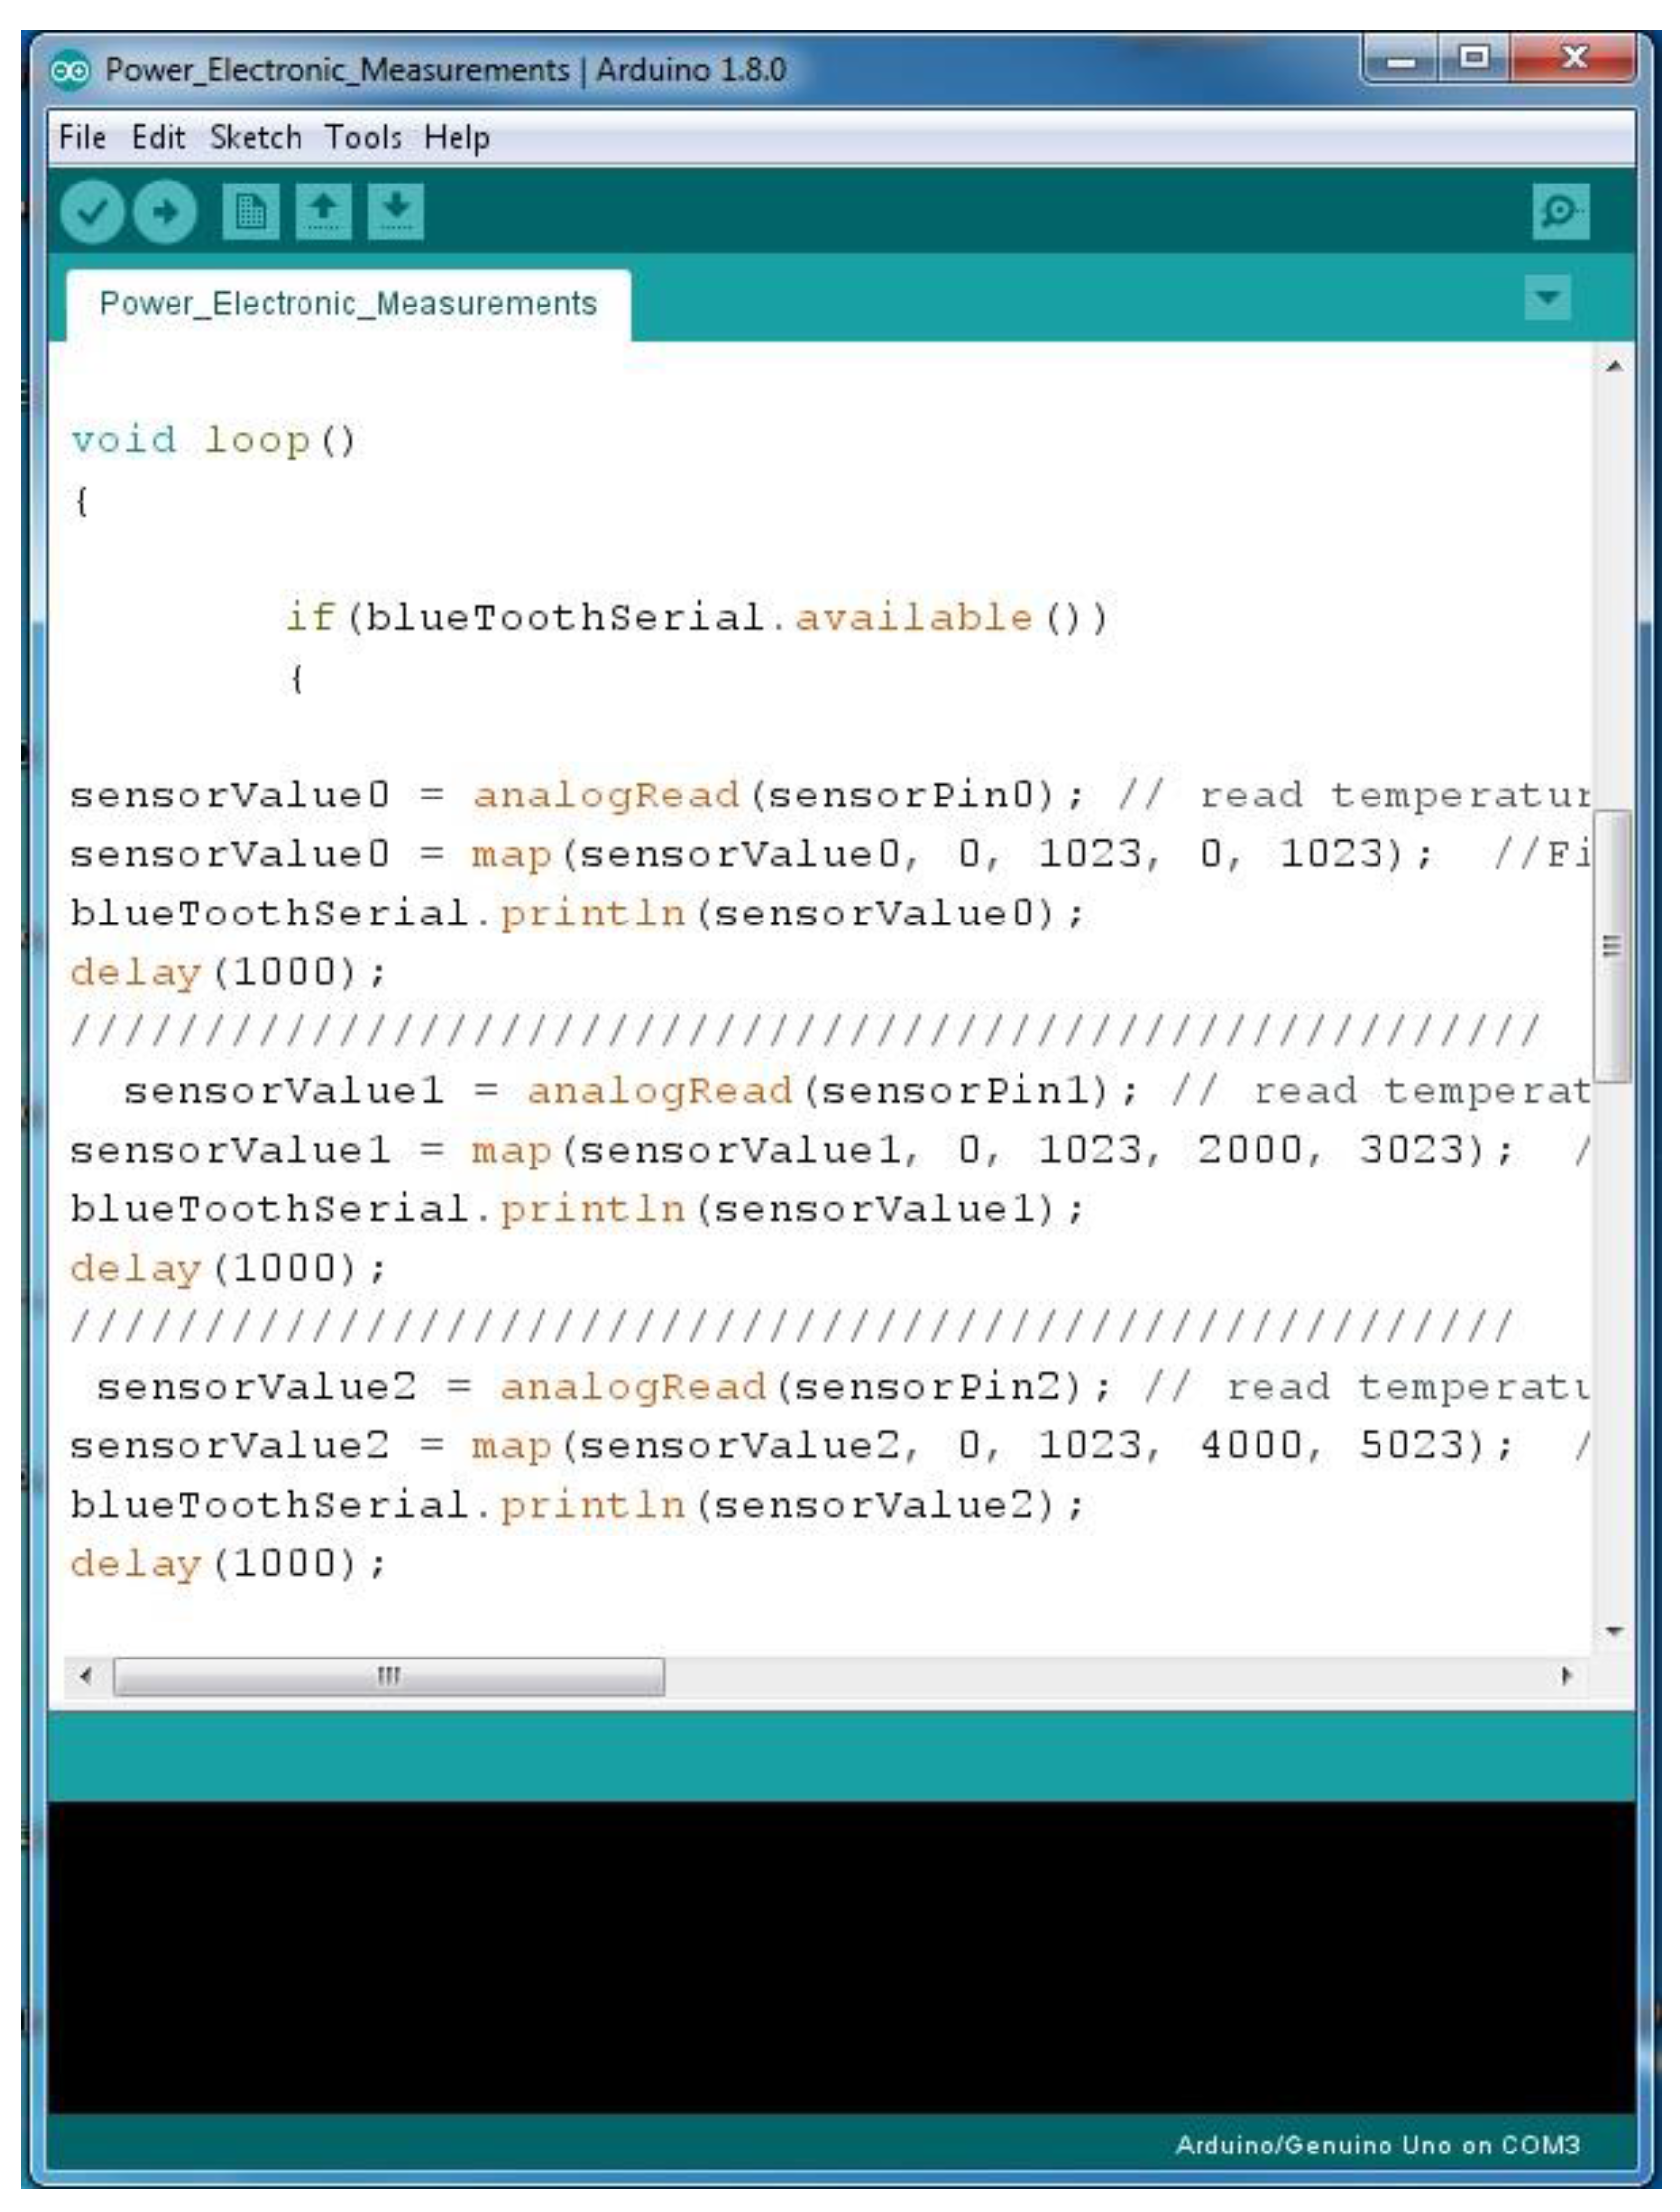
3.2.1. Microcontroller Program
3.2.2. Monitoring Program
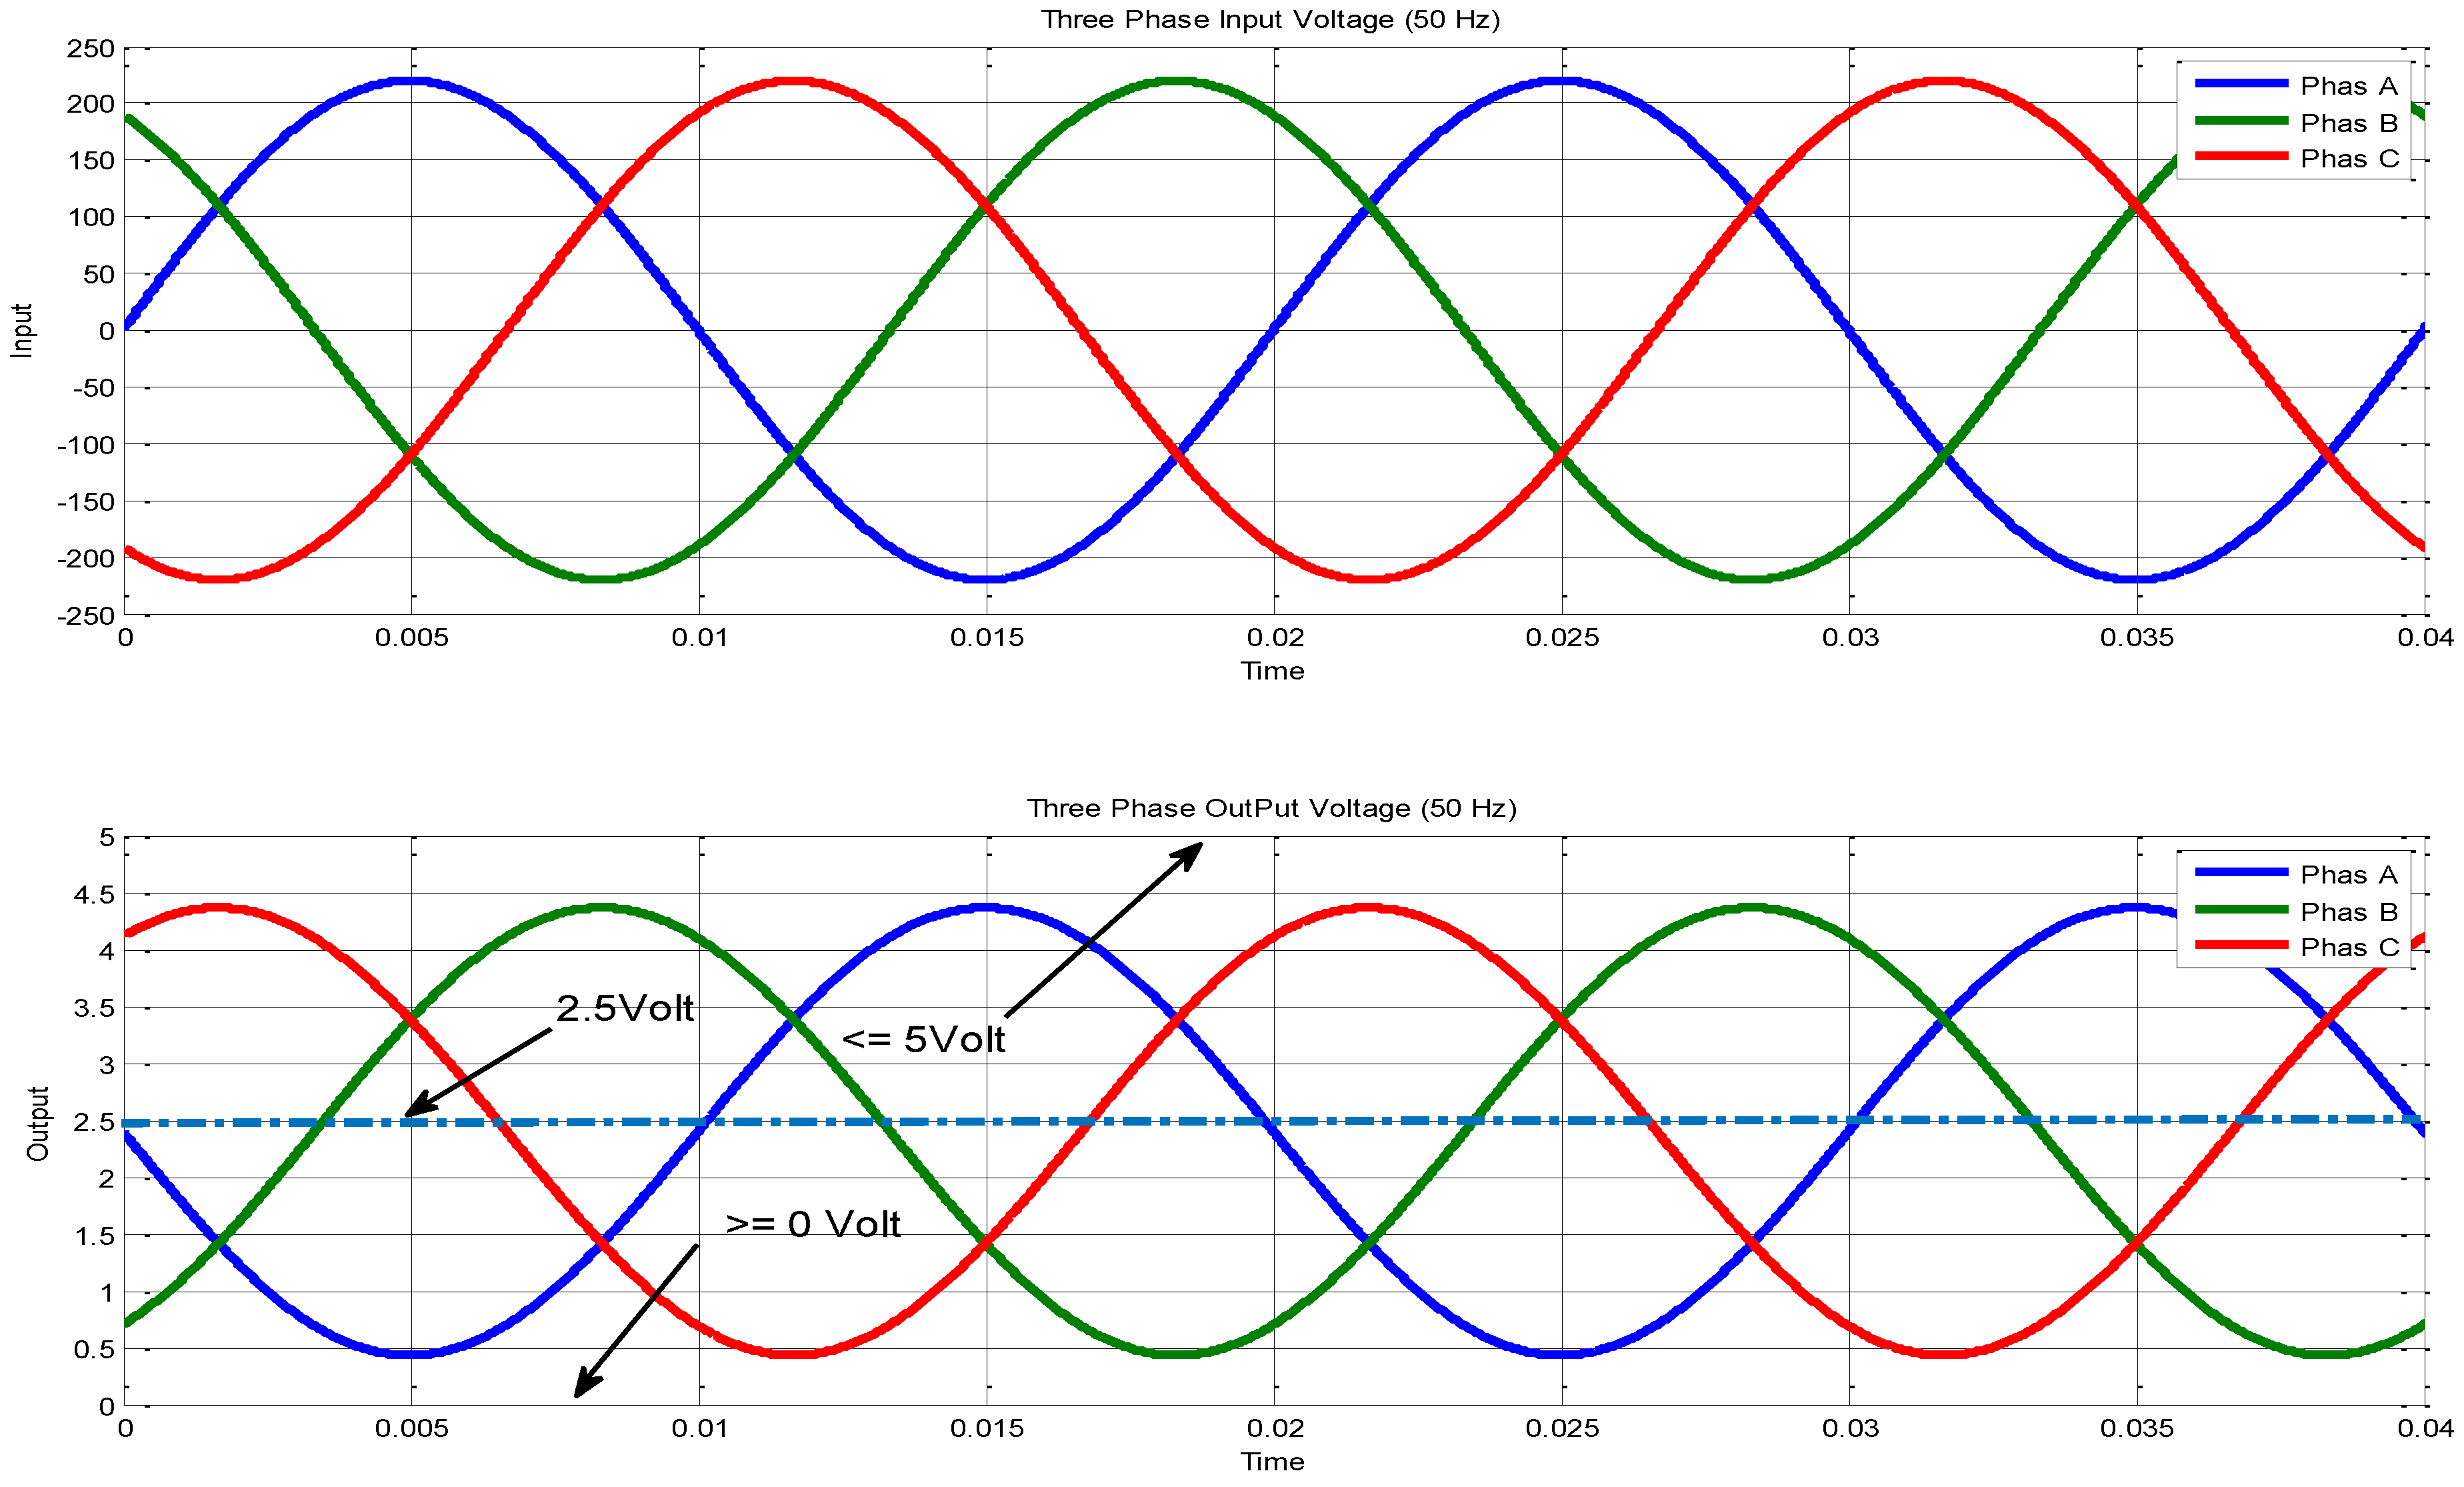
4. Discussion and Results
5. Conclusions and Future Work
Acknowledgments
Author Contributions
Conflicts of Interest
References
- Alsibai, M.H.; Siang, H.M. A smart driver monitoring system using android application and embedded system. In Proceedings of the 5th IEEE International Conference on Control Systems, Computing and Engineering (ICCSCE 2015), Penang, Malaysia, 27–29 November 2015; pp. 242–247. [Google Scholar]
- Salamone, F.; Belussi, L.; Danza, L.; Ghellere, M.; Meroni, I. An open source “smart lamp” for the optimization of plant systems and thermal comfort of offices. Sensors 2016, 16, 338. [Google Scholar] [CrossRef] [PubMed]
- González, F.C.; Osiris, O.; Villegas, V.; Torres Ramírez, D.E.; Guadalupe, V.; Sánchez, C.; Ochoa Domínguez, H. Smart Multi-Level Tool for Remote Patient Monitoring Based on a Wireless Sensor Network and Mobile Augmented Reality. Sensors 2014, 14, 17212–17234. [Google Scholar] [CrossRef] [PubMed]
- Aurilio, G.; Gallo, D.; Landi, C.; Luiso, M.; Cigolotti, V.; Graditi, G. Low cost combined voltage and current transducer for Smart Meters. In Proceedings of the 2014 IEEE International Instrumentation and Measurement Technology Conference, Montevideo, Uruguay, 12–15 May 2014; pp. 1459–1464. [Google Scholar]
- Gill, S.P.S. Smart Power Monitoring Utility System Using Wireless Sensor Networks. In Proceedings of the 2012 Sixth International Conference on Sensing Technology, Kolkata, India, 18–21 December 2012; pp. 5–114. [Google Scholar]
- Rahman, M.; Alfaki, A.; Shafiullah, G.M.; Shoeb, A.; Jamal, T. Demand Response Opportunities in Residential Sector Incorporated with Smart Load Monitoring System. In Proceedings of the 2016 IEEE Innovative Smart Grid Technologies-Asia, Melbourne, Australia, 28 November–1 December 2016. [Google Scholar]
- Calderón, A.J.; González, I.; Calderón, M.; Segura, F.; Andújar, J.M. A new, scalable and low cost multi-channel monitoring system for polymer electrolyte fuel cells. Sensors 2016, 16, 349. [Google Scholar] [CrossRef] [PubMed]
- De Santis, D.; Giampetruzzi, D.A.; Abbatantuono, G.; La, M.; Fellow, S.; Bari, P. Smart Metering for Low Voltage Electrical Distribution System using Arduino Due. In Proceedings of the 2016 IEEE Workshop on Environmental, Energy, and Structural Monitoring Systems, Trento, Italy, 13–14 June 2016; pp. 1–6. [Google Scholar]
- Tamkittikhun, N.; Tantidham, T.; Intakot, P. AC power meter design based on Arduino: Multichannel single-phase approach. In Proceedings of the 19th International Computer Science and Engineering Conference (ICSEC): Hybrid Cloud Computing: A New Approach for Big Data Era, Chiang Mai, Thailand, 23–26 November 2015. [Google Scholar]
- David, N.; Anozie, F.N.; Ebuka, F.O.; Nzenweaku, S.A. Design of an Arduino Based Wireless. Int. J. Sci. Eng. Res. 2016, 7, 466–469. [Google Scholar]
- Chao, C.T.; Wang, C.W.; Chiou, J.S.; Wang, C.J. An arduino-based resonant cradle design with infant cries recognition. Sensors 2015, 15, 18934–18949. [Google Scholar] [CrossRef] [PubMed]
- Bitella, G.; Rossi, R.; Bochicchio, R.; Perniola, M.; Amato, M. A novel low-cost open-hardware platform for monitoring soil water content and multiple soil-air-vegetation parameters. Sensors 2014, 14, 19639–19659. [Google Scholar] [CrossRef] [PubMed]
- Kebir, S.T.; Bouhedda, M.; Mekaoui, S.; Guesmi, M.; Douakh, A. Gesture Control of Mobile Robot Based Arduino. In Proceedings of the 2016 8th International Conference on Modelling, Identification and Control, Algiers, Algeria, 15–17 November 2016; pp. 1081–1085. [Google Scholar]
- Wiranto, G.; Hermida, I.D.P.; Fatah, A. Waslaluddin, Design and realisation of a turbidimeter using TSL250 photodetector and Arduino microcontroller. In Proceedings of the 2016 IEEE International Conference on Semiconductor Electronics, Kuala Lumpur, Malaysia, 17–19 August 2016; pp. 324–327. [Google Scholar]
- ZMPT101B. Available online: http://www.interplus-industry.fr/index.php?option=com_content&view=article&id=52&Itemid=173&lang=en (accessed on 13 March 2017).
- Players, B.; Theaters, H.; Sensors, G.; Magnet, P.; Motor, S.; Scales, W.; Ranges, W.S.; Drain, L.S. LMx58, LMx58x, LM2904, LM2904V Dual Operational Amplifiers PACKAGE IN + IN −; Texas Instruments: Dallas, TX, USA, 2015. [Google Scholar]
- Integrated, F.; Linear, H.E.; Sensor, C. ACS712; Texas Instruments datasheet: Dallas, TX, USA; pp. 1–15.
- HC-Bluetooth. Bluetooth Module—User Instructional Manual; HC Ser. Bluetooth Prod.: Guangzhou, China, 2011; pp. 1–16. [Google Scholar]
- Silva, D.; Henao, J. Use of bluetooth technology for applications of Intelligent Transportation System. In Proceedings of the 2016 8th Euro American Conference on Telematics and Information Systems, Cartagena, Colombia, 28–29 April 2016. [Google Scholar]
- Piromalis, D.; Arvanitis, K. Sensotube: A scalable hardware design architecture for wireless sensors and actuators networks nodes in the agricultural domain. Sensors 2016, 16, 227. [Google Scholar] [CrossRef] [PubMed]
- MIT App Inventor. Available online: http://appinventor.mit.edu/explore/index-2.html (accessed on 13 March 2017).
- Arvindan, A.N.; Keerthika, D. Experimental investigation of remote control via Android smart phone of arduino-based automated irrigation system using moisture sensor. In Proceedings of the 2016 3rd International Conference on Electrical Energy Systems, Chennai, India, 17–19 March 2016; pp. 168–175. [Google Scholar]
- Kos, A.; Tomažič, S.; Umek, A. Evaluation of smartphone inertial sensor performance for cross-platform mobile applications. Sensors 2016, 16, 477. [Google Scholar] [CrossRef] [PubMed]
- El-Latif Mowad, M.A.; Fathy, A.; Hafez, A. Smart Home Automated Control System Using Android Application and Microcontroller. Int. J. Sci. Eng. Res. 2014, 5, 935–939. [Google Scholar]
- Sung, W.T.; Lin, J.S. Design and implementation of a smart LED lighting system using a self adaptive weighted data fusion algorithm. Sensors 2013, 13, 16915–16939. [Google Scholar] [CrossRef]
- Ilippo Di Gennaro, S.F.; Matese, A.; Mancin, M.; Primicerio, J.; Palliotti, A. An open-source and low-cost monitoring system for precision enology. Sensors 2014, 14, 23388–23397. [Google Scholar] [CrossRef] [PubMed]
- Kim, K.; Myung, H. Sensor node for remote monitoring of waterborne disease-causing bacteria. Sensors 2015, 15, 10569–10579. [Google Scholar] [CrossRef] [PubMed]
- Arduino NANO Pinout Diagram. Available online: https://forum.arduino.cc/index.php?topic=147582.0 (accessed on 13 March 2017).
- Al-qaseemi, S.A.; Almulhim, M.F. IoT Architecture Challenges and Issues: Lack of Standardization. In Proceedings of the 2016 Future Technologies Conference, San Francisco, CA, USA, 6–7 December 2016; pp. 731–738. [Google Scholar]
- Kor, A.; Yanovsky, M.; Pattinson, C. SMART-ITEM: IoT-Enabled Smart Living. In Proceedings of the 2016 Future Technologies Conference, San Francisco, CA, USA, 6–7 December 2016; pp. 739–749. [Google Scholar]


| Related Work [Reference] Year | Application | Communication System | Type of Sensors | Microcontroller | Monitoring System |
|---|---|---|---|---|---|
| Gill et al. [5], 2012 | Smart Power Monitoring | ZigBee | Voltage and Current | PC | PC |
| Aurilio et al. [1], 2014 | Smart Meters | ---- | Voltage and Current | Arduino Shield | Ordinary |
| Tamkittikhun et al. [20], 2015 | Power Meter Design | Ethernet Shield | Voltage and Current | Arduino Mega 2560 | PC |
| Salamone et al. [2], 2016 | Smart Lamp | Bluetooth | Temperature and Humidity | Arduino Mega 2560 | Smartphone |
| Sung et al. [25], 2013 | Smart LED | Wi-Fi + ZigBee | Light Sensor | XP-8000 | Smartphone |
| Di Gennaro et al. [26], 2014 | Monitoring System | ZigBee | pH Probe | Raspberry Pi | PC |
| Calderón et al. [7], 2016 | Monitoring System | Cable | Temperature | Arduino Mega and PC | PC |
| Kim et al. [27], 2015 | Monitoring System | Wi-Fi | Webcam | Embedded Linux Board and Arduino | Smartphone |
| Parameter | Value |
|---|---|
| Turns Ratio | 1000:1000 |
| Primary and Secondary Current | 2 mA and 2 mA |
| Dielectric Level | 3000 VAC/min |
| Frequency Range | 50~60 Hz |
| Phase Angle Error | ≤20°, (50 Ω) |
| Parameter | Value |
|---|---|
| Supply Voltage | 5 V |
| Minimum Isolation Voltage (Input & Output) | 2.1 kVrms |
| Sensitivity (±5, ±20 and ±30) A | (66,100, 185) mV/A |
| Working Temperature | From (−40 to + 85) °C |
| Consumed Current | 10 mA |
| Parameter | Value |
|---|---|
| Microcontroller | ATmega328 |
| Operating Voltage (logic level) | 5 V |
| Flash Memory, EEPROM, and SRAM | 32 kB of which 2 kB used by bootloader, 1 kB, and 2 kB |
| Clock Speed | 16 MHz |
| Analog I/O Pins | 8 |
| DC Current per I/O Pins | 40 mA (I/O Pins) |
| Input Voltage | 7–12 V |
| Digital I/O Pins | 22 |
| PWM Output | 6 |
| Power Consumption | 19 mA |
| Parameter | Value |
|---|---|
| Frequency | ISM band, 2.4 GHz |
| Synchronous | 1 Mbps/1 Mbps |
| Power Supply | +3.3 VDC 50 mA |
| Working Temperature | (−25~+75) °C |
| Transmit Power | Class 2, ≤4 dBm |
| Component | Hardware | Quantity | Price (€) |
|---|---|---|---|
| Voltage Sensor | Single-phase AC Voltage Sensor Circuit | 3 | 3 × 4.26 |
| Current Sensor | Single-phase AC current Sensor Circuit | 3 | 3 × 1.7 |
| Wireless Communication | HC-5 Bluetooth | 1 | 3.41 |
| Microcontroller Board | Arduino Nano | 1 | 3.26 |
| Total cost from eBay stores (approximately) | 24.55 | ||
© 2017 by the authors. Licensee MDPI, Basel, Switzerland. This article is an open access article distributed under the terms and conditions of the Creative Commons Attribution (CC BY) license (http://creativecommons.org/licenses/by/4.0/).
Share and Cite
Mnati, M.J.; Van den Bossche, A.; Chisab, R.F. A Smart Voltage and Current Monitoring System for Three Phase Inverters Using an Android Smartphone Application. Sensors 2017, 17, 872. https://doi.org/10.3390/s17040872
Mnati MJ, Van den Bossche A, Chisab RF. A Smart Voltage and Current Monitoring System for Three Phase Inverters Using an Android Smartphone Application. Sensors. 2017; 17(4):872. https://doi.org/10.3390/s17040872
Chicago/Turabian StyleMnati, Mohannad Jabbar, Alex Van den Bossche, and Raad Farhood Chisab. 2017. "A Smart Voltage and Current Monitoring System for Three Phase Inverters Using an Android Smartphone Application" Sensors 17, no. 4: 872. https://doi.org/10.3390/s17040872
APA StyleMnati, M. J., Van den Bossche, A., & Chisab, R. F. (2017). A Smart Voltage and Current Monitoring System for Three Phase Inverters Using an Android Smartphone Application. Sensors, 17(4), 872. https://doi.org/10.3390/s17040872