The Use of a Pressure-Indicating Film to Determine the Effect of Liner Type on the Measured Teat Load Caused by a Collapsing Liner


Abstract
:1. Introduction
2. Materials and Methods
2.1. Experimental Setup
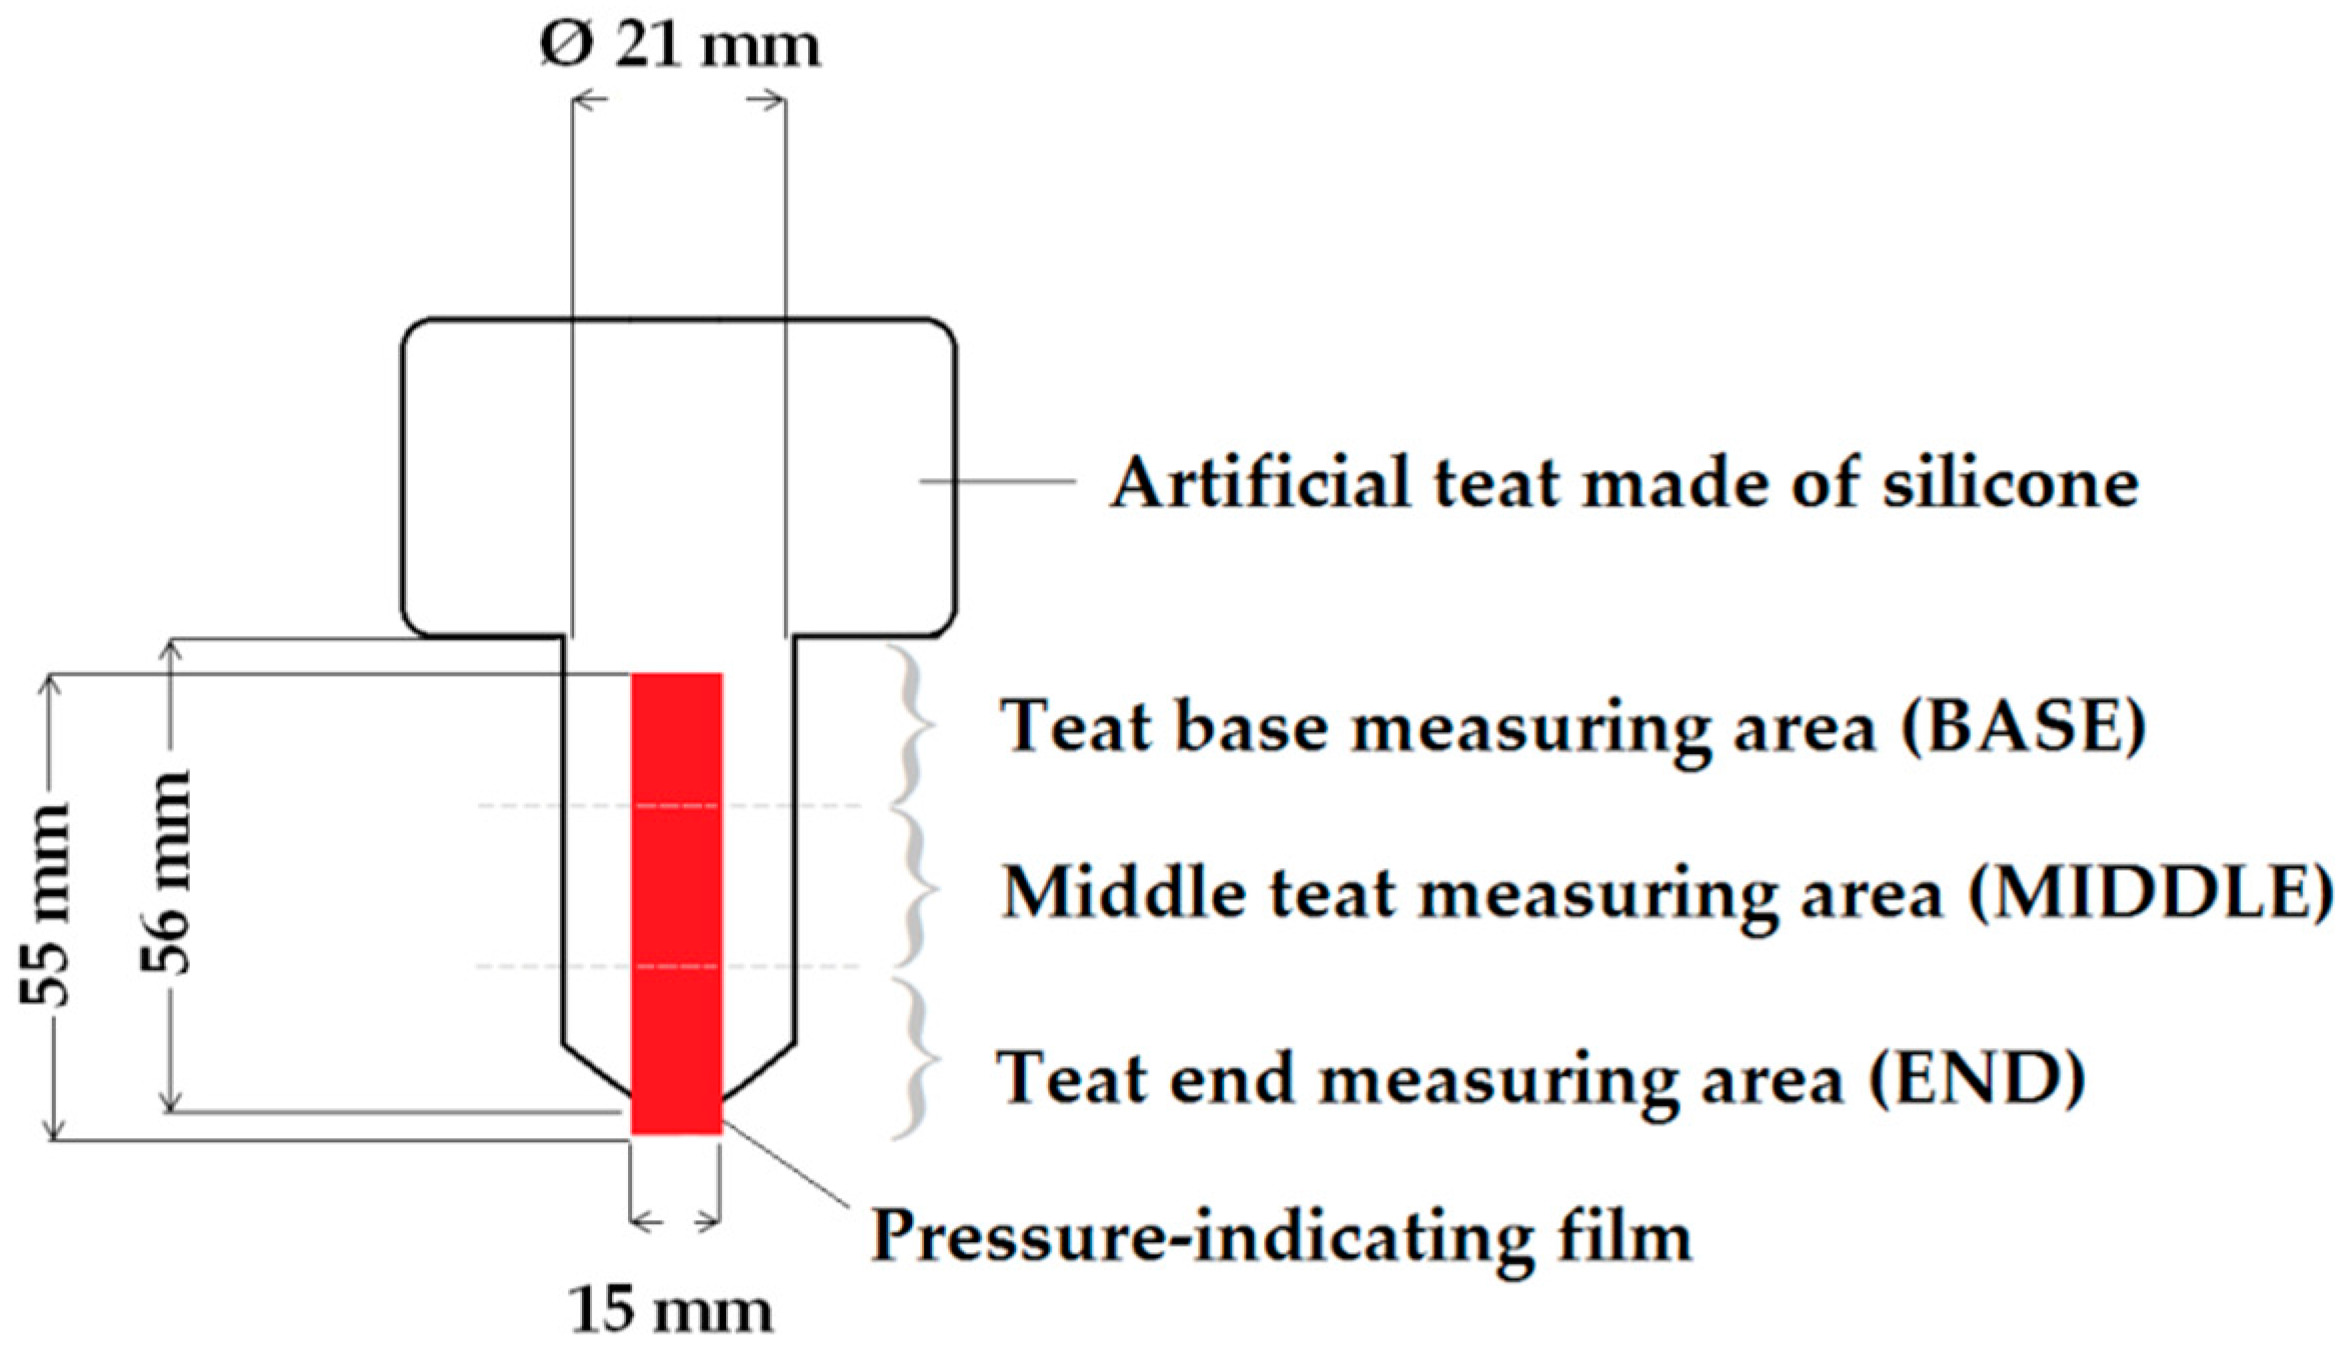
2.2. Artificial Teat
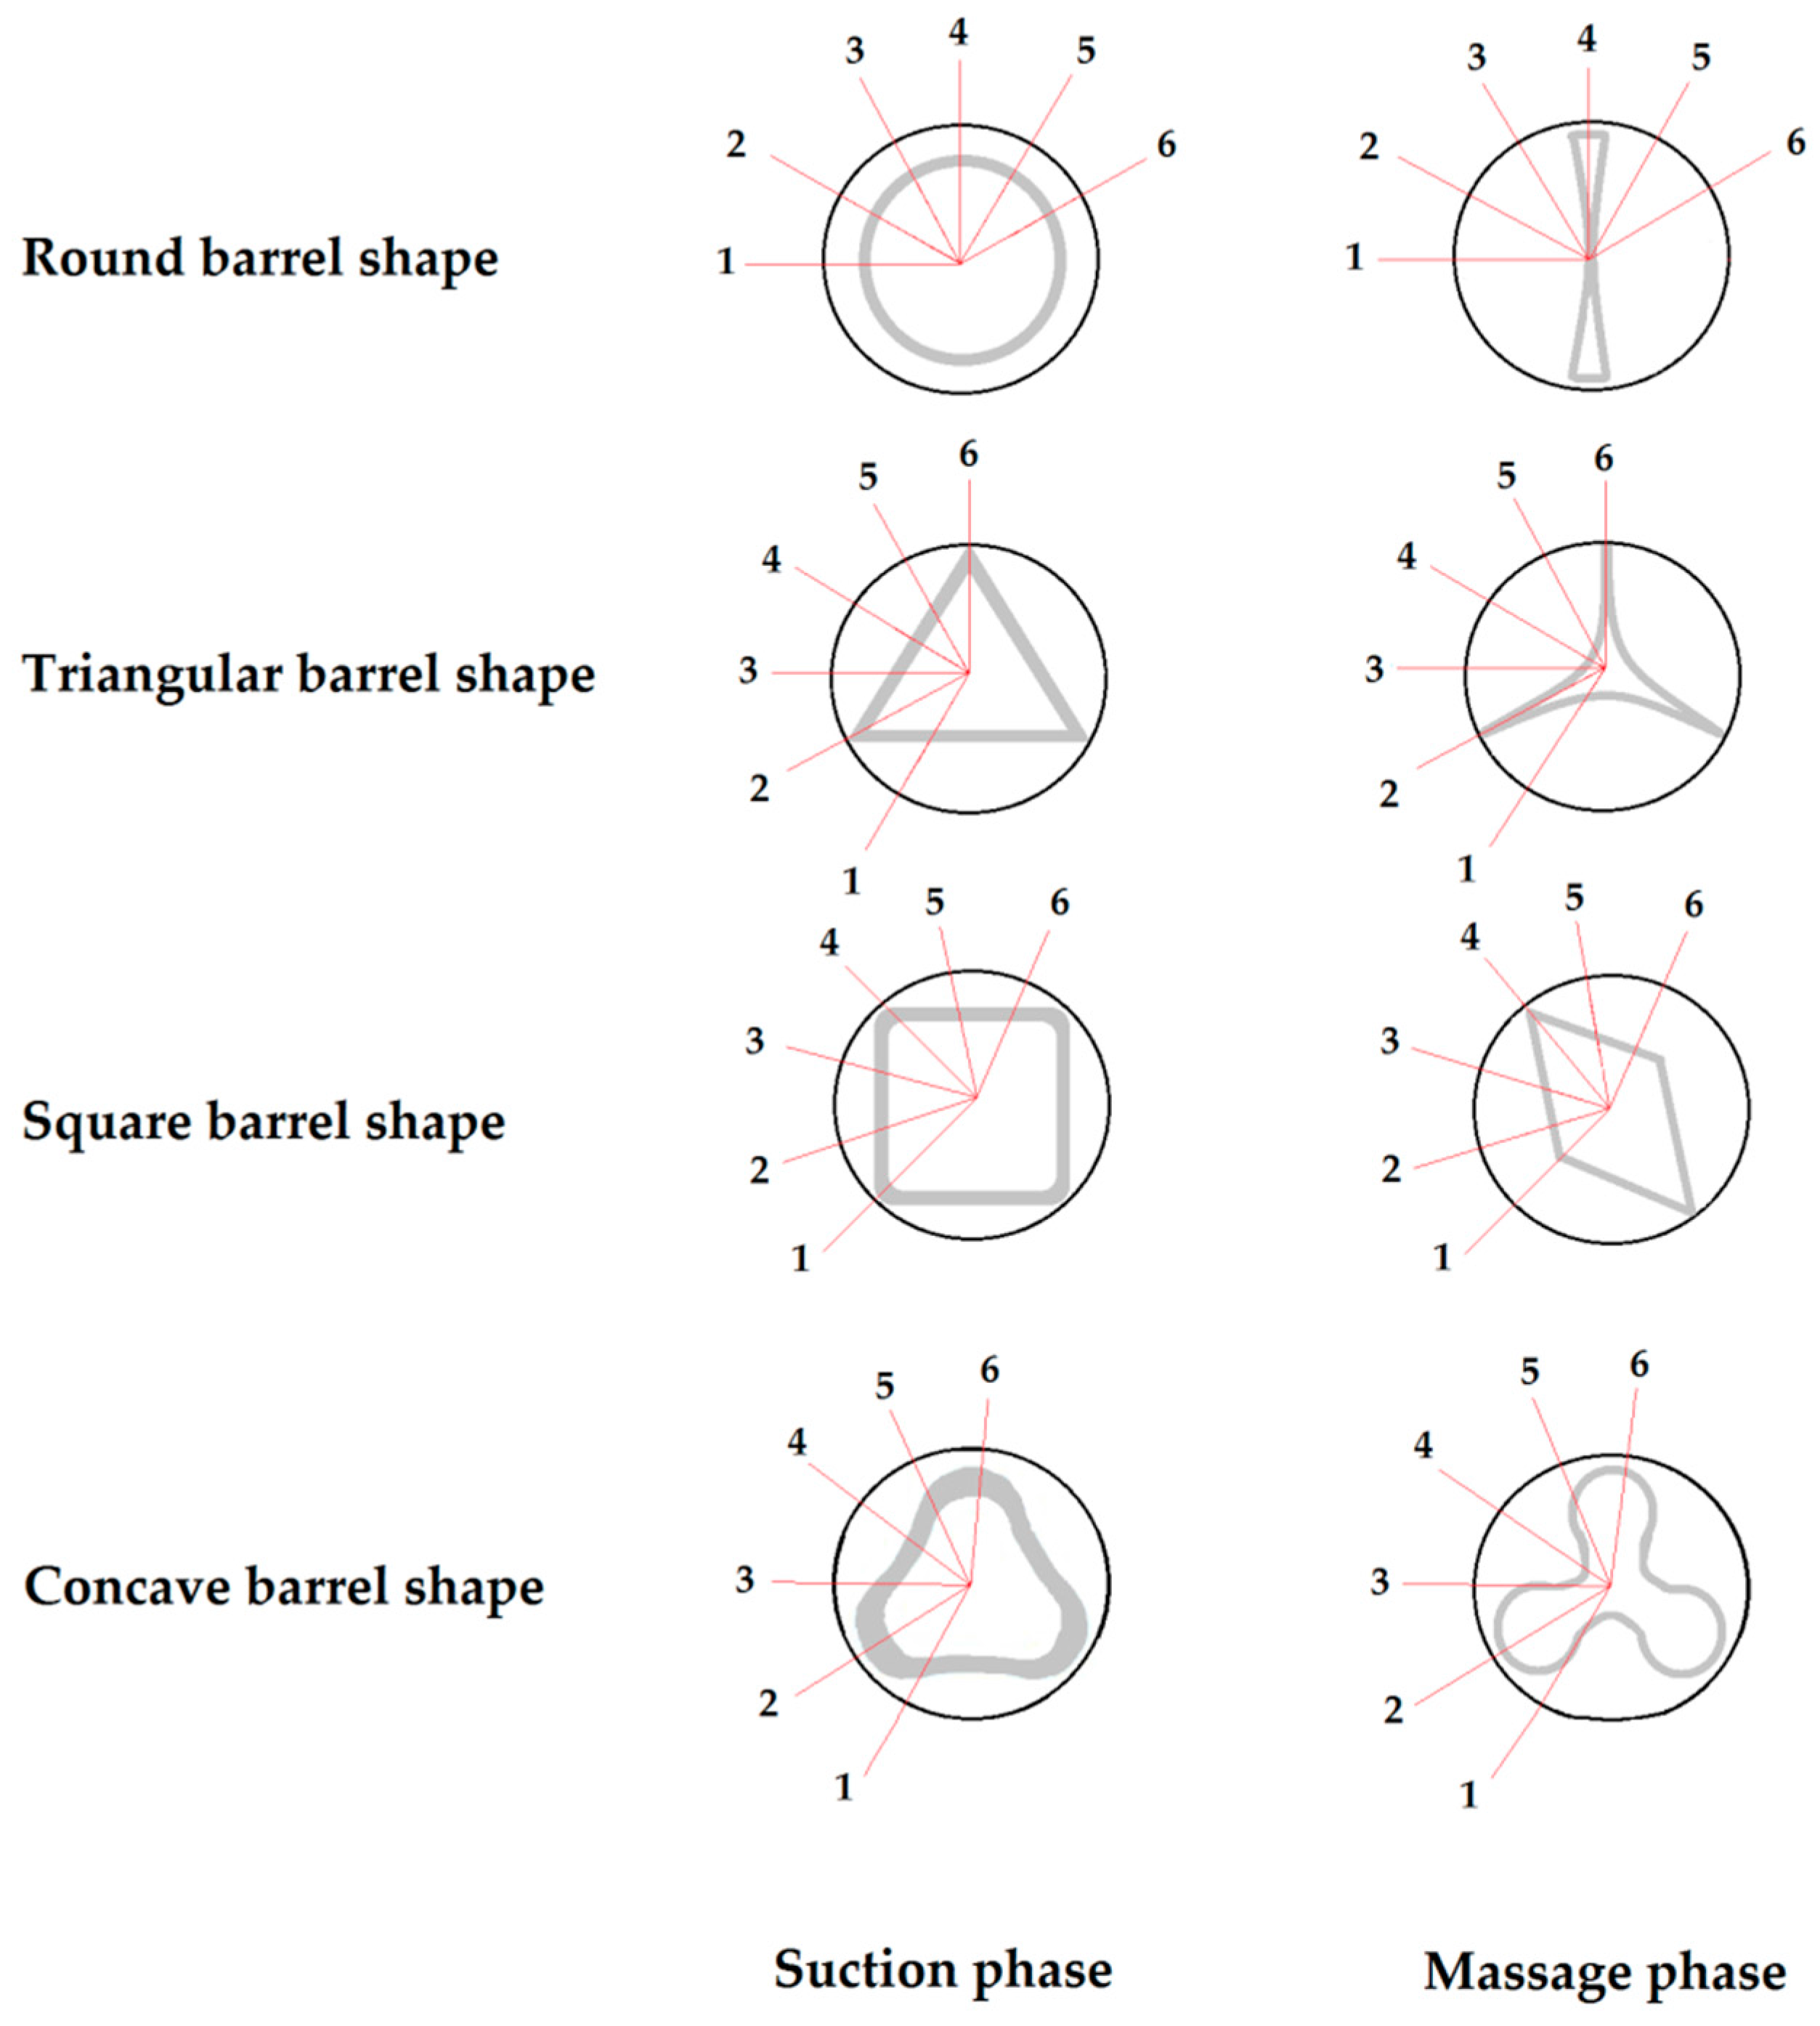
2.3. Teat Cup Liners
2.4. Pressure-Indicating Film
2.5. Data Collection
2.6. Statistical Analysis
3. Results
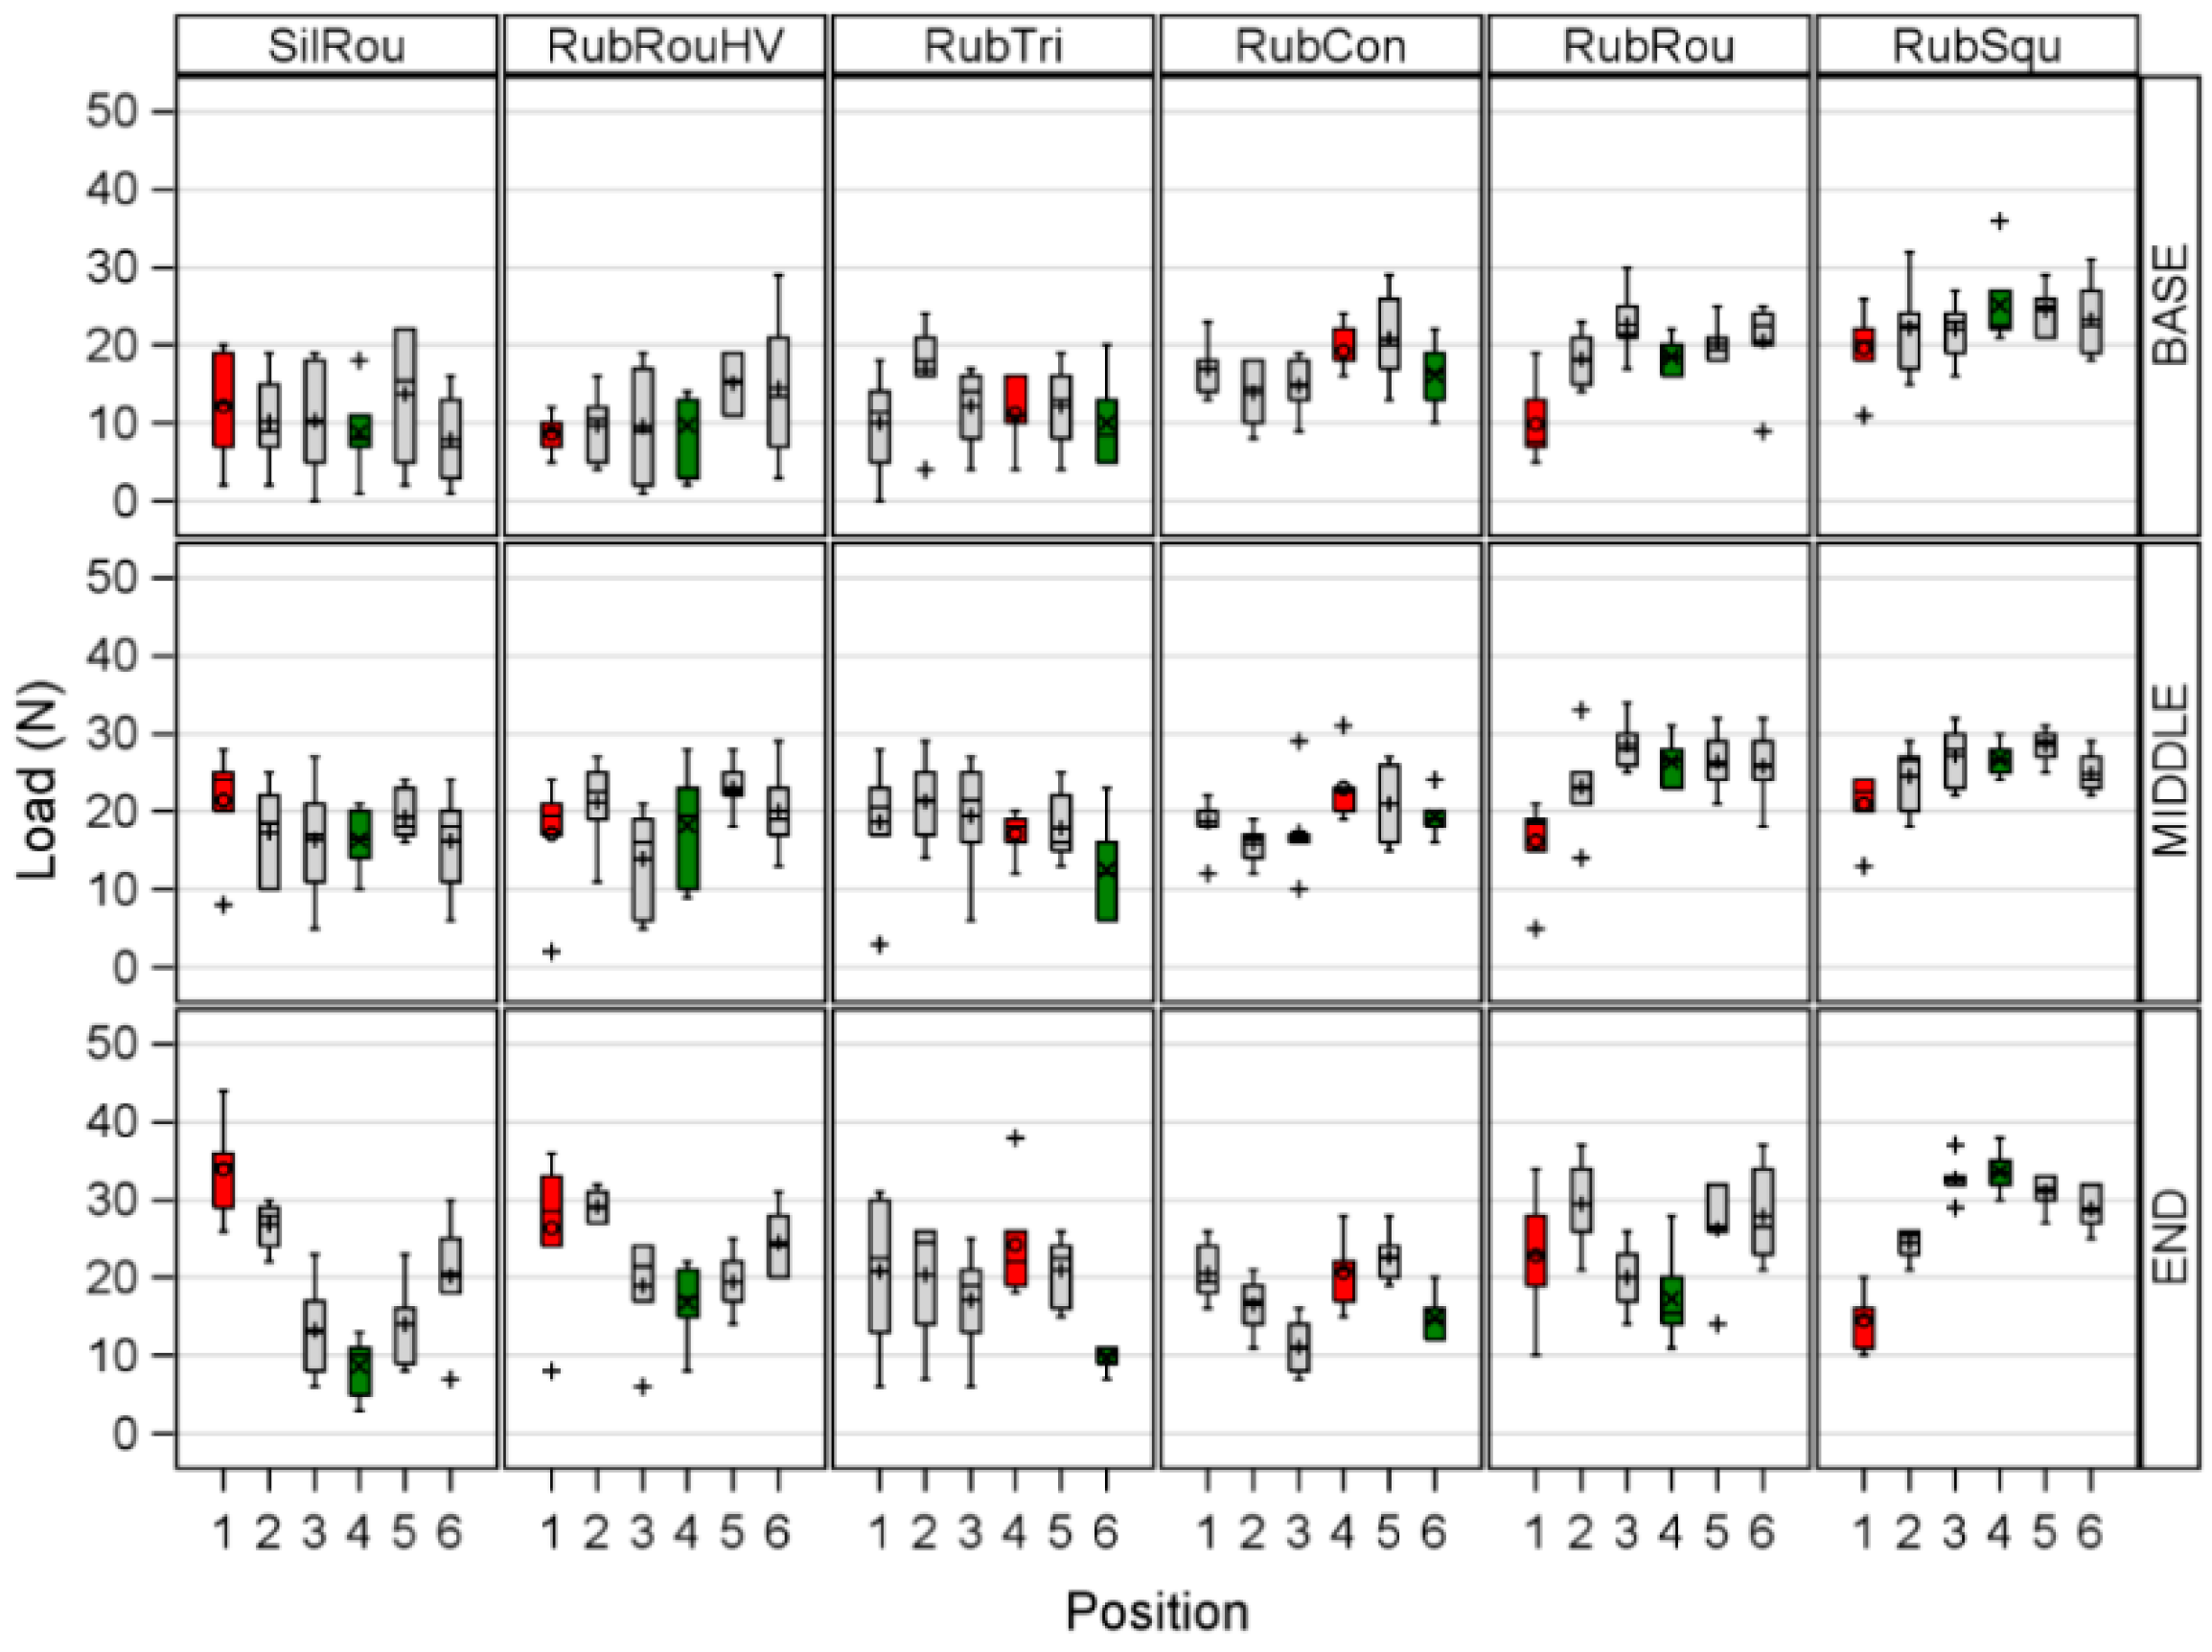
3.1. Load
3.1.1. Differences between Positions within a Liner for the Whole Measuring Area and between the Measuring Areas within a Liner and Position
3.1.2. Differences between the Liners
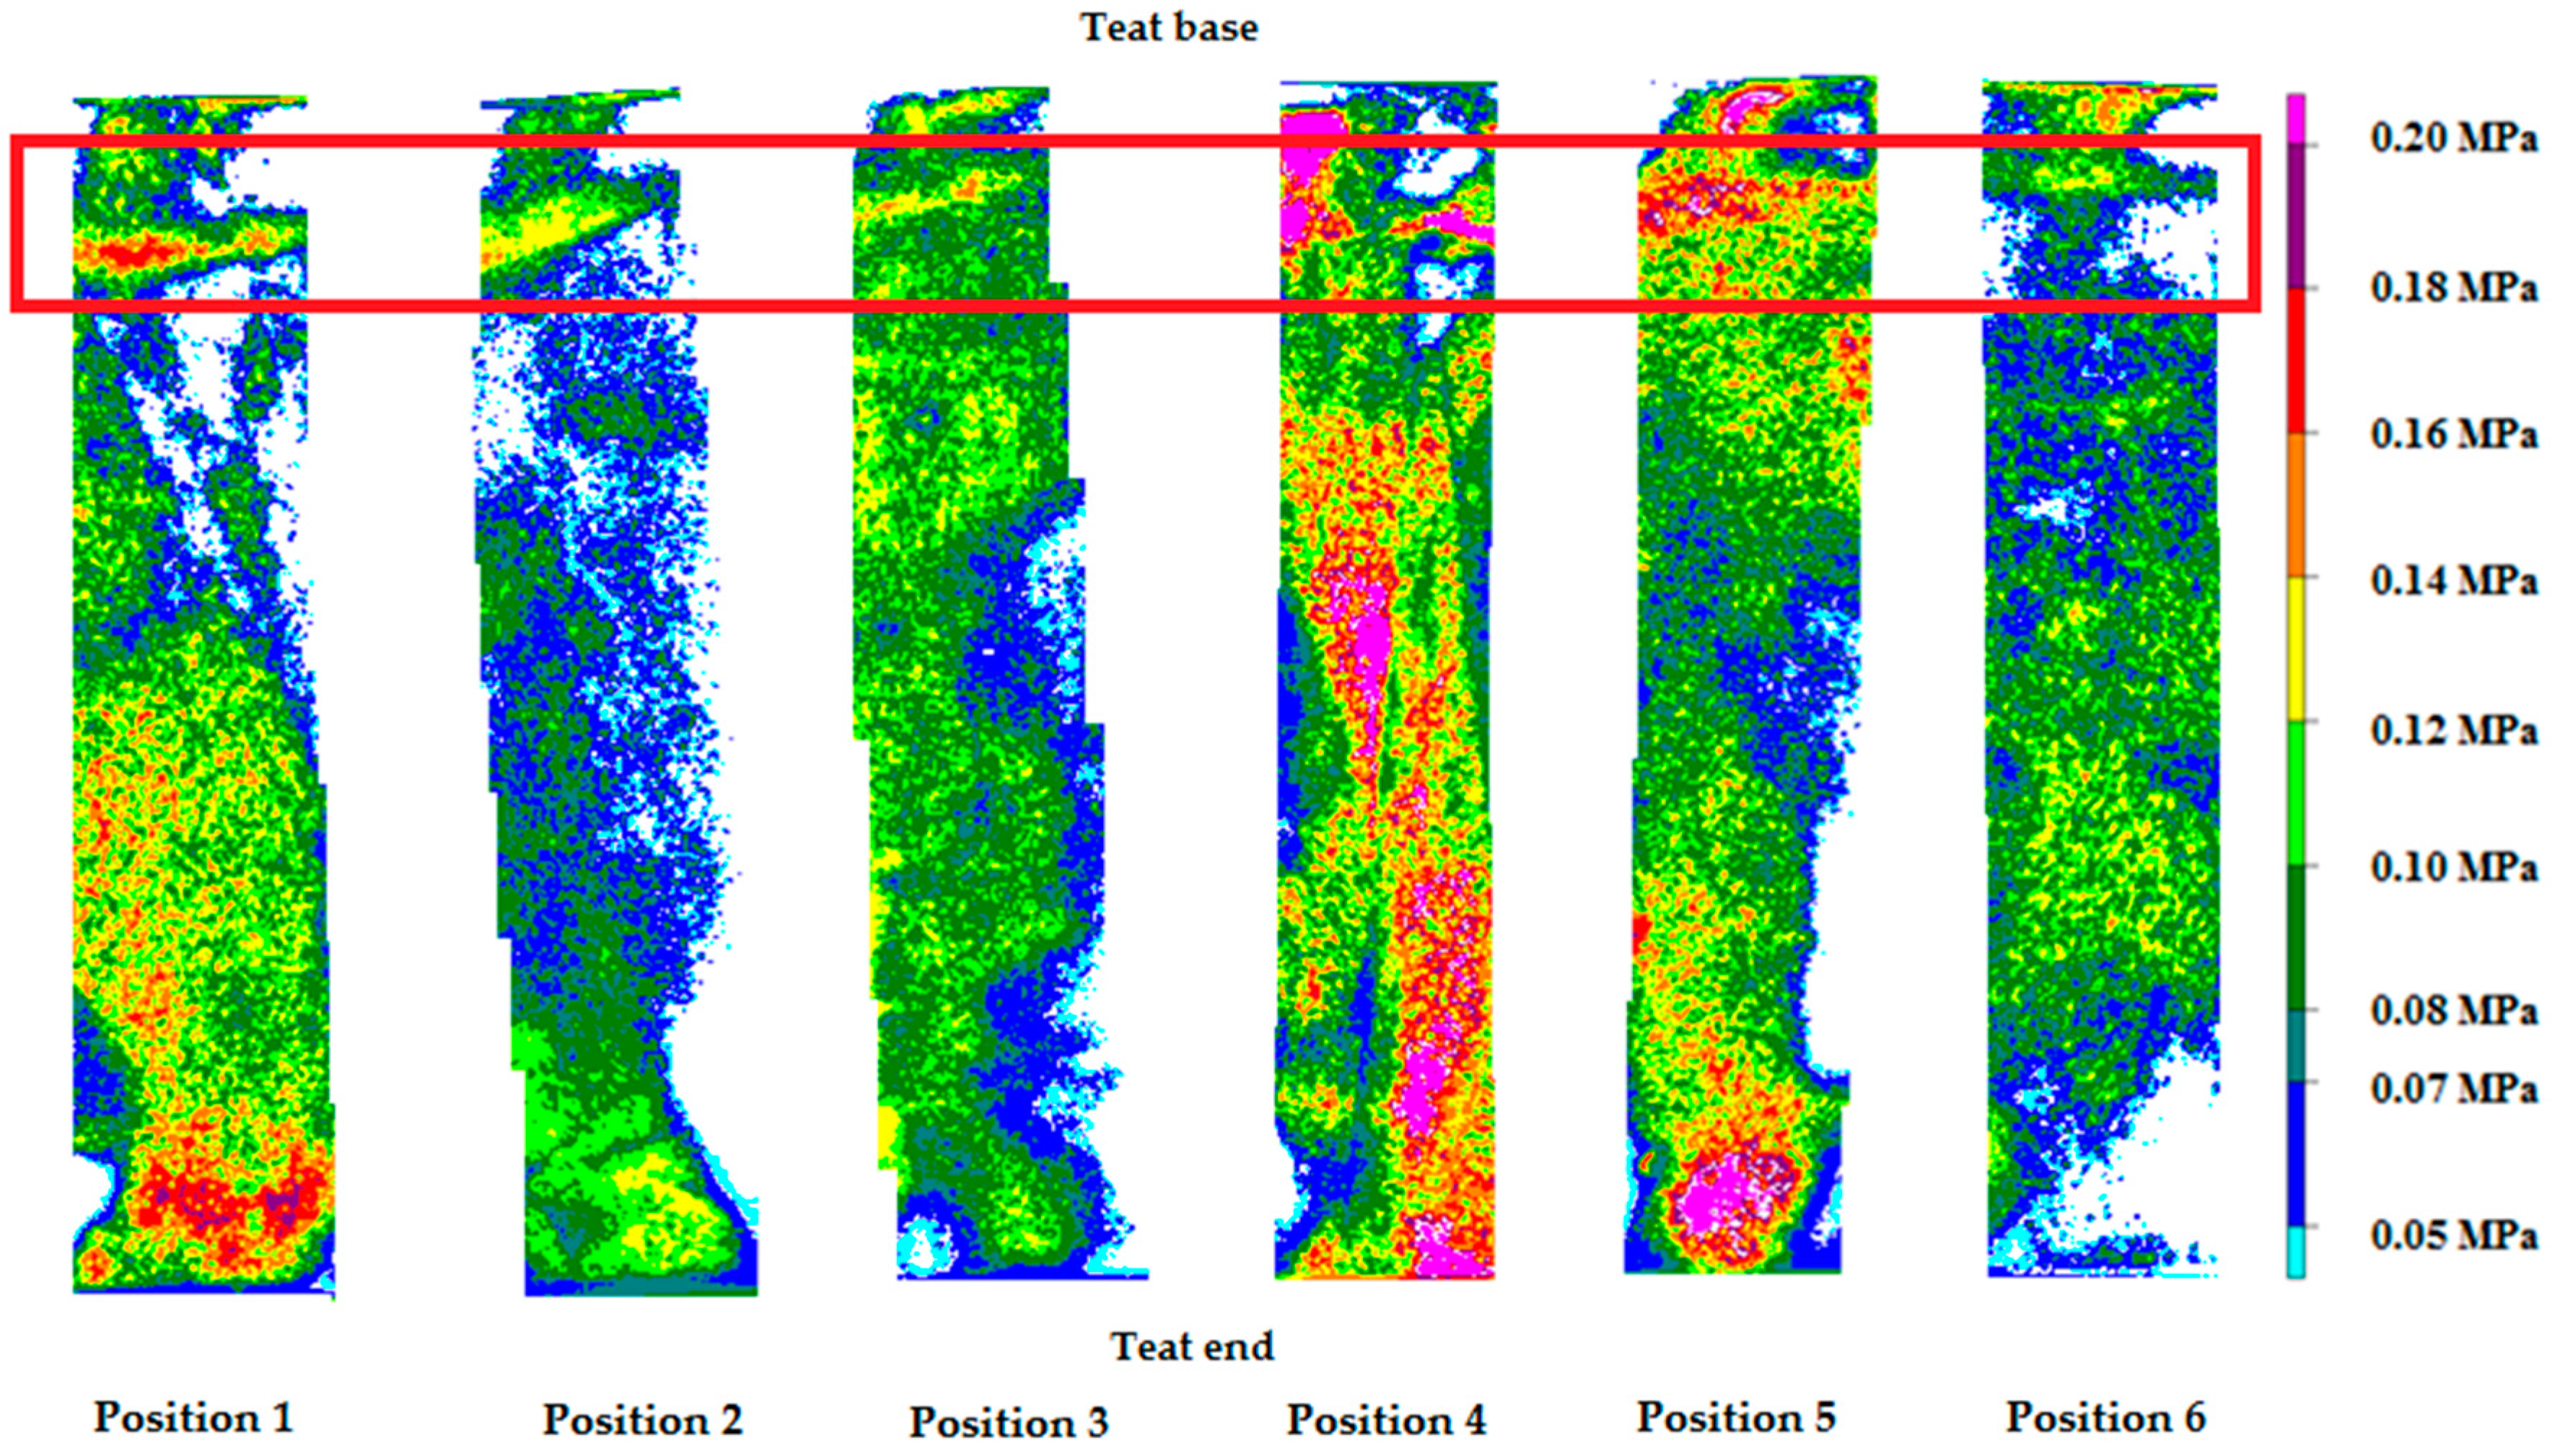
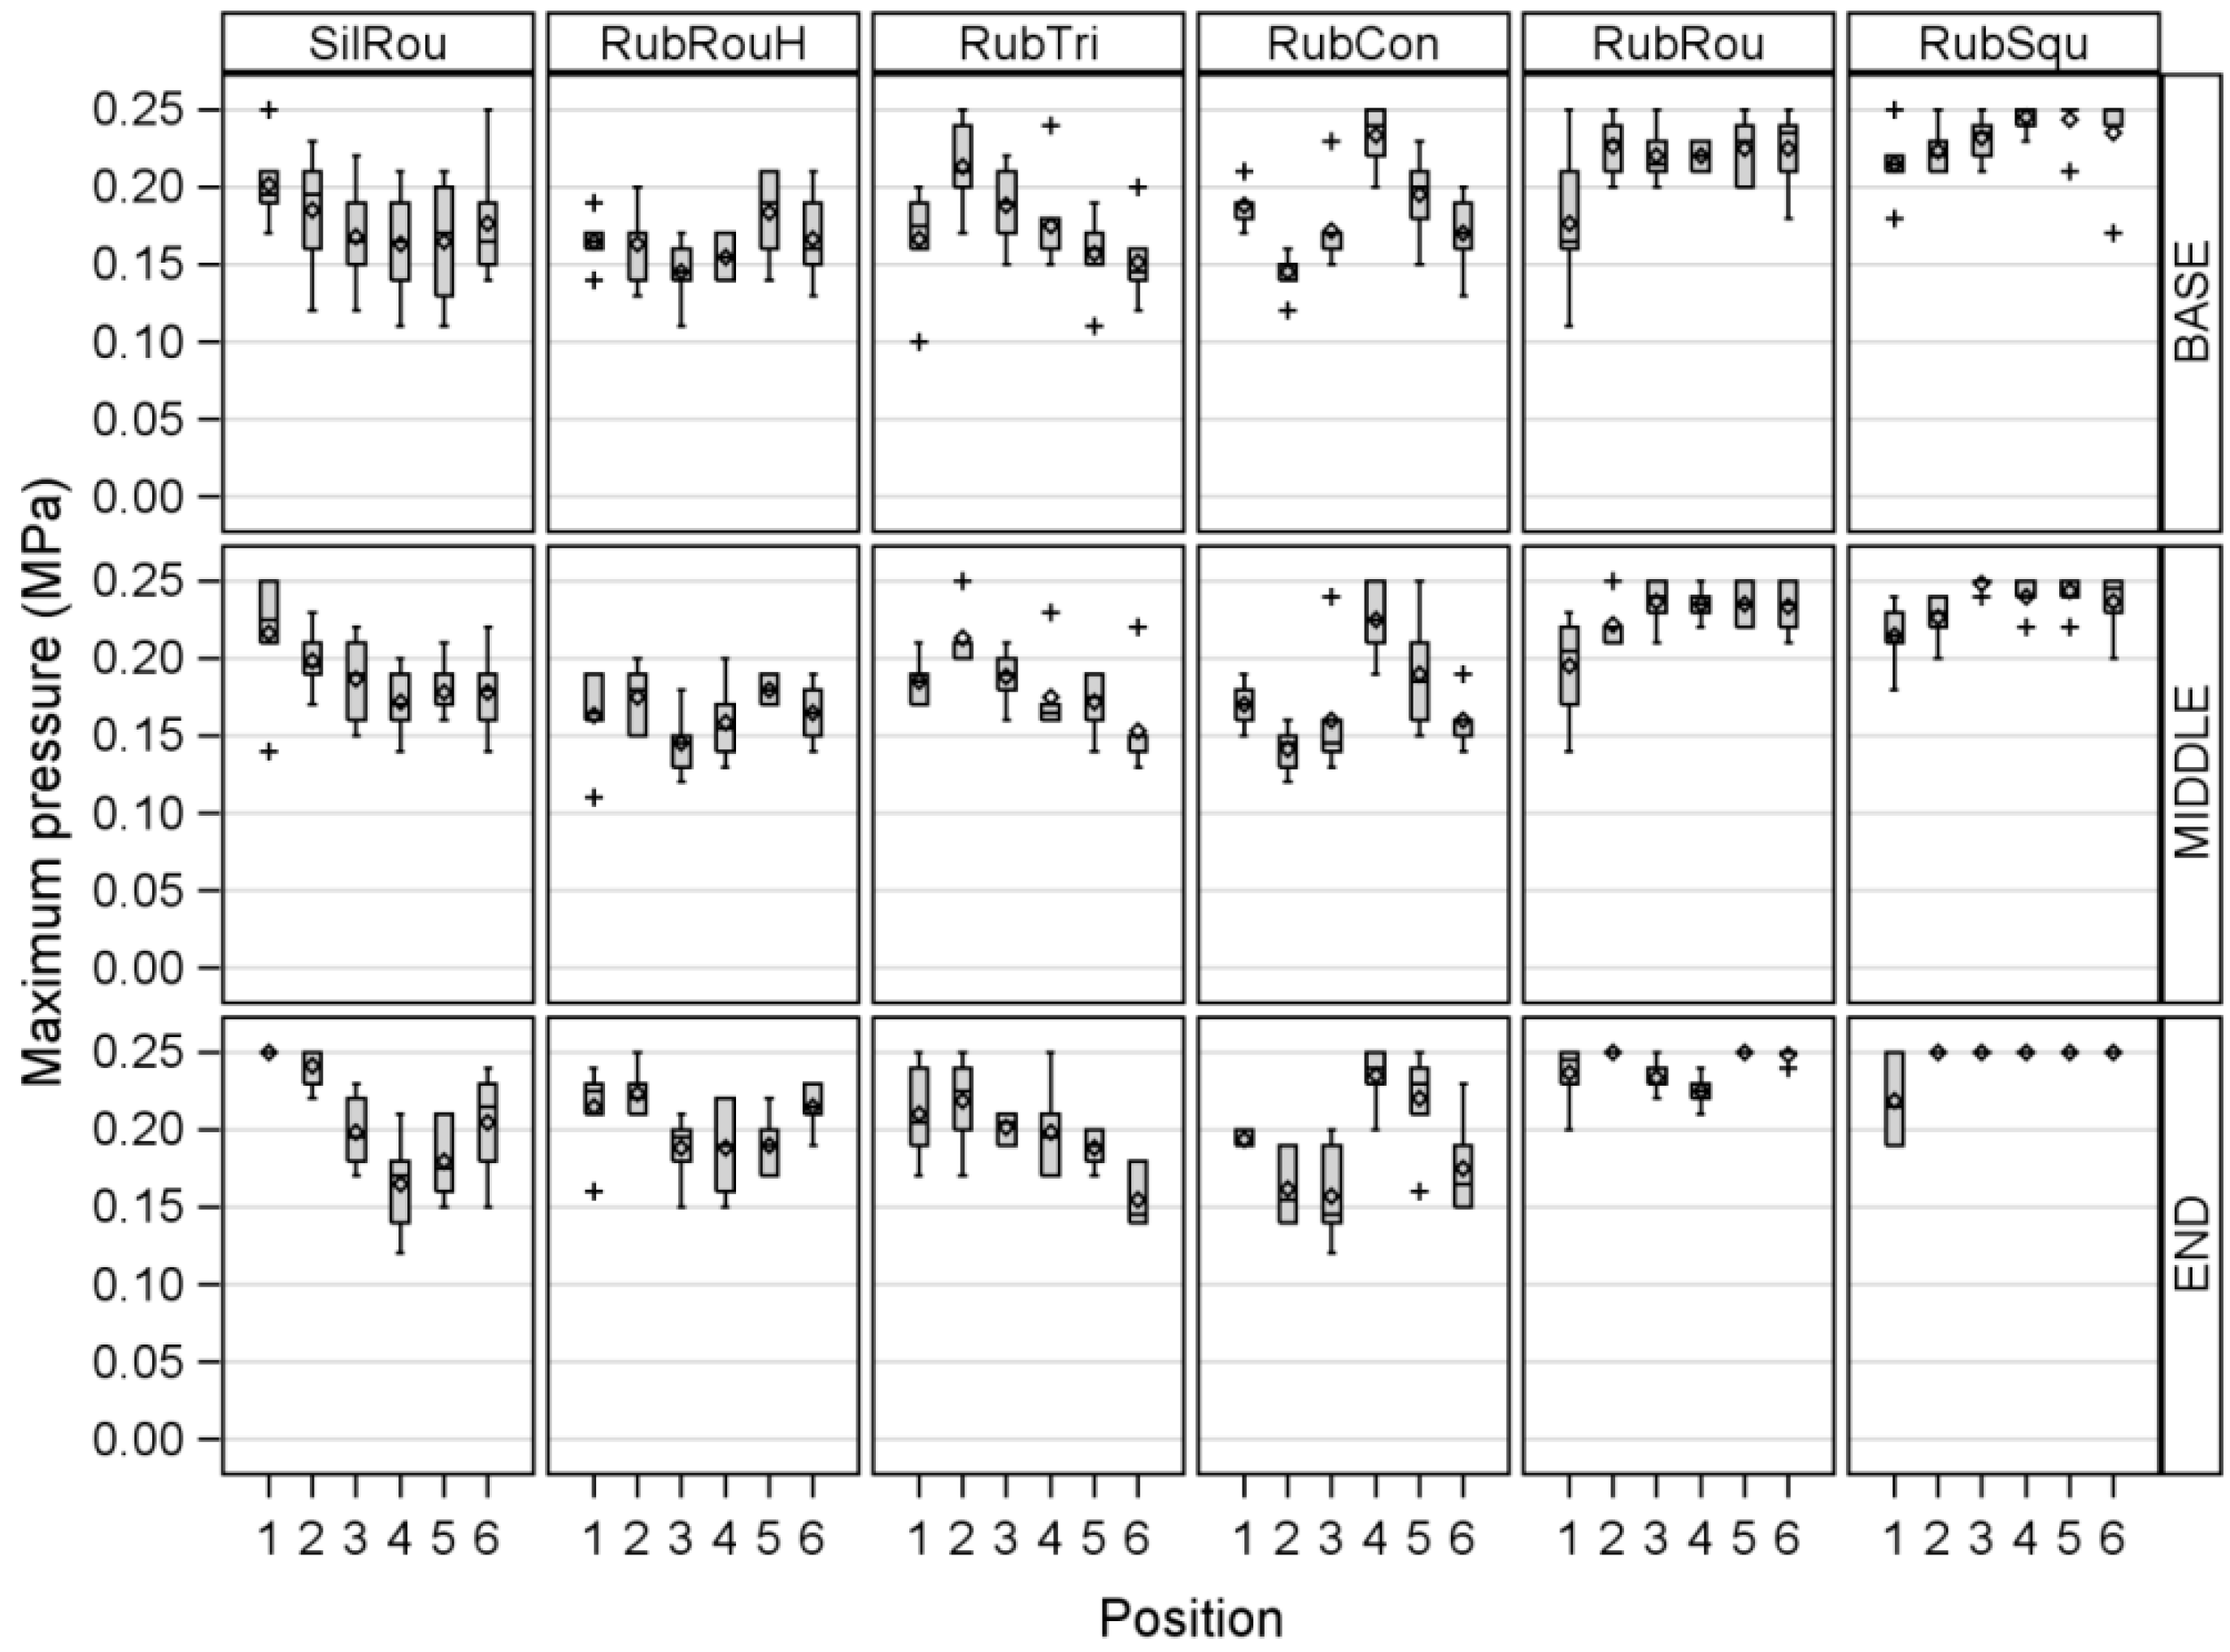
3.2. Maximum Pressure
3.2.1. Differences between the Positions within a Liner for the whole Measuring Area
3.2.2. Differences between Liners, Positions, and Measuring Areas
3.3. Conspicuousness Effect of RubCon
4. Discussion
5. Conclusions
Author Contributions
Conflicts of Interest
References
- Hubal, M. Milking Technique Parameters and the Bovine Teat Condition. Ph.D. Thesis, Georg-August-University, Göttingen, Germany, 2010. [Google Scholar]
- Hibbitt, K.G.; Craven, N.; Batten, E.H. Anatomy, physiology and immunology of the udder. In Bovine Medicine. Diseases and Husbandry of Cattle, 2nd ed.; Andrews, A.H., Blowey, R.W., Boyd, H., Eddy, R.G., Eds.; Blackwell Scientific Publications: Oxford, UK, 1992; pp. 311–325. [Google Scholar]
- Mein, G.A.; Neijenhuis, F.; Morgan, W.F.; Reinemann, D.J.; Hillerton, J.E.; Baines, J.R.; Ohnstad, I.; Rasmussen, M.D.; Timms, L.; Britt, J.S.; et al. Evaluation of bovine teat condition in commercial dairy herds: 1. Non-infectious factors. In Proceedings of the International Symposium on Mastitis and Milk Quality, Lelystad, The Netherlands, 13–15 September 2001. [Google Scholar]
- Gleeson, D.E.; O’Callaghan, E.J.; Rath, M.V. Effect of milking on bovine teat tissue as measured by ultrasonography. Ir. Vet. J. 2002, 55, 628–632. [Google Scholar]
- Mir, A.Q.; Bansal, B.K.; Gupta, D.K. Short term changes in teats following machine milking with respect to quarter health status in cows. J. Anim. Res. 2015, 5, 467–471. [Google Scholar] [CrossRef]
- Rasmussen, M.D.; Frimer, E.S.; Kaartinen, L.; Jensen, N.E. Milking performance and udder health of cows milked with two different liners. J. Dairy Res. 1998, 65, 353–363. [Google Scholar] [CrossRef] [PubMed]
- Capuco, A.V.; Wood, D.L.; Quast, J.W. Effects of teat cup liner tension on teat canal keratin and teat condition in cows. J. Dairy Res. 2000, 67, 319–327. [Google Scholar] [CrossRef] [PubMed]
- Gleeson, D.E.; O’Callaghan, E.J.; Meaney, W.J.; Rath, M.V. Effect of two milking systems on the milking characteristics, teat tissue changes and new infection rate of dairy cows. Anim. Res. 2005, 54, 259–267. [Google Scholar] [CrossRef]
- Zucali, M.; Reinemann, D.J.; Tamburini, A.; Bade, R.D. Effects of liner compression on teat-end hyperkeratosis. In Proceedings of the American Society of Agricultural and Biological Engineers, Providence, RI, USA, 29 June–2 July 2008. [Google Scholar]
- Haeussermann, A.; Britten, J.; Britten, A.; Pahl, C.; Älveby, N.; Hartung, E. Effect of a multi-sided concave liner barrel design on thickness and roughness of teat-end hyperkeratosis. J. Dairy Res. 2016, 83, 188–195. [Google Scholar] [CrossRef] [PubMed]
- Paulrud, C.O.; Clausen, S.; Andersen, P.E.; Rasmussen, M.D. Infrared thermography and ultrasonography to indirectly monitor the influence of liner type and overmilking on teat tissue recovery. Acta Vet. Scand. 2005, 46, 137–147. [Google Scholar] [CrossRef] [PubMed]
- Gleeson, D.E.; O’Callaghan, E.J.; Rath, M.V. Effect of liner design, pulsator setting, and vacuum level on bovine teat tissue changes and milking characteristics as measured by ultrasonography. Ir. Vet. J. 2004, 57, 289–296. [Google Scholar] [CrossRef] [PubMed]
- Davis, M.A.; Reinemann, D.J.; Mein, G.A. Development and testing of a device to measure compressive teat load applied to a bovine teat by the closed teatcup liner. In Proceedings of the American Society of Agricultural and Biological Engineers Annual Meeting, Sacramento, CA, USA, 29 July–1 August 2001. [Google Scholar]
- Van der Tol, P.P.J.; Schrader, W.; Aernouts, B. Pressure distribution at the teat-liner and teat-calf interfaces. J. Dairy Sci. 2010, 93, 45–52. [Google Scholar] [CrossRef] [PubMed]
- Leonardi, S.; Penry, J.F.; Tangorra, F.M.; Thompson, P.D.; Reinemann, D.J. Methods of estimating liner compression. J. Dairy Sci. 2015, 98, 6905–6912. [Google Scholar] [CrossRef] [PubMed]
- Muthukumarappan, K.; Reinemann, D.J.; Mein, G.A. Compressive load applied to the bovine teat by the teatcup liner. In Proceedings of the American Society of Agricultural and Biological Engineers International Winter Meeting, Atlanta, GA, USA, 13–16 December 1994. [Google Scholar]
- Zucali, M.; Bava, L.; Penati, C.; Tamburini, A. Effect of liner characteristics on teat apex condition and milk flow traits. Ital. J. Anim. Sci. 2009, 8, 447–449. [Google Scholar] [CrossRef]
- Kunc, P.; Knizkova, I.; Koubkova, M. The influence of milking with different vacuum and different design of liner on the change of teat surface temperature. Czech J. Anim. Sci. 1999, 44, 131–134. [Google Scholar]
- Schukken, Y.H.; Petersson, L.G.; Rauch, B.J. Liner and teat end health. In Proceedings of the 45th National Mastitis Council Annual Meeting, Tampa, FL, USA, 22–25 January 2006; pp. 183–196. [Google Scholar]
- Demba, S.; Elsholz, S.; Ammon, C.; Rose-Meierhoefer, S. The usability of a pressure-indicating film to measure the teat load caused by a collapsing liner. Sensors 2016, 16, 1597. [Google Scholar] [CrossRef] [PubMed]
- Rodriguez-Martinez, R.; Urriolagoitia-Sosa, G.; Torres-San Miguel, C.R.; Hernández-Gómez, L.H.; Urriolagoitia-Calderón, G.; Carbajal-Romero, M.F. Development of an experimental apparatus for testing a total knee prostheses focused on mexican phenotype. Int. J. Phys. Sci. 2012, 7, 5779–5786. [Google Scholar]


| Liner | 1 | 2 | 3 | 4 | 5 | 6 |
|---|---|---|---|---|---|---|
| Abbreviation | SilRou | RubRouHV | RubTri | RubCon | RubRou | RubSqu |
| Material | silicone | rubber | rubber | rubber | rubber | rubber |
| Mouthpiece bore diameter (mm) | 23 | 23 | 23 | 20 | 23 | 23 |
| Barrel shape | round • | round • | triangular ∆ | concave ∆ | round • | square □ |
| Barrel diameter at 75 mm (mm) | 25 | 23 | - | - | 24 | - |
| Side edge length (a) at 75 mm (mm) | - | - | 30 | 30 | - | 25 |
| Inscribed circle 1 at 75 mm (mm) | - | - | 8.7 | 8.7 | - | 7.2 |
| Circumradius 2 at 75 mm (mm) | - | - | 17.3 | 17.3 | - | 14.4 |
| Liner length (mm) | 169 | 156 | 150 | 149 | 159 | 151 |
| Touchpoint (kPa) | 18.4 | 15.1 | - | - | 12.9 | - |
| Wall thickness (mm) | 2.0 | 3.0 | 2.0 | 2.0 | 2.0 | 2.0 |
| Head ventilation | no | yes | yes | no | no | no |
| Liner | Position | Compared Measuring Areas | Difference in L (N) | CI | |
|---|---|---|---|---|---|
| Lower | Upper | ||||
| 1 | 1 | BASE-MIDDLE | −9.33 | −18.50 | −0.17 |
| 1 | 1 | BASE-END | −21.83 | −33.97 | −9.70 |
| 1 | 1 | MIDDLE-END | −12.50 | −24.64 | −0.36 |
| 1 | 2 | BASE-END | −16.67 | −25.83 | −7.50 |
| 1 | 2 | MIDDLE-END | −9.50 | −18.67 | −0.33 |
| 1 | 6 | BASE-END | −12.33 | −21.50 | −3.17 |
| 2 | 1 | BASE-END | −17.67 | −26.90 | −8.43 |
| 2 | 2 | BASE-MIDDLE | −11.50 | −20.74 | −2.26 |
| 2 | 2 | BASE-END | −19.50 | −28.74 | −10.26 |
| 2 | 3 | BASE-END | −9.50 | −18.74 | −0.26 |
| 2 | 6 | BASE-END | −10.00 | −19.24 | −0.76 |
| 3 | 1 | BASE-END | −10.83 | −20.03 | −1.64 |
| 3 | 4 | BASE-END | −12.83 | −22.03 | −3.64 |
| 5 | 1 | BASE-END | −13.00 | −22.15 | −3.85 |
| 5 | 2 | BASE-END | −11.33 | −20.48 | −2.18 |
| 6 | 3 | BASE-END | −10.67 | −19.87 | −1.46 |
© 2017 by the authors. Licensee MDPI, Basel, Switzerland. This article is an open access article distributed under the terms and conditions of the Creative Commons Attribution (CC BY) license (http://creativecommons.org/licenses/by/4.0/).
Share and Cite
Demba, S.; Paul, V.; Ammon, C.; Rose-Meierhöfer, S. The Use of a Pressure-Indicating Film to Determine the Effect of Liner Type on the Measured Teat Load Caused by a Collapsing Liner. Sensors 2017, 17, 855. https://doi.org/10.3390/s17040855
Demba S, Paul V, Ammon C, Rose-Meierhöfer S. The Use of a Pressure-Indicating Film to Determine the Effect of Liner Type on the Measured Teat Load Caused by a Collapsing Liner. Sensors. 2017; 17(4):855. https://doi.org/10.3390/s17040855
Chicago/Turabian StyleDemba, Susanne, Viktoria Paul, Christian Ammon, and Sandra Rose-Meierhöfer. 2017. "The Use of a Pressure-Indicating Film to Determine the Effect of Liner Type on the Measured Teat Load Caused by a Collapsing Liner" Sensors 17, no. 4: 855. https://doi.org/10.3390/s17040855