1. Introduction
Ships play an important role in both civilian and military activities, and serve a wide variety of purposes, which include transportation of goods and passengers, naval and marine operations, and oceanic resource exploration [
1]. Since there exist waves over 70% of the time in the open seas, ships are subjected to wave-induced motions and loads during their whole lifetime [
2]. Moreover, the structural strength and elastic deformation of large flexible ships in waves should also be of concern to the designers and operators [
3]. In fact, ships require good seakeeping ability and enough structural strength to fulfill their designated functions, even in harsh seas [
4]. Therefore, accurately predictions of wave-induced ship motions and loads are important for ship design, optimization and operation.
Ship seakeeping issues can be addressed by both numerical and experimental methods [
5]. Up to now, considerable efforts have been made on developing ship seakeeping algorithms, which can be mainly classified into potential and viscous theories [
6,
7]. In fact, due to the complexity of fluid–structure interaction problems, physical experiment constitutes an important tool in the investigation of wave-induced ship motions and loads [
8]. Generally, ship seakeeping tests are mainly classified into scaled model test and full-scale sea trial [
9]. The former includes conducting downscaled model measurement in tanks, and is widely popular due to its obvious advantages such as convenience and cost-saving. However, a vital limitation associated with the tank model test is the waves that artificially generated by wave-makers are very different from the realistic sea waves. On the other hand, full-scale sea trial, although very realistic and reliable, is complicated, expensive and time-consuming [
10].
Due to the limitations associated with the laboratory tank test and full-scale sea trial, the concept of large-scale model test in realistic sea waves has been proposed in recent years. In some sense, this testing approach is a compromise between laboratory tank test and full-scale sea trial, and also provides obvious advantages over them in many aspects [
11]. For example, large-scale model test is much more realistic than tank test since the coastal waves are more complex and real, and the self-propelled large model can run in a relative open area at any heading. Moreover, the implementation of large-scale model trial is much cheaper when compared to full-scale trial.
In fact, although many researchers have conducted segmented model tests for ship seakeeping and wave loads investigations [
12,
13,
14], majority of the experiments were conducted in laboratory tank environment. Therefore, this paper mainly concentrates on the investigation of large-scale model’s seakeeping and wave loads characteristics in realistic sea waves, which will help get real and accurate motions and wave loads results for ship design. Because the large-scale model measurements are conducted in uncontrolled natural sea areas, a stable and reliable testing system is of great necessity to ensure the tests proceed effectively and smoothly. Therefore, this paper is aimed at developing an experimental system for large-scale model’s motions and loads measurement at sea, which will provide an alternative way and platform for the prediction of full-scale responses in realistic sea waves.
To date, a number of full-scale sea trials have been conducted to evaluate the prototype seakeeping characteristics. During the sea trial, the ship navigational state, motions and load responses are usually recorded. Gourlay and Klaka [
15] measured the heave, pitch and roll motions of a full-scale containership through three GPS receivers mounted on forecastle deck, port and starboard bridge wings of the vessel. An external reference GPS receiver was positioned ashore to correlate the moving receivers. Davis et al. [
16] measured a catamaran’s roll and pitch rates by using a pair of electronic rate gyros, and the ship encountered waves were measured by a wave radar mounted at center of bow of the catamaran. Nunez et al. [
17] developed a real-time telemetry system to monitor the motions, positions, speed, and course of a ship based on inertial sensors. Perera et al. [
18] developed an onboard decision support system for ship navigation guidance under rough weather conditions, which will contribute to vessel’s safety. Lee et al. [
19] installed a hull stress monitoring system (HSMS) on an 8063 TEU container carrier to record hull girder loads and other navigation data. Nielsen et al. [
20] developed a calculation procedure for fatigue damage rate prediction in hull girders based on stress monitoring data. Mondoro et al. [
21] predicted the structural response of naval vessels based on structural health monitoring data. Besides strain gauges, fiber optic sensors are also widely adopted for hull stress monitoring due to their stable and endurable performance [
22].
Presently, publications regarding large-scale model seakeeping test at sea are limited. Grigoropoulos and Katsaounis [
23] developed a manned large-scale model of corvette for seakeeping tests at sea. The model’s trace and speed were monitored via a satellite-based real-time kinematics (RTK) system. The motions of the model were measured via an in-house developed six-degree-of-freedom (6-DOF) system, which consists of seven strap-down accelerometers. Sun et al. [
24] established a scheme for a remotely controlled and telemetry system for large-scale model’s pitch and roll measurements at sea. A suite of self-propulsion system, rudder system, data measurement system and remote control system was developed. The established testing system was initially checked in a river and afterwards sea trials were conducted in coastal waves. Coraddu et al. [
25] established a twin-screw ship’s self-propelling system to investigate the asymmetric propeller behavior of the ship in a lake. Jiao et al. [
26] developed a large-scale segmented model testing scheme for hull loads and structural responses measurement in coastal waves.
The current paper mainly presents the development of a shipboard remotely controlled and telemetry experimental system for large-scale model’s motions and loads measurement at sea, which was extended from the laboratory tank measurement system. The structure of this paper is arranged as follows: The research background, the ship characteristics and measurement of interests are introduced in
Section 2. Then the laboratory tank seakeeping experiment system developed in authors’ previous work is briefly reviewed and reported in
Section 3. Afterwards a large-scale model measurement scheme is proposed, building on the laboratory testing studies, in
Section 4. A suite of remotely controlled and telemetry experimental system for large-scale ship model’s motions and loads measurement at sea is introduced in detail. The proposed measurement system was finally tested by field experiment and found to be feasible and reliable, which is reported in
Section 5. Main conclusions are drawn in
Section 6.
4. Large-Scale Model Field Measurement System
Although wave-induced motions and loads can be obtained through laboratory tank measurement, the waves artificially generated by wave-makers are usually 2D uni-directional pseudo-random waves. Realistic sea waves are however 3D short-crested waves, and associated with strong nonlinear and stochastic characteristics. Moreover, fully developed wind waves need ample time and space for their evolution. Therefore, to accurately reproduce the motion and load responses of full-scale ships in actual seas, large-scale model testing scheme was proposed. For this purpose, a large-scale model field measurement system building on the laboratory measurement foundations is presented in this section.
4.1. The Large-Scale Model Hull
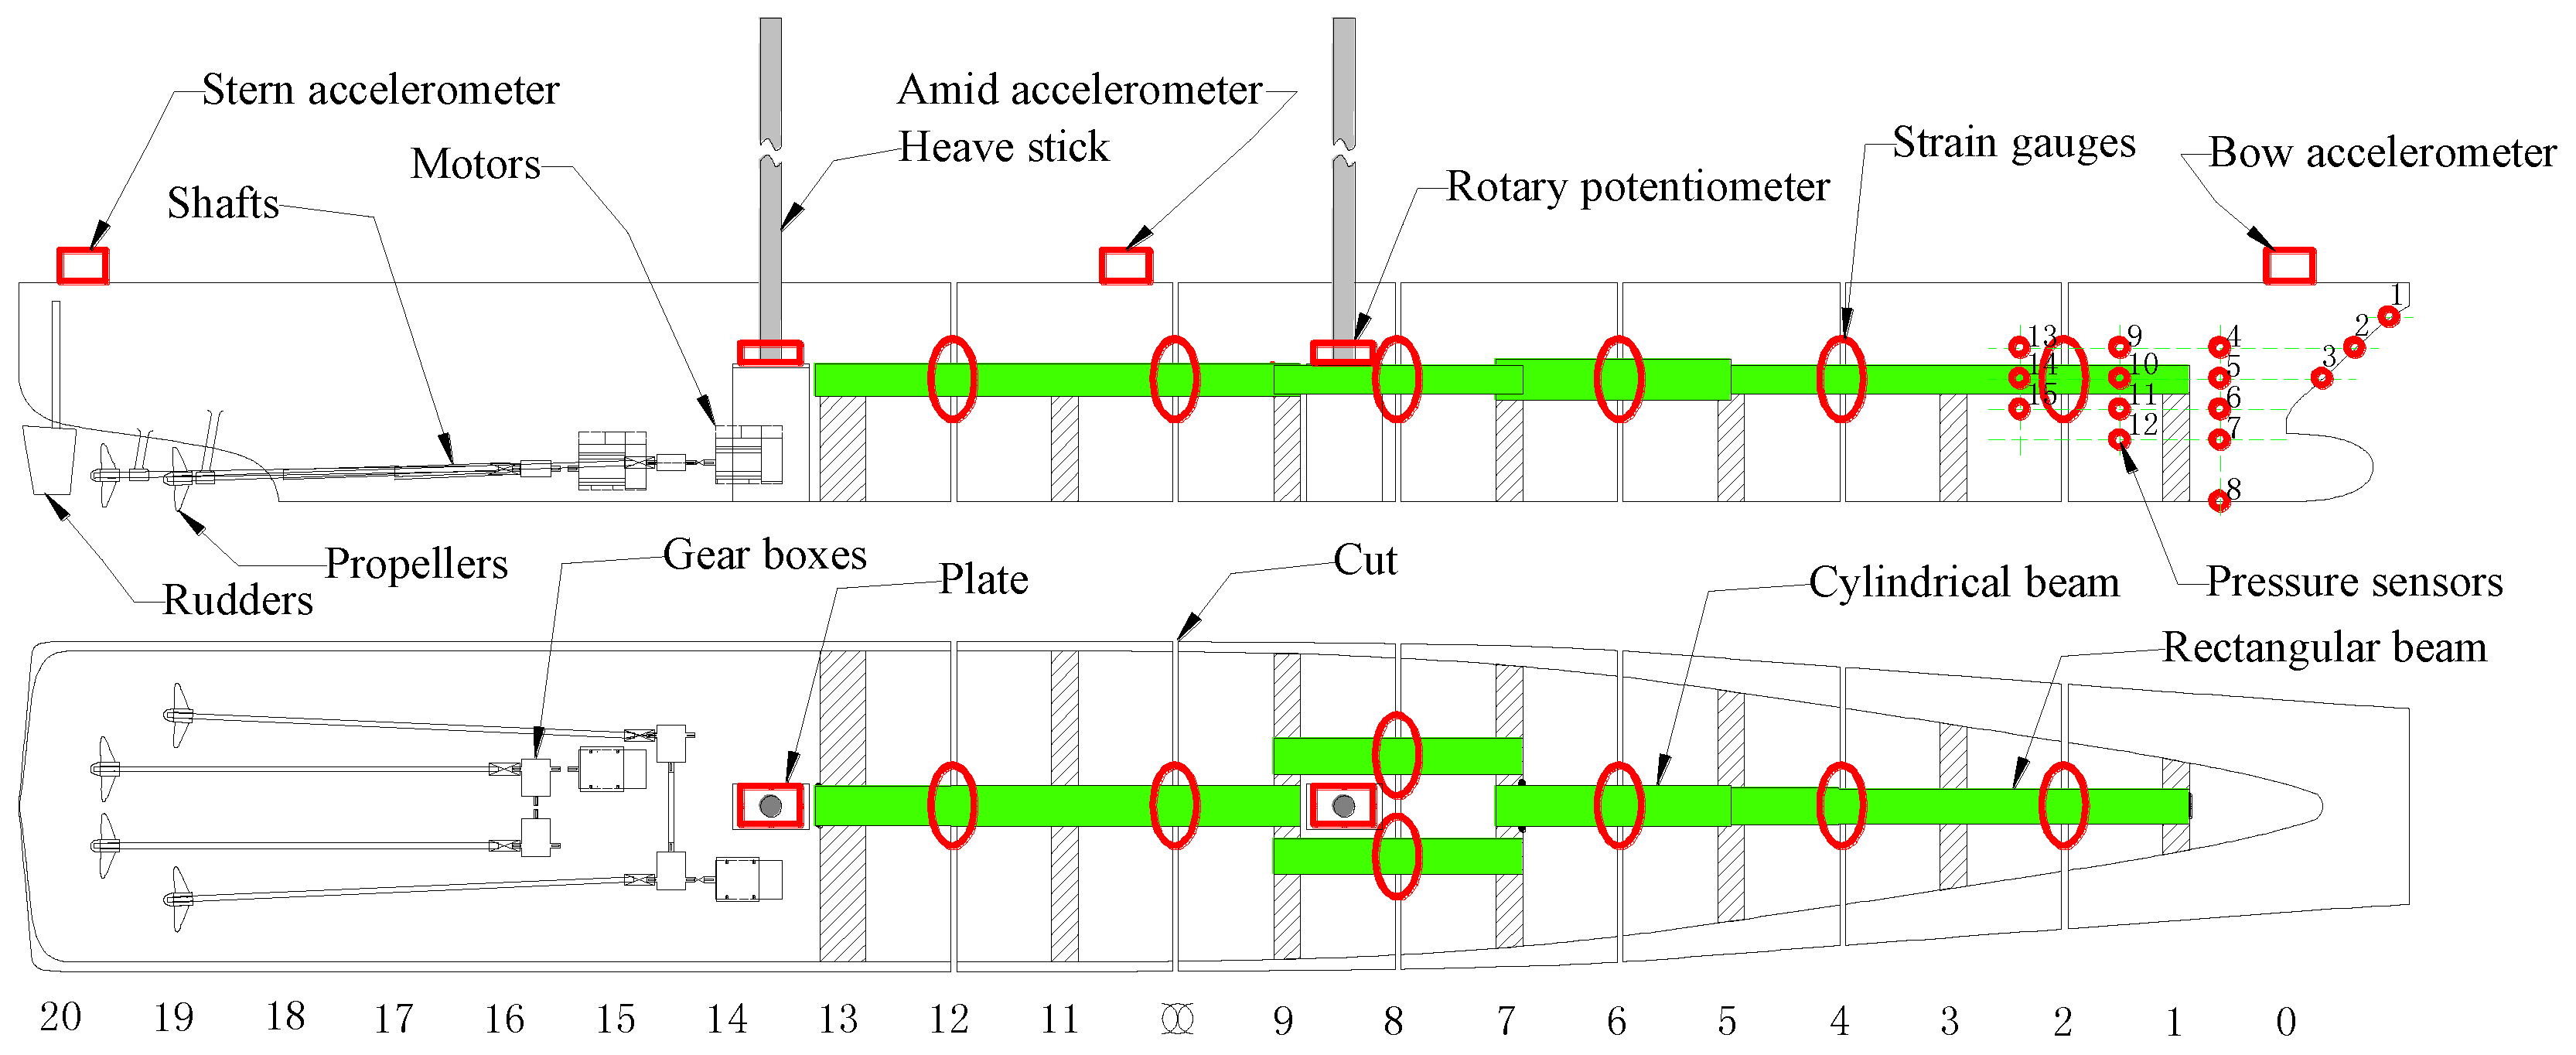
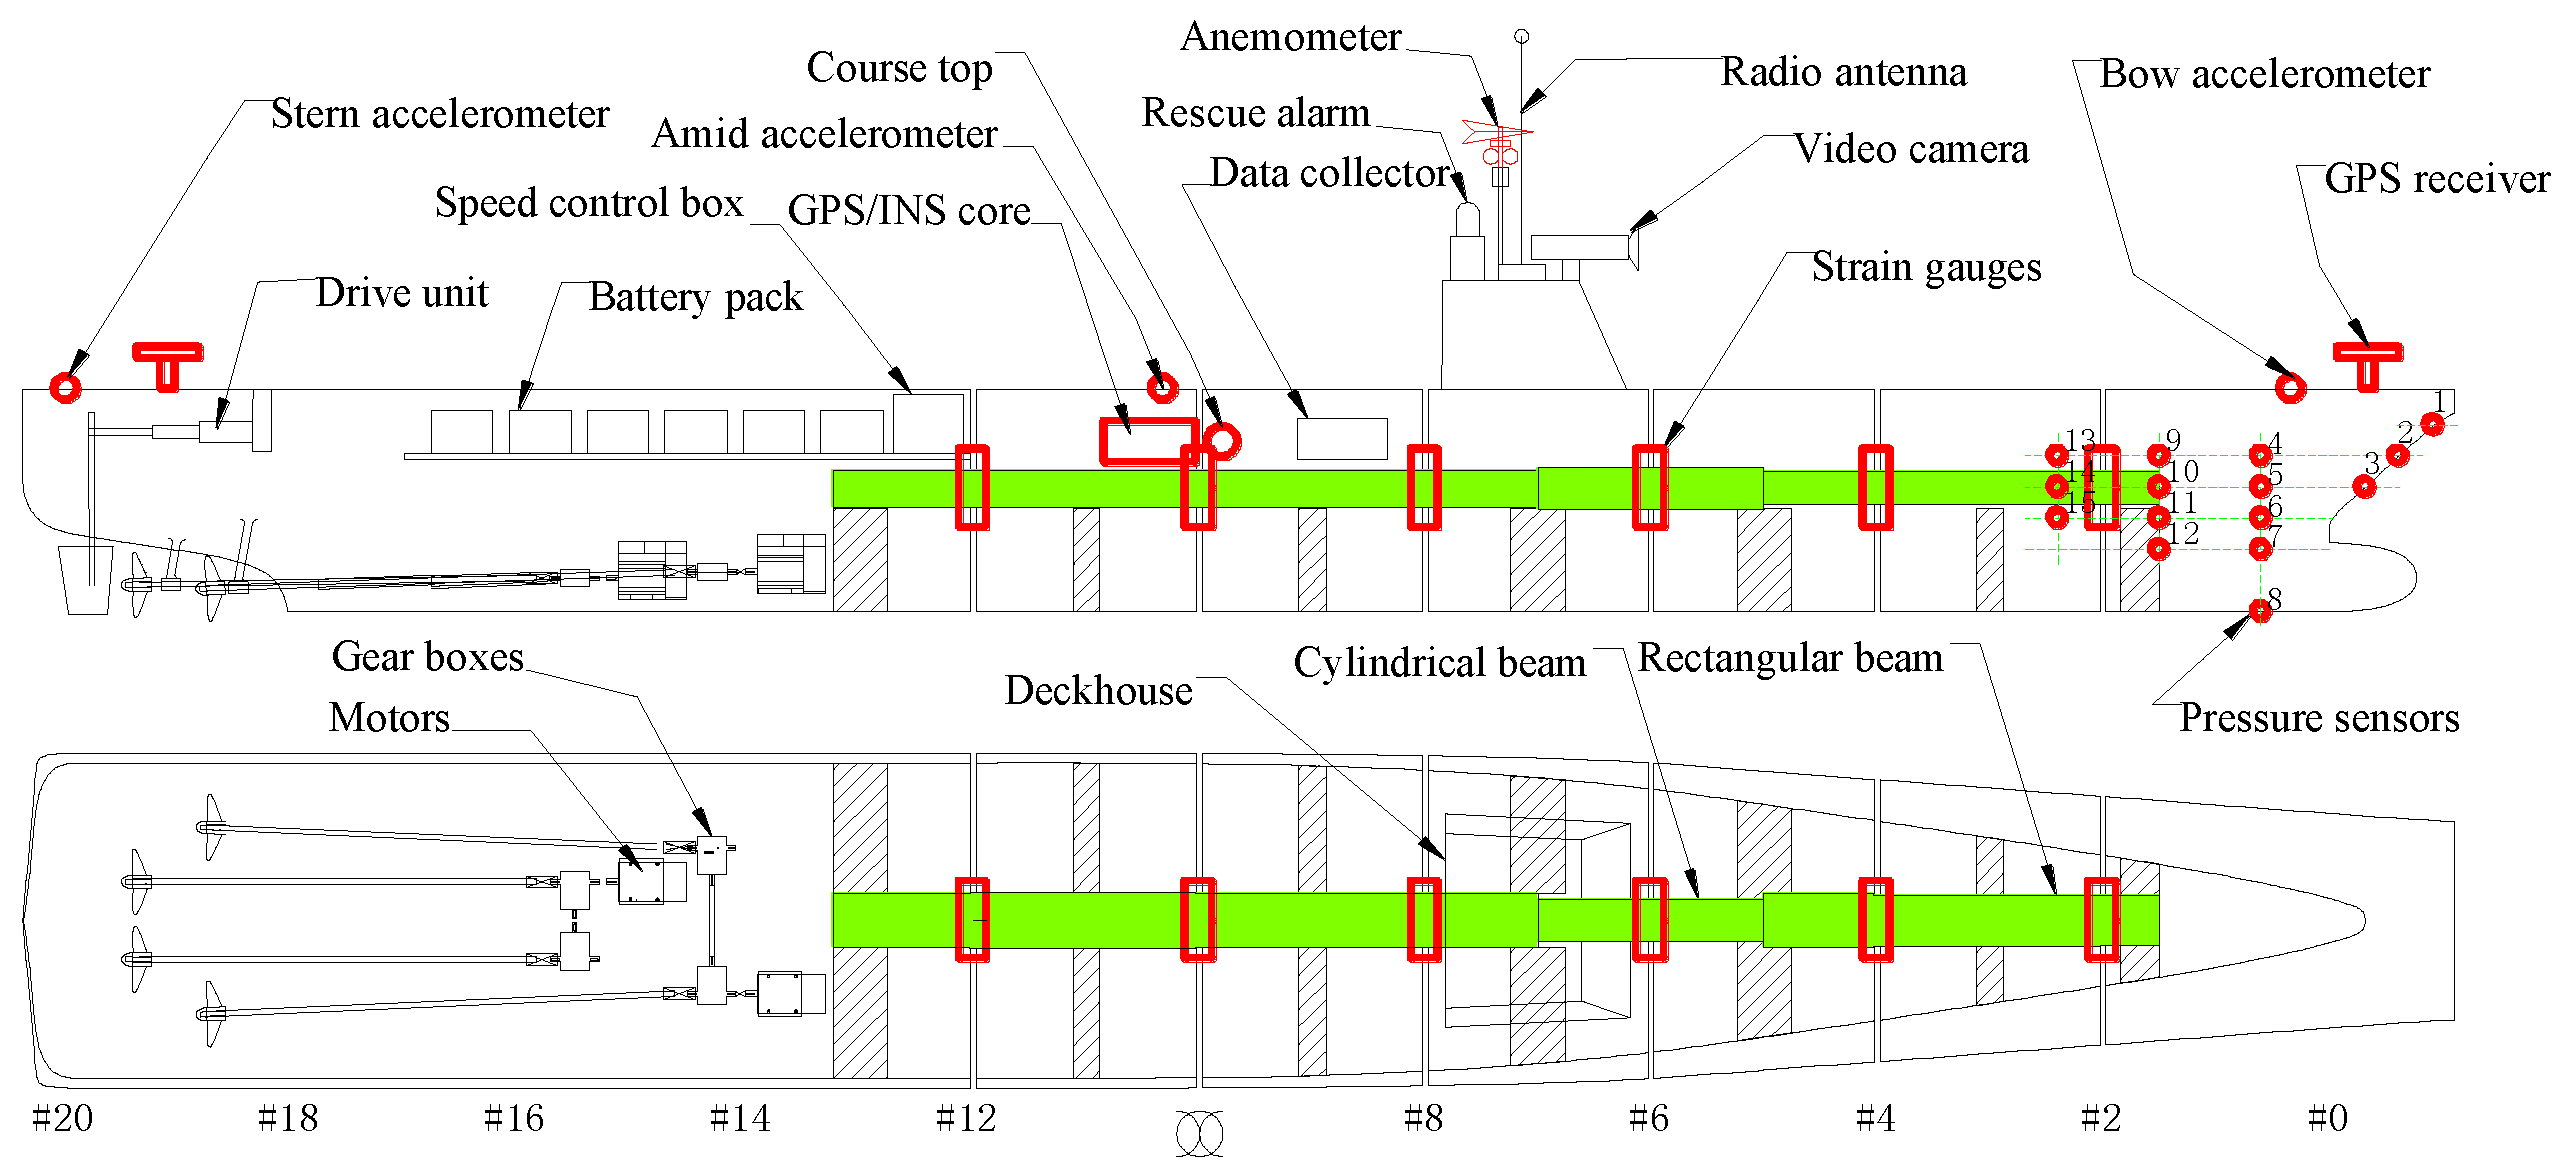
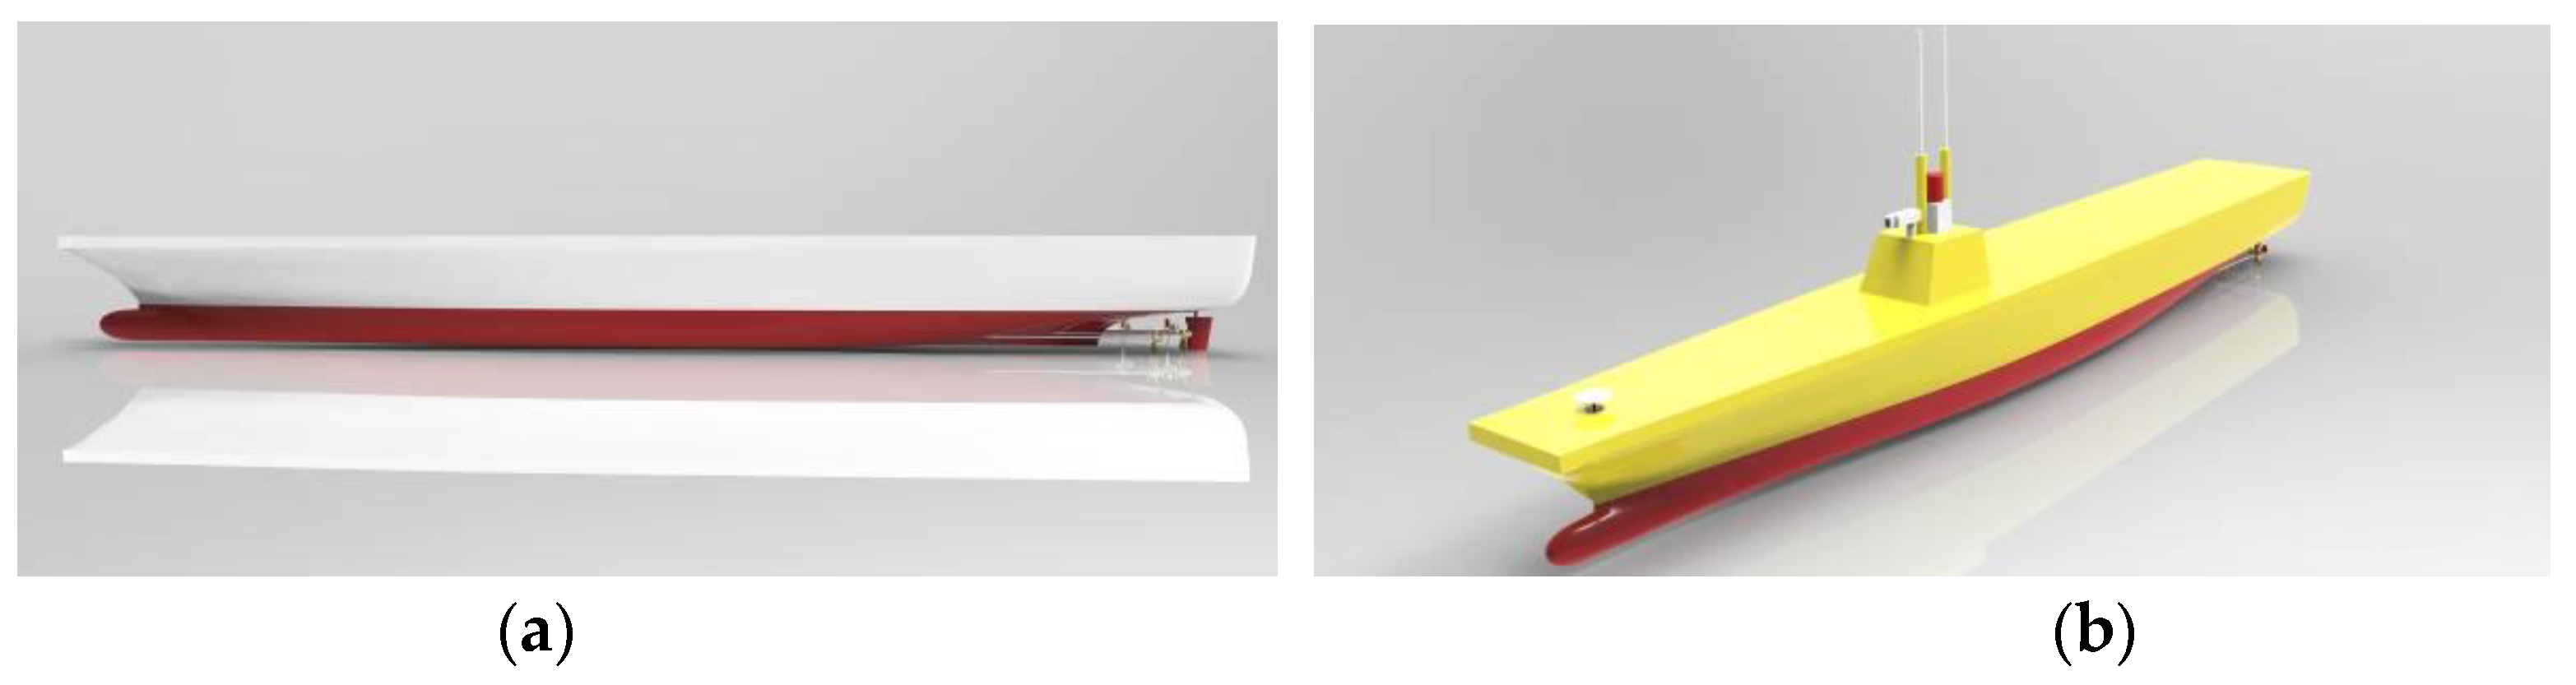
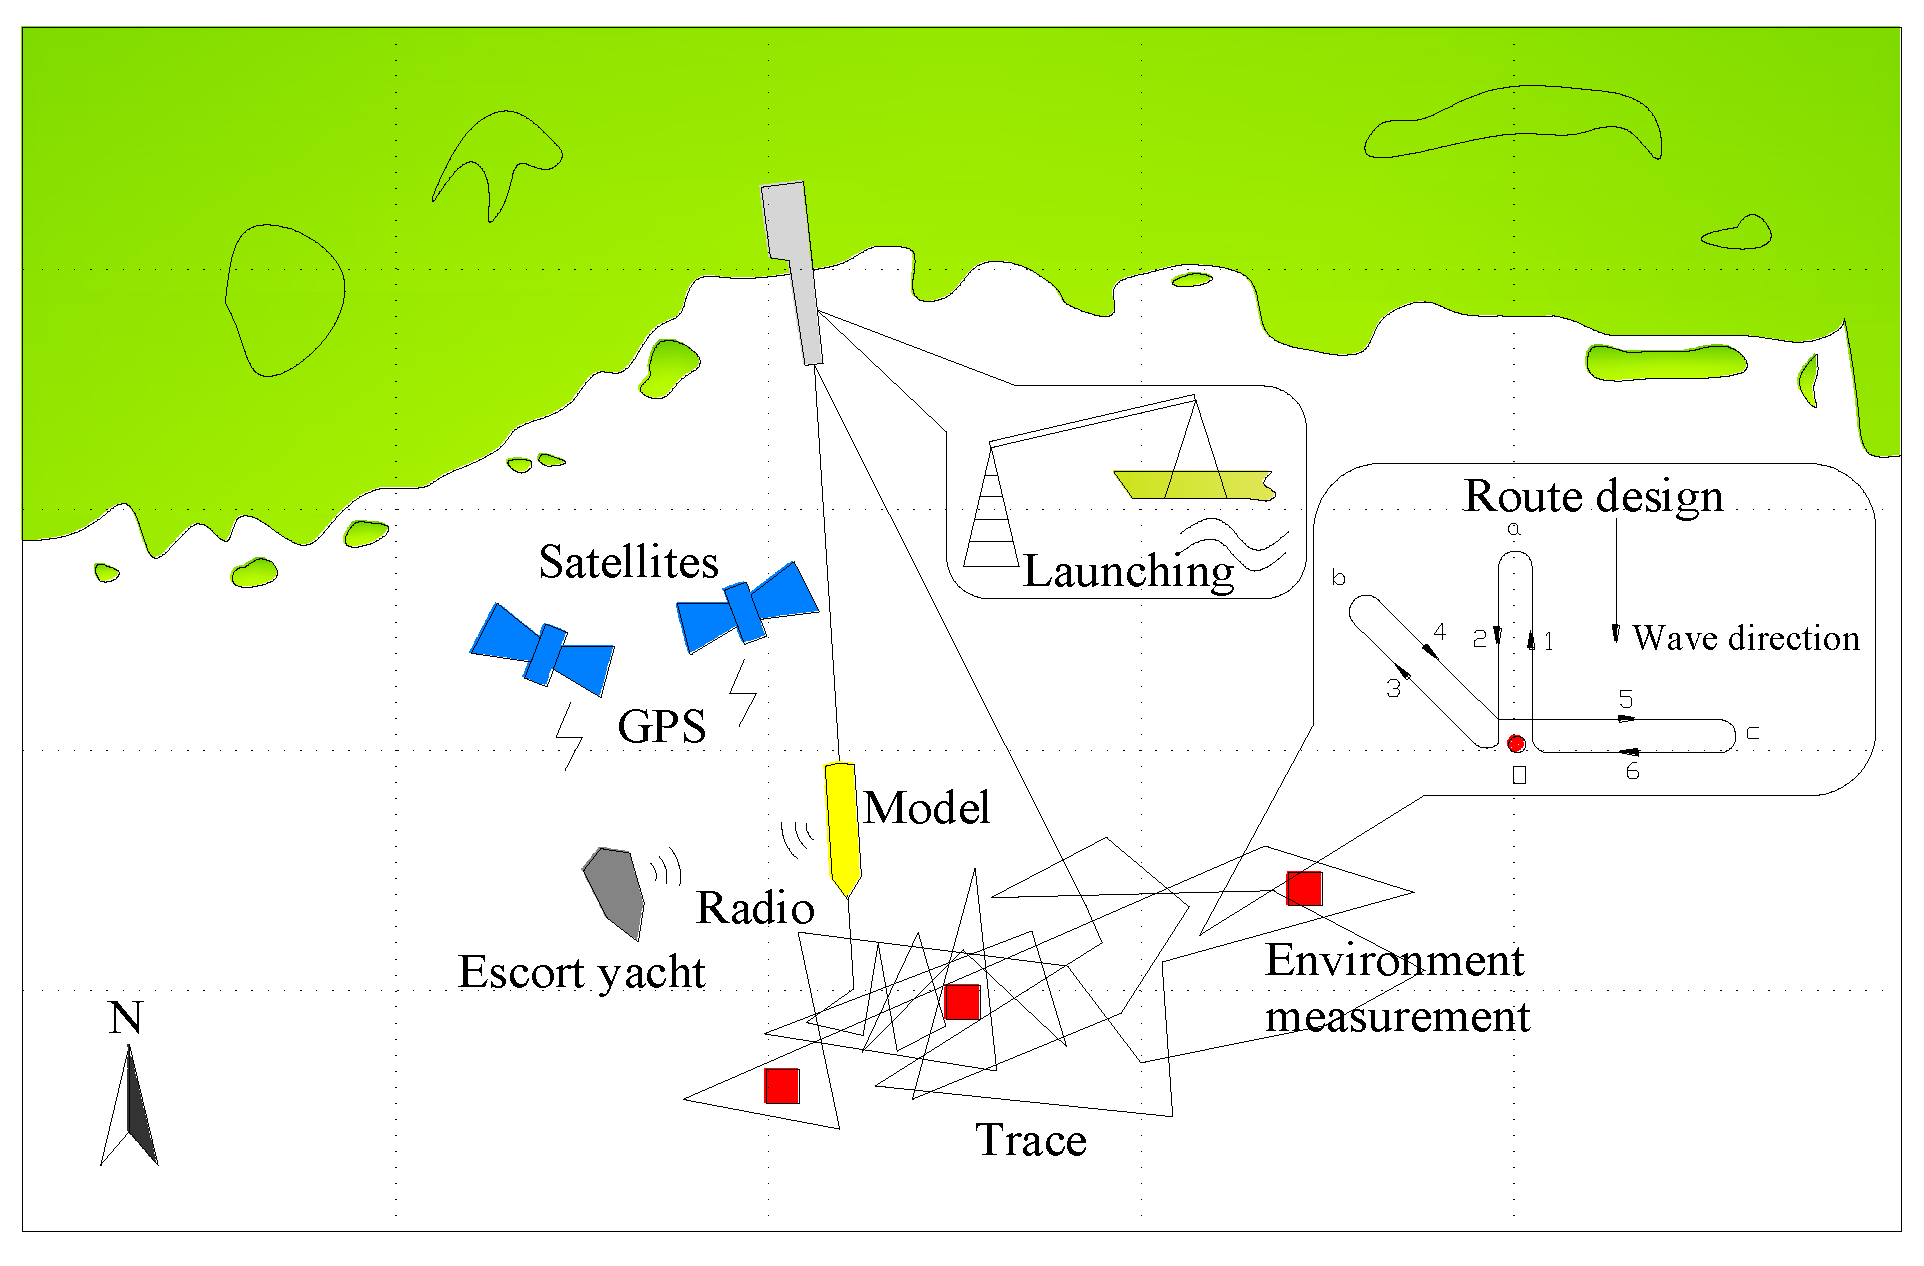
A corresponding 1/25 large-scale model hull was constructed using FRP material with a mean thickness of 10 mm. The model’s scale ratio was determined as a compromise between budget cost and technique feasibility. The large-scale model setup and sensors arrangement are almost the same as the small-scale model. The conceptual design of the large-scale model equipment is shown in
Figure 12. The large-scale free-running model was equipped with all the advanced sensors and devices necessary to fulfill the sea trial campaign, which is shown in
Figure 13.
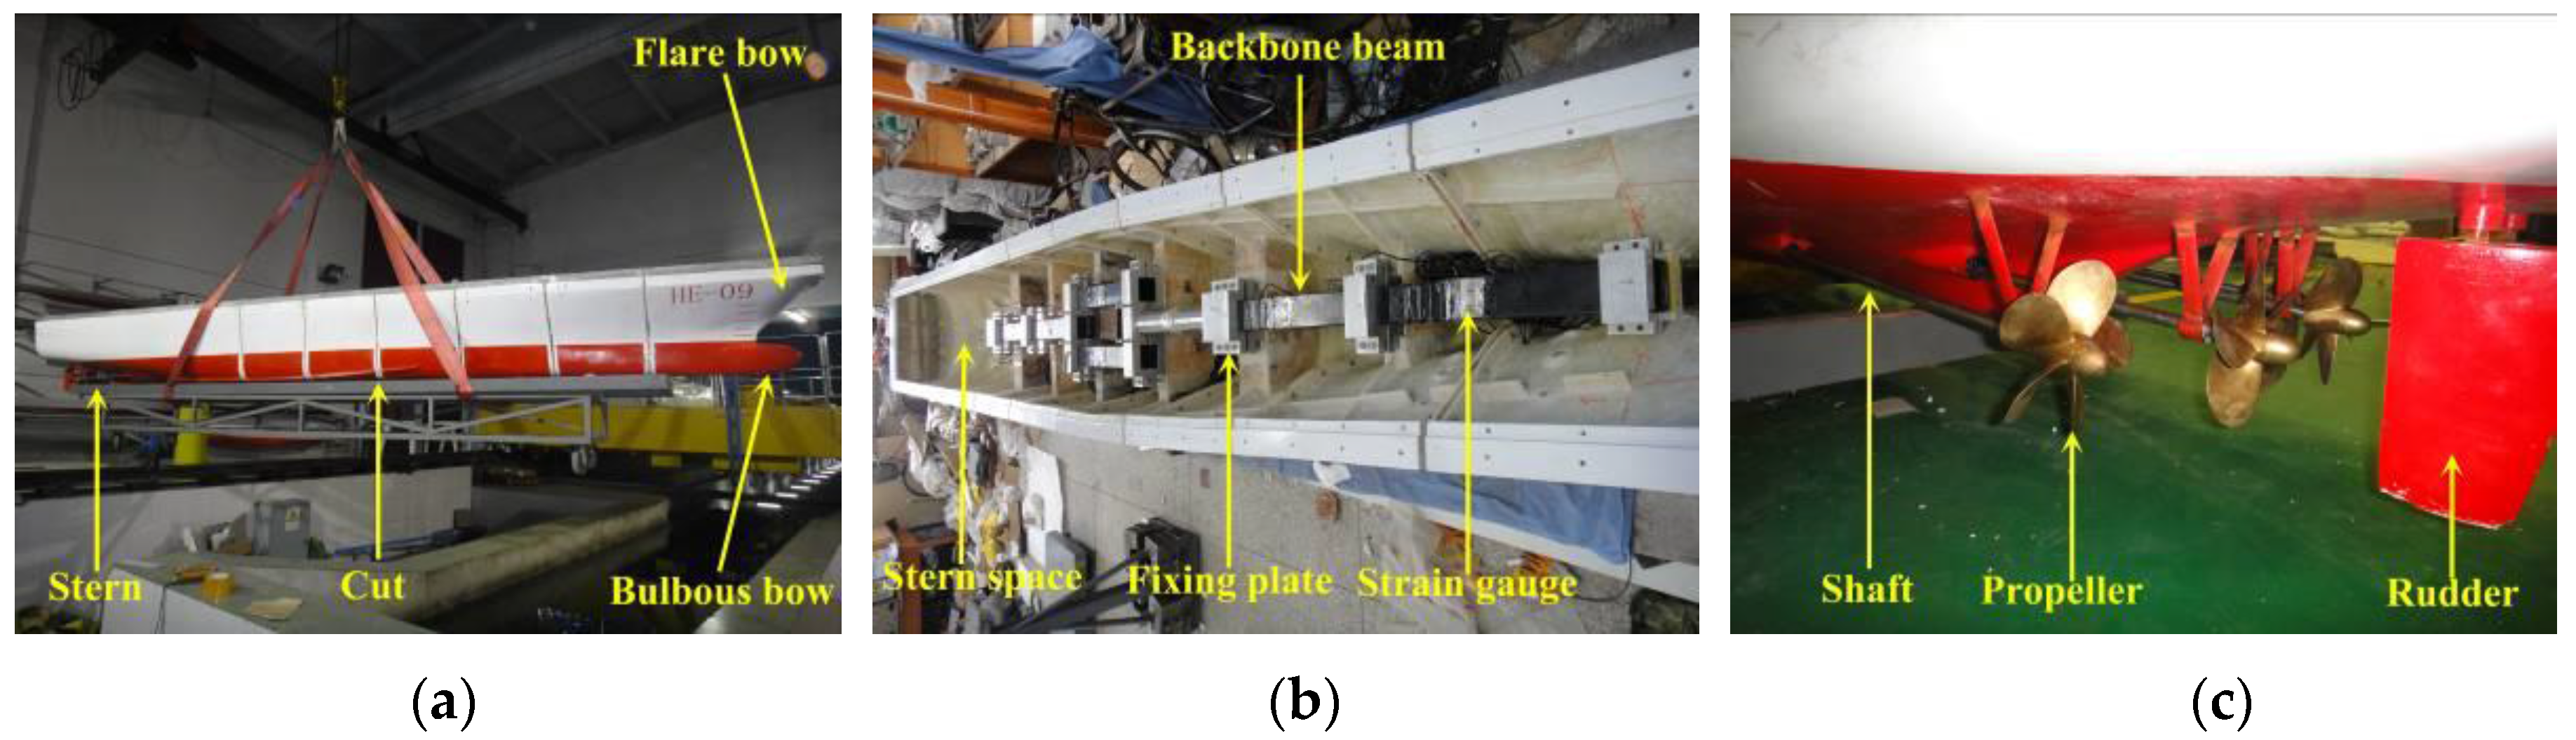
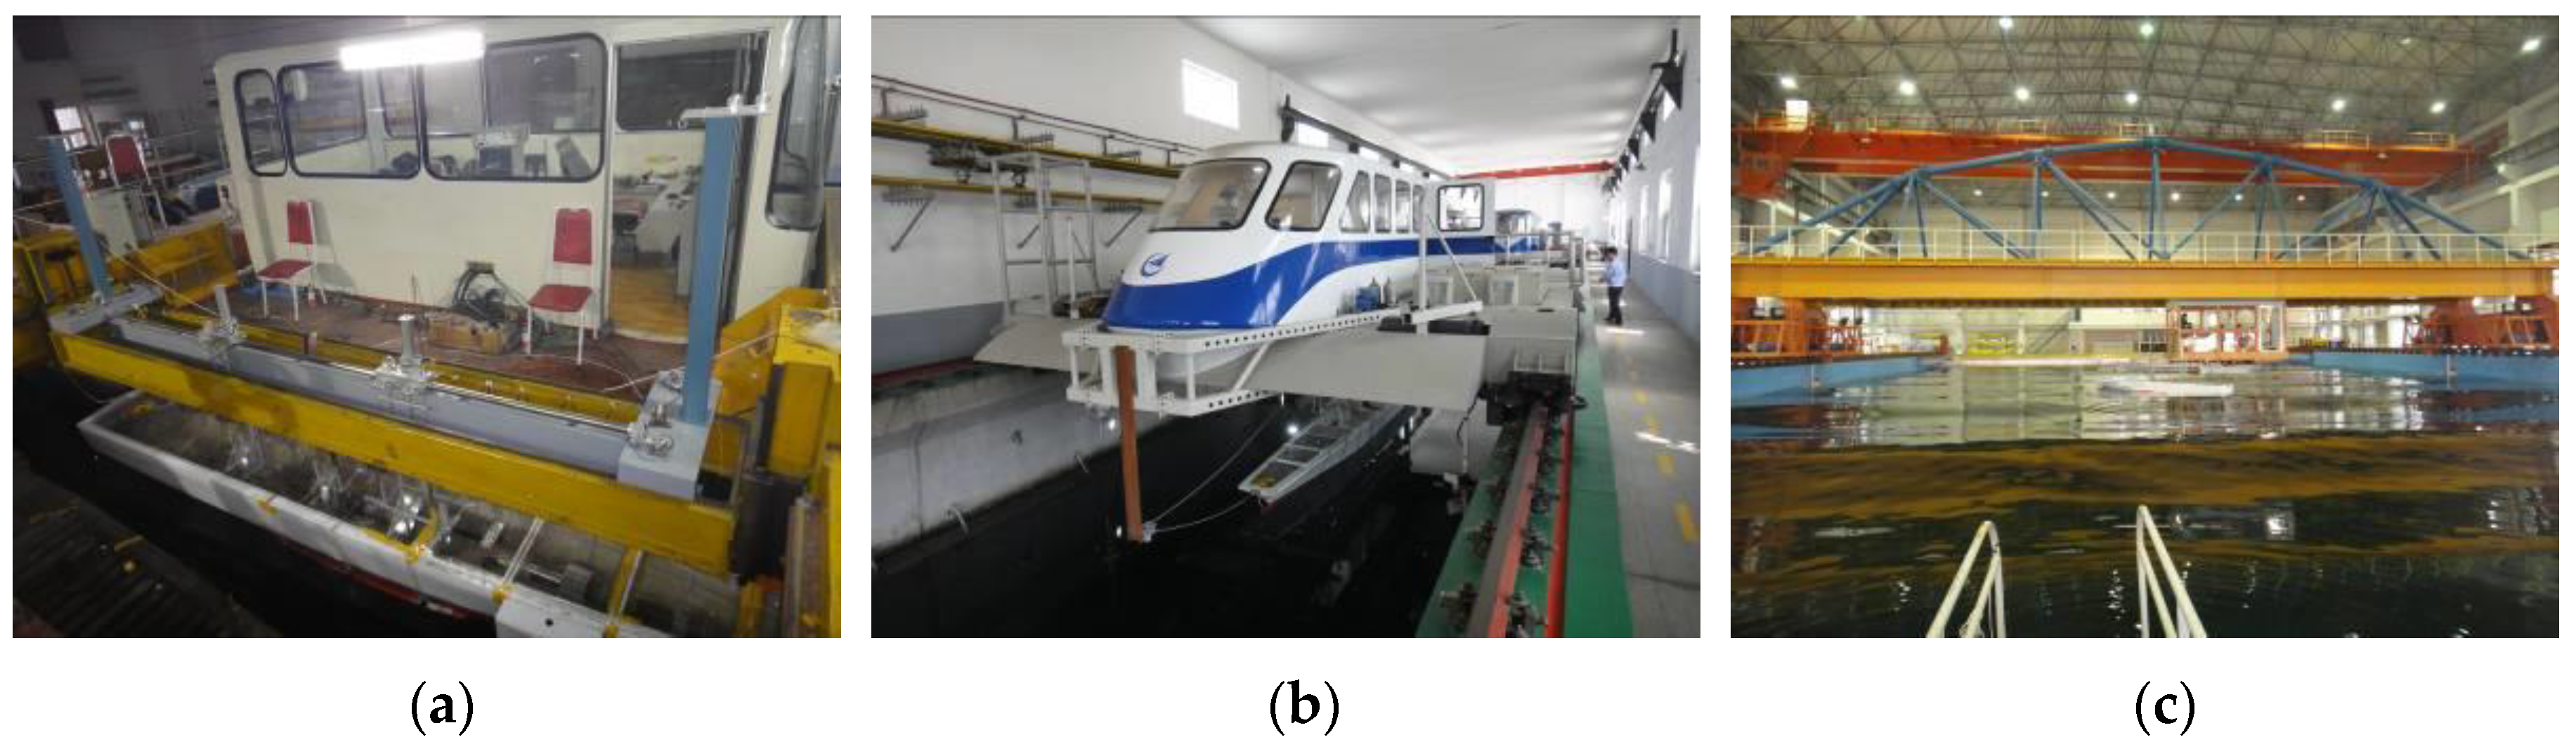
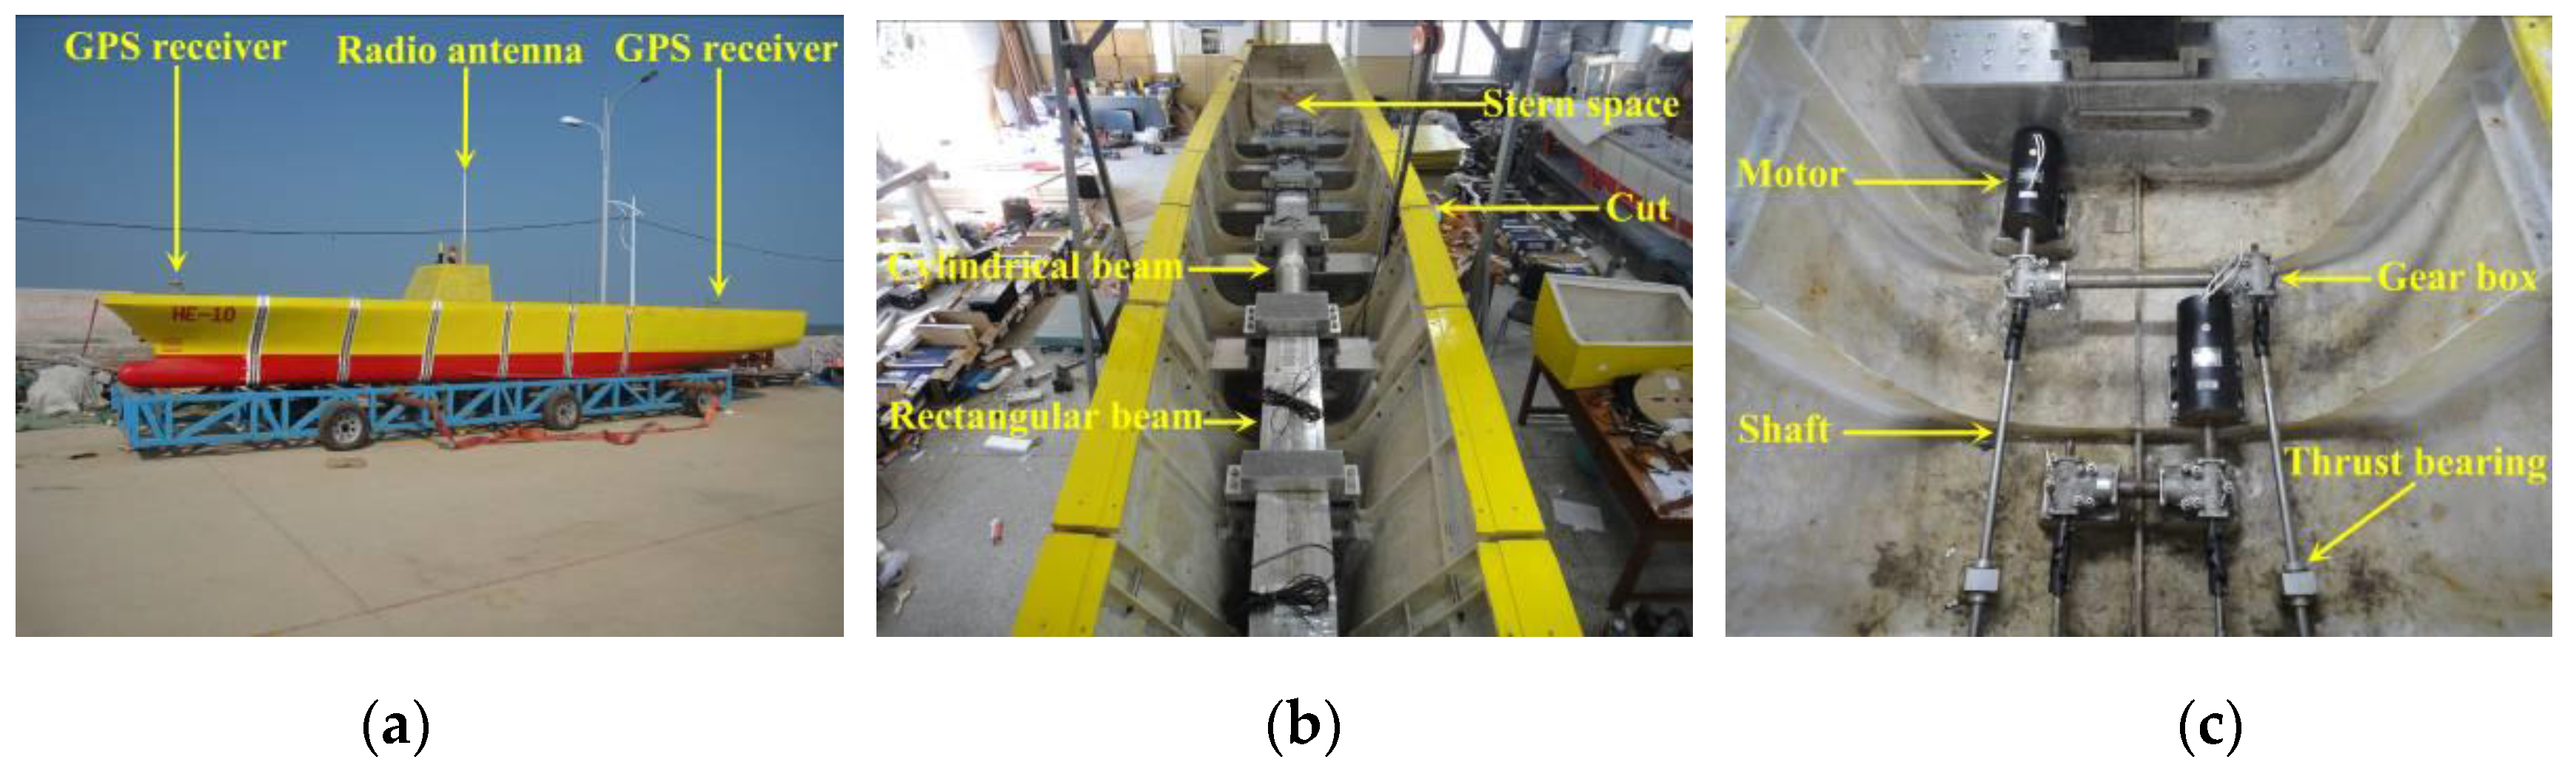
Overview of the large-scale physical model onshore is shown in
Figure 14a. A set of backbone beam was designed to reflect the vibration mode characteristics of hull girder at model scale. The steel backbone system comprises two rectangular beams and a cylindrical beam, which is shown in
Figure 14b. Four screw-propellers, driven by two motors that are used to propel the large model, are shown in
Figure 14c.
4.2. Ocean Environment Monitoring Sensors
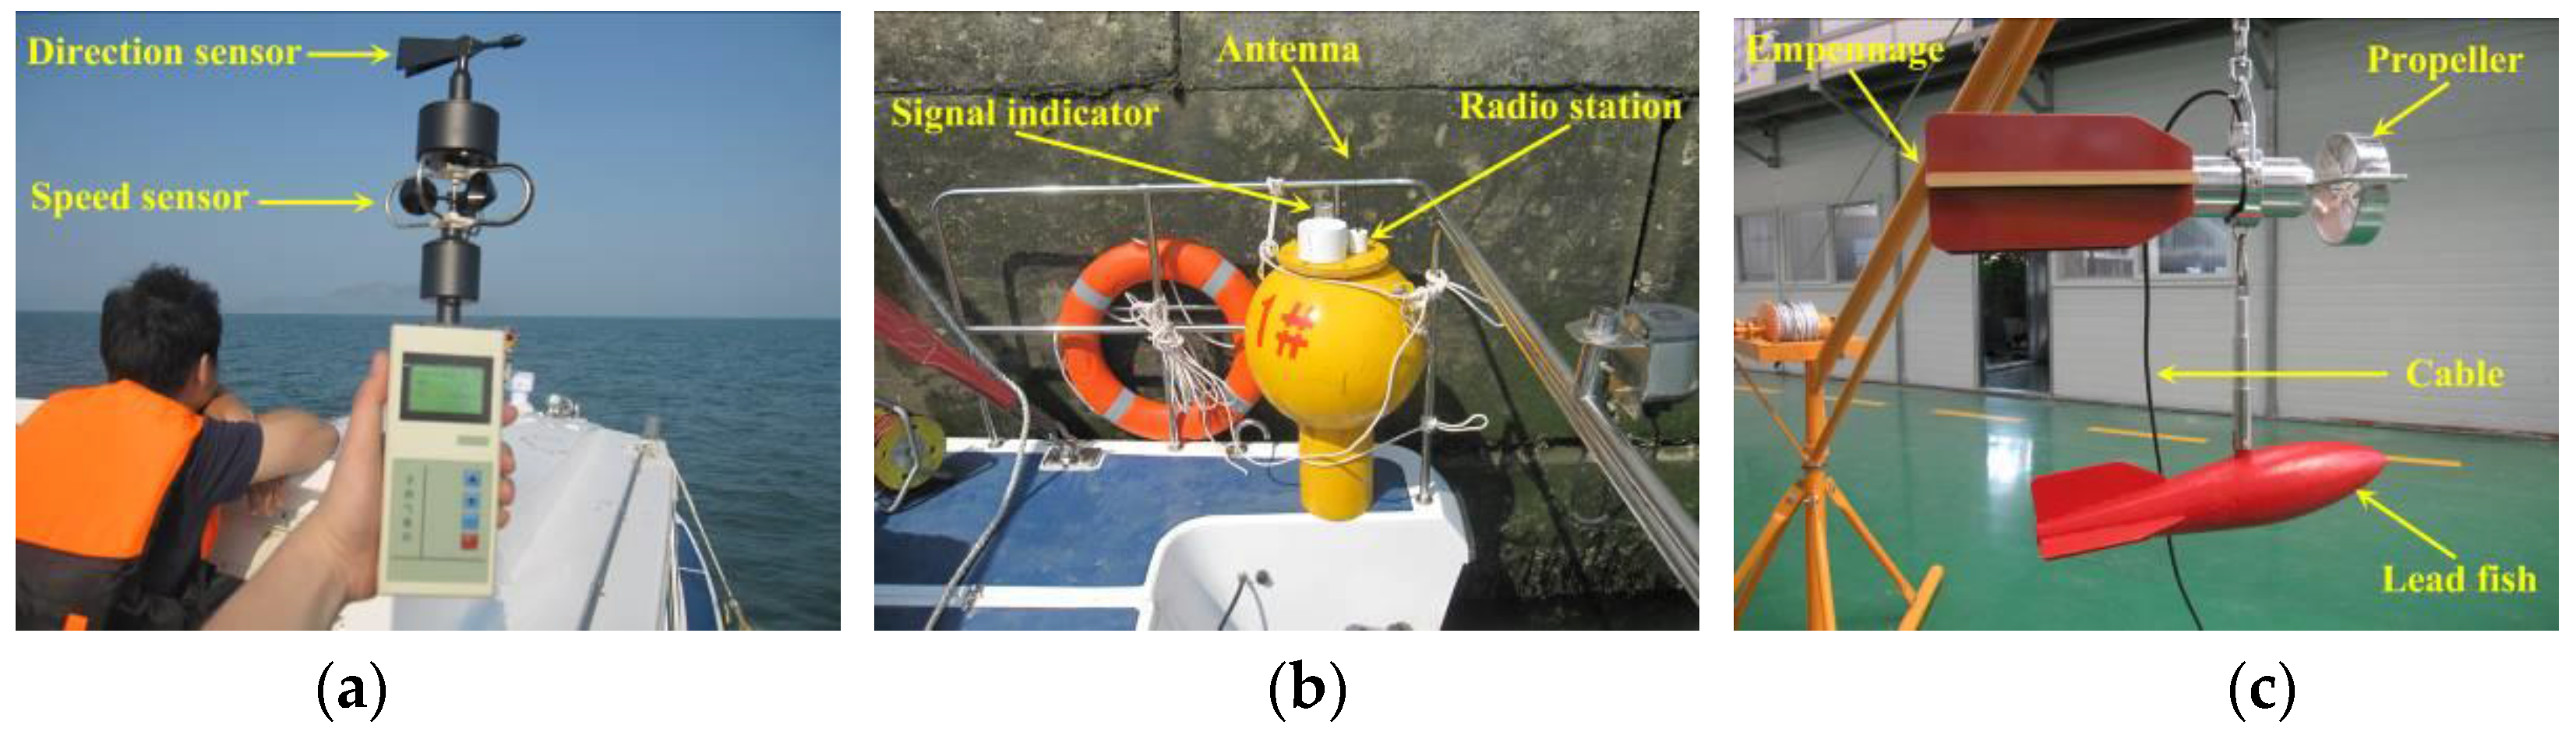
Measurement of environmental parameters, such as wind, waves and current, is the fundamental work during the sea trials. View of the anemometer, wave buoy and tachometer adopted for environment measurement are shown in
Figure 15. During the measurement, these pieces of equipment are carried by an auxiliary boat, which will be anchored during in situ environment measurement. The environment measuring locations should be at the center of model sailing trace.
Two anemometers are used to record the wind information: one is mounted on the top of model’s deckhouse to measure the relative wind speed and direction with respect to the advancing model; the other is mounted on the mast top of the environment measuring boat to measure the absolutely wind speed and direction. A set of wind data including mean speed, maximum speed and mean direction will be recorded every one minute. The measurement range of wind speed lies within 0–30 m/s, and the measurement accuracy is 0.3 m/s.
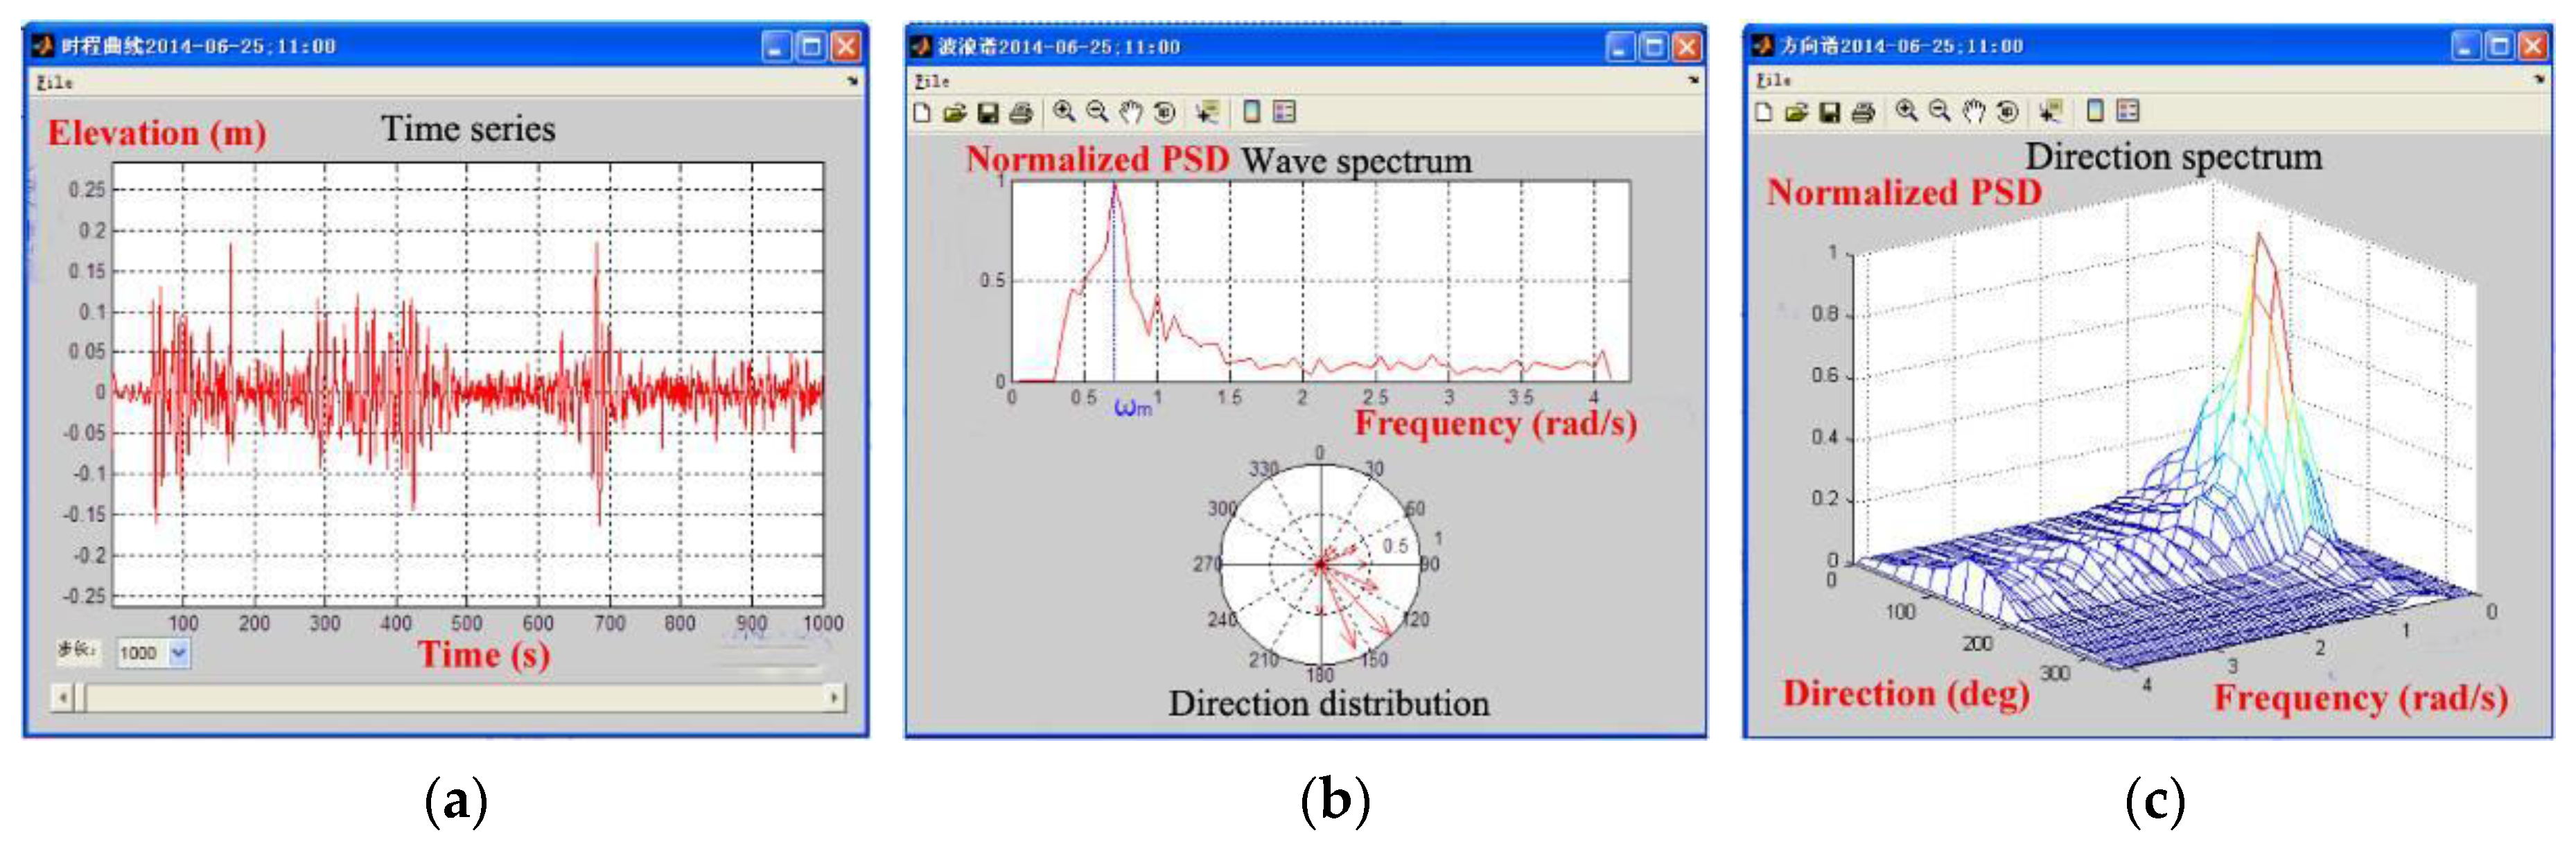
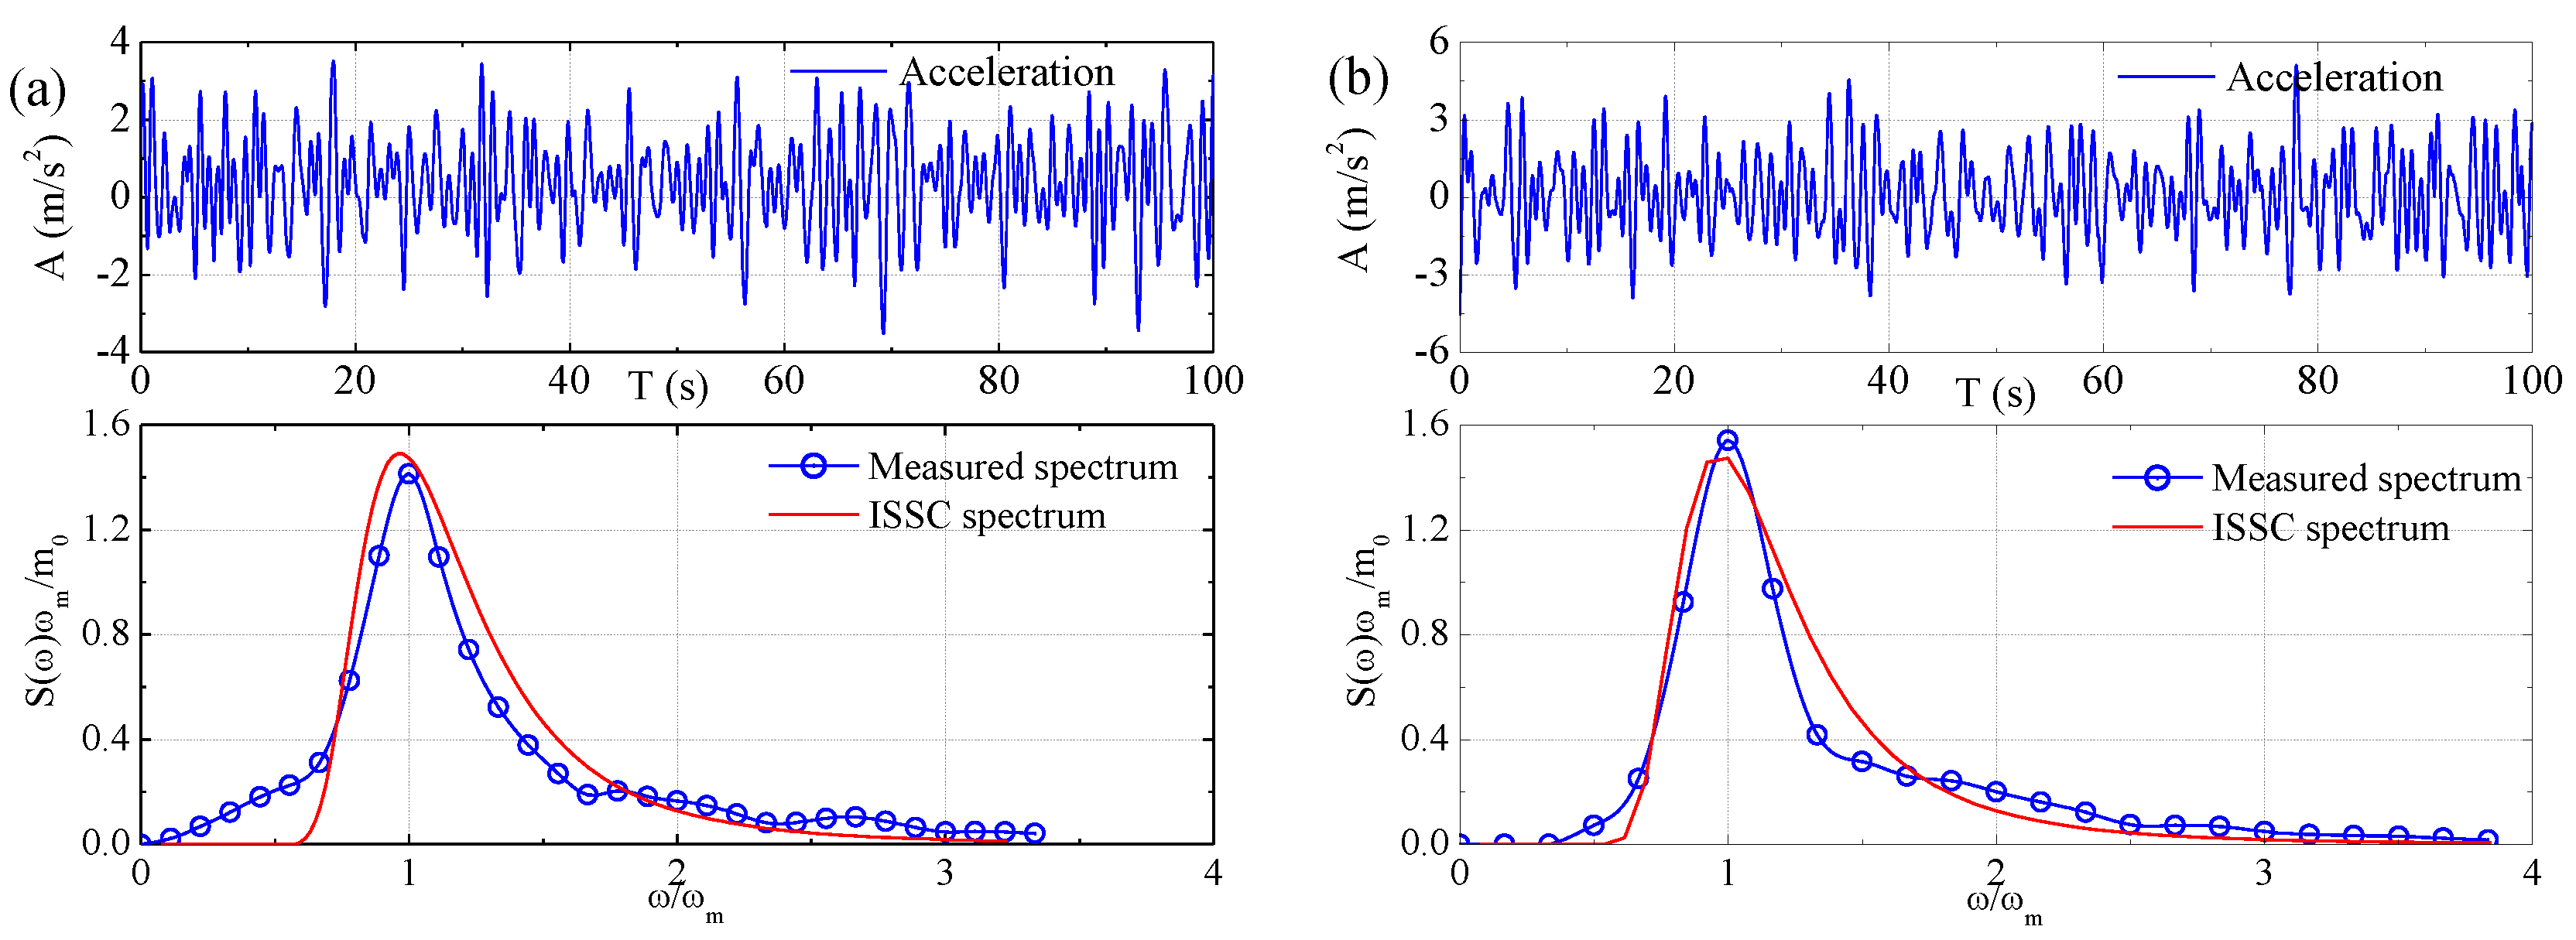
A portable directional wave buoy, developed in-house, was used to measure the 3D coastal waves. A vertical accelerometer is fitted at COG of the buoy to measure the wave surface elevation. Two inclinometers are used to sense the gradients of the wave surface in both latitudinal and longitudinal directions. In addition, a compass sensor is used to identify the real-time azimuth since the buoy will rotate in waves. The lower part of the buoy is designed to be immersed in water during measurement, and the buoy moves synchronously with respect to wave surface. The measured wave data is transmitted to the laptop on the auxiliary boat for storage via radio. Based on the measured data, the directional wave spectrum is determined by a Fourier transformation based algorithm (see
Figure 16) [
30]. Then, the significant wave height, mean period, and directional distribution are obtained based on the estimated wave spectrum. The measurement range of wave height lies within 0.02–1 m, and the measurement accuracy is 0.005 m.
A tachometer is used to measure the absolute speed and direction of ocean current. A heavy streamlined lead fish is hanged at the bottom of the tachometer to stabilize it even in turbulence flow. During measurement, the direction of the tachometer will be in accordance with the current direction with the help of its empennage. The current speed is derived by the revolutions per minute of the propeller. The tachometer has an accuracy of direction of within 4° and speed of within 1 cm/s. The mean current speed and direction are calculated for every preset duration (e.g., 15 s, 30 s, 60 s or 15 min) and transmitted for storage by local cable.
4.3. Fiber Optic Sensor
Although considerable efforts can be made in predictions of ship wave loads during prototype design stage, there is still a real need for real-time monitoring of the stress state of ships during their service life. A set of structural safety monitoring system, which is intended to be used for full-scale ships’ hull stress monitoring and evaluation, has recently been developed by our research team. The stress monitoring system was fitted onboard the large-scale model for a preliminary trial and validation.
The in-house developed structural safety monitoring system comprises of three modules: the stress monitoring unit, the structure strength assessment unit and the hull stress database unit [
31]. The stress monitoring unit is responsible for transforming the measured strain signal into stress in real-time. The structural strength assessment unit is used to evaluate both the fatigue strength and yield strength of hull based on the measured stress data and a developed algorithm. The hull stress database unit is used for the storage of real-time monitoring data and assessment results.
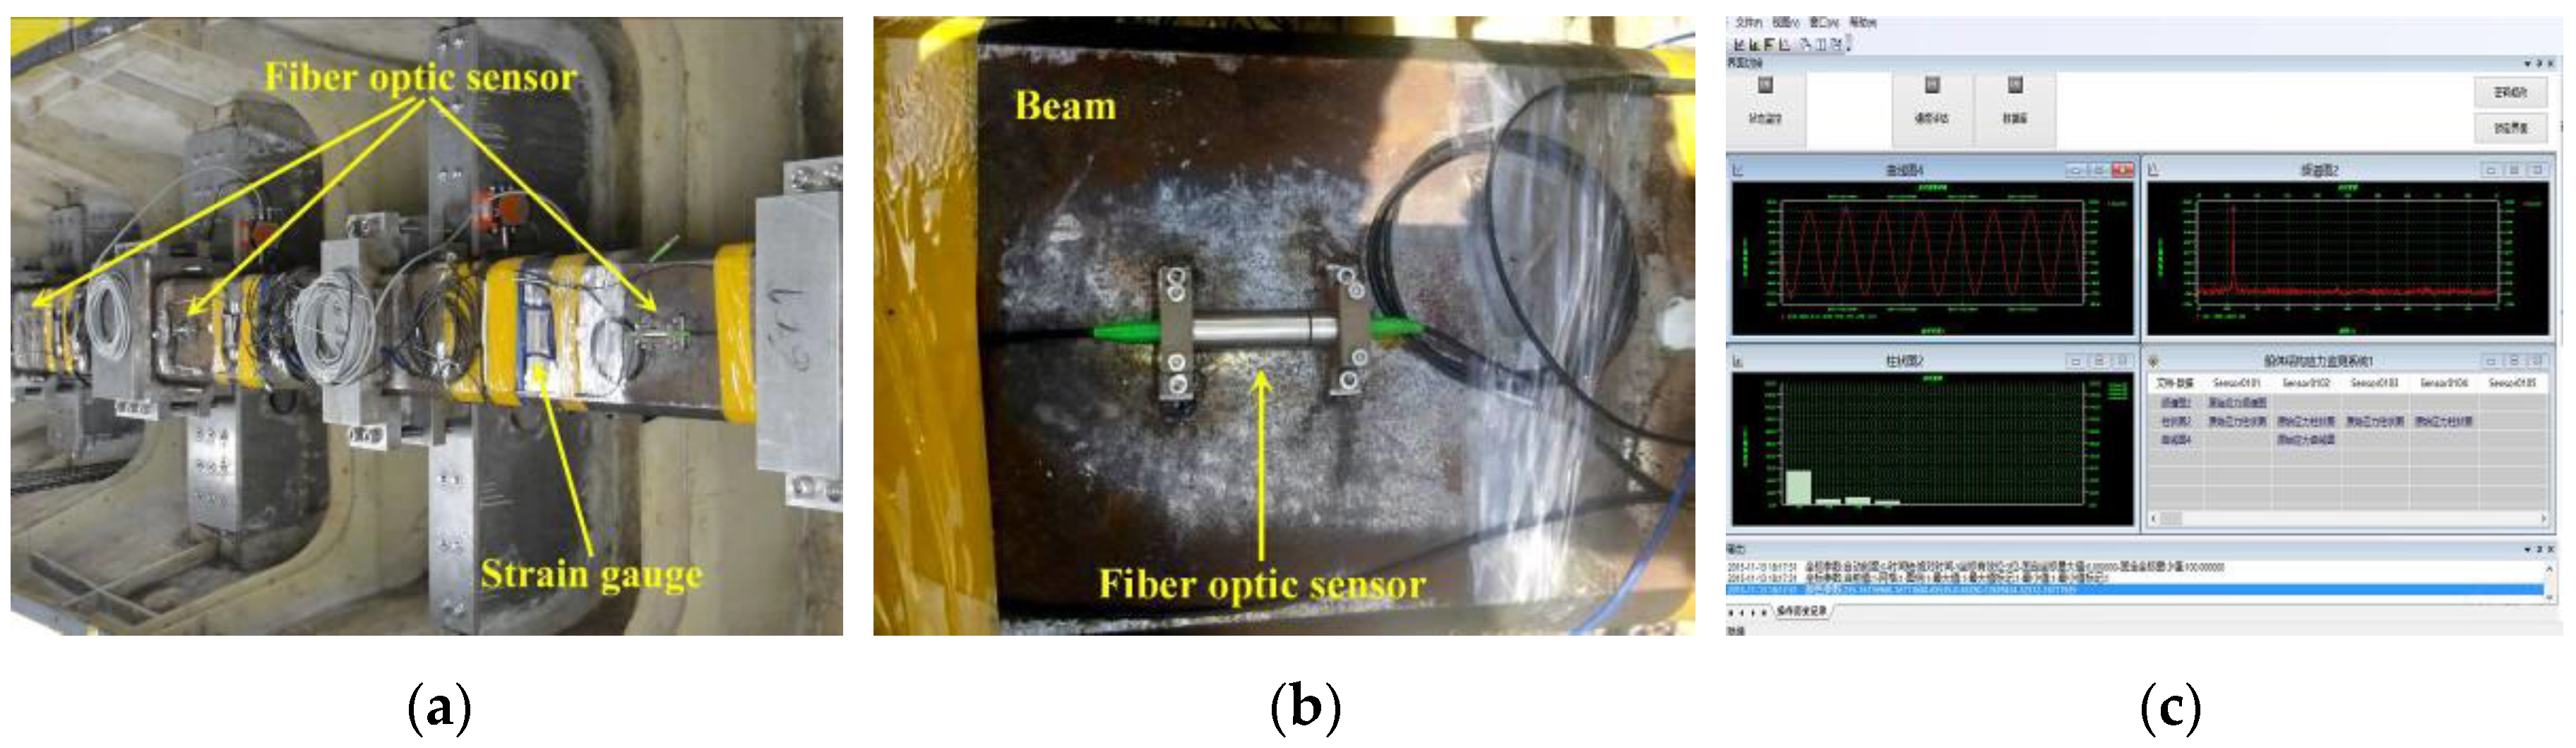
Pictures of the fiber optic sensors mounted on the backbone are shown in
Figure 17a,b. Seven fiber optic sensors were installed on the backbone beam, among which one was used for temperature compensation. It is noted that the sectional strain at the six cut divisions were measured by both the fiber optic sensors and resistance strain gauges for comparison. The optical signal detected by sensors is transformed into electrical signal with the help of an optic sensor demodulator. The fatigue strength of hull is evaluated according to the Palmgren-Miner damage summation rule, while the yield strength is evaluated based on the reliability theory. Software interface of the real time monitoring system is shown in
Figure 17c.
4.4. The GPS/INS System
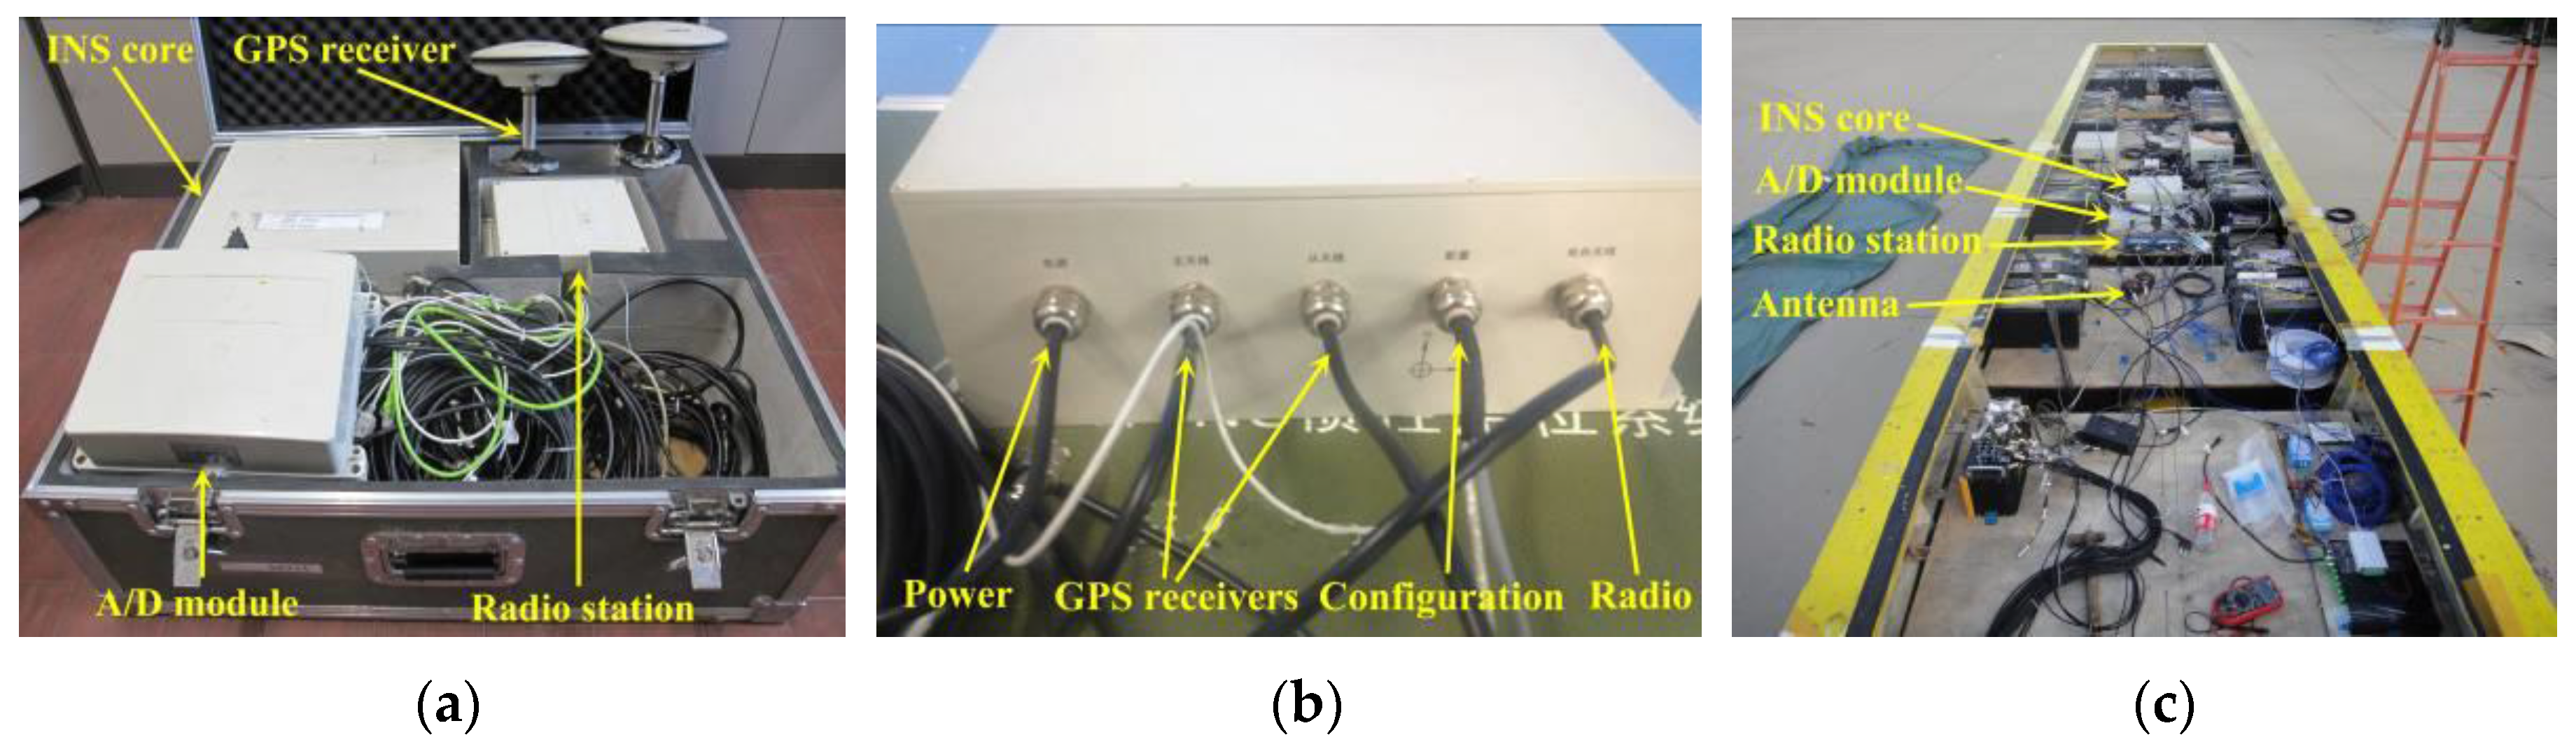
A dedicated GPS/INS device was developed for the measurement of the large-scale model’s sailing trace, position, speeds, and motions at sea. It was developed in cooperation with the Beijing Seven Dimension Information (SDI) Science and Technology Company Limited. The GPS/INS device mainly comprises an INS core unit, two GPS receivers, a pair of radio station and an Analog/Digital (A/D) conversion module (see
Figure 18a). The INS core unit is equipped with an Inertial Measurement Unit (IMU), a Global Navigation Satellite System (GNSS) and a coupling algorithm module (see
Figure 18b). The main GPS receiver was designed to be mounted at the model’s aft deck and the sub GPS receiver mounted at the forward deck (see
Figure 14a and
Figure 18c). The radio stations are used to transmit the measured model’s navigation information and RTK data to the base station onboard an escort yacht. The A/D module is used to regulate model’s sailing speed remotely, which will be described in
Section 4.5.1.
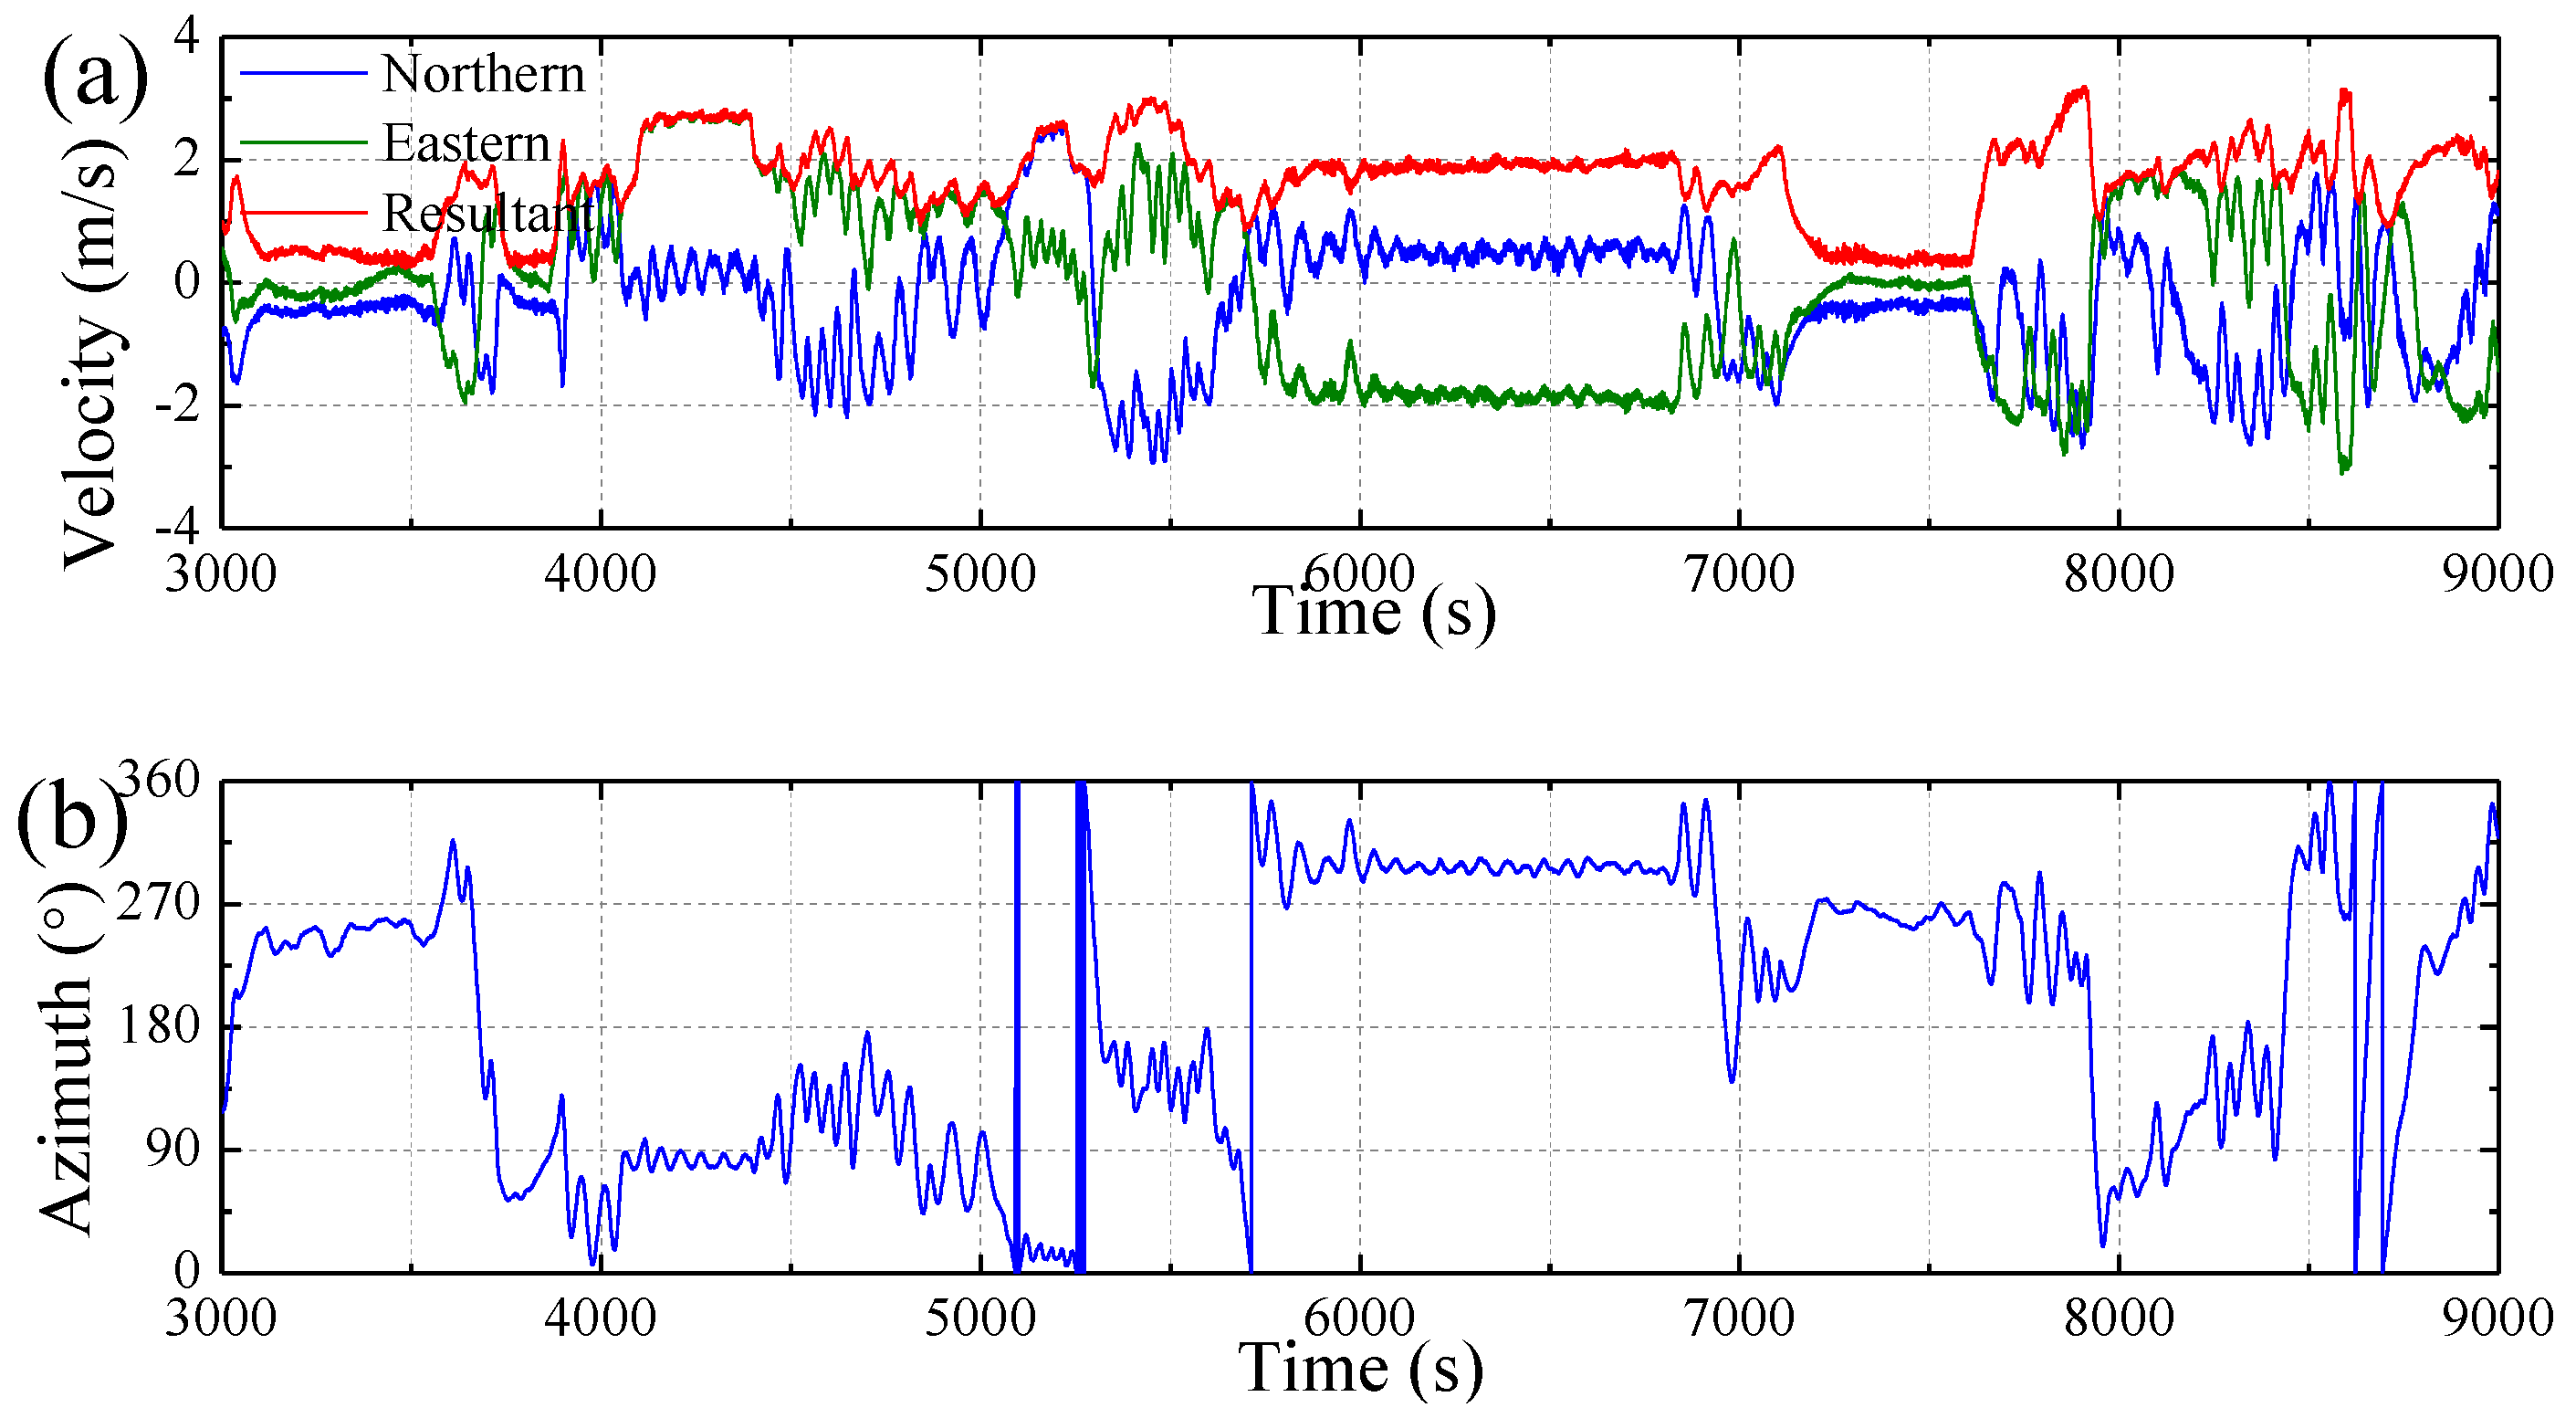
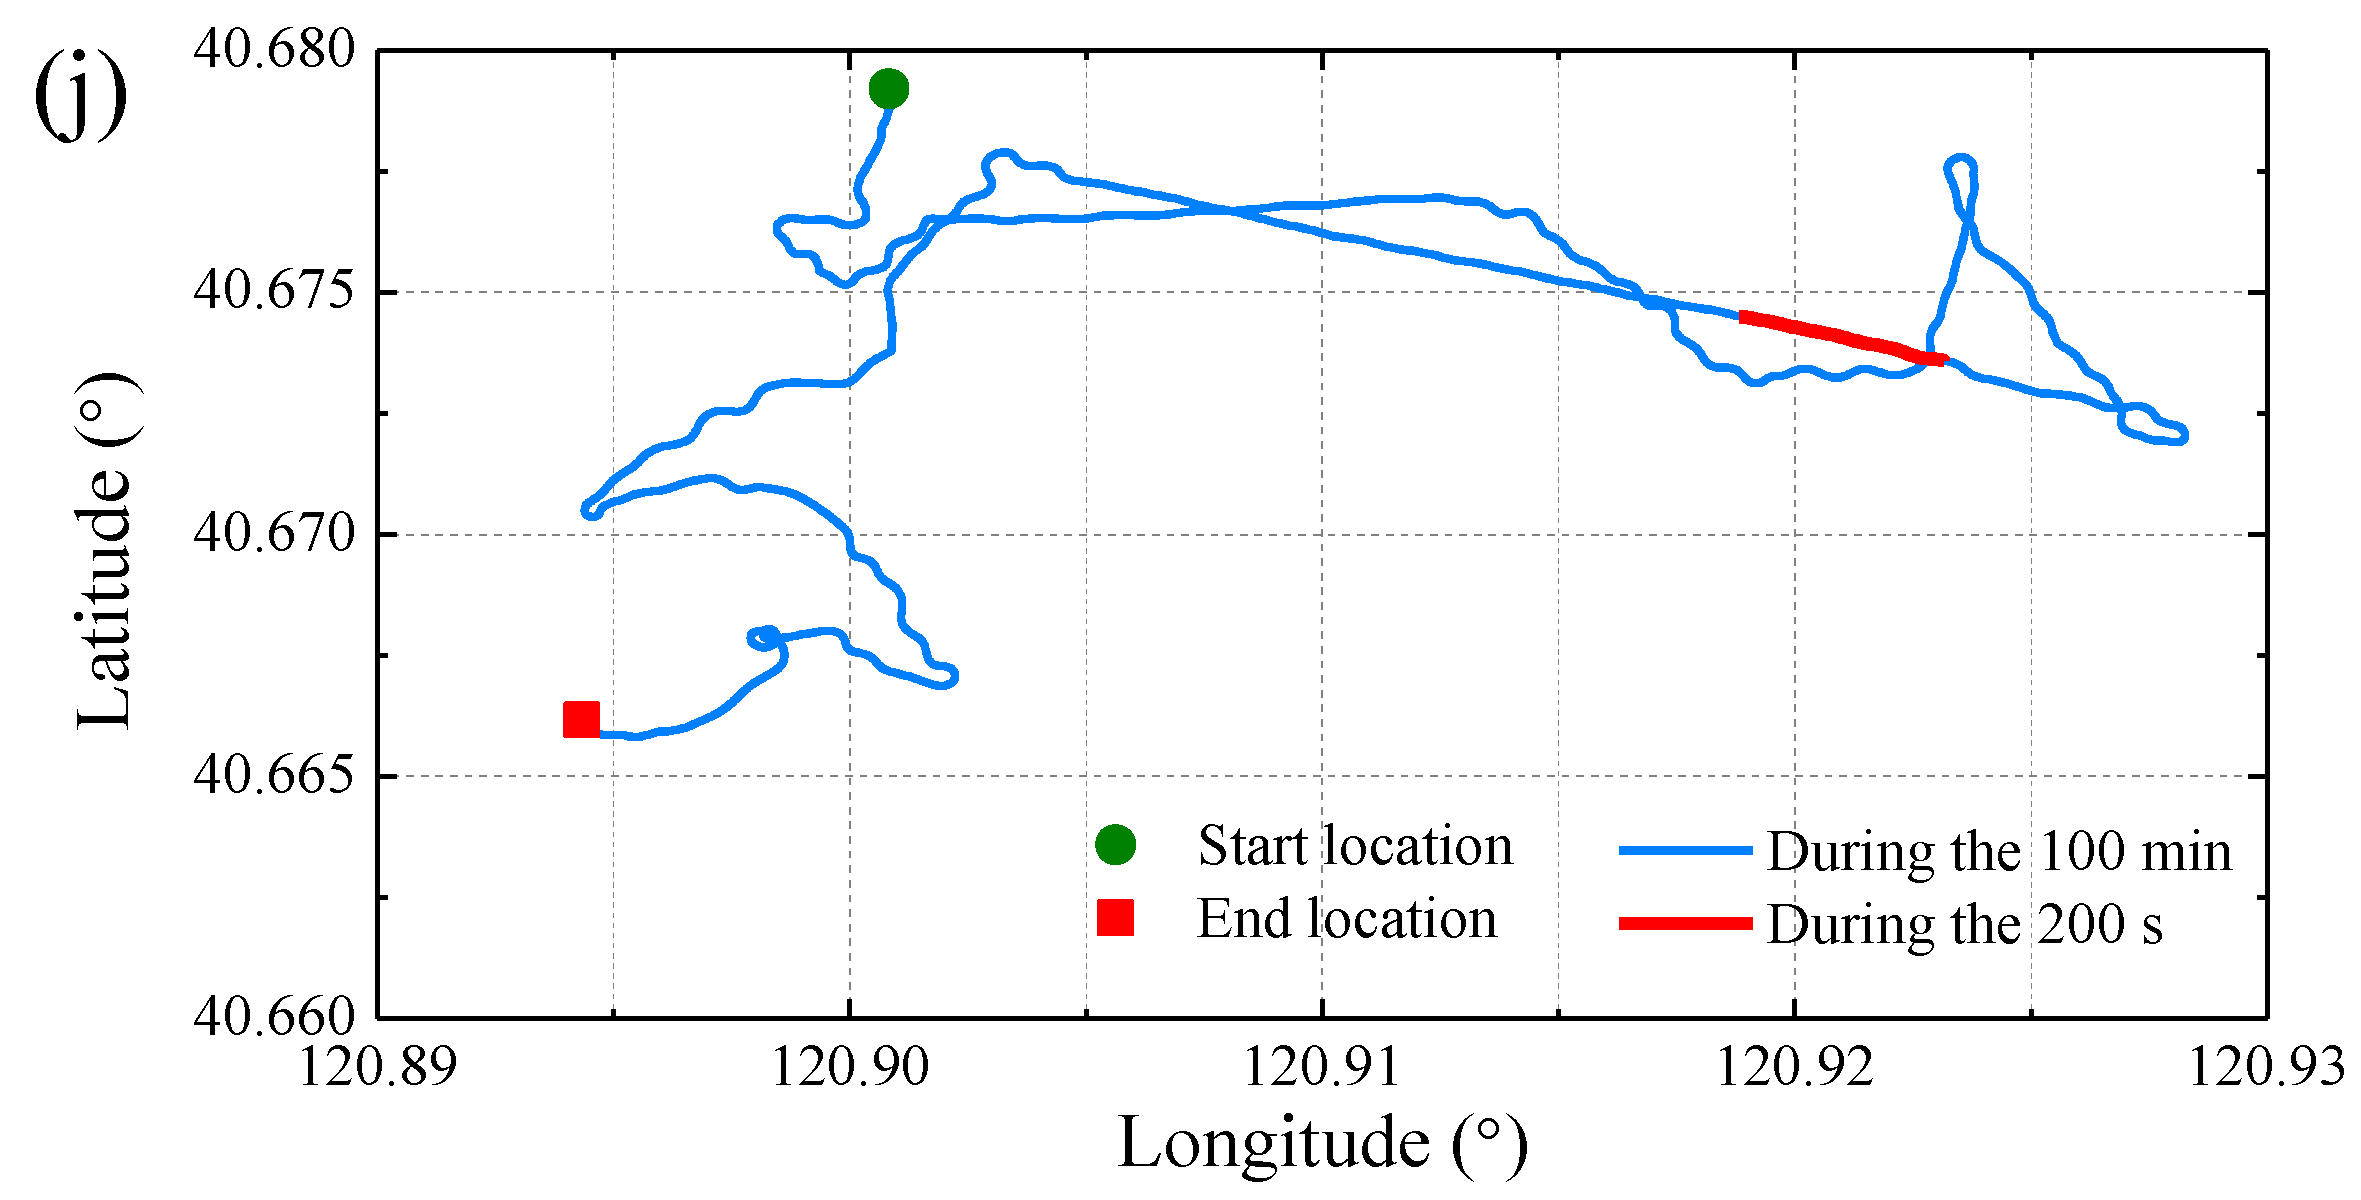
The model’s position and navigation speed are calculated by the real-time positions of the two GPS receivers. The RTK data (i.e., pitch, roll and heading angles) and accelerations of the model are measured by a three-axis gyroscope and a three-axis accelerometer inside the IMU, respectively. Furthermore, the 3D position (i.e., latitude, longitude and height), 3D velocities (i.e., northern, eastern and vertical) and 3D motions (i.e., pitch, roll and heading) of model can be accurately derived according to a full coupling technique and algorithm based on the GPS and INS data. The technique parameters regarding the dedicated GPS/INS device are summarized in
Table 4.
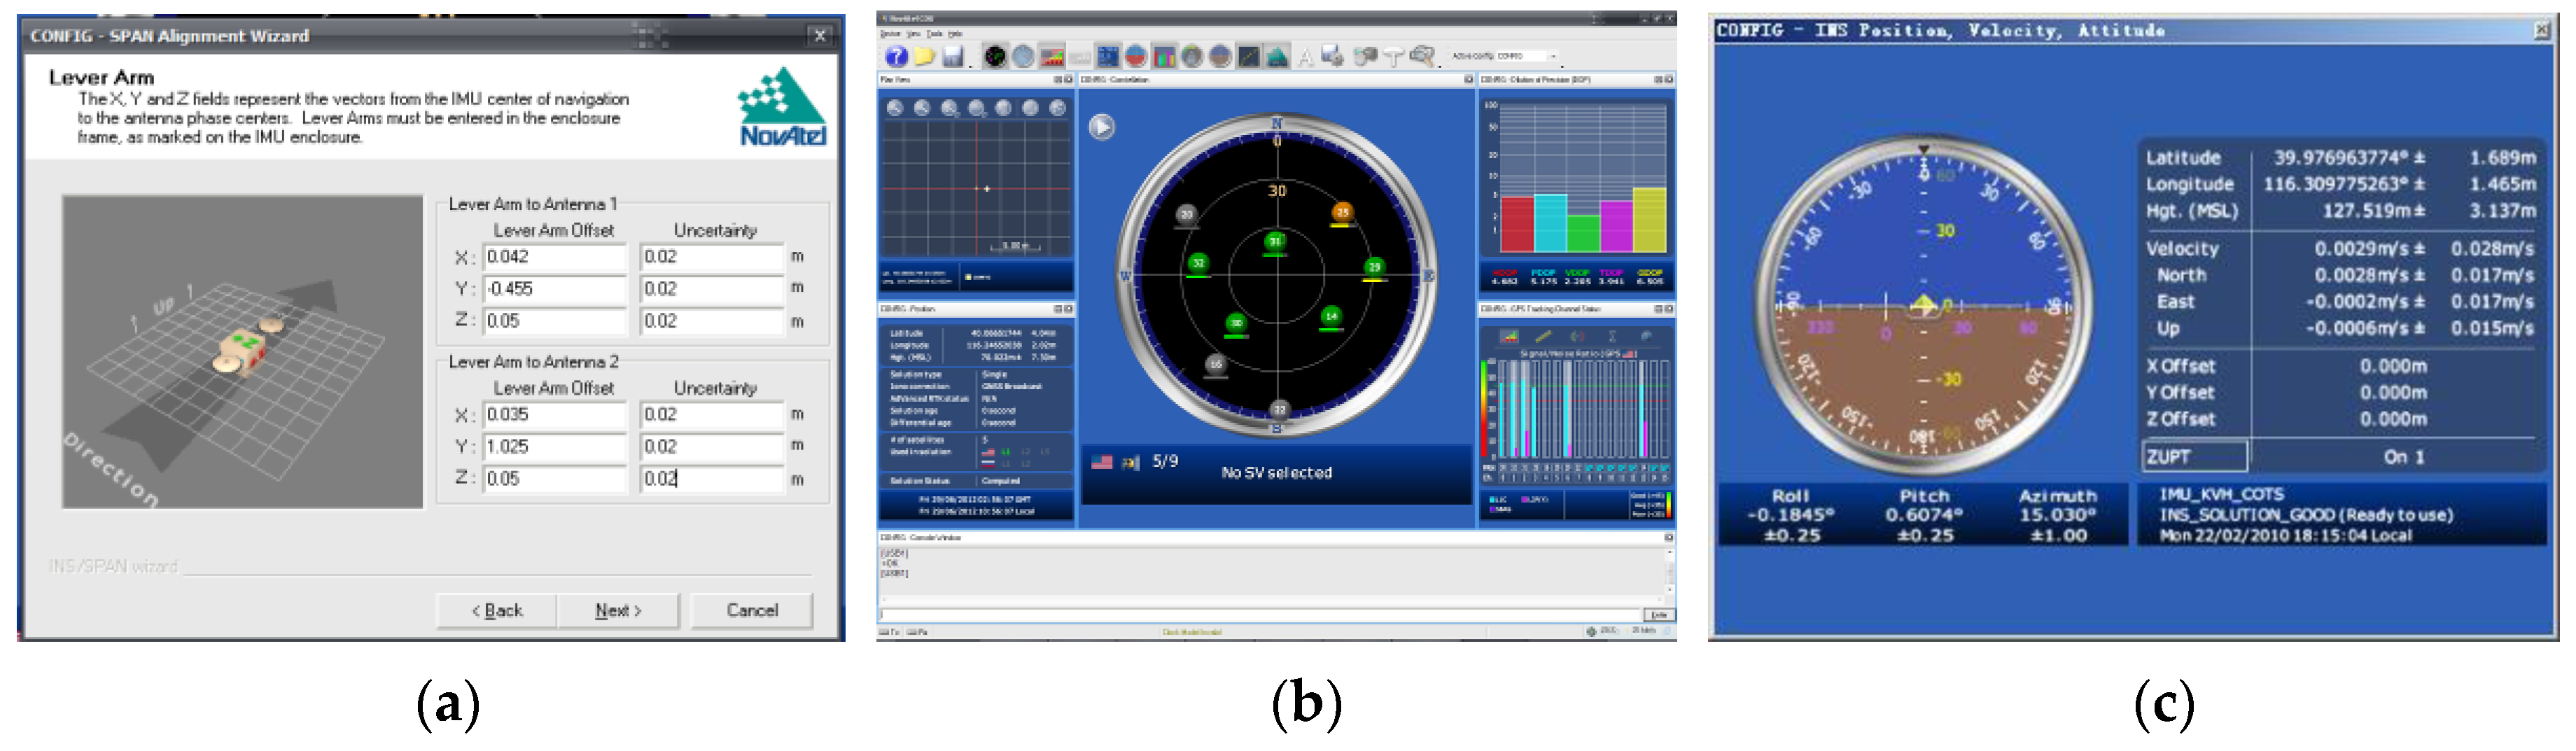
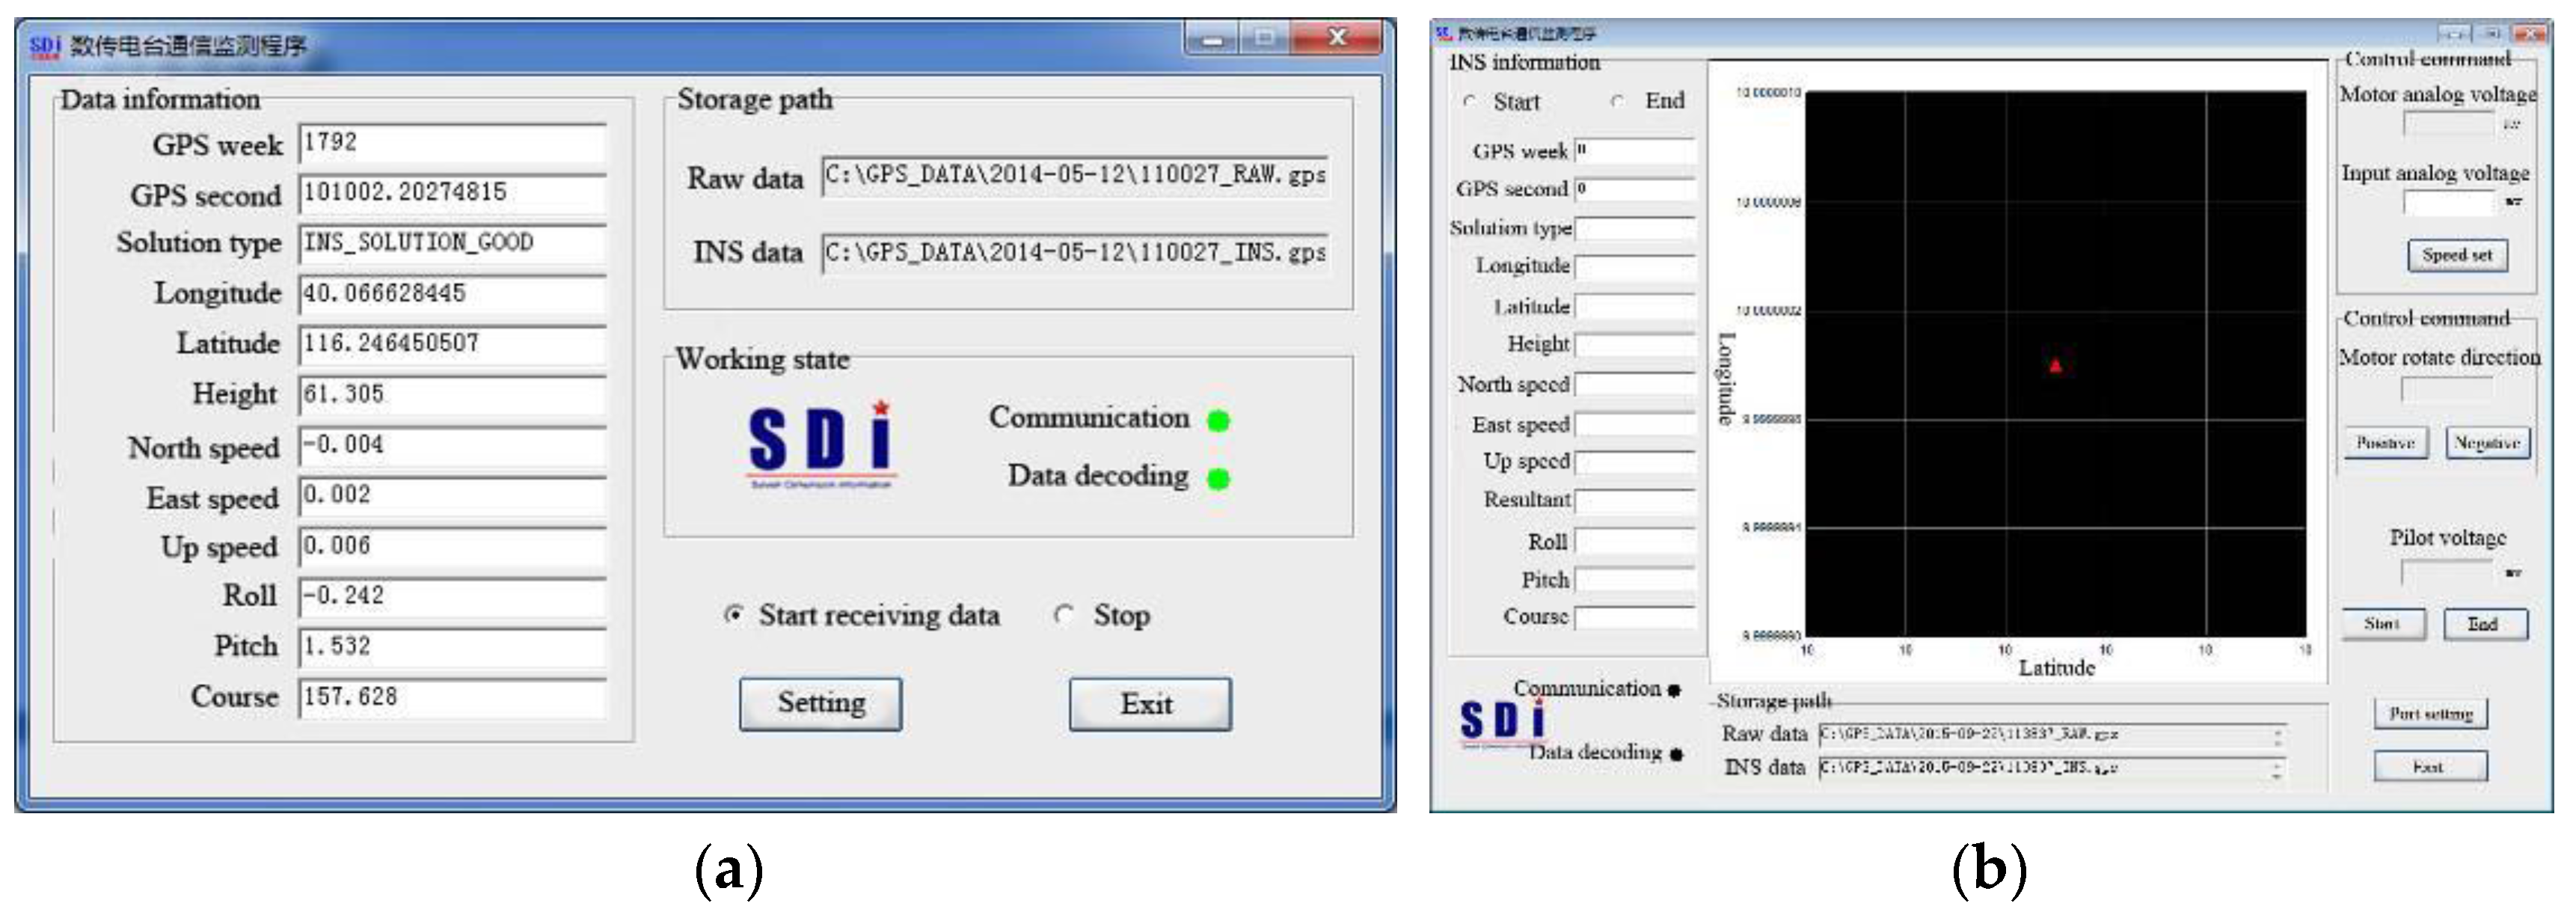
The interface of the GPS/INS software is shown in
Figure 19. The relative positions of the GPS receivers with respect to the INS core unit should be initialized at its first use (see
Figure 19a). Then, satellite availability will be searched automatically to establish the working communication (see
Figure 19b). During measurement, the model’s sailing state will be displayed on the interface of a laptop on the escort yacht, which is shown in
Figure 19c.
4.5. Radio Control and Telemetry System
A remotely controlled and telemetry system was designed and developed to allow the conduction of large-scale model trial in open sea areas. During measurement, the sailing course and speed of the model is remotely controlled by the crew onboard the escort yacht. The unmanned self-propelled model’s navigational state will also be displayed and recorded by the laptop on the escort yacht.
4.5.1. Self-Propulsion System
Two Direct Current (DC) 240 voltage brushless electric motors were adopted to drive the four propellers (see
Figure 14c). The power was provided by a set of 20 blocks 12-voltage lead acid batteries. A high frequency chopper control electro-circuit was designed and adopted to protect the motors from burnout. The rpm of the motors is controlled and regulated via a motor control box onboard the model. The analog voltage signal, which ranges from 0 to 5000 mV, and which is used to regulate the model’s navigational speed, is transmitted from the escort yacht to the A/D module by radio signal. A value of 5000 mV corresponds to the full speed capacity of the motors. The relationship between model forward speed and analog voltage was calibrated in calm water prior to sea trial measurements [
32]. During the experiment, the fluctuation of navigational speed in random wave caused by added resistance was lower than 0.2 m/s, and was not considered in this study.
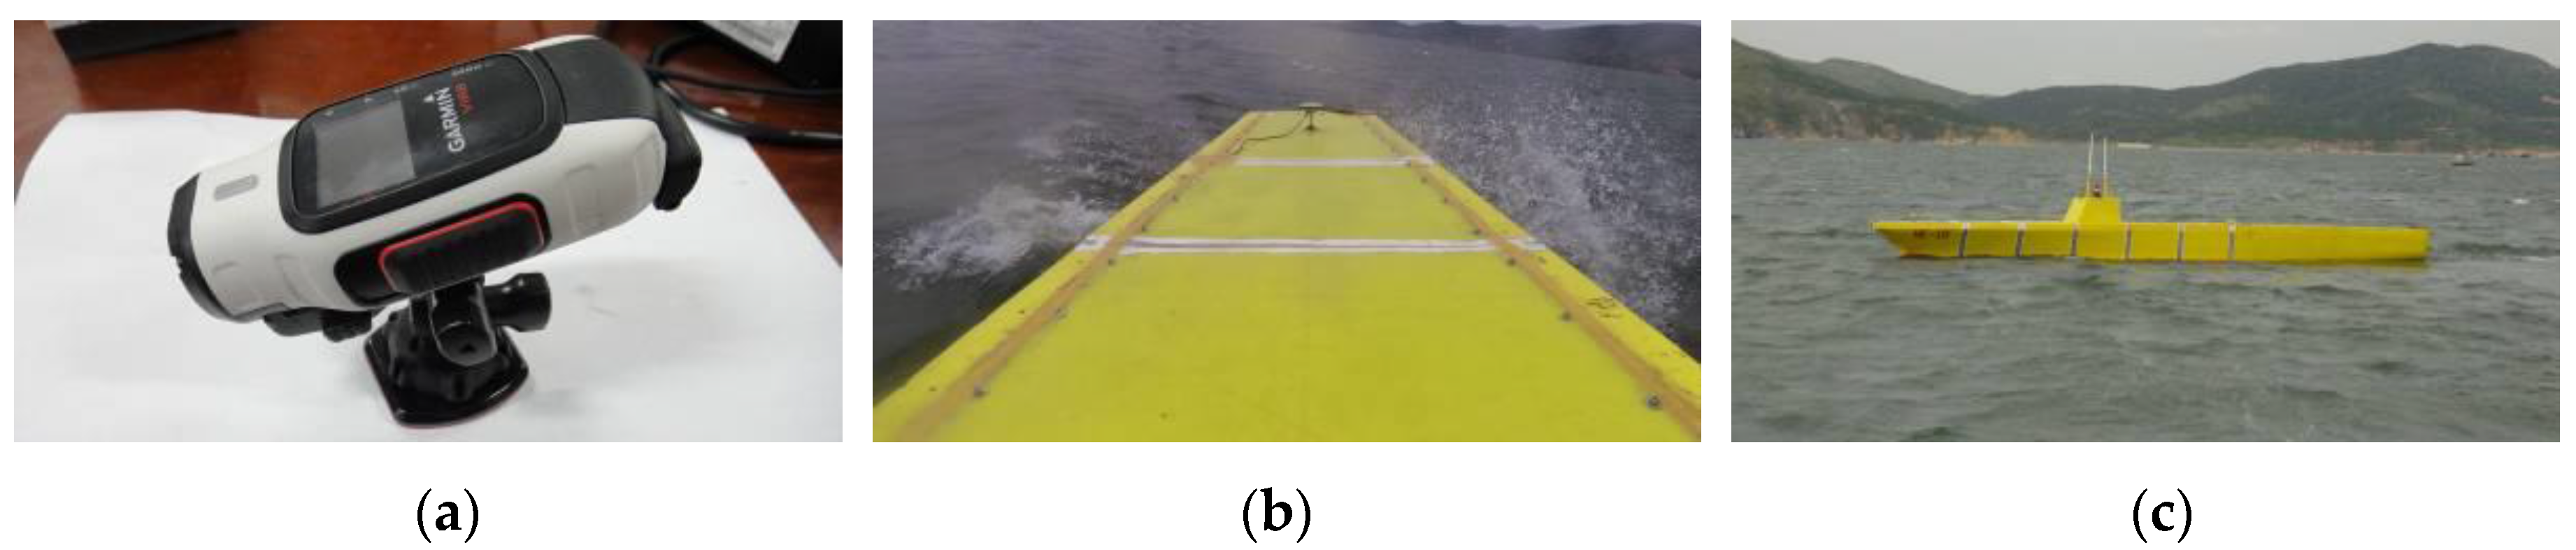
4.5.2. Autopilot System
The course of model in the seaway is kept intelligently with the help of a commercial autopilot, which was produced by the US GARMIN Limited Company. The course-keeping ability (or yaw angle tolerance) of model in seaways is set through the PID algorithm based autopilot system. It is noted that the yaw angle tolerance should neither be too large nor too small to ensure the ship sailing steady. The autopilot system comprises of four main components: a Course Computer Unit (CCU), an Electronic Control Unit (ECU), a user control interface and a drive unit (see
Figure 20a). The ECU controls the drive unit based on the feedback provided by the CCU (see
Figure 20b). The drive unit in turn adjusts the twin-rudder angle through a set of double crank mechanism to keep course. The model’s course can be adjusted by the user control interface on the escort yacht via radio signal (see
Figure 20c).
4.5.3. Radio Communication System
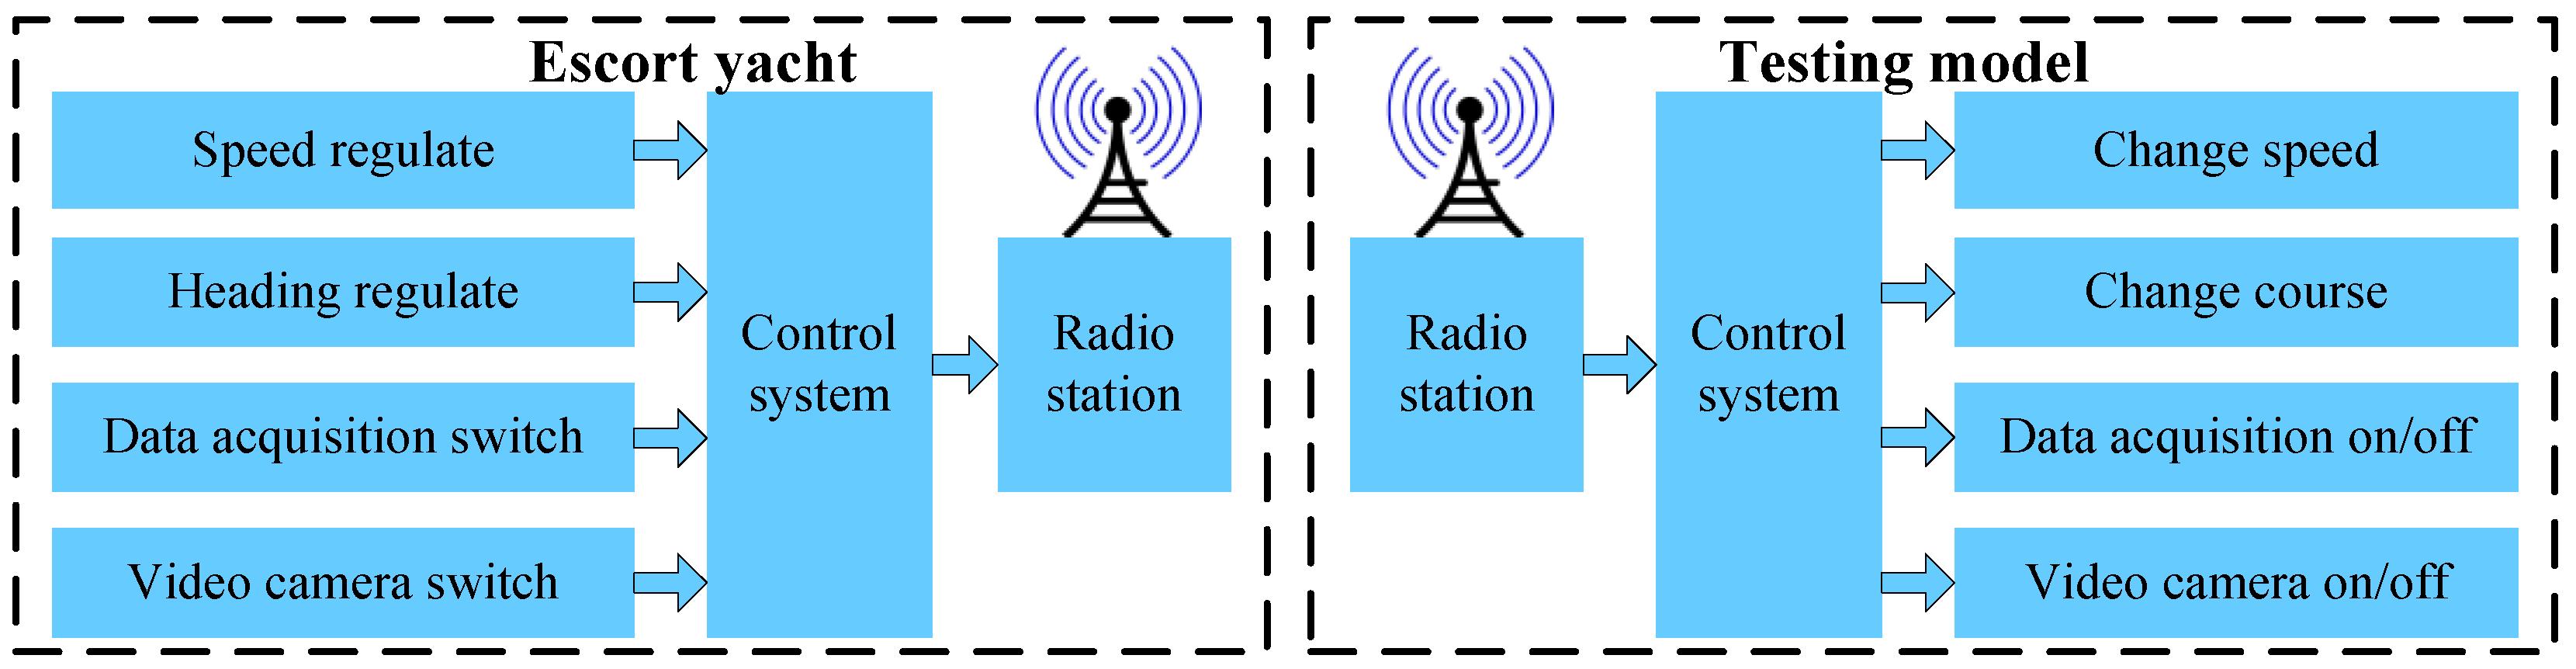
To provide for the remote control of the large-scale model from the escort yacht, dedicated software was developed in cooperation with the SDI Ltd. (Bayswater, Australia). Through the software interface on the escort yacht, it is possible to: monitor the model’s sailing state, velocities and motions provided by GPS/INS in real time; display the navigational trace of the model; present and adjust the propellers’ speed and rotation direction; display the real-time rudder angle; and start or stop data acquisition and video recording. The software interface is shown in
Figure 21. The model’s sailing course is controlled via the user control handle of the autopilot system (see
Figure 20c).
Four pairs of radio stations were adopted to facilitate communications between the testing model and the escort yacht. A different transmission frequency is adopted for each pair to work independently. One pair is used for the transmission of sailing state data feedback by the GPS/INS, another pair is for transmission of the exciting voltage to adjust the speed of motors, and the remaining two are for data communication of the autopilot system. Framework of the remote control system is shown in
Figure 22. All the control and measurement instructions can be achieved and realized through the dedicated remote control system.
4.5.4. Telemetry System
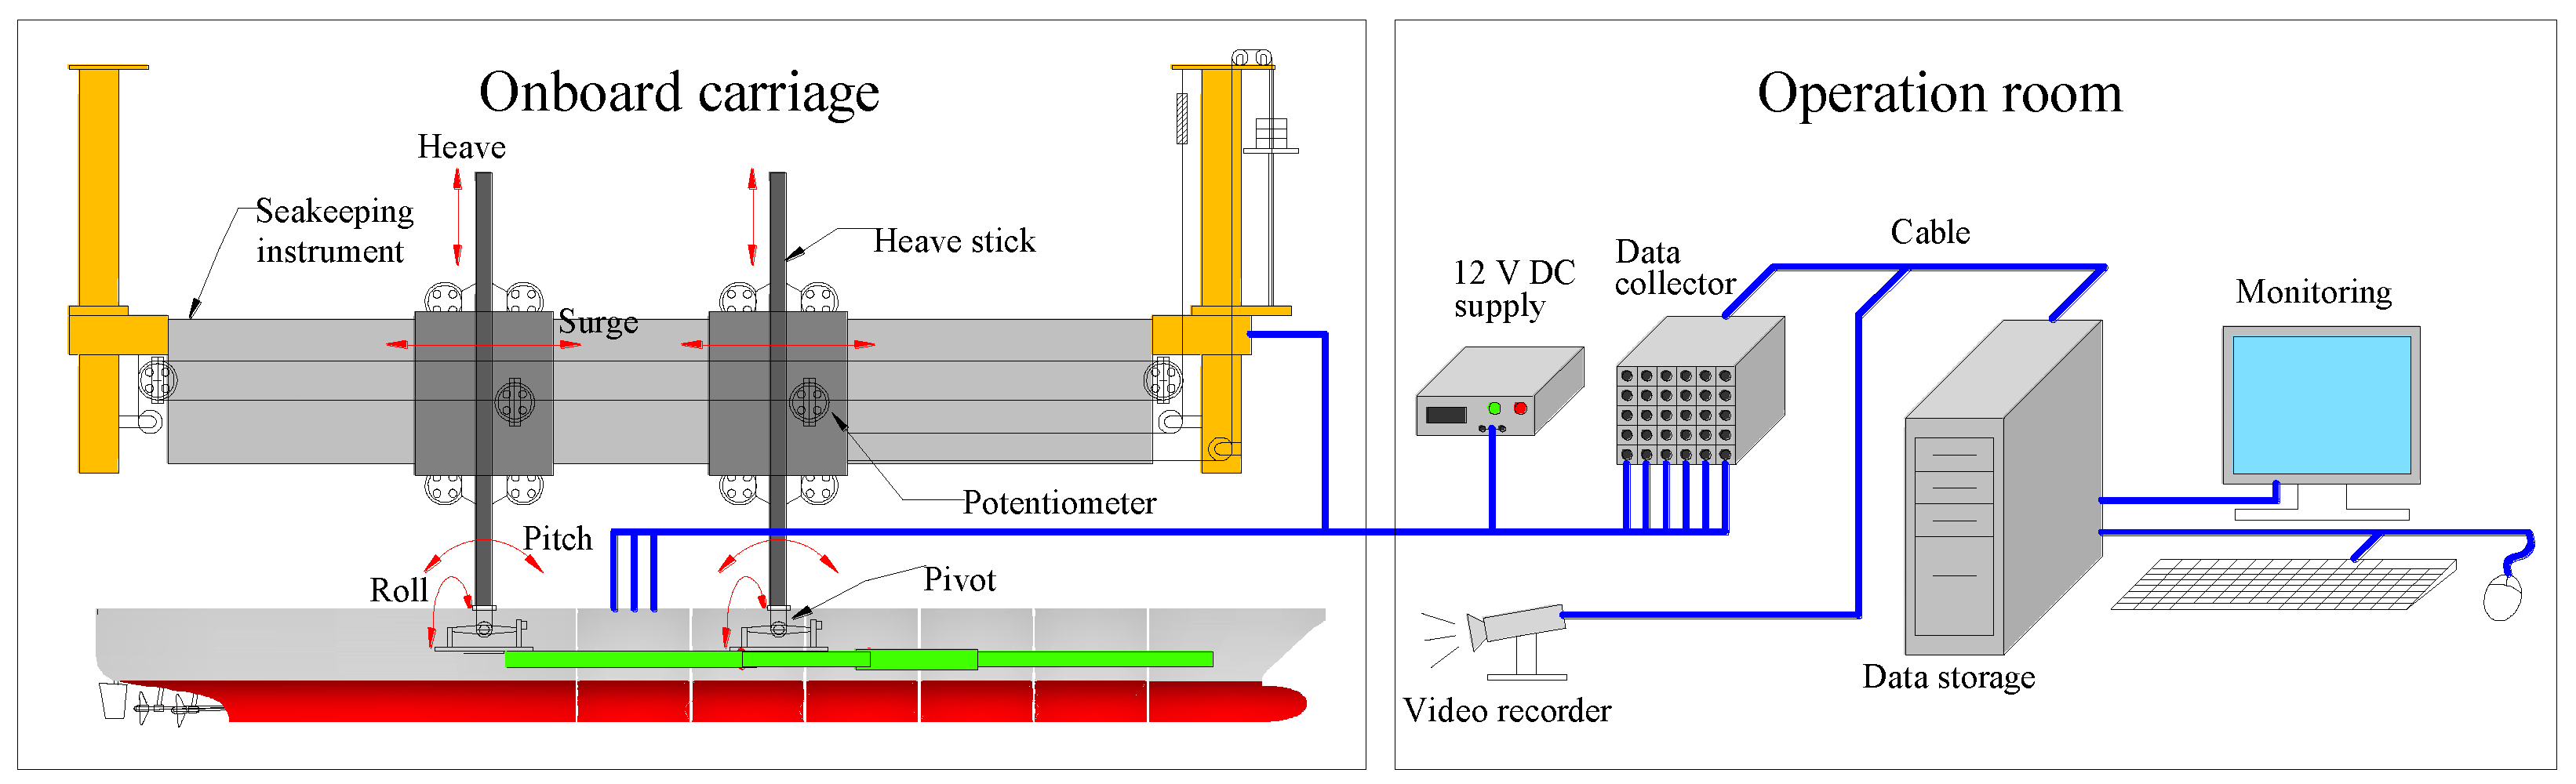
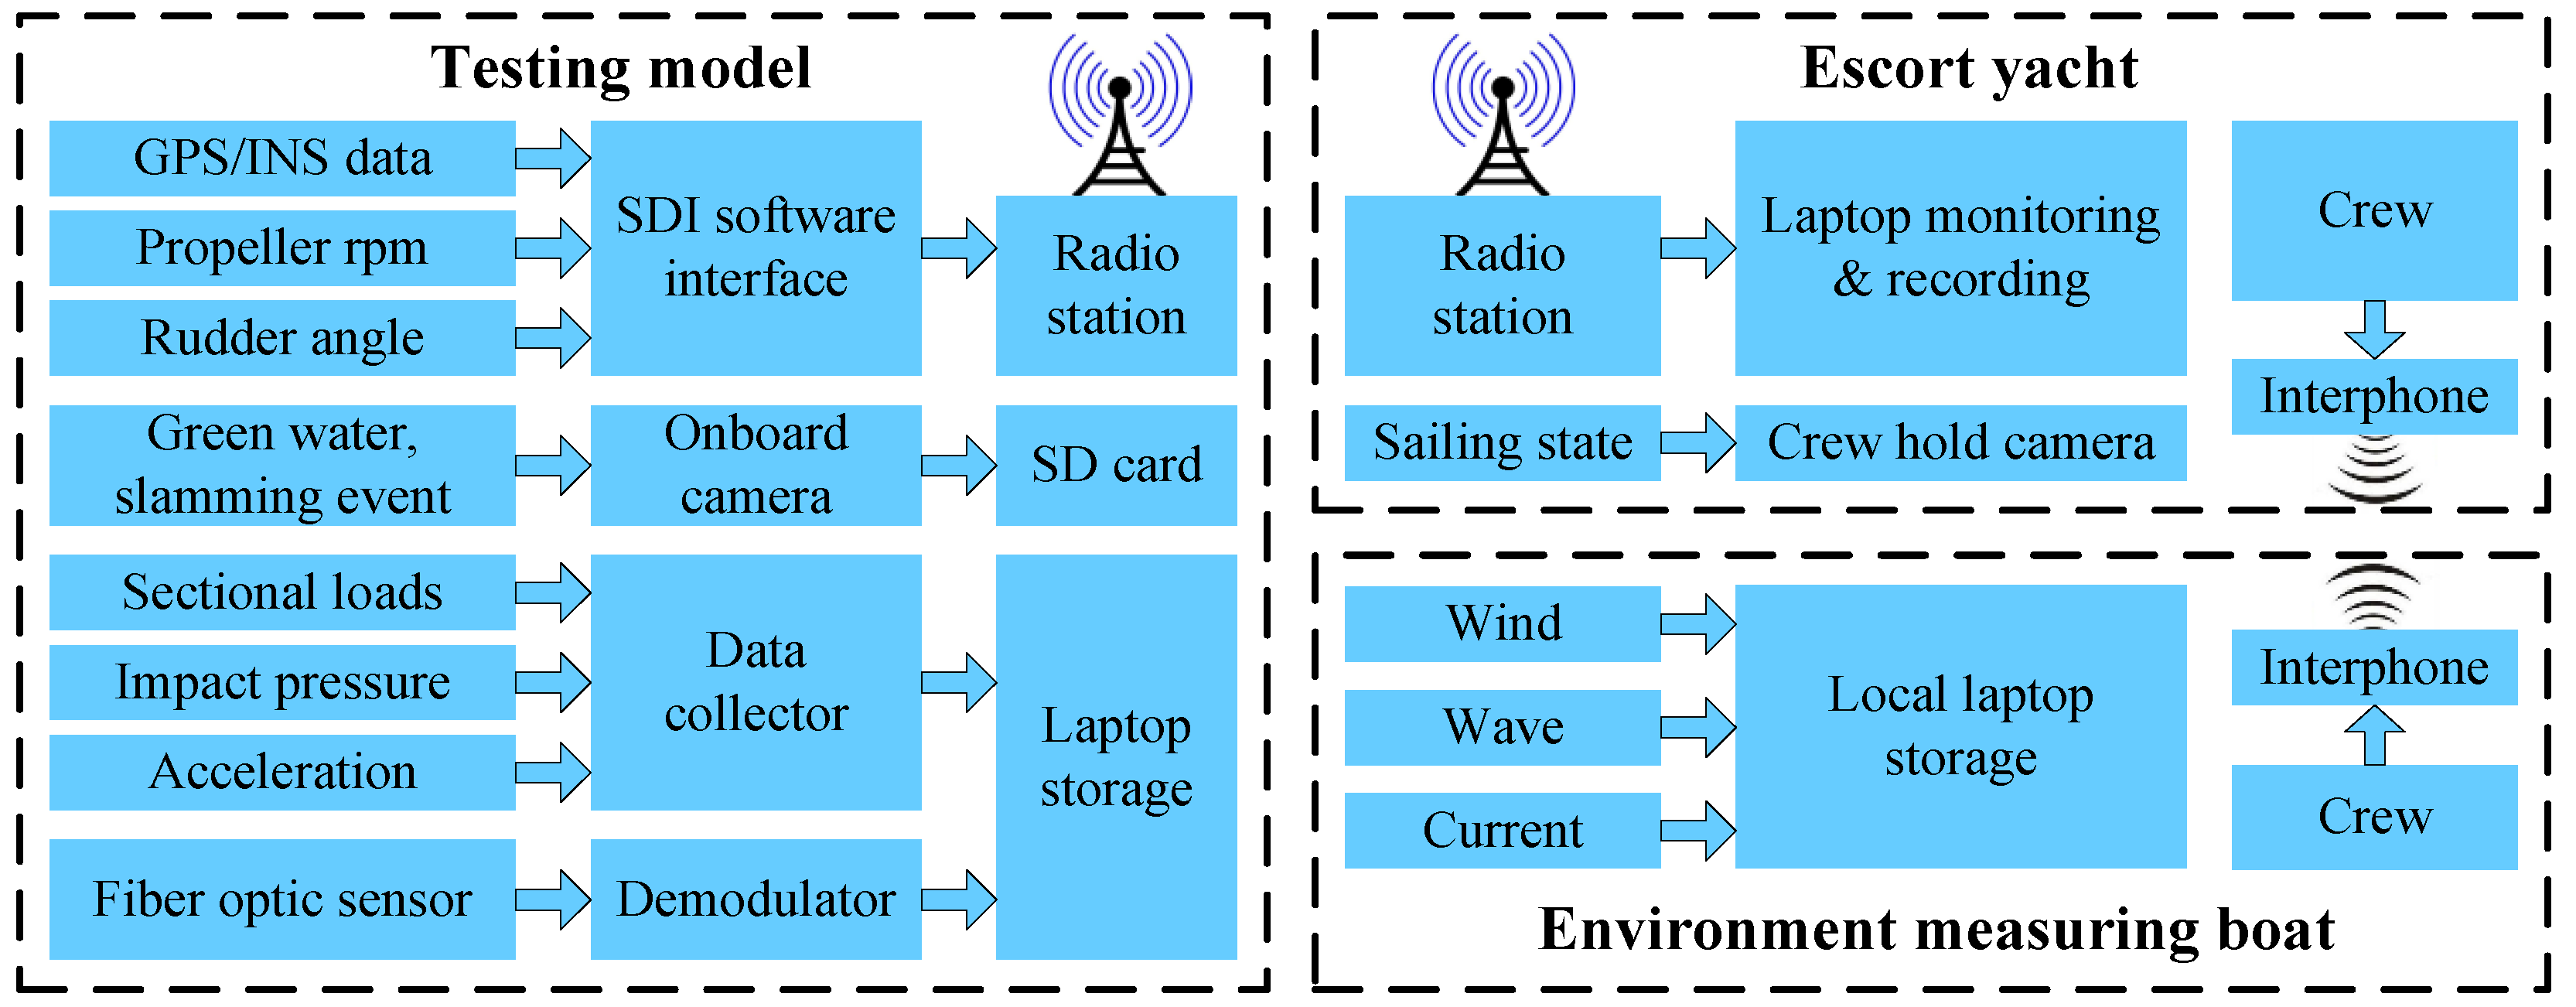
A combined telemetry and local measurement system was designed and developed to record the motions and loads data for post-voyage analysis. The framework of the developed measurement system is schematized in
Figure 23.
As aforementioned, the model’s navigation information are displayed and stored by the laptop on the escort yacht. The telemetry data include the position (latitude, longitude and height), velocities (northern, eastern and vertical), RTK angles (pitch, roll and heading), propeller rpm and rudder angle. The sample frequency of these data was set at 10 Hz as a compromise between the requirement of data analysis and the capacity of radio communication.
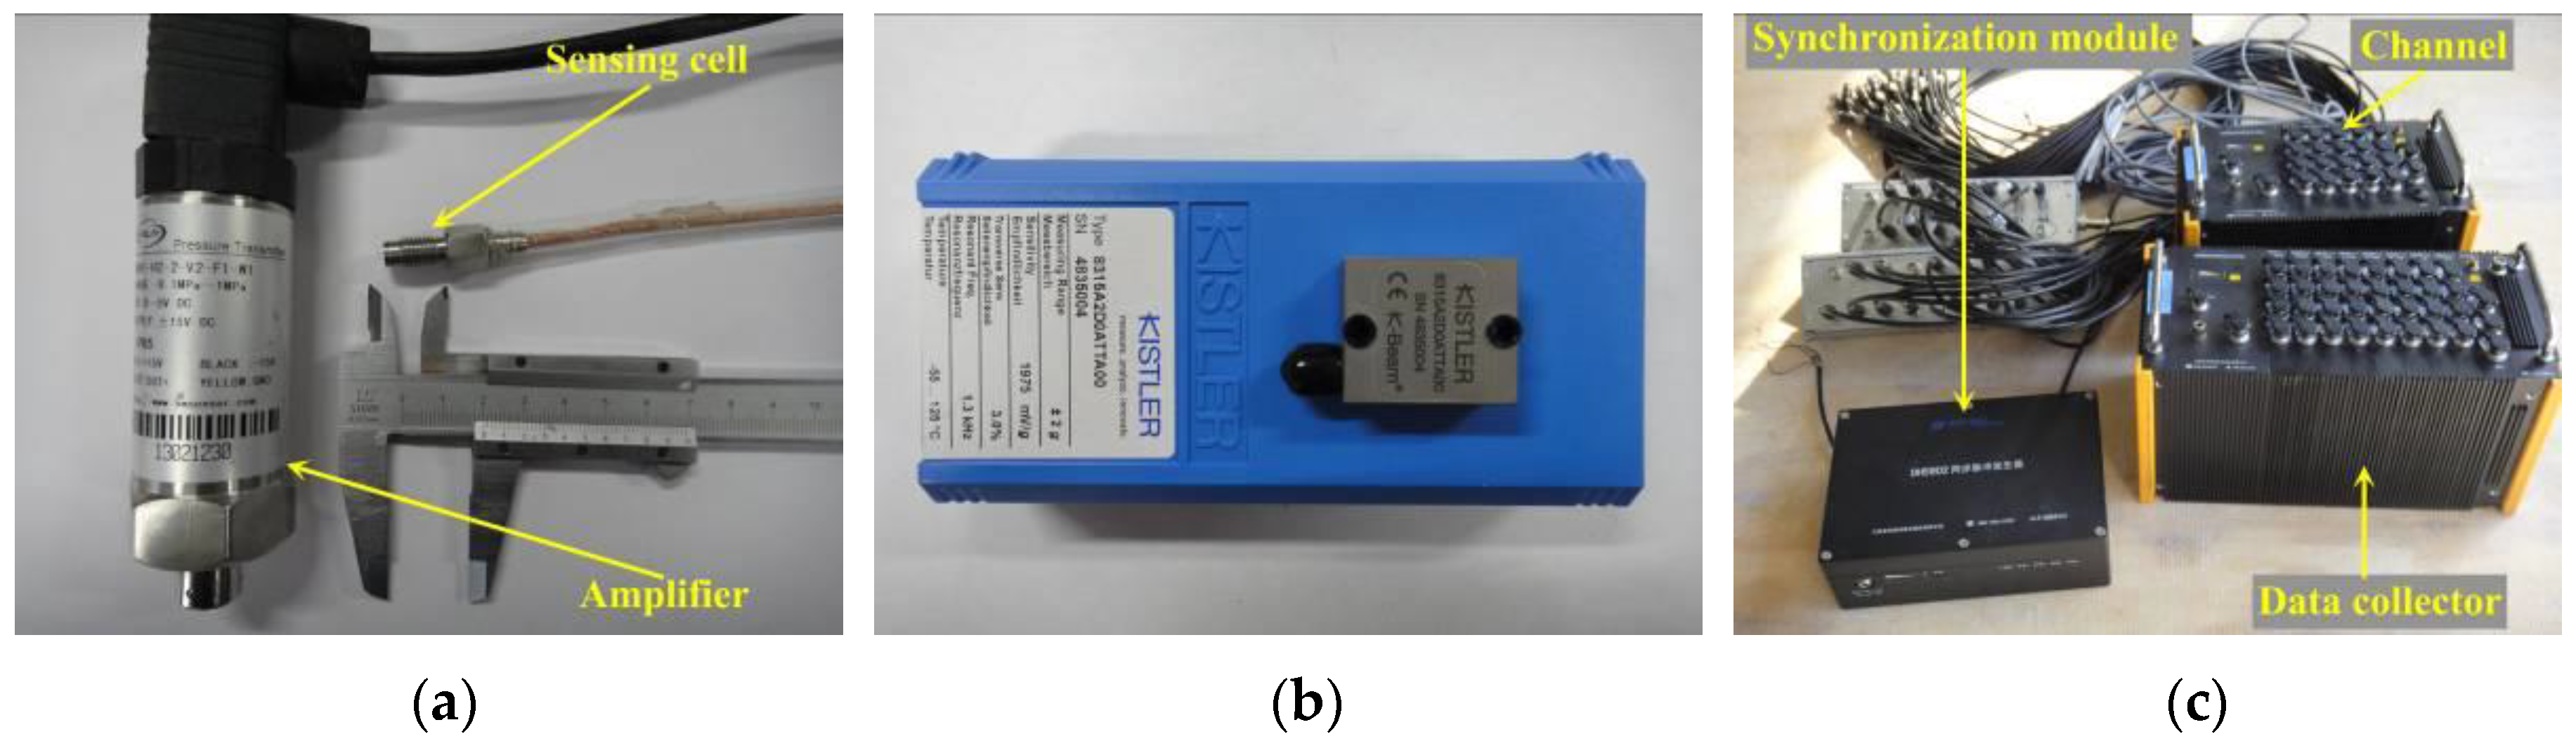
In fact, due to the communication capability of radio transmission, the data for sectional loads, impact pressure and vertical acceleration were recorded by a local data collector on the large-scale model via cable. The start or stop of the data recording was controlled by the pulse signal submitted from the escort yacht via radio. The data recorded by the local collector are summarized next. The sensors of strain gauge, pressure sensor and accelerometer are the same as those used in tank measurement.
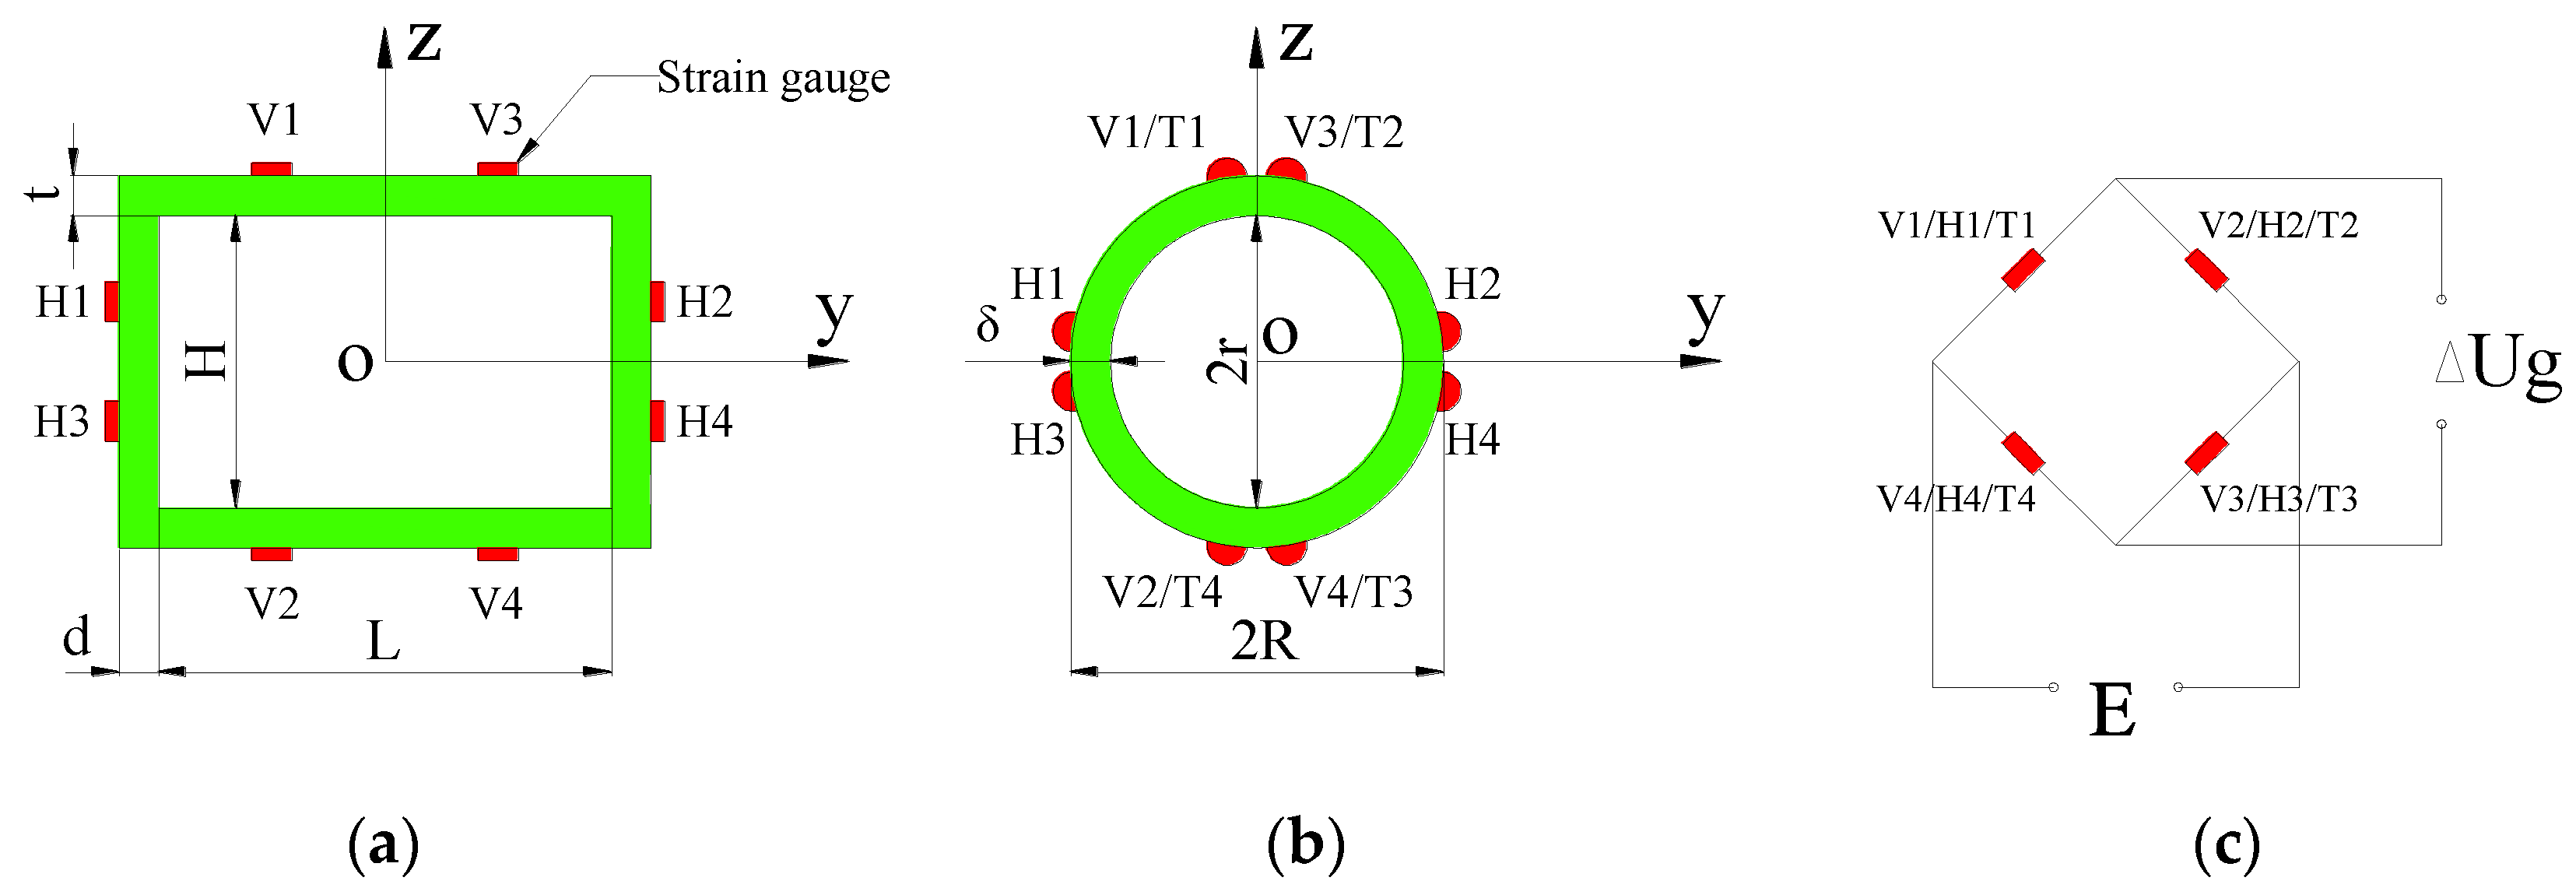
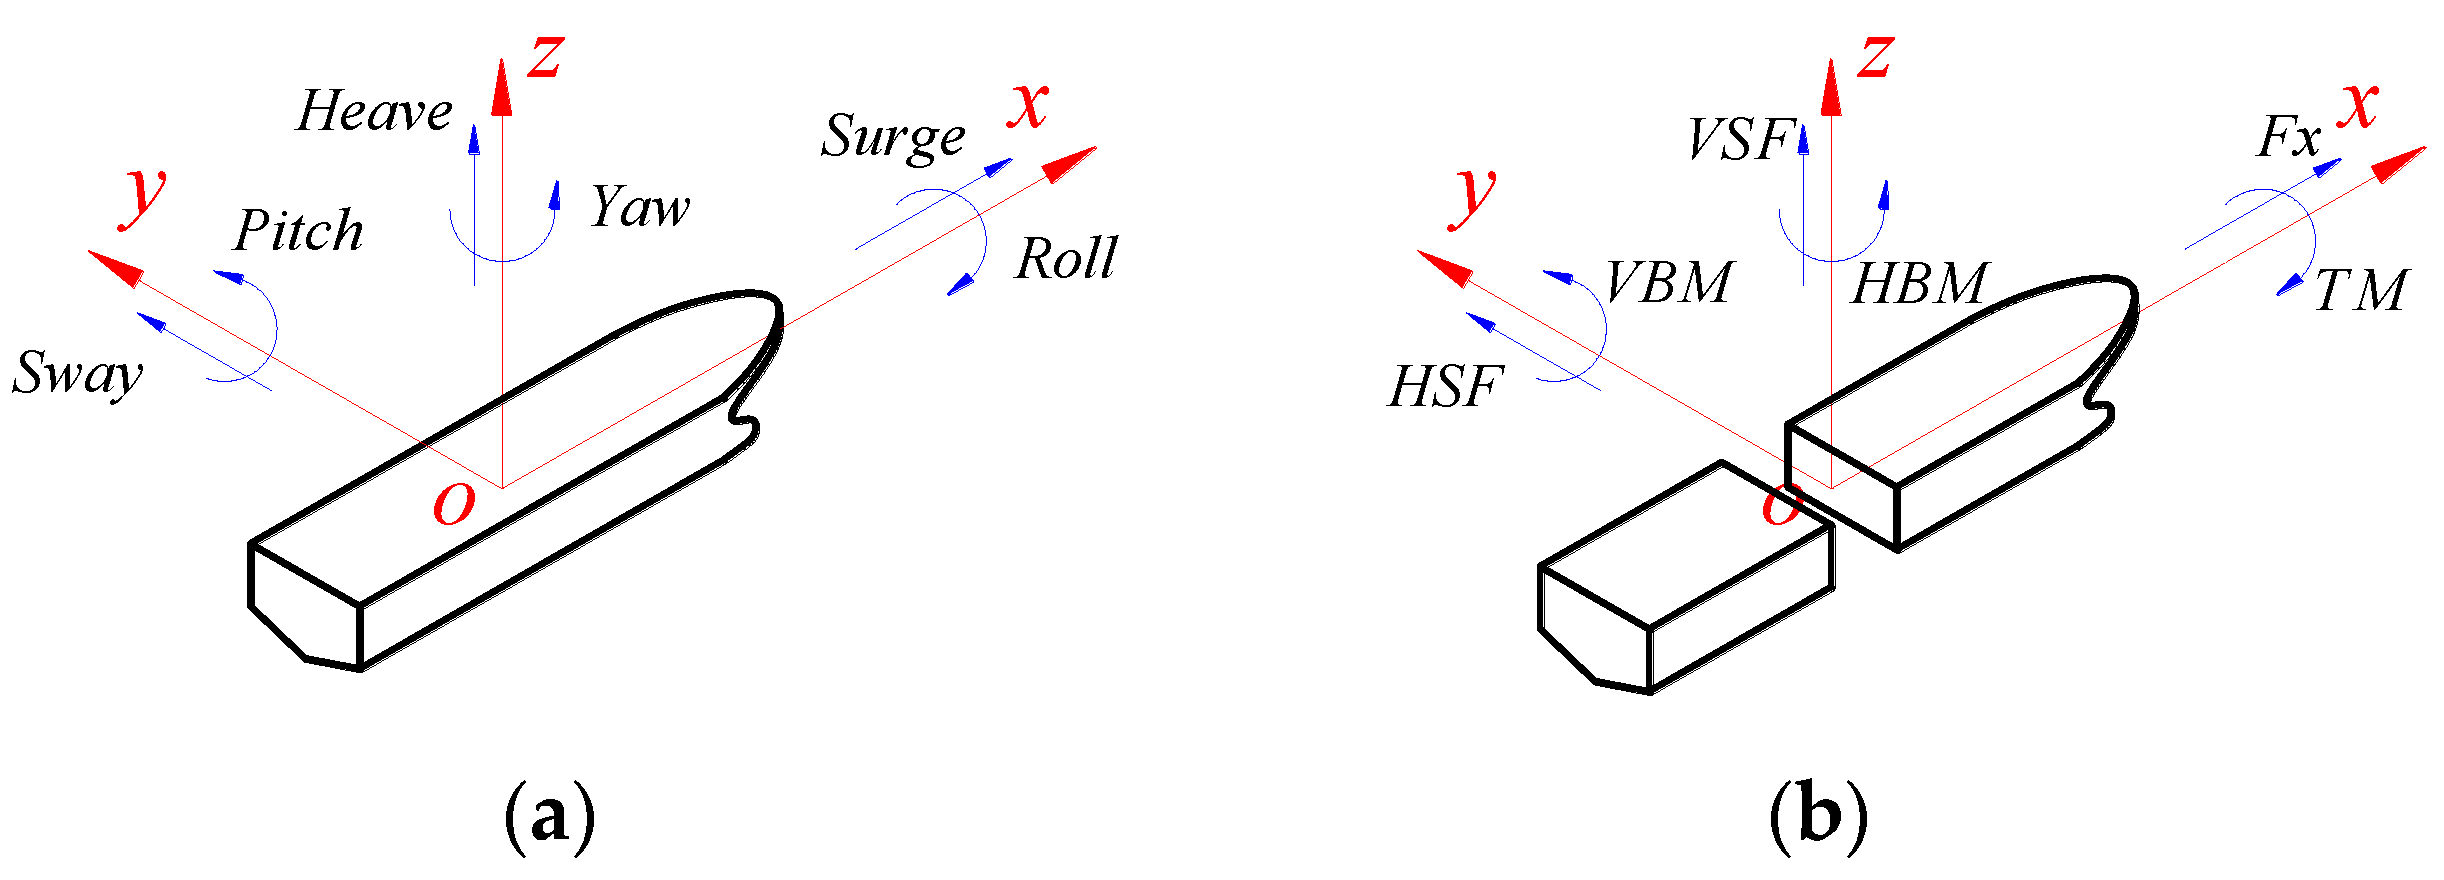
Sectional loads: A total of 13 channels for strain gauges are recorded, which include six VBM and six HBM at each cut station and an additional TM at the third cut station. The sample frequency of sectional loads was set at 50 Hz.
Impact pressure: A total of 15 pressure sensors were used to measure the bow flare slamming loads. The sample frequency was set at 1000 Hz to capture the water impact peak value.
Vertical acceleration: Three accelerometers were arranged on the deck. The sample frequency of accelerations was set at 50 Hz.
A waterproof video camera was fixed on the deckhouse to record the phenomena such as green water on deck and slamming events during measurement (see
Figure 24a,b). The start or stop of the camera can be realized by pulse signal submitted from the escort yacht. Moreover, a handheld camera was also used to record the sailing state of the model as viewed from the escort yacht (see
Figure 24c).
In addition, the ocean environment data, including wind, waves and current, were also measured and stored locally. The researcher or crew on the escort yacht guided on where and when to measure the ocean environment information. The communication between the escort yacht and environment measuring boat was achieved by interphones.


