1. Introduction
Understanding the inter-play of local events and global environmental processes is a frustratingly elusive but critically important goal, as it is fundamental to creating a deeper and more accurate understanding of these processes, and for ensuring that environmental legislation at global and local levels is made on an appropriately informed basis. For a restricted number of physical parameters (e.g., colour, temperature), global scale sensing can be achieved and dynamics visualised via satellite remote sensing. However, satellite sensing has also has significant limitations such as spatial resolution, low frequency pass-over cycle, inability to track sub-surface events, cloud cover preventing measurements, inability to directly sense detailed molecular information (except for the limited range of species that are directly accessible through spectroscopic methods), and need for specialist knowledge to convert data into accessible (visualized) information. That being said, satellite remote sensing is a very powerful means for accessing information at a global scale, and the capabilities of these platforms continues to improve. For example, the AVHRR Pathfinder Version 5.2 data set (PFV52) is a collection of global, twice-daily, 4 km grid resolution sea surface temperature data dating back to 1981 [
1]. The European Space Agency Sentinel 2A satellite launched 23 June 2015, and Sentinel 2B (launch planned mid. 2016) will have a repeat cycle of 5 days (for the two satellites) and will provide access to a new range of powerful high-resolution remote sensing modalities [
2].
The ideal scenario is to combine highly specific and localized chemical and biological information from in-situ sensor networks with the global reach of satellite remote sensing. However, the complexity and high cost of in-situ chemical and biological sensing platforms continues to restrict deployments to a relatively small number of widely separated autonomous devices, and manual grab sampling combined with centralized instrumentation is still extensively employed [
3]. Appreciation that global scale environmental effects like climate change are driven by an aggregation of localized behaviours underscores the need for a combination of rich, localized and high-frequency data, with geographical scale information, if we are to understand the interplay between these local and global processes. In order to demonstrate the tremendous added value of blending remote spectral (temperature) data with in-situ sensed data augmented by more detailed chemical information obtained via grab sampling, we decided to examine submarine and intertidal groundwater discharge (SIGD) in the region of Kinvara Bay, Ireland. While this study is necessarily limited in geographical span and duration, the location is of significant interest, as a number of highly localised intertidal freshwater springs produce dynamic patterns of freshwater/sea water mixing in the inner bay.
SIGD is of increasing global significance due to its role in transporting freshwater (and freshwater contaminants) to the ocean. The increasing anthropogenic impacts on the environment pose significant risks to the quality of aquatic systems, and karst systems (as exist in the Kinvara region) are particularly vulnerable to these effects. For example, intensive agricultural activities and sub-standard coastal sewage treatment works may cause increased contaminant and nutrient runoff that ultimately results in degradation of coastal waters. Previous groundwater monitoring programs have classified the Irish Western River Basin District (WRBD) and specifically the Kinvara-Gort groundwater body (GWB) to be high risk in this regard [
4] and groundwater and nutrients entering the bay can remain for up to 10 days [
5]. The Kinvara-Gort GWB is primarily underlain by limestone that includes large fissures, cracks, and tunnels that act as preferential flow paths for groundwater. To date, discharge from the western coast of Ireland has mainly been estimated using surface water runoff due to the difficulty in locating and quantifying SIGD [
6]. The aim of this project was to investigate how complementary sensing modalities (Earth Observation satellite data, small aircraft multispectral imaging and in-situ sensing) could be used collaboratively to study the various SIGD occurrences in Kinvara Bay.
We were particularly interested in tracking these mixing dynamics using temperature, as temperature can be accurately measured over large distances using thermal imaging from satellites and flyovers. The ability to track differing water types using temperature differences opens intriguing possibilities for environmental monitoring, as, by extension, it allows the distribution of water chemistry in the bay to be spatially mapped without the need for a dense deployment of (expensive) in-situ chemical sensors. To investigate this possibility, high-resolution thermal-imaging patterns obtained via synchronous flyovers were validated using in-situ temperature measurements. Simultaneous in-situ conductivity measurements provided a means to verify the relationship between water type (fresh water vs. sea water) and temperature, and grab samples would offer insights into the correlation of nutrient concentration with water type in the bay.
2. Materials and Methods
2.1. Sample Site
Kinvara Bay (53.139° N 8.938° W) is located off the western coast of Ireland near the city of Galway. It is orientated in a NNW-SSE direction and opens to the southern edge of Galway Bay, which is connected to the Atlantic Ocean. Kinvara Bay is approximately 4.5 km long and covers a maximum area of 5.97 km
2 during high tide. The average depth of the Bay is 4.2 m with an average daily tidal range of 3 m [
7]. The area is part of the southeastern corner of the Western River Basin District (WRBD) of Ireland. Surrounding Kinvara Bay, the relief is mostly flat with no terrain more than 20 m above sea level. Dating back to 1861, the mean annual precipitation near Kinvara is about 1100 mm [
8]. Under the assumption of negligible evapotranspiration during the winter months, mean annual evapotranspiration in the area has been estimated to be about 460 mm [
9]. The mean annual potential recharge (precipitation minus actual evapotranspiration) is estimated to be in the range of 500–650 mm [
10].
2.2. Hydrogeological Connection
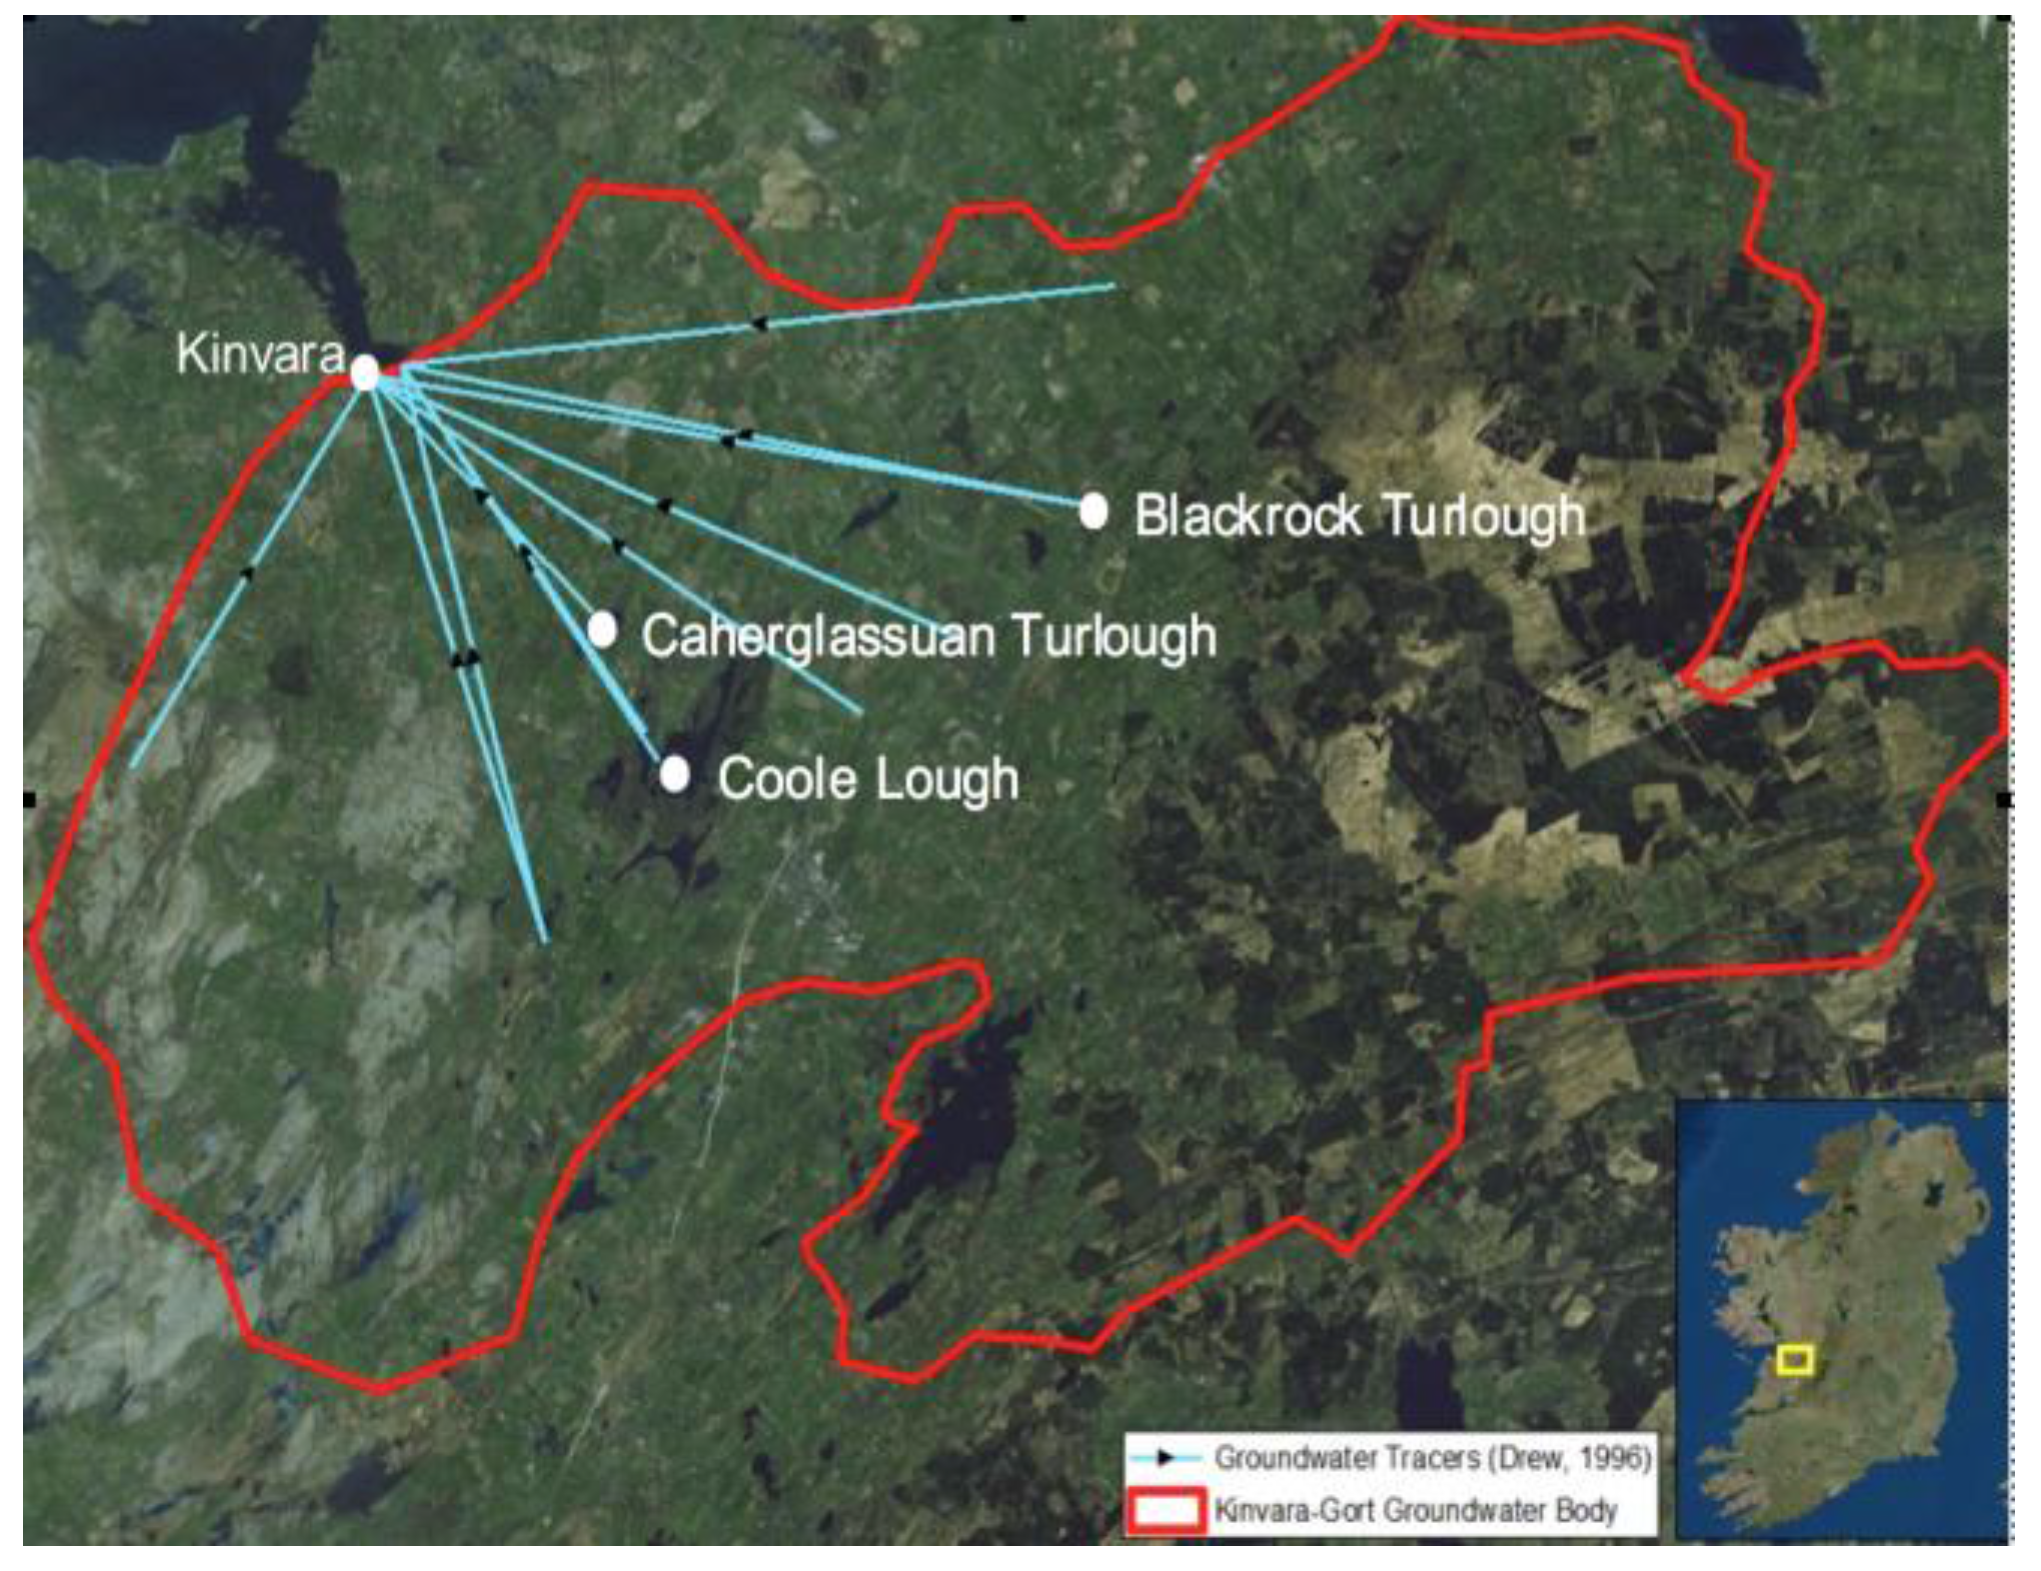
The dominant rock type underlying nearly half the land surface in Ireland is carboniferous limestone, which is susceptible to karstification. Lowland karst areas are characterized by rapid interaction between ground and surface waters as well as features that include losing and gaining streams, turloughs, springs, fissures, cracks, and tunnels. The Kinvara-Gort groundwater body (GWB) is one such area characterized by large fissures, cracks, and tunnels that act as preferential flow paths for groundwater. Dye tracer experiments have been used to track flow patterns and dynamics of the karst geology in the area, and these have identified three preferential flow paths at different depths, one of which is from Caherglassuan Turlough [
11], see
Figure 1 and
Figure 2.
2.3. RGB Thermal Infrared Imaging
Thermal images of Kinvara Bay, Caherglassuan Turlough, and the surrounding area, were collected via flyovers by NUIM on 27 August 2015.
Figure 3A–C shows the sensor pod mounted on the aircraft, details of the sensor pod itself, and the flight paths used. The data was georeferenced and mosaicked using ArcGIS [
12]. The NCG sensor pod is comprised of four optical sensors:
- 1
A Nikon D800E SLR with a Zeiss T2 lens, capturing very high resolution RGB imagery enabling the creation of orthomosaics, point clouds and digital surface models thereby enabling visual comparisons with the thermal imagery.
- 2
A Tau 640 LWIR Thermal Imager, capturing data in the long-wavelength infrared portion of the spectrum from 7.5 μm to 13.5 μm.
- 3
An Airinov AgroSensor, primarily designed for vegetation surveys and recording imagery in the green, red, ‘red edge’ and NIR portions of the spectrum from approximately 0.53 μm to 0.83 μm. This can be used to create false colour orthomosaics, multispectral point clouds and digital surface models. A light metre is positioned on the top of the airplane cockpit to record changes in illumination during surveys for post processing.
- 4
A GoPro camera recording HD video.
The Tau 640 and the Nikon D800E recorded imagery during the aerial survey of Kinvara. Approximately 7 GB of data was captured during the 40-minute flights over the bay and turlough. Each overlapping RGB image collected during the survey was geotagged using two on-board GNSS receivers. An orthomosaic was then created from these overlapping images using the processing software Pix4D to eliminate mapping distortions. Subsequently, individual frames from the thermal camera were georectified by identifying a number of fixed points in the orthomosaic and applying a transformation polynomial.
2.4. In-Situ Data Acquisition
The primary sampling campaign took place from 25 to 28 August 2015. The tidal range during this period was approximately 4.6 m measured from the tide gauge at Galway harbor. Data acquisition took place during high and low tide to enable tidal influences on mixing to be studied. Specific conductance and temperature measurements were made using a CTD diver (VWR technologies), with the diver mounted either on the side of the kayaks, or to a buoy, which was towed behind the rib. The CTD diver was attached to the float using a using a 2 mm thick braided polyethylene rope; with a weight to ensure the sensor was maintained in a vertical position (
Figure 4). Boat speed, distance and position of this customized sampling rig from the boat were optimised prior to data acquisition to ensure that the sensor was held at a constant depth and to minimise mixing effects arising from the boat wake turbulence. The CTD diver logged data every second during deployment. A Garmin GPS device was included on-board to simultaneously log geographic coordinates, which were subsequently merged with the CTD data. Specific conductance measurements were converted to salinity prior to data analysis. Transects were performed to cover all areas accessible by boat as far north as the mouth of Kinvara Bay, with inaccessible shallower areas covered using the Kayaks (
Figure 5).
2.5. Heat Map Visualization of in-Situ Data
To identify groundwater discharge sites and help inform future deployments and field campaigns, in-situ surface measurements of temperature and salinity were interpolated to create ‘heat map’ data visualisations of the entire bay. The inverse distance weighting (IDW) method available with the ArcGIS spatial analysis toolbox was used to estimate cell values based on nearby known values (i.e., when the area of interest is in close proximity to the collected data). Interpolation using IDW is most accurate when applied to a dense dataset that covers the minimum values and maximum expected values. This study meets both requirements with over 65,000 data points being collected over wide temperature and salinity ranges.
2.6. Nutrient Analysis
Grab samples were collected at 40 point sources in Kinvara Bay at high and low tide and at Caherglassuan lough. The time and location of each sampling point was recorded using the Garmin unit. Samples were filtered through a 0.22 μm PVDF filter membrane and frozen on site for subsequent laboratory analysis using spectrophotometric techniques. Briefly, for Nitrite 1 mL of sample/standard solution was transferred to 1.5 mL Eppendorf vials, 50 μL of Griess reagent was added to the vials and the resulting solution incubated at ambient temperature (approx. 23 °C) for 20 min. For the direct determination of Nitrate, 100 μL of VCl3 was added to 900 μL of sample/calibration solution. Samples were incubated at 60 °C for 20 min. Phosphate analysis was preformed using equal volumes of yellow reagent and phosphate standard/sample. All solutions were measured on a PerkinElmer UV-VIS-NIR Spectrometer Lambda 900 (Perkin Elmer, Waltham, MA, USA) using a wavelength of 540 nm for nitrite and nitrate and 375 nm for phosphate.
3. Results
3.1. Preliminary Screening
In this study, we were particularly interested in exploring whether there was a relationship between water temperature and salinity, and whether this would enable temperature to be used as a surrogate means for distinguishing water type (fresh water vs. sea water) in Kinvara Bay. The first step was to establish whether there was a difference between groundwater temperature and sea surface temperature (SST), and the extent of this difference over time. Groundwater temperature data from various boreholes sampled by the Environmental Protection Agency Ireland were compared to SST data acquired from the Marine Institute (MI) Ireland [
13]. This showed that maximum temperature differences occurred in both the summer and winter months, when the inflow of cooler groundwater into warm near shore sea water results in plumes of low salinity water at the sea surface, around sites of groundwater discharge.
3.2. Landsat TIRS Data Acquisition
A total of 12 Landsat 8 thermal infrared sensor (TIRS) images of Kinvara Bay spanning the time period between January 2013 and May 2015 were acquired from data available from the US Geological Survey (USGS). The TIRS wavebands (bands 10 and 11) on Landsat 8 are sensitive in the electromagnetic regions between 10.3–11.3 micron and 11.5–12.5 micron [
14]. The images used were mostly cloud free with a flyover time between 11:00 and 11:45 GMT (local time). As our focus was on the water temperature in the bay, land pixels were removed from the field of analysis, leaving only pixels that denoted water during high tide [
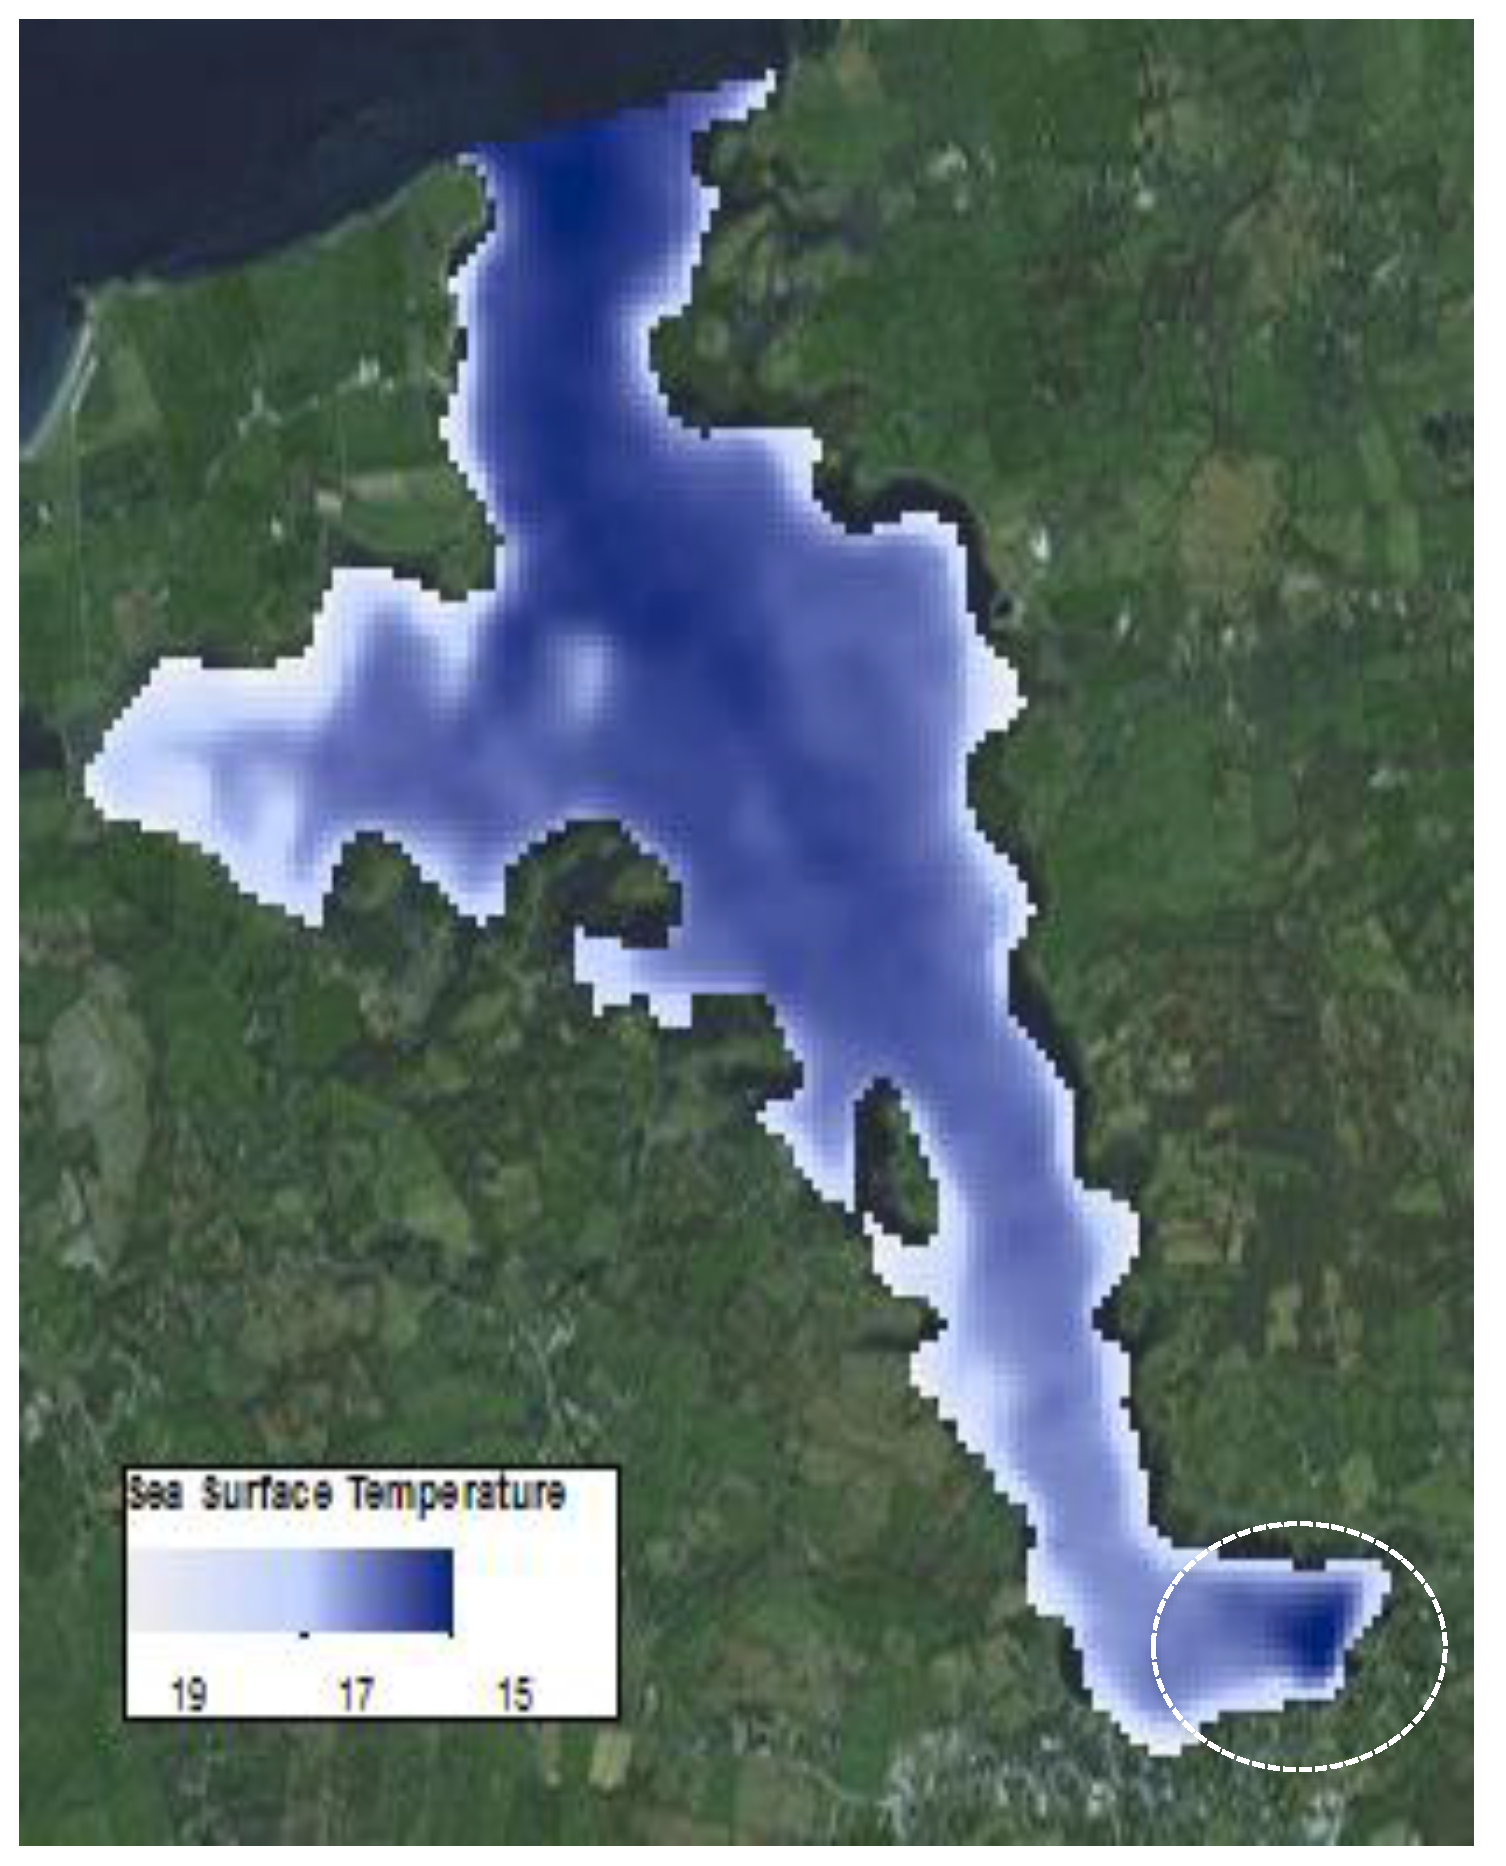
15]. The processed images cover Kinvara Bay entirely and were subsequently used to create sea surface temperature and temperature anomaly maps as a function of time over a typical year. For example,
Figure 6 shows averaged temperature patterns in the bay for the month of July 2013 we produced from data obtained from the US geological Survey. The colder freshwater emerging from sources in the inner bay are clearly visible at the bottom right of the image. This pattern is consistent with the in-situ temperature measurements and drone thermal imaging patterns.
3.3. Sea Surface Temperature and Salinity Maps from in-Situ Sensing
The SST values obtained from the in-situ sensing data clearly show cold plumes of water in near shore waters along the southern coastline of Kinvara Bay (
Figure 7 and
Figure 8). Data collected during the field campaign show a range in temperature from a minimum of 13.5 °C (Southeastern part of the bay) to a maximum of 17.1 °C, with an average of 15.9 °C. On average, groundwater temperature in Ireland varies from 9.5 to 12 °C [
8], and this is further supported by borehole records [
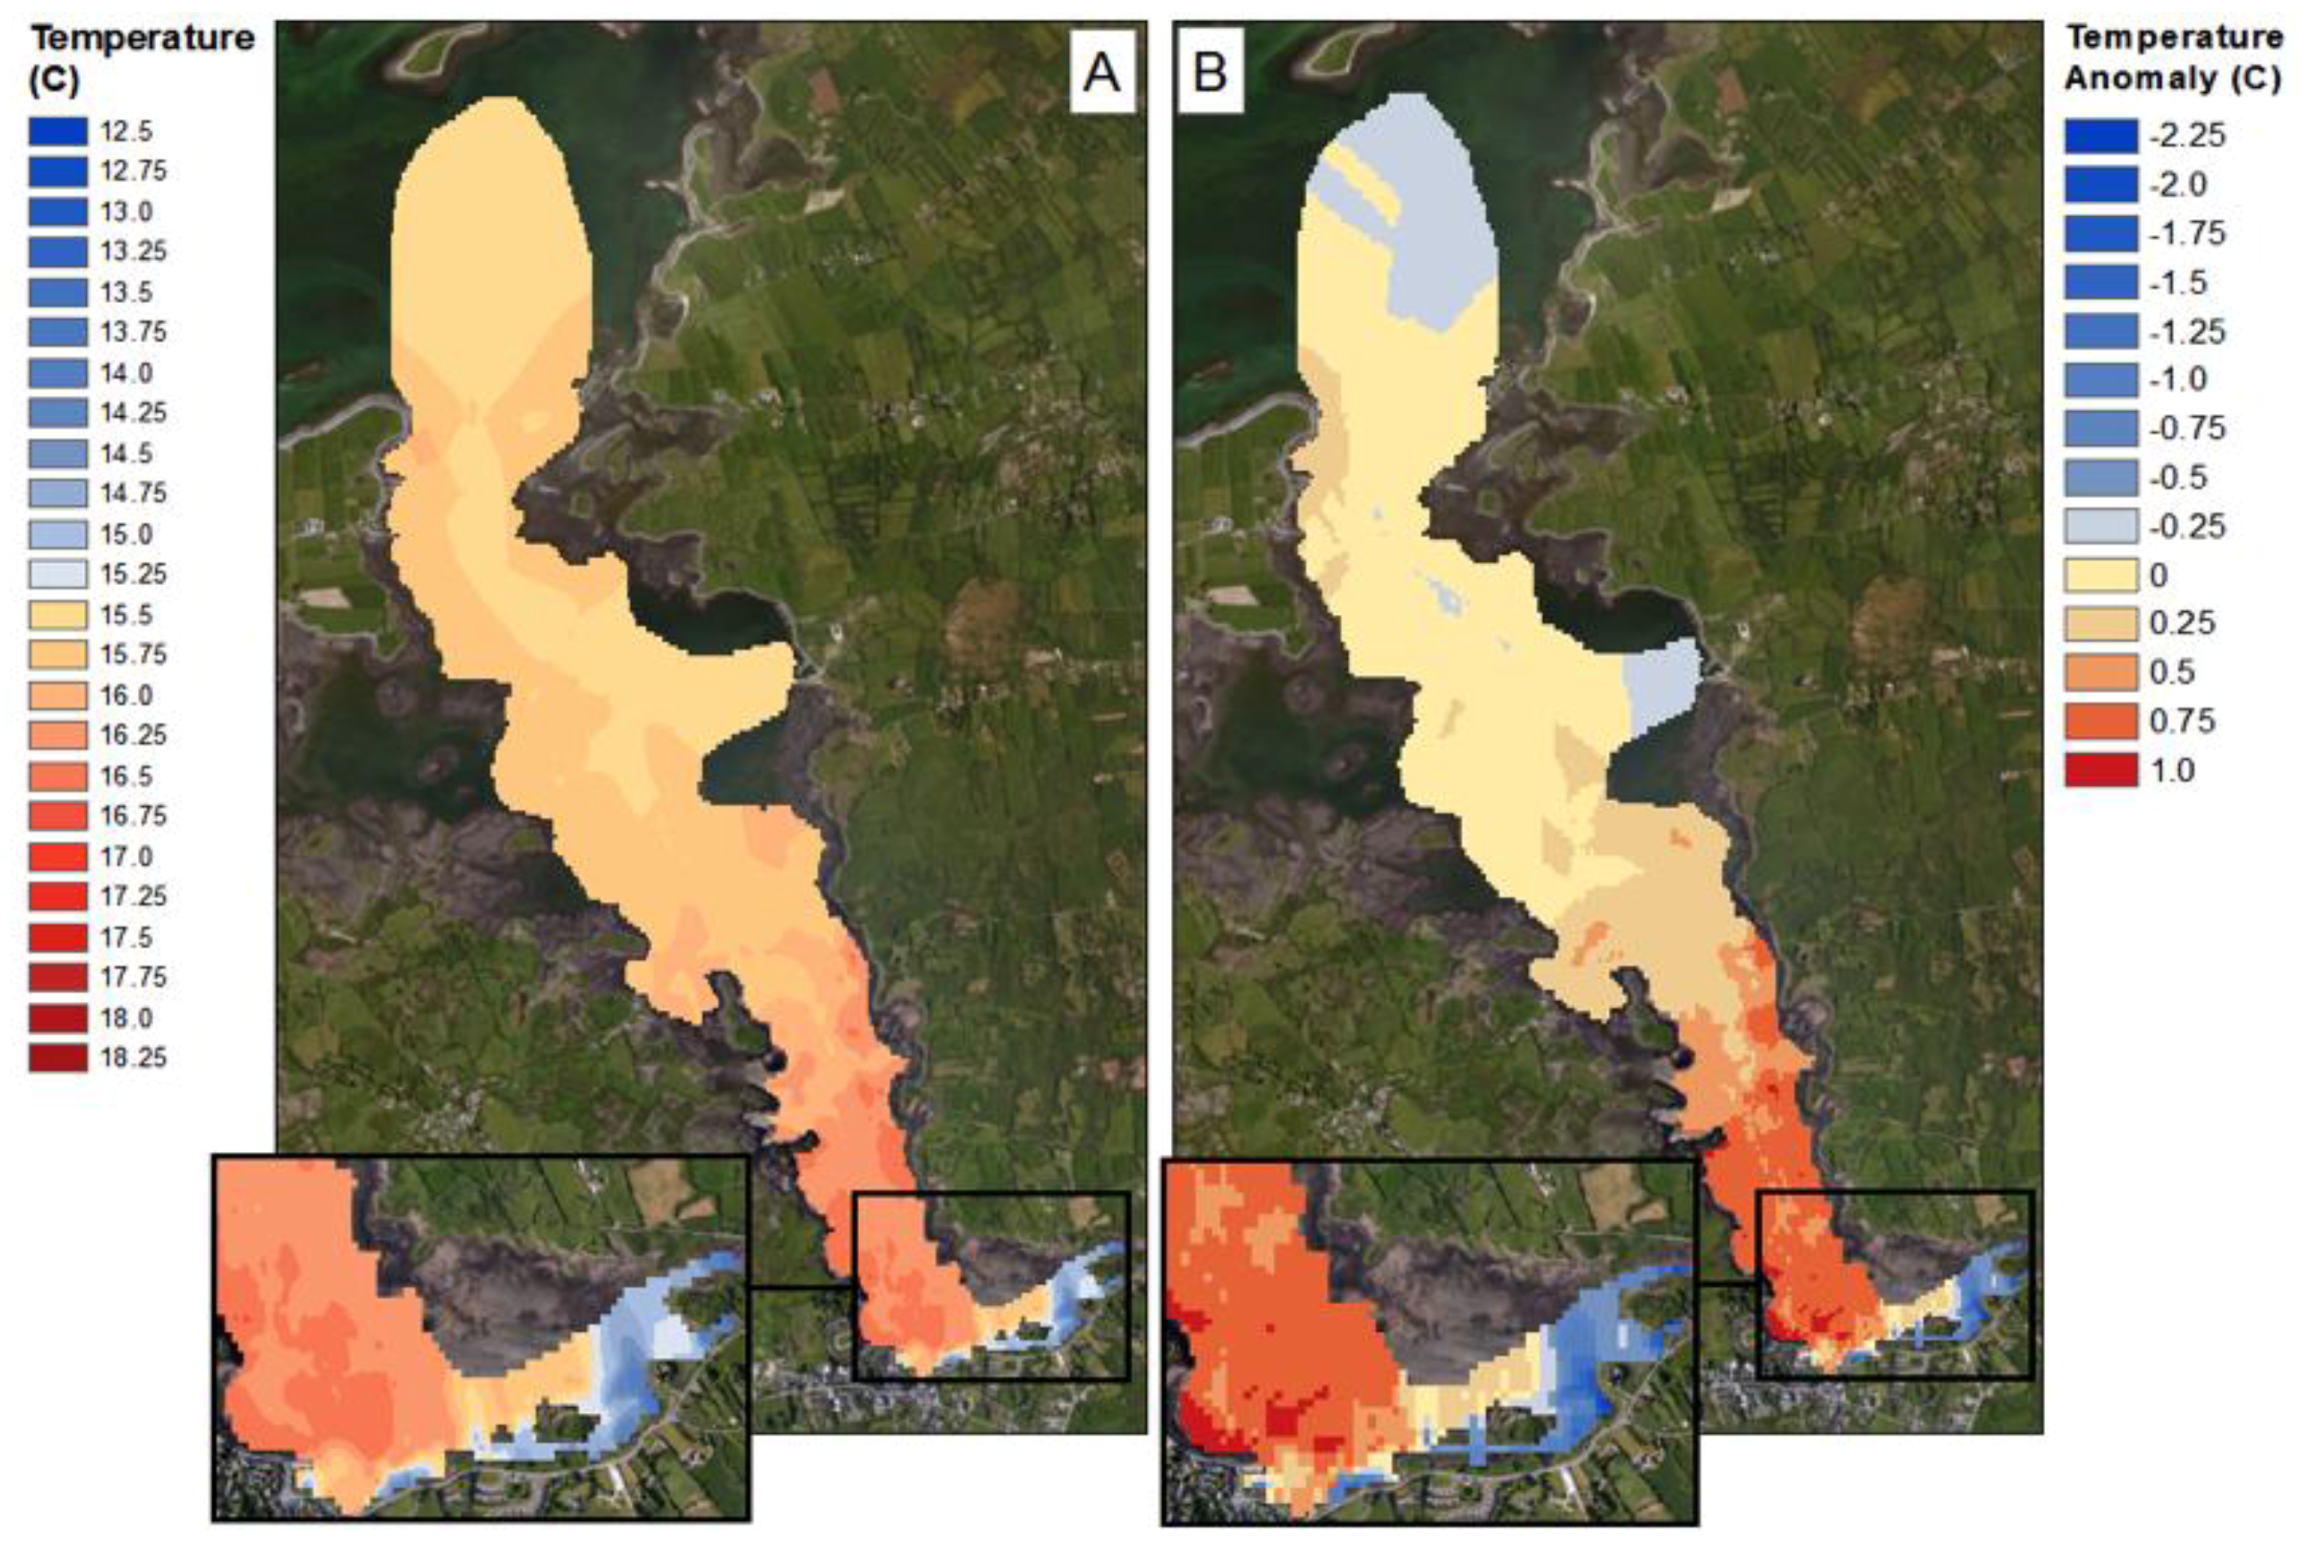
5]. The minimum surface temperature observed within the SST maps occurs coincides with the plumes of cold groundwater. To better illustrate the significance of these cold-water plumes, temperature anomaly (TA) maps were produced that detail the decrease (or increase) in surface temperature in relation to the average surface temperature of Kinvara Bay. The TA values range from −2.25 to +1.0 °C as illustrated in
Figure 7.
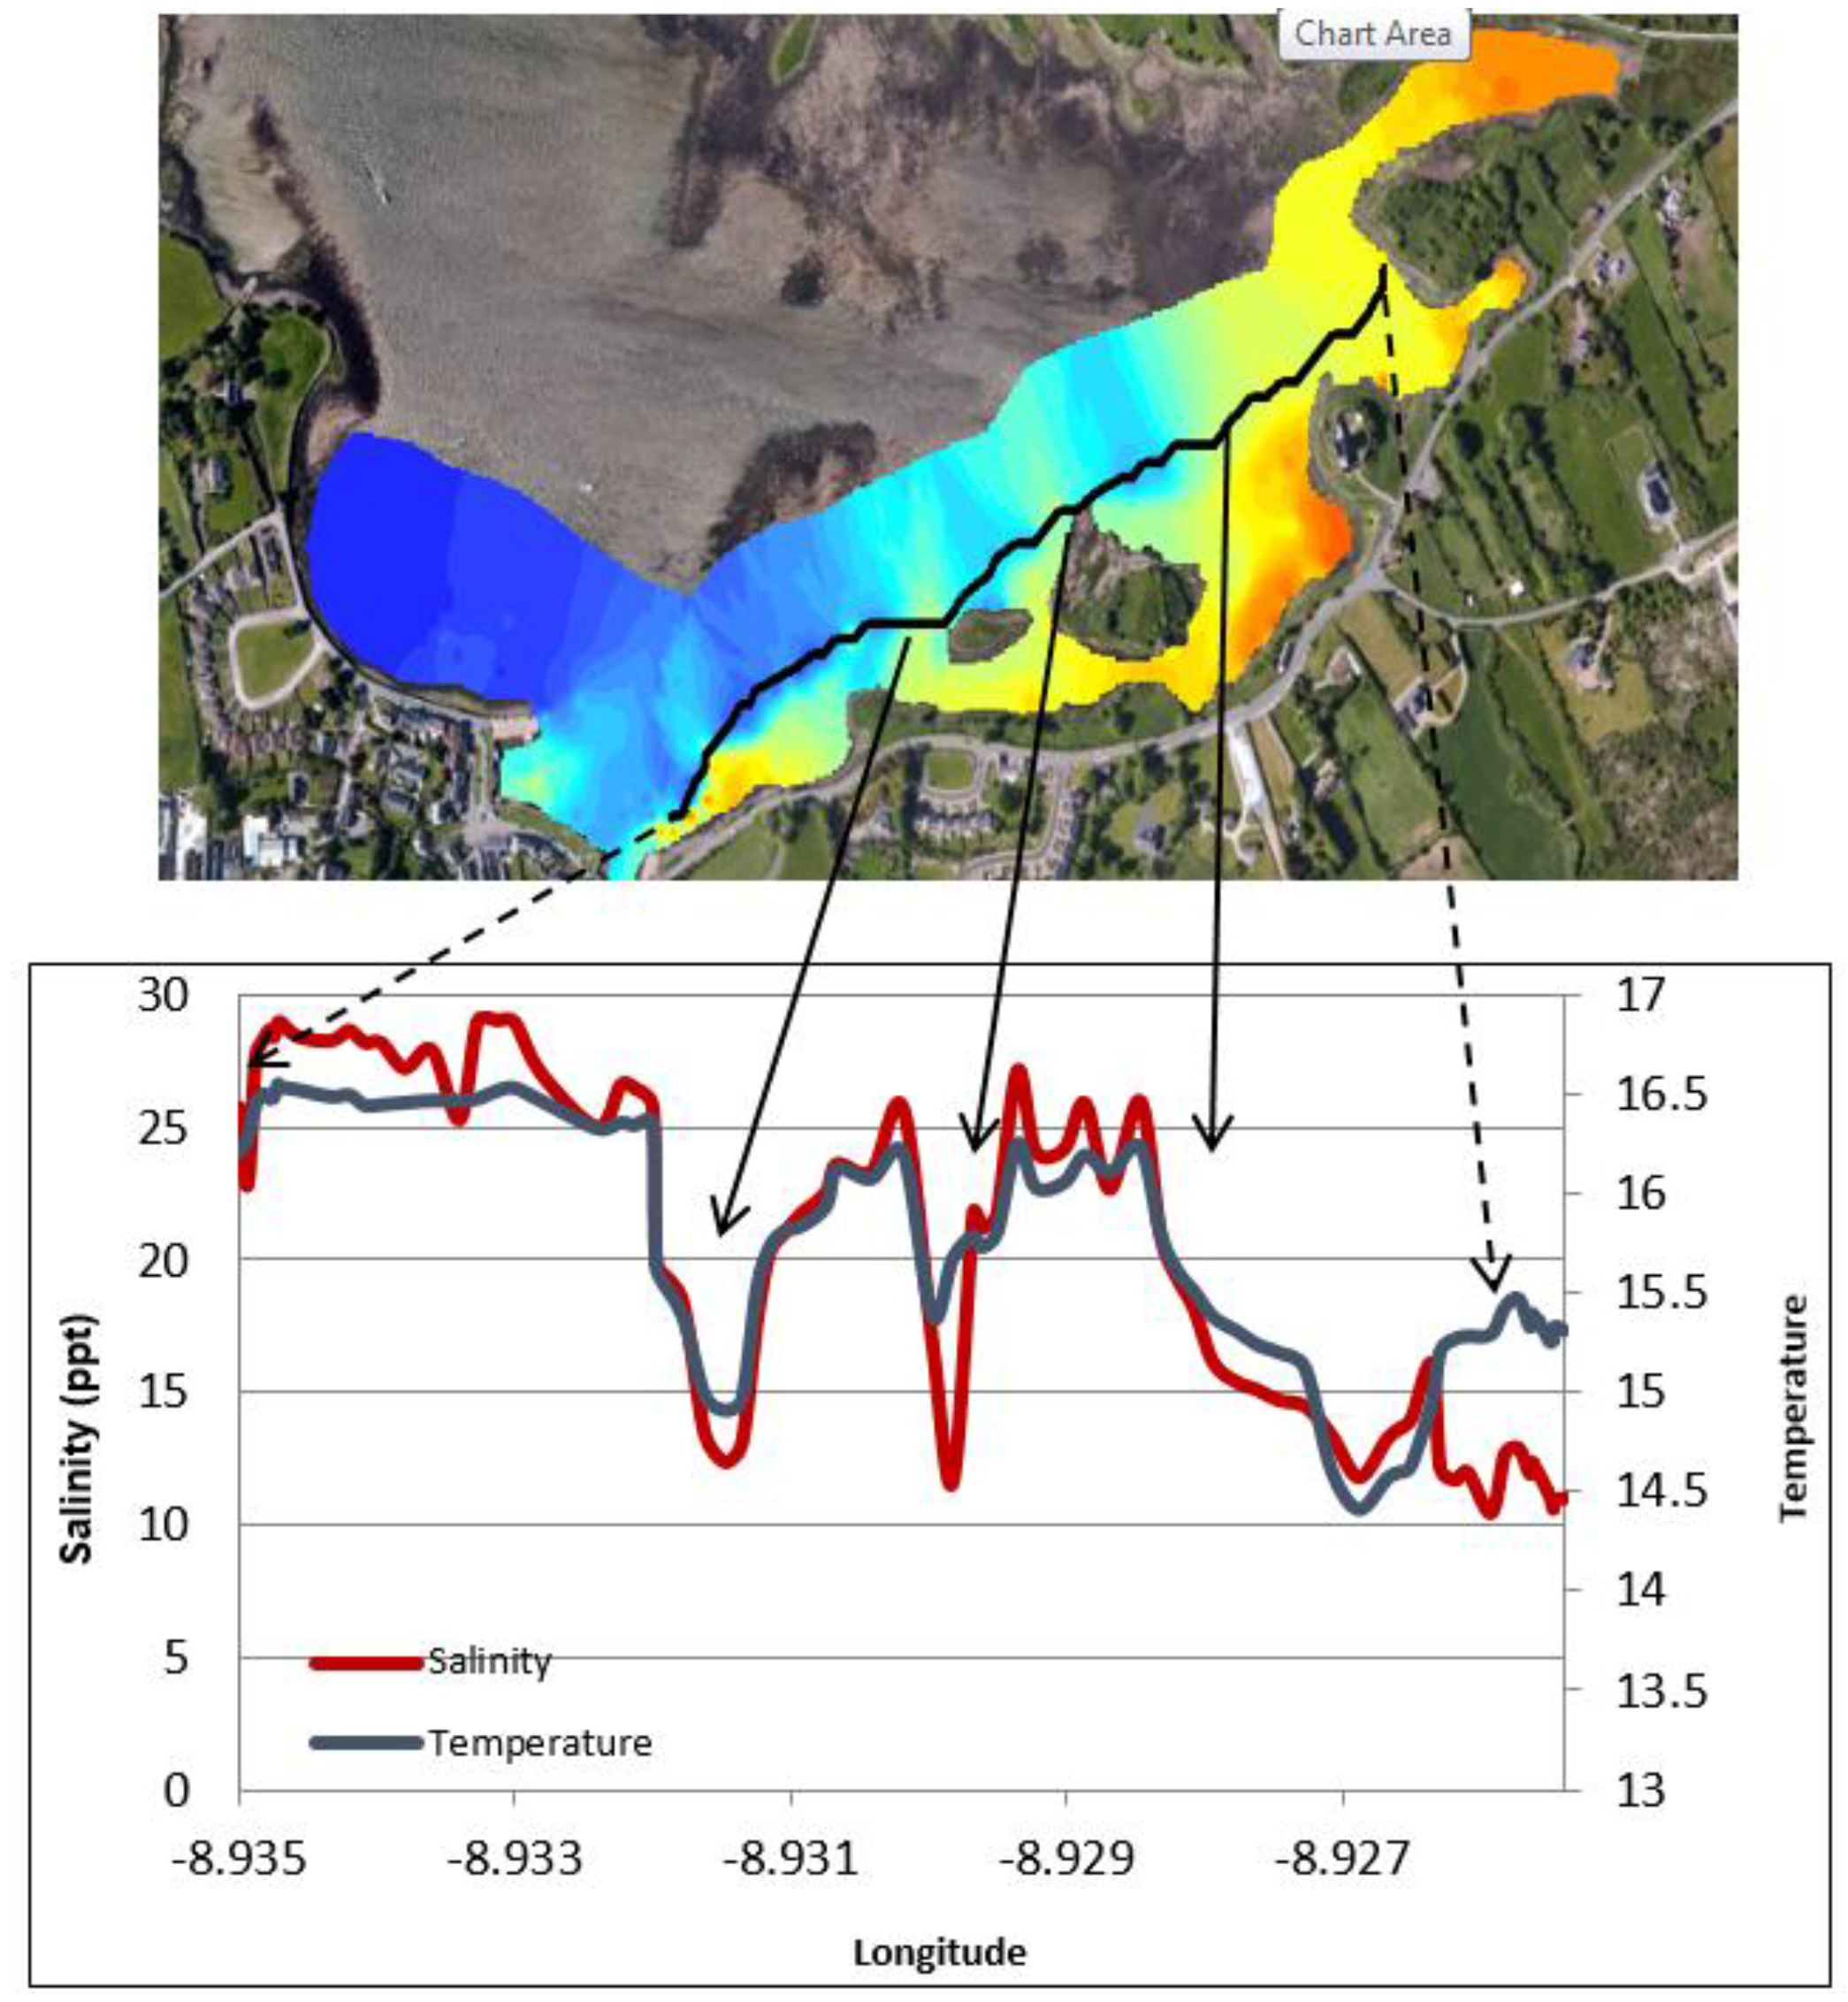
The TA maps help to put the temperature anomalies in context and also allow comparison of the relative differences from one plume to another. Using TA maps and an understanding of the surrounding geology, interpretations of the location and extent of groundwater discharge can be made. The largest negative TA values were located directly west of Dunguaire Castle and extend east along the shoreline towards the town of Kinvara. This is consistent with visual field evidence of groundwater discharge at these locations and is highly correlated with salinity anomaly patterns (
Figure 8). This correlation is strikingly illustrated in
Figure 9, which shows coincident features in temperature and salinity data associated with the locations of several groundwater springs.
3.4. Tidal Influences
Over the four-day sampling campaign, there was an estimated tidal range of 4.6 m. As expected, this had an impact on the mixing dynamics of the freshwater plumes. The trends at high and low tide are similar but extend further north towards the mouth of the bay during low tide (
Figure 9). At low tide, water depth is at a minimum, allowing freshwater inputs to have a greater influence on mixing in the southern portion of the bay. This is supported by the 0.5 °C decrease in water temperature during low tide and a decrease in salinity of 9 ppt. At both high and low tide, the strongest freshwater signature occurs near the castle, suggesting this is the largest source of freshwater.
The interpolated data indicate similar gradients in temperature and salinity exist across the bay, particularly in the southern half (
Figure 8,
Figure 9,
Figure 10,
Figure 11 and
Figure 12). A longitudinal profile of sea surface temperature and salinity (
Figure 9) reveals three distinct features in both temperature and salinity that correspond to the known locations of freshwater springs. These features also appear as cold-water plumes in the thermal images obtained from the fly-over data for which the main temperature features have been identified and labeled in
Figure 11. A comparison of these data sources is presented in
Figure 12.
3.5. Caherglassuan Turlough
According to previously published research [
4,
8,
11], the Caherglassuan Turlough is hydrologically connected to Kinvara Bay via a combination of conduits, fissures and cracks that are capable of transporting large volumes of groundwater. However, despite being inter-connected, results obtained during the sampling period show that two bodies of water display very different physical and chemical characteristics, see
Figure 13 and
Figure 14. On average, the temperature of the turlough is 2–3 °C warmer than the bay water and is well mixed with little spatial variation (
Figure 13). Salinity values are near 0 ppt throughout the turlough, which supports the contention that there was no transfer of seawater from the bay to the lough through the connecting channels during the sampling period. Interestingly, although the turlough water temperature is higher than the seawater, by the time it emerges in the bay, the freshwater is cooler than the seawater.
In addition to groundwater discharge, freshwater transfer to the bay can occur by other mechanisms, such as surface runoff and river discharge. Therefore, it cannot be assumed that the thermal and salinity signatures observed from initial analysis are solely due to groundwater discharge. However, the consistent patterns and locations of significant features across the in-situ salinity and temperature measurements, and the temperature imaging data suggest that (for the inner bay at least) these springs are the main sources of freshwater. It is also worth noting that the ability to visualise freshwater movements in the bay depends significantly on the lower density of freshwater compared to seawater, which results in the freshwater locating preferentially in the surface layer [
16]. The groundwater-seawater interface that occurs in the southern (inner) part of Kinvara Bay is therefore an ideal scenario to test these strategies for tracking water movement patterns. In contrast, freshwater-seawater interfaces arising from surface sources such as rivers in all probability would not present differences in temperature of the same extent, as the relatively low temperatures of the fresh water observed in this study appear to be associated with subterranean cooling.
3.6. Nutrient Analysis
SGIDs have long been identified as possible conduits for nutrient loading in coastal oceans [
6,
9,
16,
17,
18,
19]. Kinvara Bay is particularly vulnerable to this effect due to the karstified landscape and the hydrogeological connection from nutrient bearing freshwater sources to the bay. Nutrient concentrations within Kinvara Bay and Caherglassuan lough reported in this study are an average of 10 measurements taken at each sampling location during the sampling campaign (25–28 August 2015), see
Figure 5. Interestingly, nutrient concentrations within the inner bay were found to be lower at low tide than at high tide (see
Figure 13 and
Figure 14), possibly because the incoming tide inhibits movement and mixing (dilution) of the freshwater into the lower bay. Furthermore, in general, nutrient concentrations were consistently higher in samples taken at locations identified SGD sources, at both high and low tide, compared to non-freshwater sampling points [
16,
20].
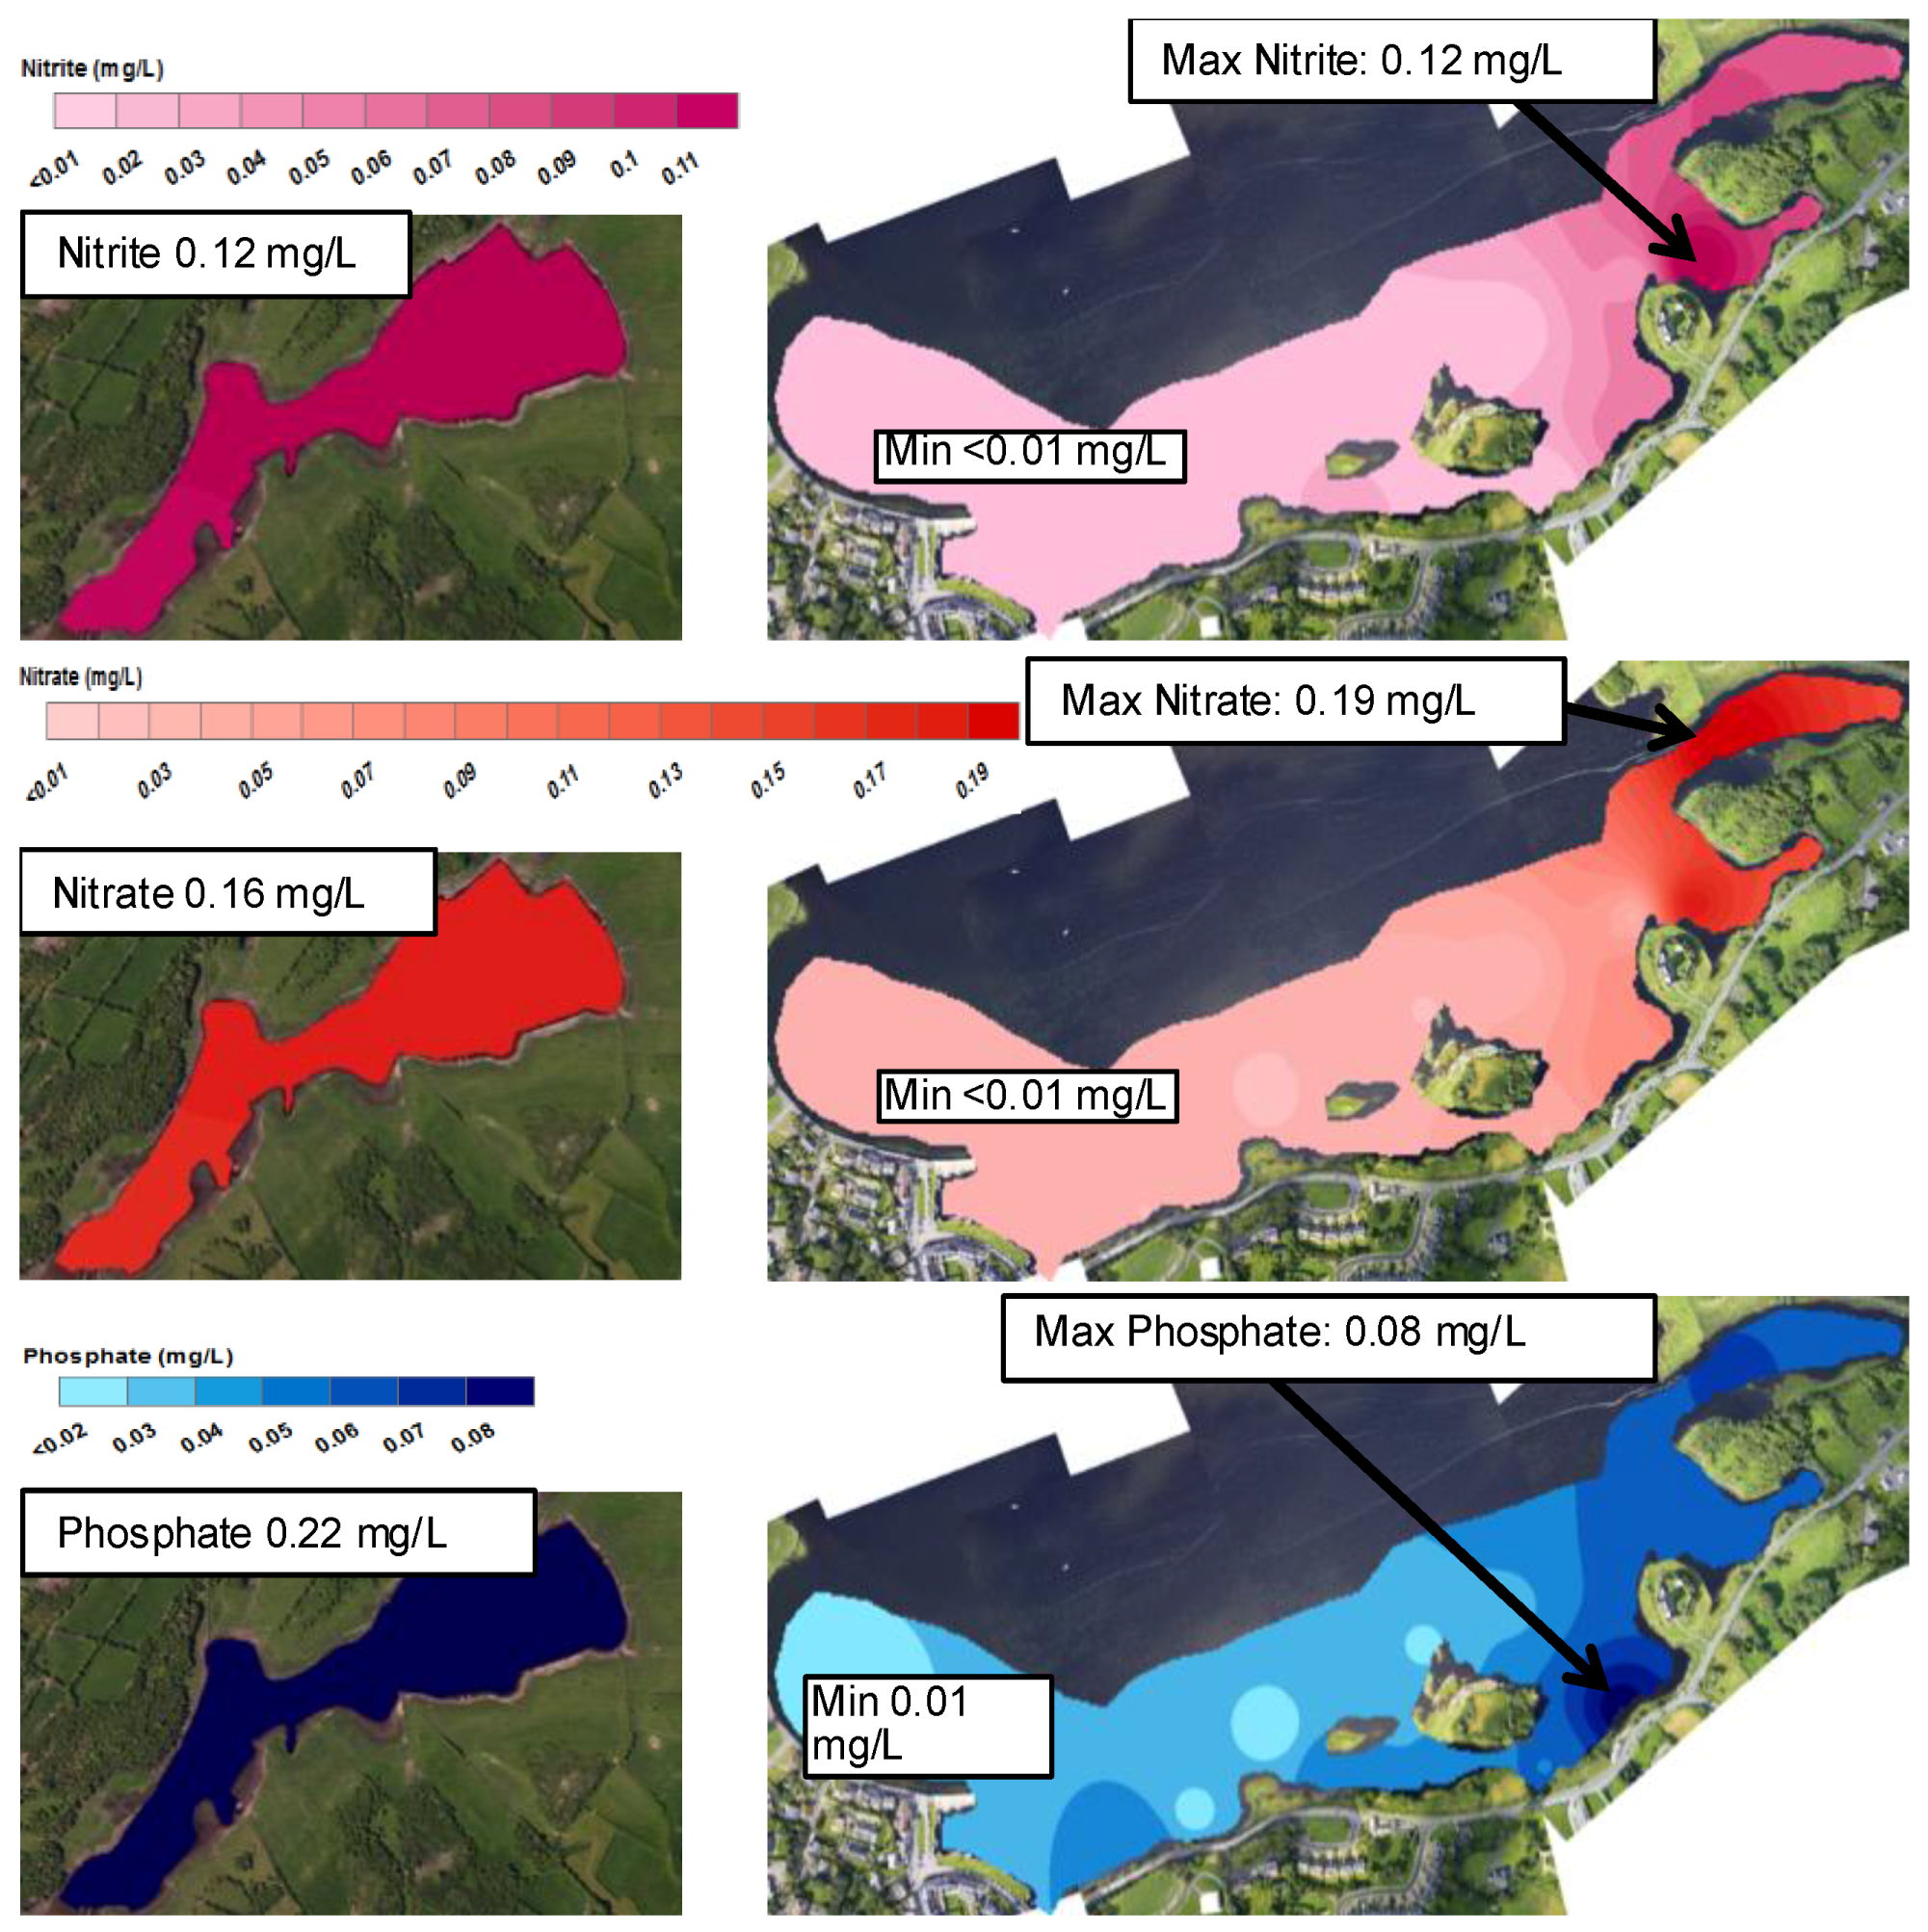
Nutrient levels in Caherglassuan lough were relatively uniform in samples taken throughout the lough with an average recorded for NO
3− (0.16 mg/L), NO
2− (0.12 mg/L) and PO
43− (0.22 mg/L). Corresponding concentrations found in the bay at the SGID sources were similar for NO
3− (0.017 mg/L, 0.12 mg/L), and NO
2− (0.05 mg/L, 0.19 mg/L) for low and high tide, respectively. However, the PO
43− concentration at the sources was significantly lower (0.05 mg/L and 0.08 mg/L, at low and high tide, respectively). The reason for this apparent decrease in PO
43− concentration is not clear and will require further validation and spatial variation studies to identify the extent of these differences. In their previous study, McCormick and Cave et al. [
6,
8] also found elevated concentrations of nutrients associated with these SGID sources, and, although their values were generally higher than the results obtained in this study, they were of the opinion that the nutrient influx to the bay was primarily coming from SGID freshwater sources associated with Caherglassuan Turlough.
The colour mapping patterns for nutrient concentration distribution in the inner bay shown in
Figure 14 and
Figure 15, are strikingly consistent with the salinity and temperature data discussed above, supporting the view that a significant amount of the nutrients in the inner bay comes from the SGID water sources. The stream emerging top right of the images also appears to convey significant amounts of nutrient to the bay (see for example
Figure 14). These patterns are not surprising, as the primary source of nutrient in the bay is expected to come from agricultural sources, transported from the turlough along the subterranean conduits and by surface streams.
4. Conclusions
This study has generated a large amount of new data, comprising in-situ temperature, salinity and phosphate measurements, together with fly-over IR thermal imaging, coordinated for temporal and spatial coverage. In addition, Landsat 8 satellite-based sea surface temperature measurements were studied for a period of 12 months. The satellite measurements suggested that the water in the inner bay was significantly lower than the rest of the bay, particularly in the area near Dunguaire Castle. In-situ measurements showed that the cooler water was strongly correlated with low salinity, confirming the contention that the cooler regions were due to fresh water emerging from SGID sources in the inner bay. Furthermore, concentration distributions of nutrients (particularly NO2− and NO3−) in the inner bay also exhibited a strongly correlated pattern, consistent with run-off from freshwater sources into the bay. This study suggests that it may be possible to track the dynamics of freshwater-seawater mixing behaviour in the bay using temperature, either by in-situ temperature measurements or by thermal imaging from fly overs or drones, or via satellite remote imaging. Clearly, therefore, the continuing improvements in satellite remote sensing spatial resolution will offer great opportunities to study water mixing dynamics, provided the boundaries for using temperature as a surrogate for salinity can be rigorously established, as this will vary depending on rainfall, tides, wind, sunshine, time of year, the extent to which the freshwater transfer to the sea is subterranean, and other factors. Our results suggest that an ideal strategy is to combine satellite remote SST sensing with an element of in-situ temperature and salinity sensing. The in-situ sensors provide accurate ground-truthing for local calibration of the thermal imaging data, while the satellite imaging offers access to huge spatial coverage. The implication is that the density of in-situ sensing locations could be reduced to a relatively small number of autonomous stations (e.g., instrumented buoys), reducing cost, and leveraging the tremendous potential of satellite data, opening the way to scalable models for implementing wide spatial coverage. Furthermore, the association of nutrient levels with the same locations implies that it may be possible to track the distribution and mixing dynamics of fresh water contamination in the bay at a relatively low cost. While this is an exciting prospect, it must be appreciated that this study was limited in scope, and the experimental data was gathered over a period of several days in a relatively confined region. More extensive studies should be invoked to validate these conclusions, and (if positive) identify the boundaries of the correlations, as these will be dynamic in terms of spatial distribution and the relative impact of various influencing factors.
Acknowledgments
The authors would like to acknowledge funding from SmartBay National Infrastructure Access Programme for funding for the project. The technical support provided by Shane Burke (Smart Bay Ireland) during the field campaign. Sail Galway Bay for providing the rib hire during the field campaign. Bob Welch for his efforts and contributions in the field. The COMMONSENSE Project funded from the European Union’s Seventh Framework Programme for research, technological development and demonstration under Grant Agreement No. 614155, and from Science Foundation Ireland under Grant SFI/12/RC/2289 (Insight Centre for Data Analytics).
Author Contributions
Margaret McCaul: Co-ordination of the collection of in-situ data measurements, obtaining and analyzing the experimental data. Preparation of the manuscript; Jack Barland: Fieldwork, obtaining and analyzing the experimental data, generation of ArcGis Maps in manuscript. Preparation of the manuscript; John Cleary: Project definition and Fieldwork; Conor Cahalane: Generation of the thermal imagery from aerial flyovers. Interpretation and analysis of the thermal imagery for the manuscript; Tim McCarthy: Co-ordination of the aerial flyovers for the study; interpretation and analysis of the thermal imagery for the manuscript; Dermot Diamond: Overall concept, project scientific coordinator; Preparation of the manuscript and corresponding author.
Conflicts of Interest
The authors declare no conflict of interest.
References
- AVHRR Pathfinder Version 5.2 Sea Surface Temperature Data Set. Available online: http://landsat.usgs.gov//about_ldcm.php (accessed on 10 June 2016).
- ESA Sentinel Remote Sensing Satellites. Available online: https://earth.esa.int/web/guest/missions/esa-operational-eo-missions/sentinel-2 (accessed on 10 June 2016).
- Diamond, D.; Coyle, S.; Scarmagnani, S.; Hayes, J. Wireless sensor networks and chemo-/biosensing. Chem. Rev. 2008, 108, 652–679. [Google Scholar] [PubMed]
- Wilson and Rocha 2012 SGD from Medium Resolution TIR Satellite Imagery. Available online: https://www.researchgate.net/profile/Carlos_Rocha10/publication/256850158_Regional_scale_assessment_of_Submarine_Groundwater_Discharge_in_Ireland_combining_medium_resolution_satellite_imagery_and_geochemical_tracing_techniques/links/53d765da0cf228d363eafe8e.pdf (accessed on 30 July 2016).
- Wilson, J.; Rocha, C. Regional-Scale Assessment of Submarine Groundwater Discharge Using Remote Sensing; Environmental Protection Agency: Washington, DC, USA, 2013.
- McCormack, T.; Gill, L.W.; Naughton, O.; Johnston, P.M. Quantification of submarine/intertidal groundwater discharge and nutrient loading from a lowland karst catchment. J. Hydrol. 2014, 519, 2318–2330. [Google Scholar]
- Schubert, M.; Scholten, J.; Schmidt, A.; Comanducci, J.; Pham, M.; Mallast, U.; Knoeller, K. Submarine Groundwater Discharge at a Single Spot Location: Evaluation of Different Detection Approaches. Water 2014, 6, 584–601. [Google Scholar]
- Cave, R.R.; Henry, T. Intertidal and submarine groundwater discharge on the west coast of Ireland. Estuar. Coast. Shelf Sci. 2011, 92, 415–423. [Google Scholar]
- Smith, A.M.; Cave, R.R. Influence of fresh water, nutrients and DOC in two submarine-groundwater-fed estuaries on the west of Ireland. Sci. Total Environ. 2012, 438, 260–270. [Google Scholar] [PubMed]
- Williams, N.H.; Lee, M. Ireland at risk—Possible implications for groundwater resources of climate change. Geol. Surv. Irel. 2008, 13, 1–28. [Google Scholar]
- Drew, D.P. Hydrogeology of lowland karst in Ireland. Q. J. Eng. Geol. Hydrogeol. 2008, 41, 61–72. [Google Scholar]
- ArcGIS. Available online: https://www.arcgis.com/features/index.html (accessed on 10 June 2016).
- Water Framework Directive Groundwater Monitoring Programme, Site Information Kinvara Springs. Available online: https://www.epa.ie/pubs/reports/water/ground/gwmpinfo/EPA_GWMP_Kinvara%20Springs.pdf (accessed on 3 July 2016).
- USGS, NASA Landsat Program. Available online: http://landsat.usgs.gov/landsat8.php (accessed on 30 June 2016).
- Wilson, J.; Rocha, C. Regional scale assessment of Submarine Groundwater Discharge in Ireland combining medium resolution satellite imagery and geochemical tracing techniques. Remote Sens. Environ. 2012, 119, 21–34. [Google Scholar]
- Beck, A.J.; Tsukamoto, Y.; Tovar-Sanchez, A.; Huerta-Diaz, M.; Bokuniewicz, H.J.; Sañudo-Wilhelmy, S.A. Importance of geochemical transformations in determining submarine groundwater discharge-derived trace metal and nutrient fluxes. Appl. Geochem. 2007, 22, 477–490. [Google Scholar]
- Johnson, A.G.; Glenn, C.R.; Burnett, W.C.; Peterson, R.N.; Lucey, P.G. Aerial infrared imaging reveals large nutrient-rich groundwater inputs to the ocean. Geophys. Res. Lett. 2008, 35. [Google Scholar] [CrossRef]
- Slomp, C.P.; Van Cappellen, P. Nutrient inputs to the coastal ocean through submarine groundwater discharge: Controls and potential impact. J. Hydrol. 2004, 295, 64–86. [Google Scholar]
- Urquidi-Gaume, M.; Santos, I.R.; Lechuga-Deveze, C. Submarine groundwater discharge as a source of dissolved nutrients to an arid coastal embayment (La Paz, Mexico). Environ. Earth Sci. 2016, 75, 1–13. [Google Scholar]
- Burnett, W.C.; Aggarwal, P.K.; Aureli, A.; Bokuniewicz, H.; Cable, J.E.; Charette, M.A.; Kontar, E.; Krupa, S.; Kulkarni, K.M.; Loveless, A.; et al. Quantifying submarine groundwater discharge in the coastal zone via multiple methods. Sci. Total Environ. 2006, 367, 498–543. [Google Scholar] [PubMed]
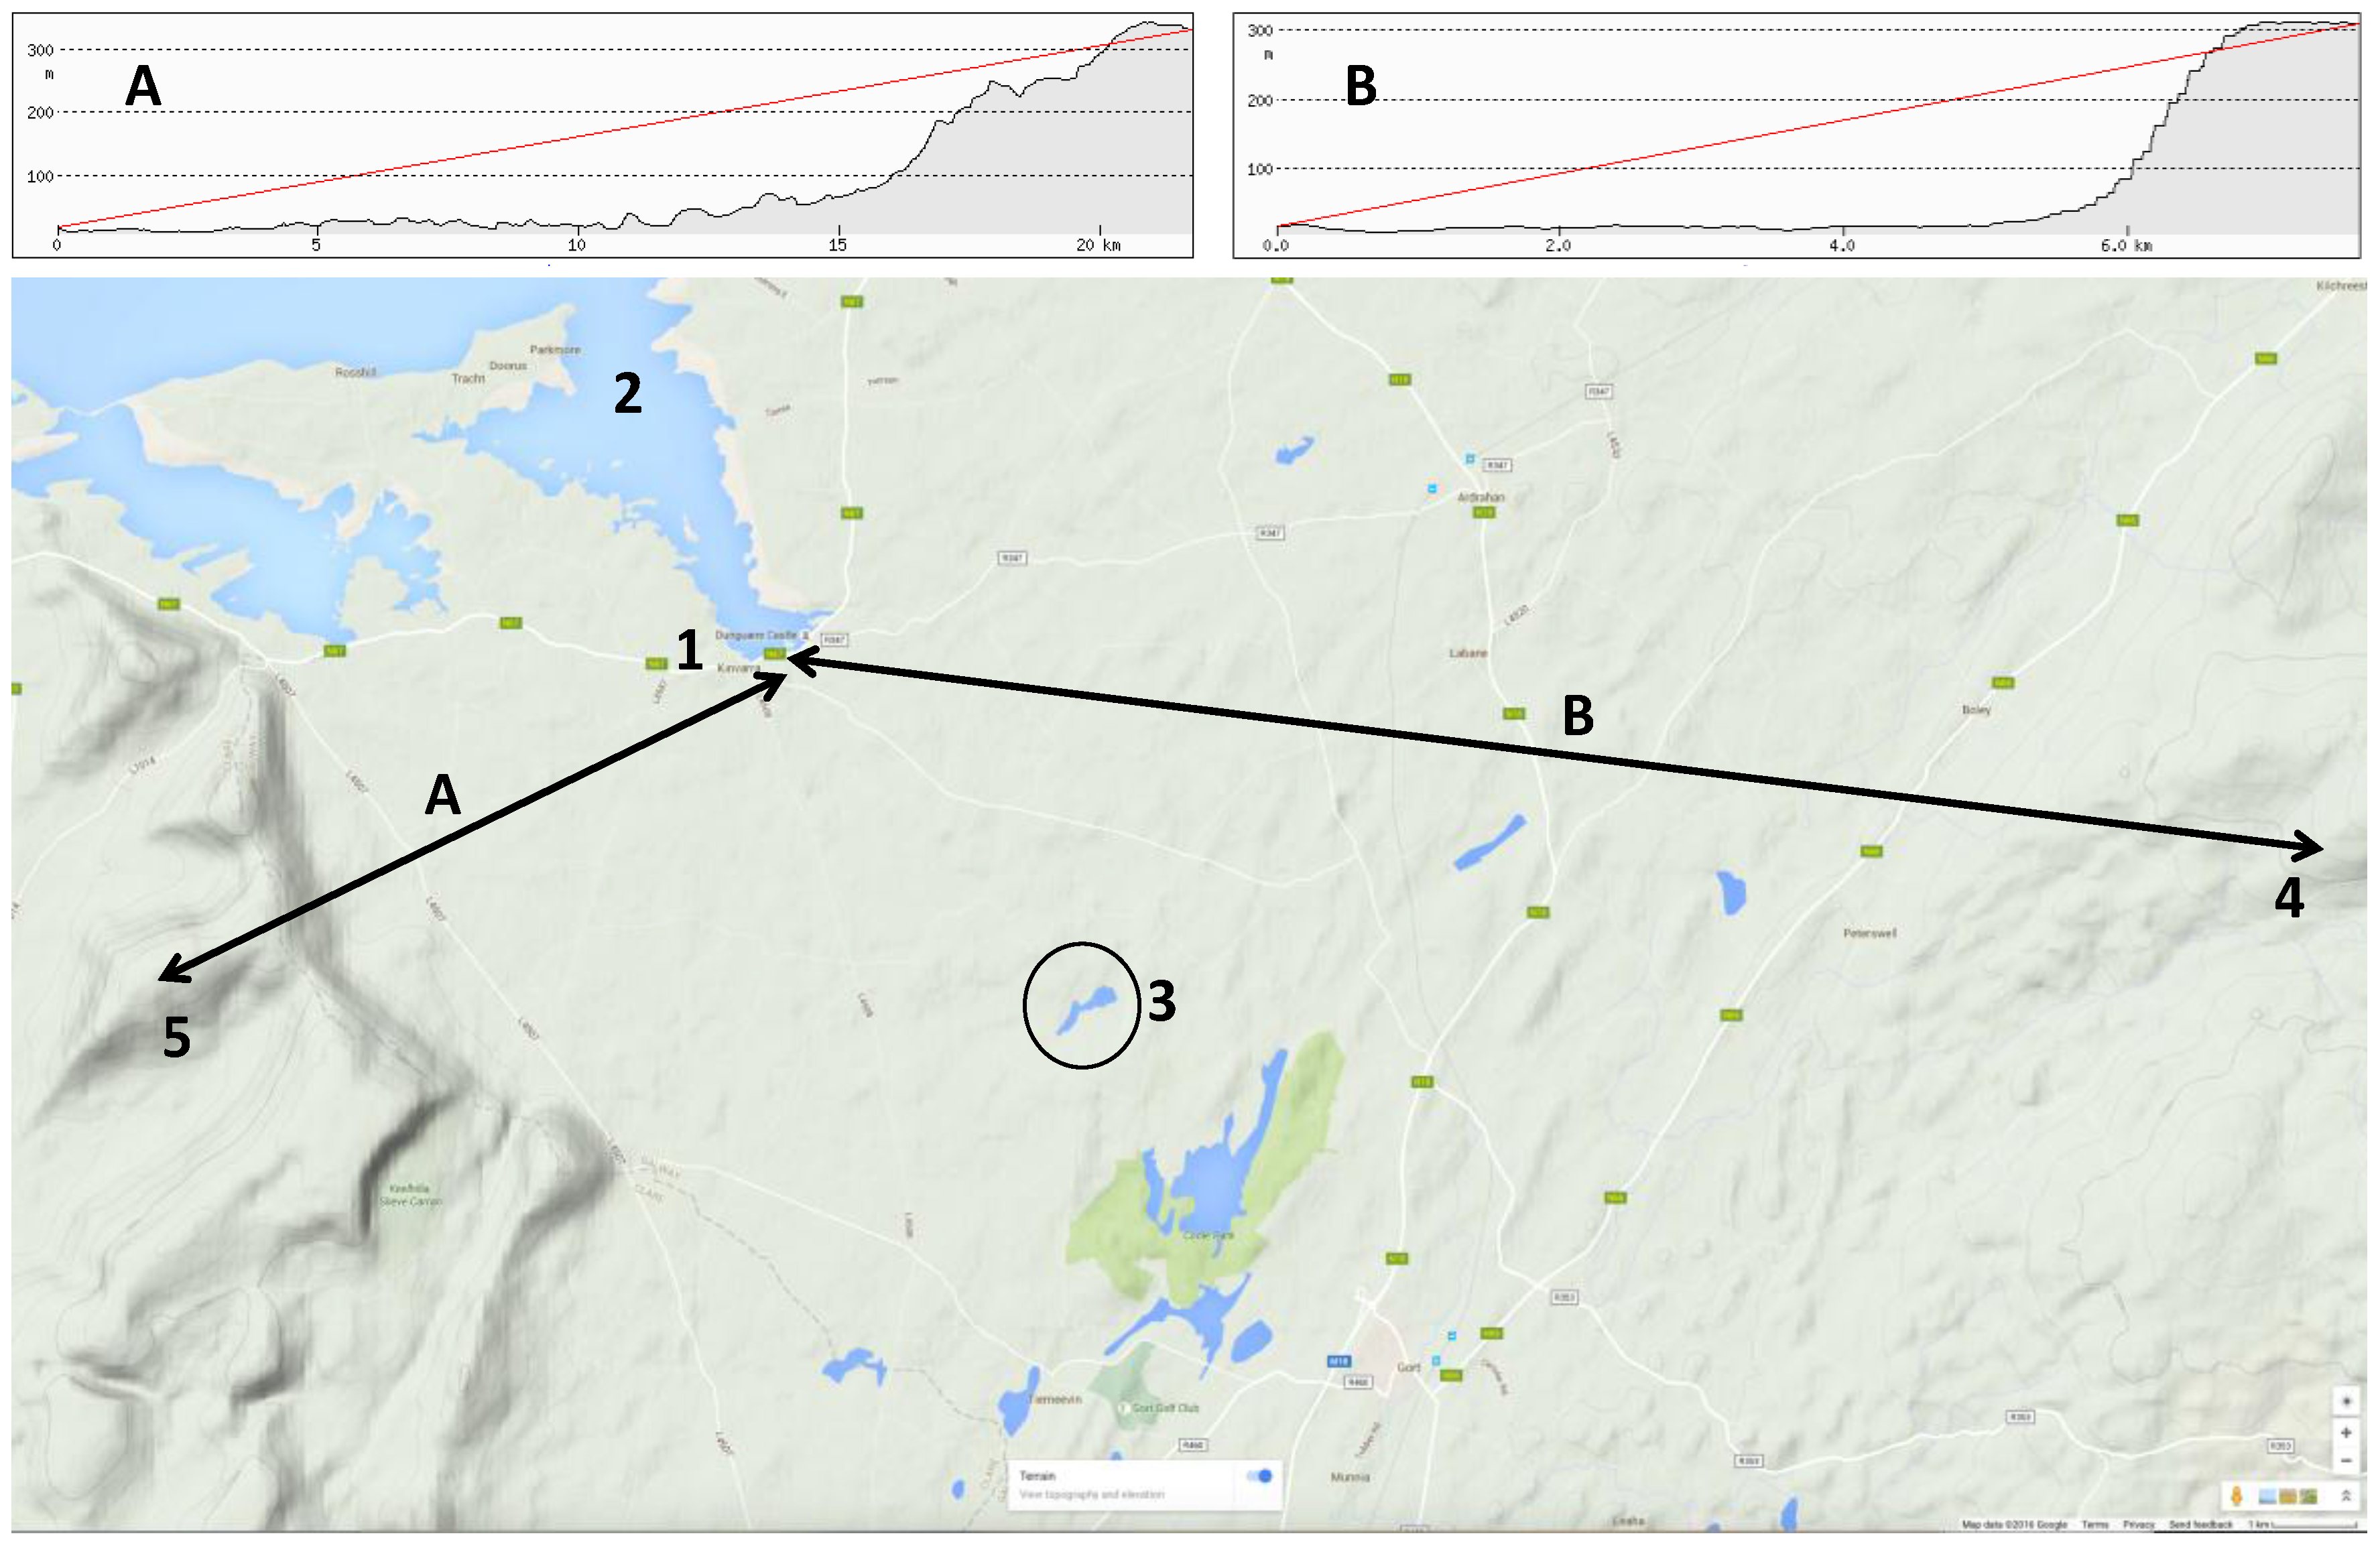
Figure 1.
(1) Kinvara; (2) Kinvara Bay; (3) Caherglassuan Turlough; (1–4) Section A from Kinvara Eastwards towards Peterswell and the Slieve Aughty Region (4); (1–5) Section B from Kinvara Southwest towards Slieve Carran.
Figure 1.
(1) Kinvara; (2) Kinvara Bay; (3) Caherglassuan Turlough; (1–4) Section A from Kinvara Eastwards towards Peterswell and the Slieve Aughty Region (4); (1–5) Section B from Kinvara Southwest towards Slieve Carran.
Figure 2.
Hydrological connections to Kinvara Bay identified using groundwater tracers [
11]. The blue lines represent subterranean pathways due to the Karst nature of the region that result in a number of inter-tidal discharges of cooler freshwater into the inner bay.
Figure 2.
Hydrological connections to Kinvara Bay identified using groundwater tracers [
11]. The blue lines represent subterranean pathways due to the Karst nature of the region that result in a number of inter-tidal discharges of cooler freshwater into the inner bay.
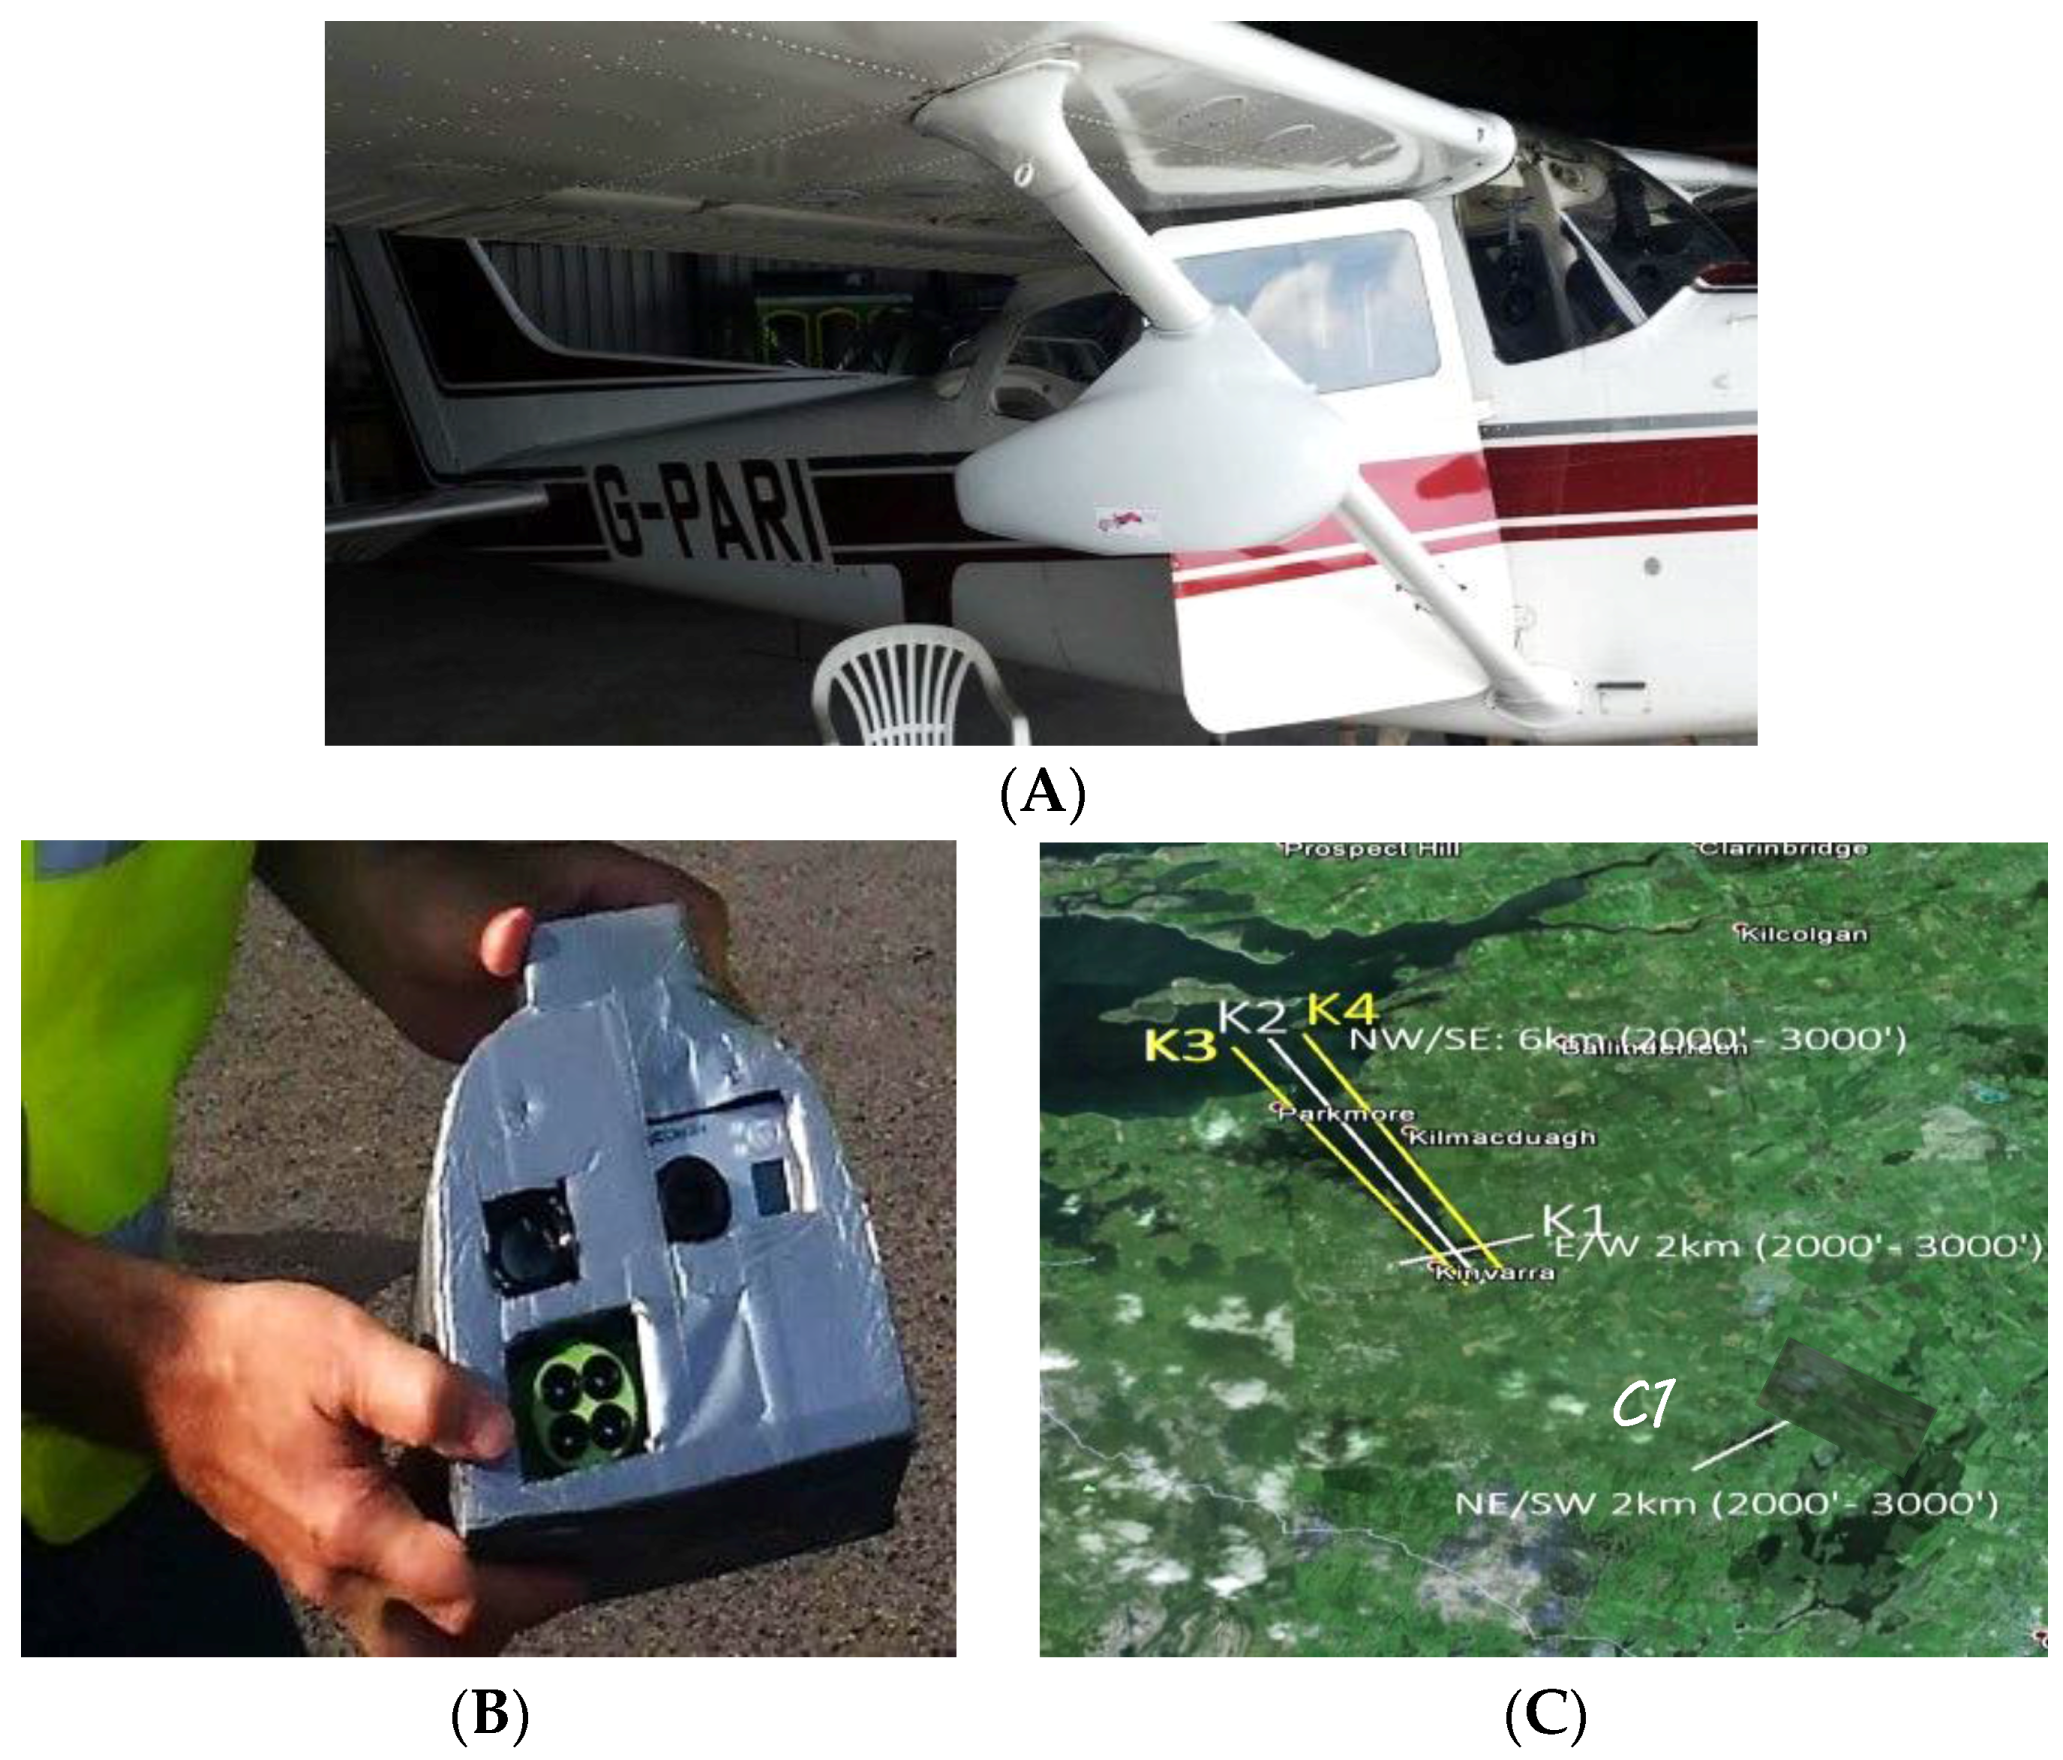
Figure 3.
(A) Sensor pod mounted on the wing strut of a Cessna 172 light aircraft; (B) The NCG sensor pod used to acquire data; (C) Flight paths for aerial flyovers of Kinvara Bay and catchment area. K1 covers the inner bay while K2, K3 and K4 map the length of the bay from Kinvara to the mouth of the bay.
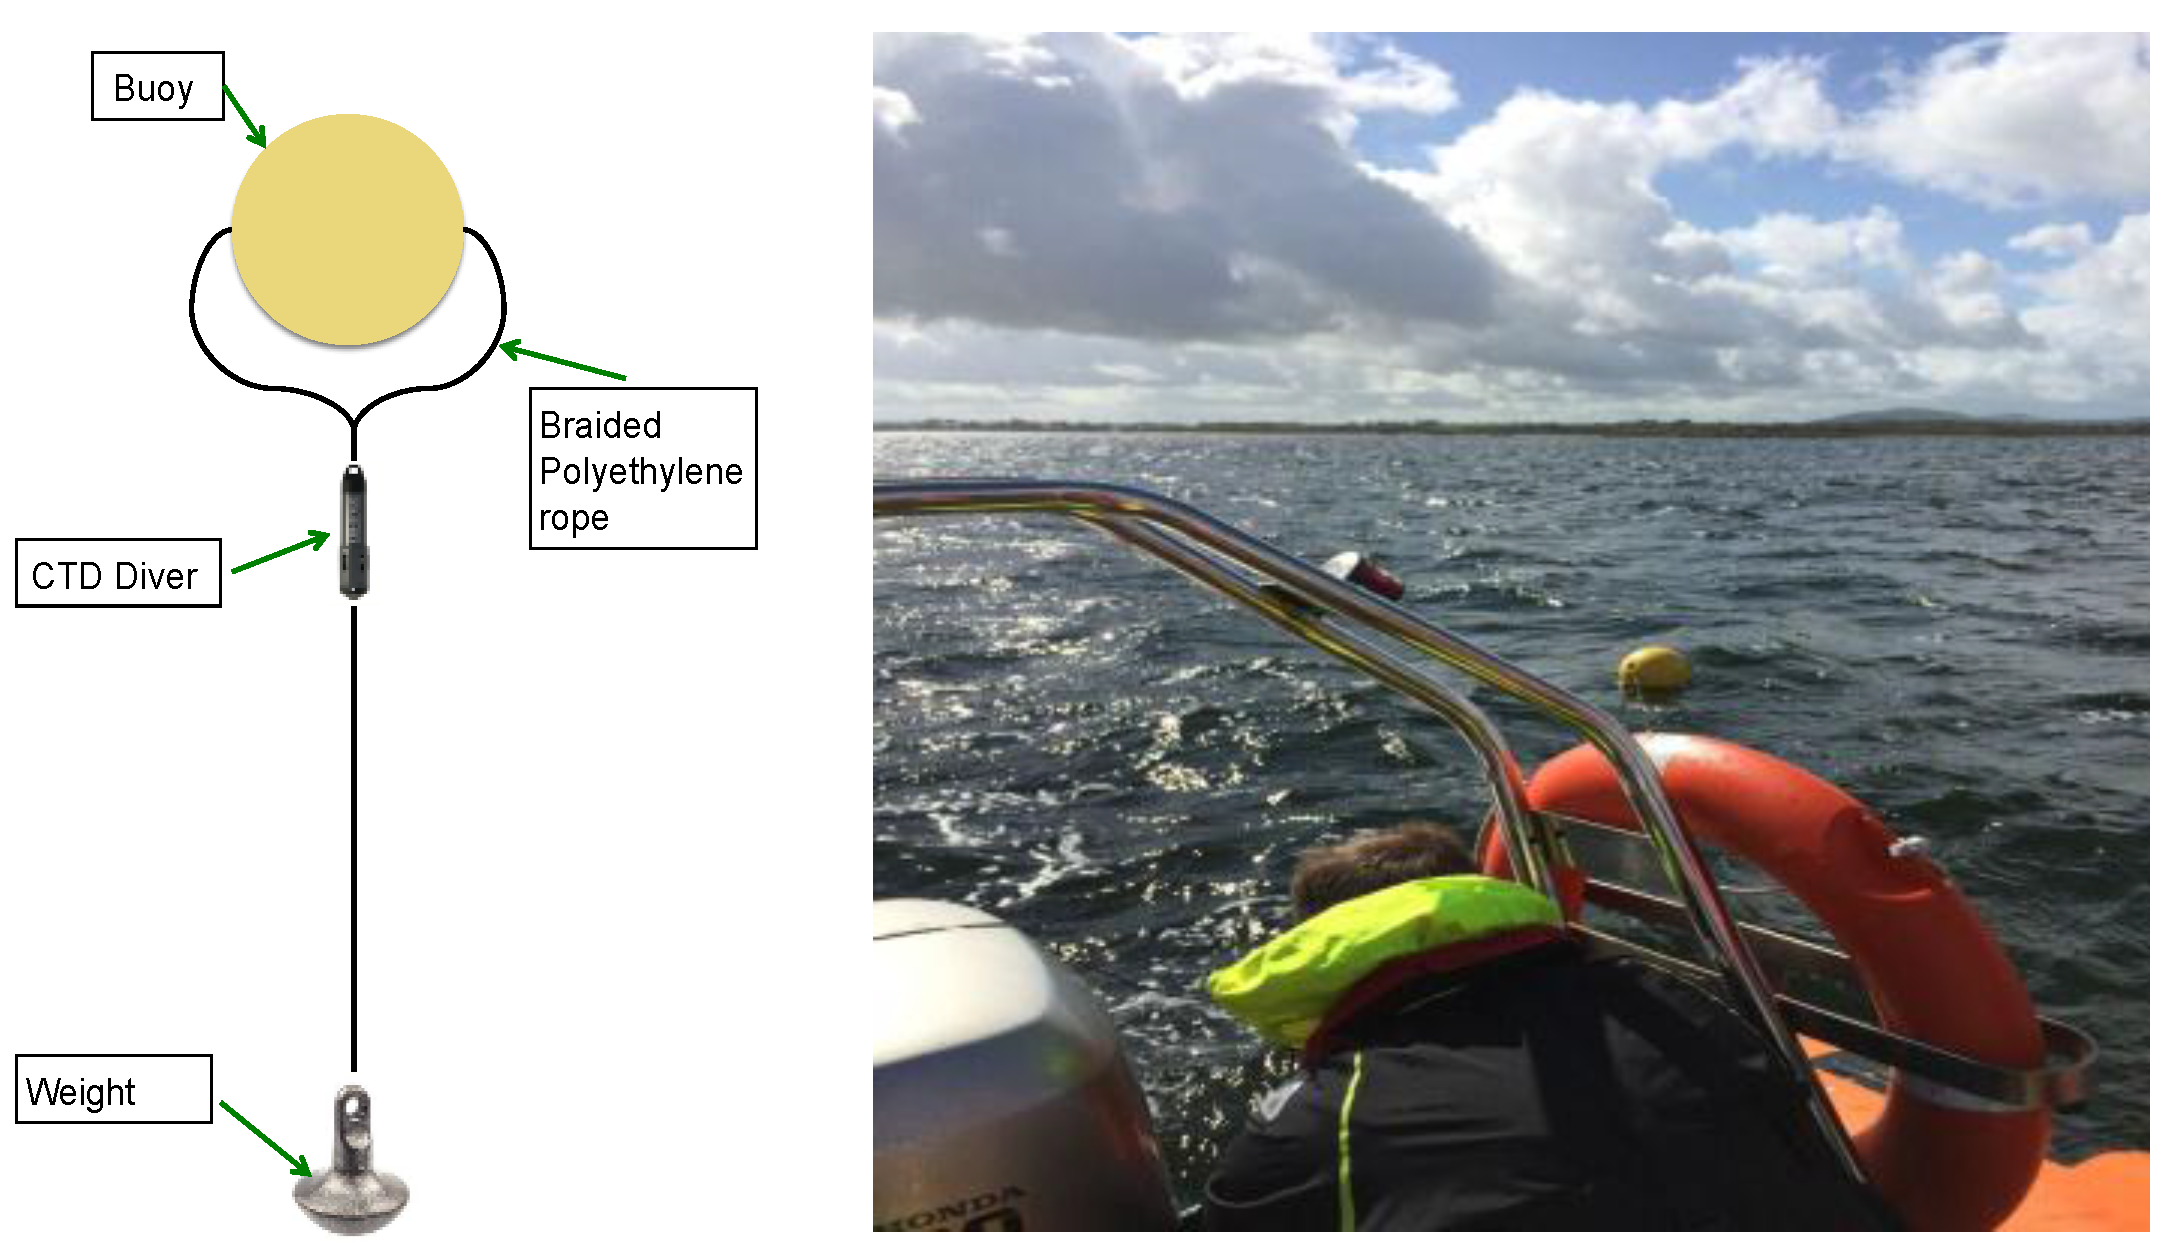
Figure 4.
Schematic diagram of the sampling rig set up (left) showing the CTD Diver sensor attached to a float using a 2 mm braided polyethylene rope with a weight fixed at the bottom to keep the sensor in a vertical position. The float can be seen (right) slightly left of centre during a sensing transect of the bay.
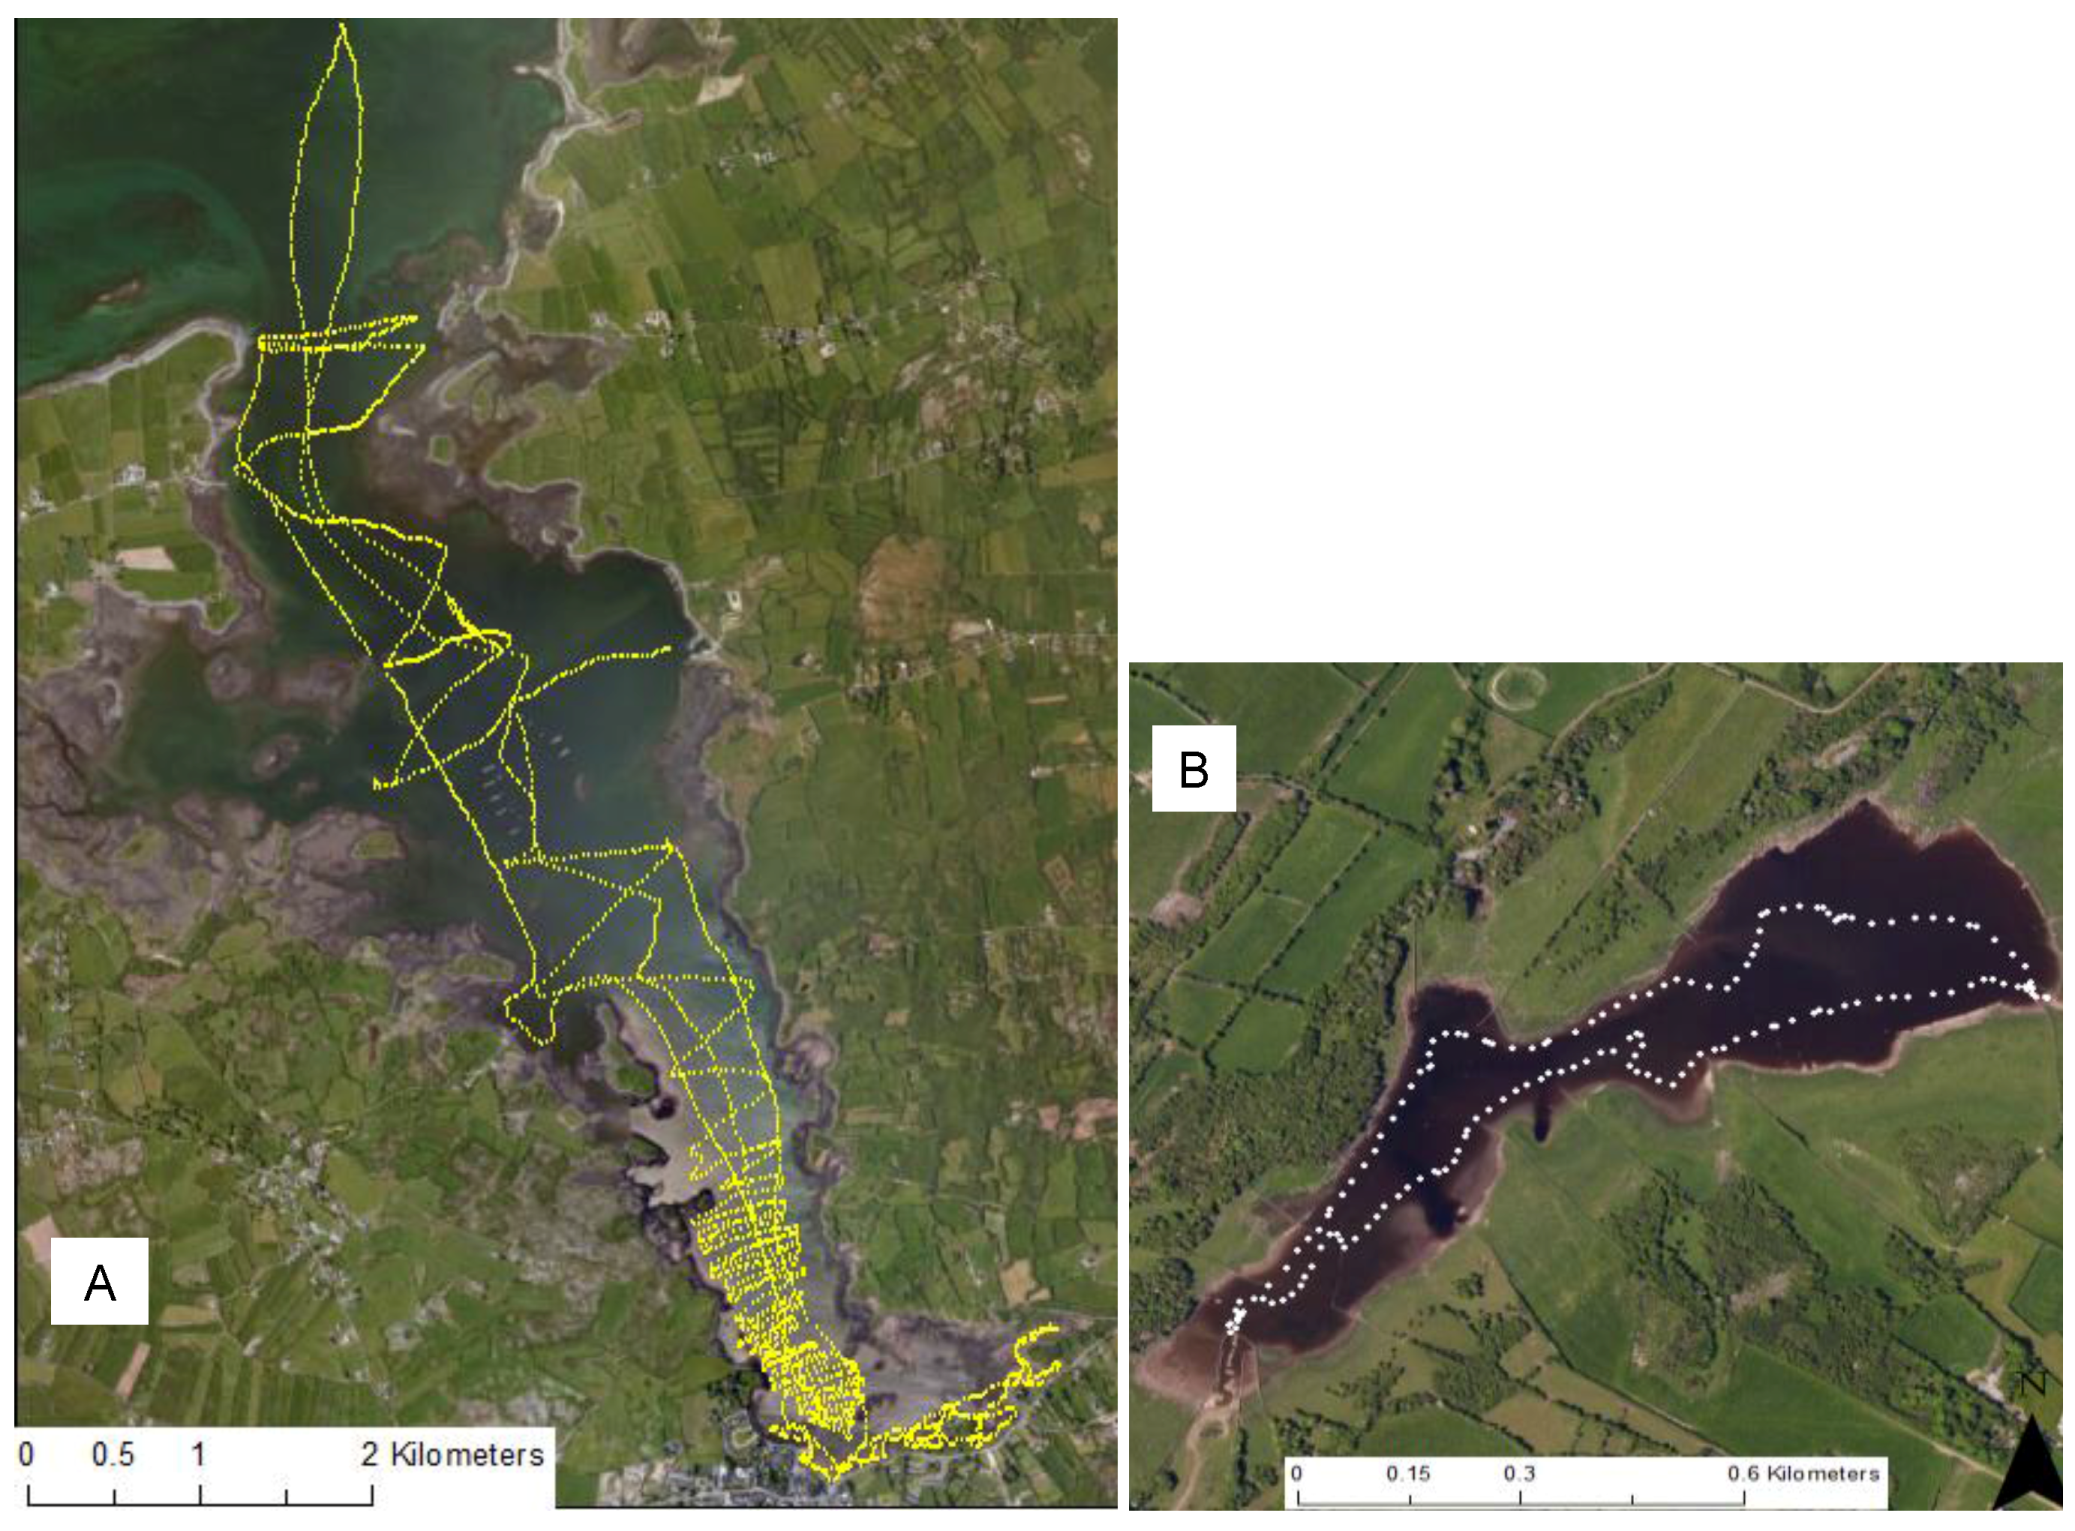
Figure 5.
Location of in-situ data points collected over a four-day sampling campaign in (A) Kinvara Bay and (B) Cahergluassuan Turlough (25–28 August 2015).
Figure 5.
Location of in-situ data points collected over a four-day sampling campaign in (A) Kinvara Bay and (B) Cahergluassuan Turlough (25–28 August 2015).
Figure 6.
July 2013 sea surface temperature map of Kinvara Bay generated from Landsat 8 satellite imagery [
14].
Figure 6.
July 2013 sea surface temperature map of Kinvara Bay generated from Landsat 8 satellite imagery [
14].
Figure 7.
Sea surface temperature map of Kinvara Bay interpolated from in-situ data measurements (A); Temperature anomaly map showing surface temperature divergence from the mean (B).
Figure 7.
Sea surface temperature map of Kinvara Bay interpolated from in-situ data measurements (A); Temperature anomaly map showing surface temperature divergence from the mean (B).
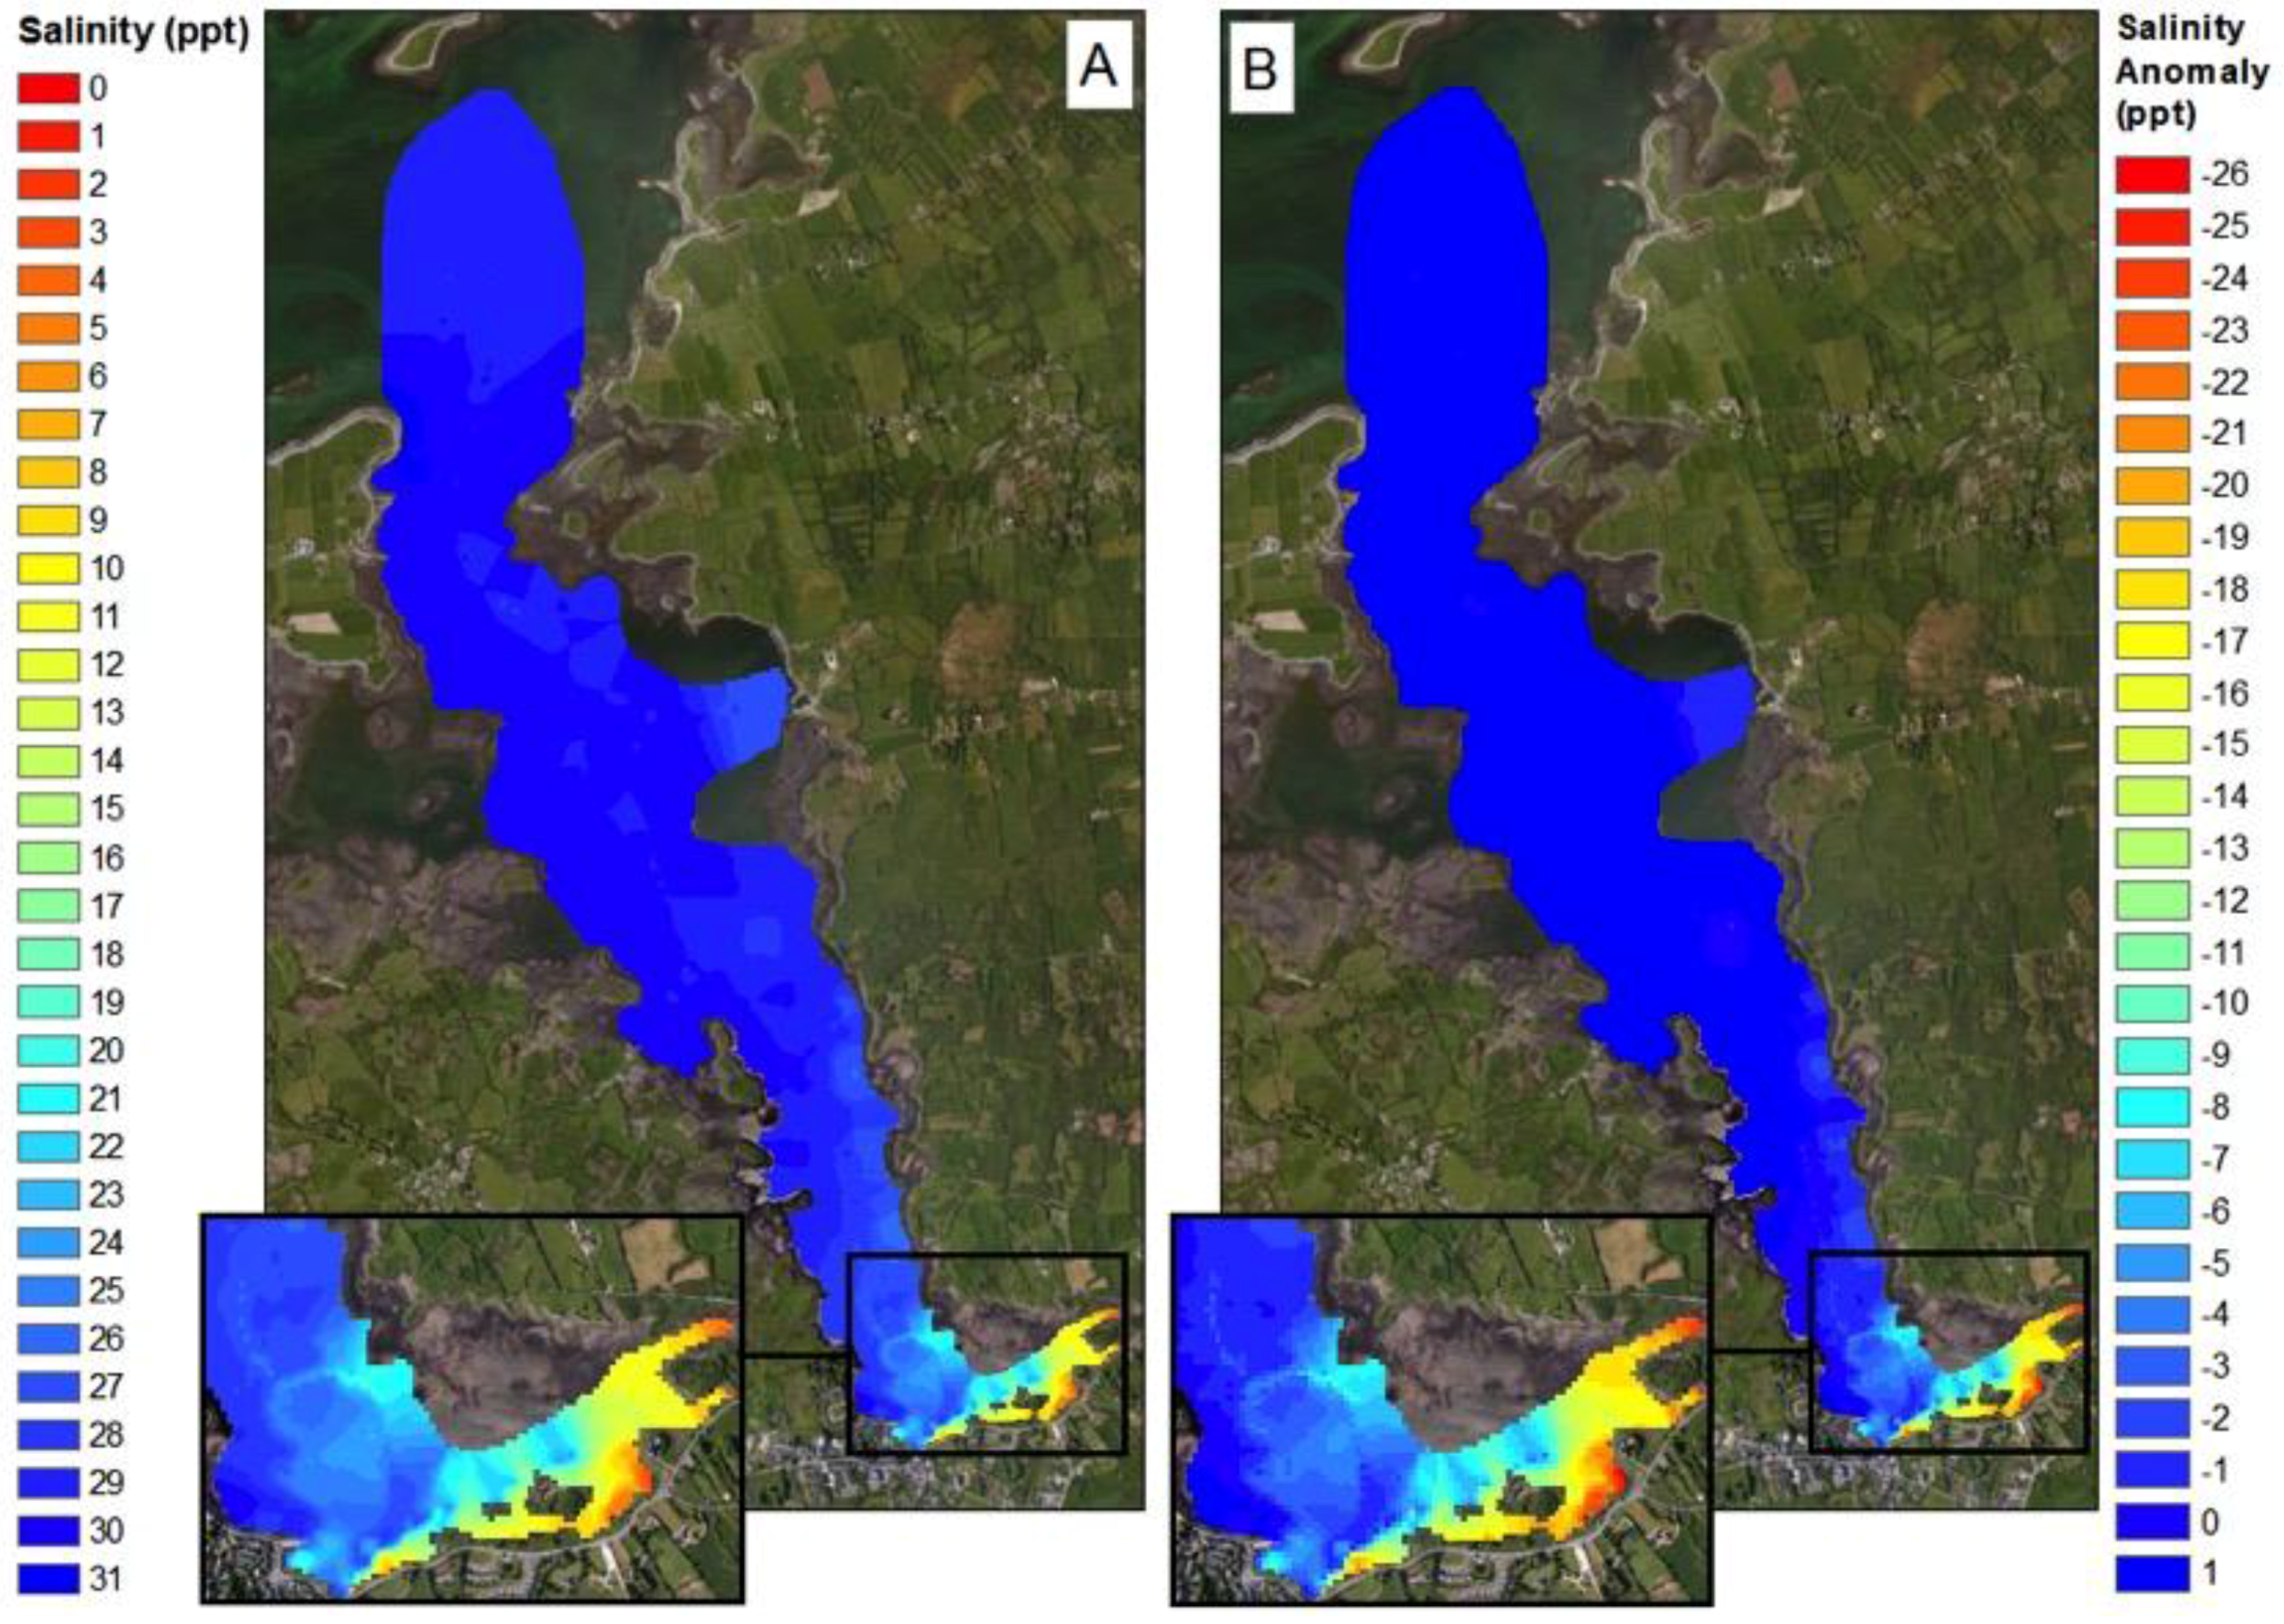
Figure 8.
Sea surface salinity map of Kinvara Bay interpolated from in-situ data measurements (A); Salinity anomaly map showing surface salinity divergence from the mean (B).
Figure 8.
Sea surface salinity map of Kinvara Bay interpolated from in-situ data measurements (A); Salinity anomaly map showing surface salinity divergence from the mean (B).
Figure 9.
Temperature and salinity transect, stretching left to right from Kinvara pier (west) to Dunguaire Castle (east). The effect of individual cold-water plumes is clearly evident in the highly correlated features present in the salinity and temperature data.
Figure 9.
Temperature and salinity transect, stretching left to right from Kinvara pier (west) to Dunguaire Castle (east). The effect of individual cold-water plumes is clearly evident in the highly correlated features present in the salinity and temperature data.
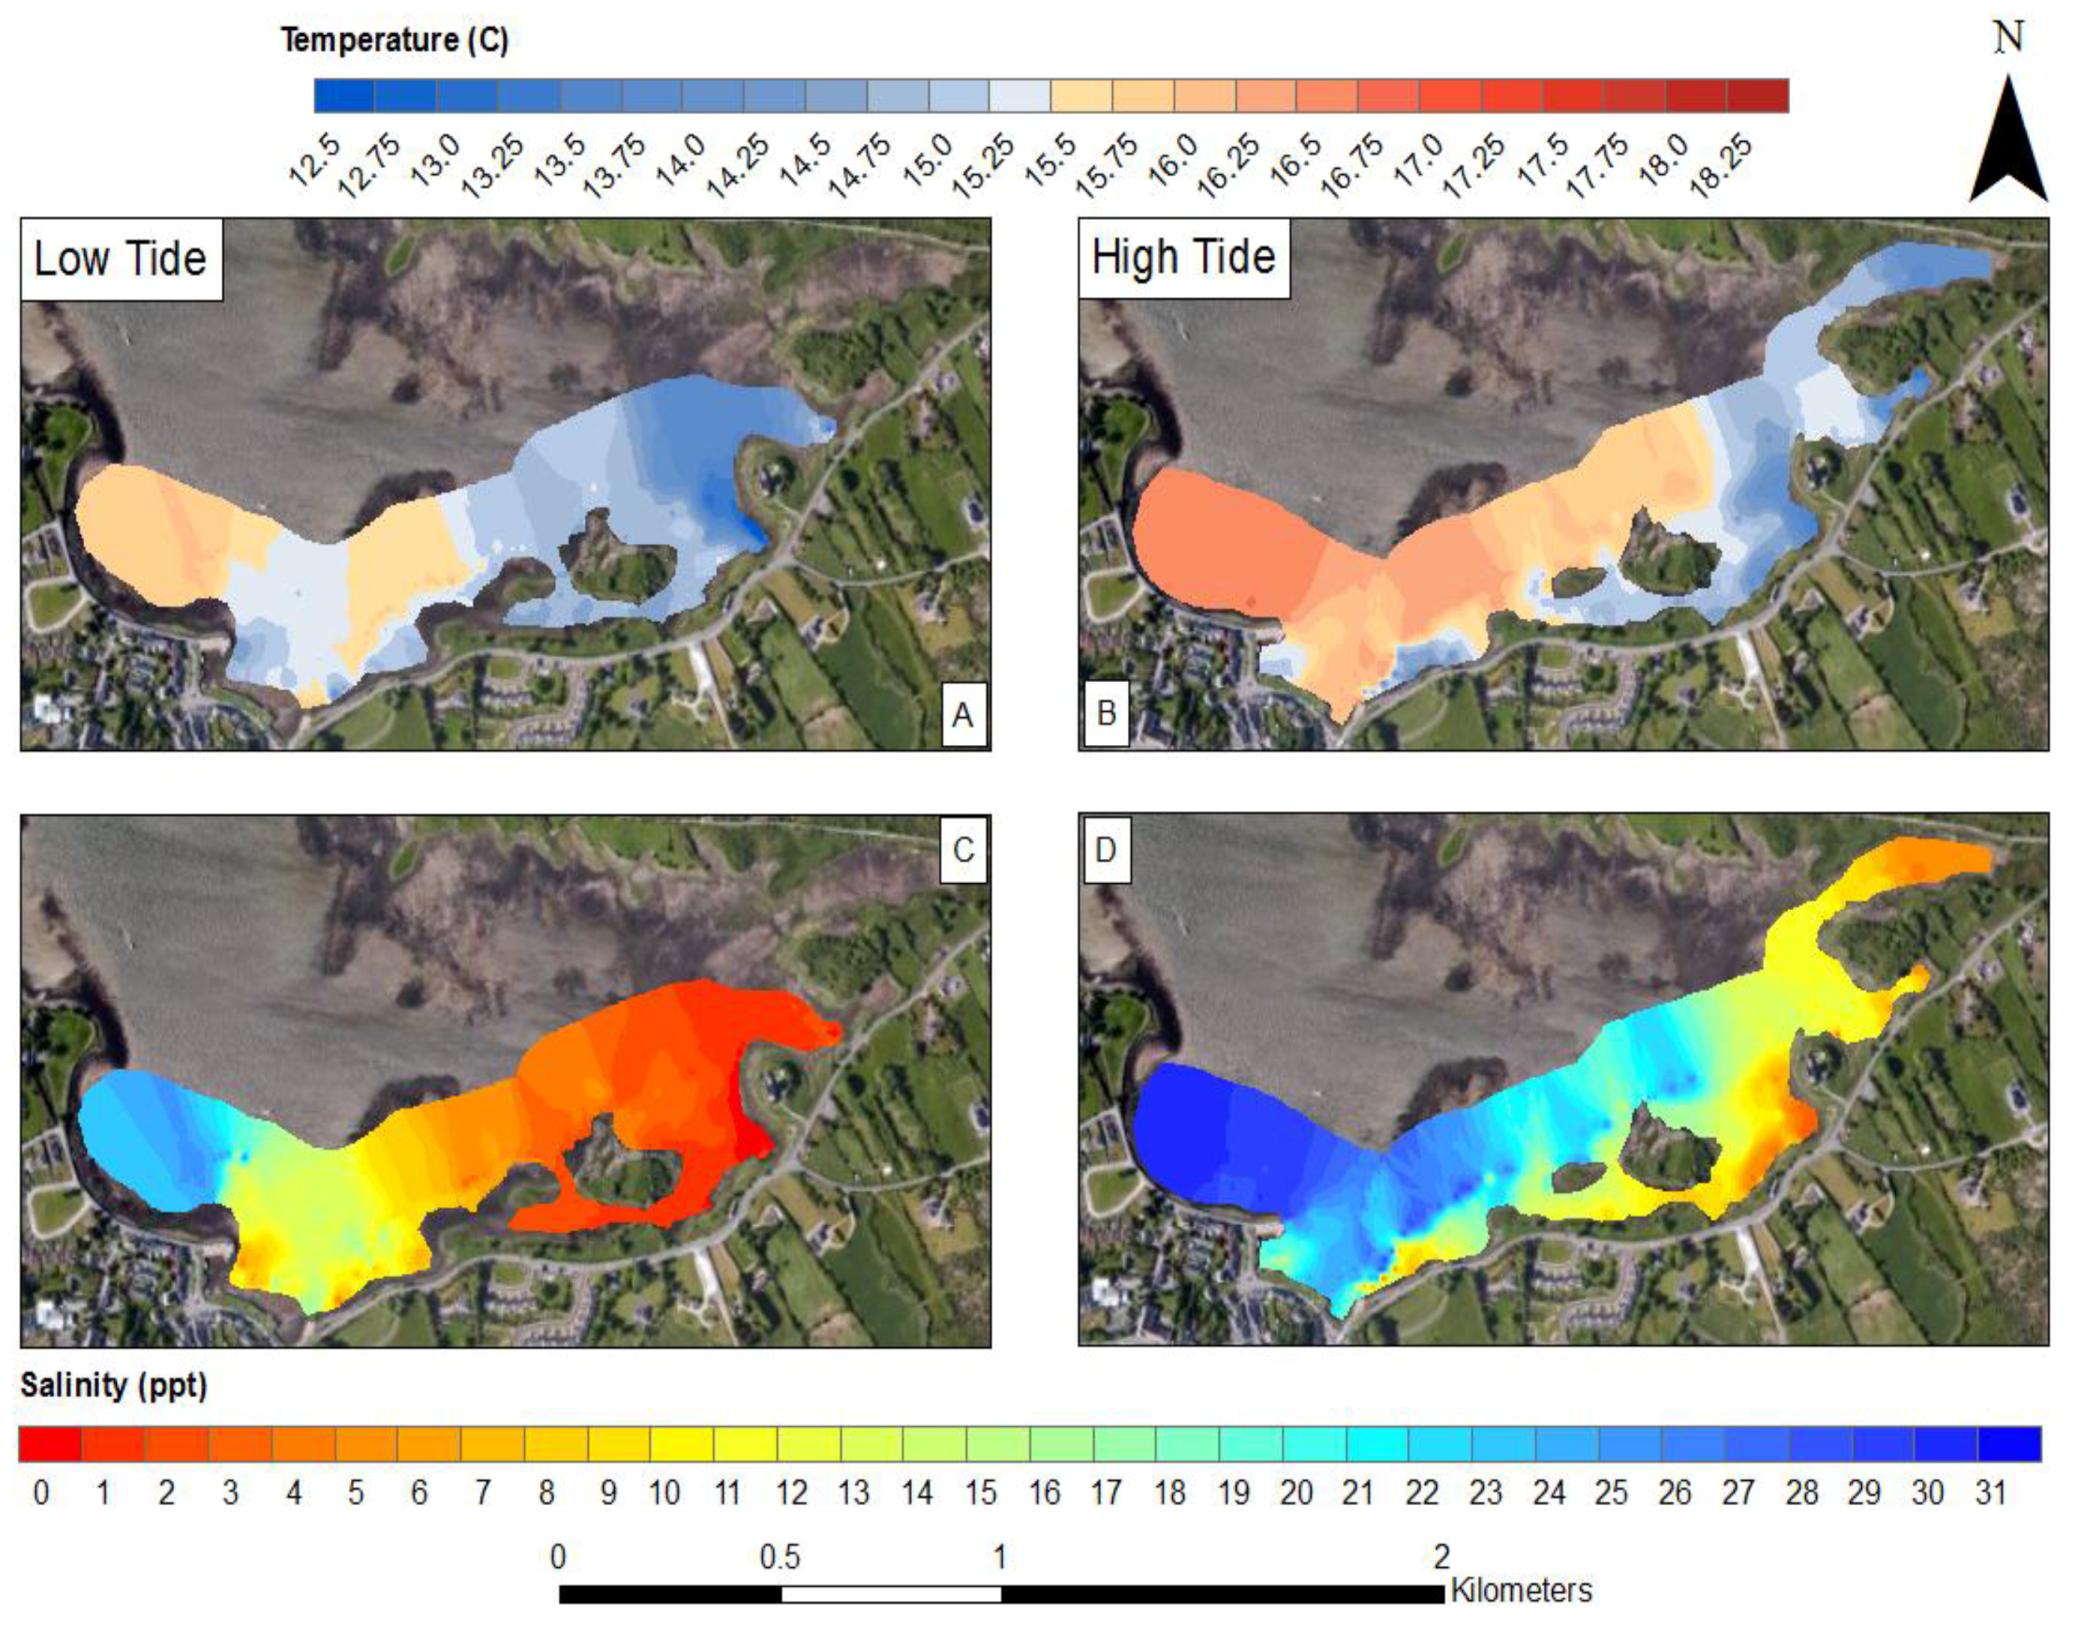
Figure 10.
Sea surface temperature maps of southern Kinvara Bay interpolated from in-situ data measurements at low tide (A) and high tide (B); Sea surface salinity maps at low tide (C) and high tide (D).
Figure 10.
Sea surface temperature maps of southern Kinvara Bay interpolated from in-situ data measurements at low tide (A) and high tide (B); Sea surface salinity maps at low tide (C) and high tide (D).
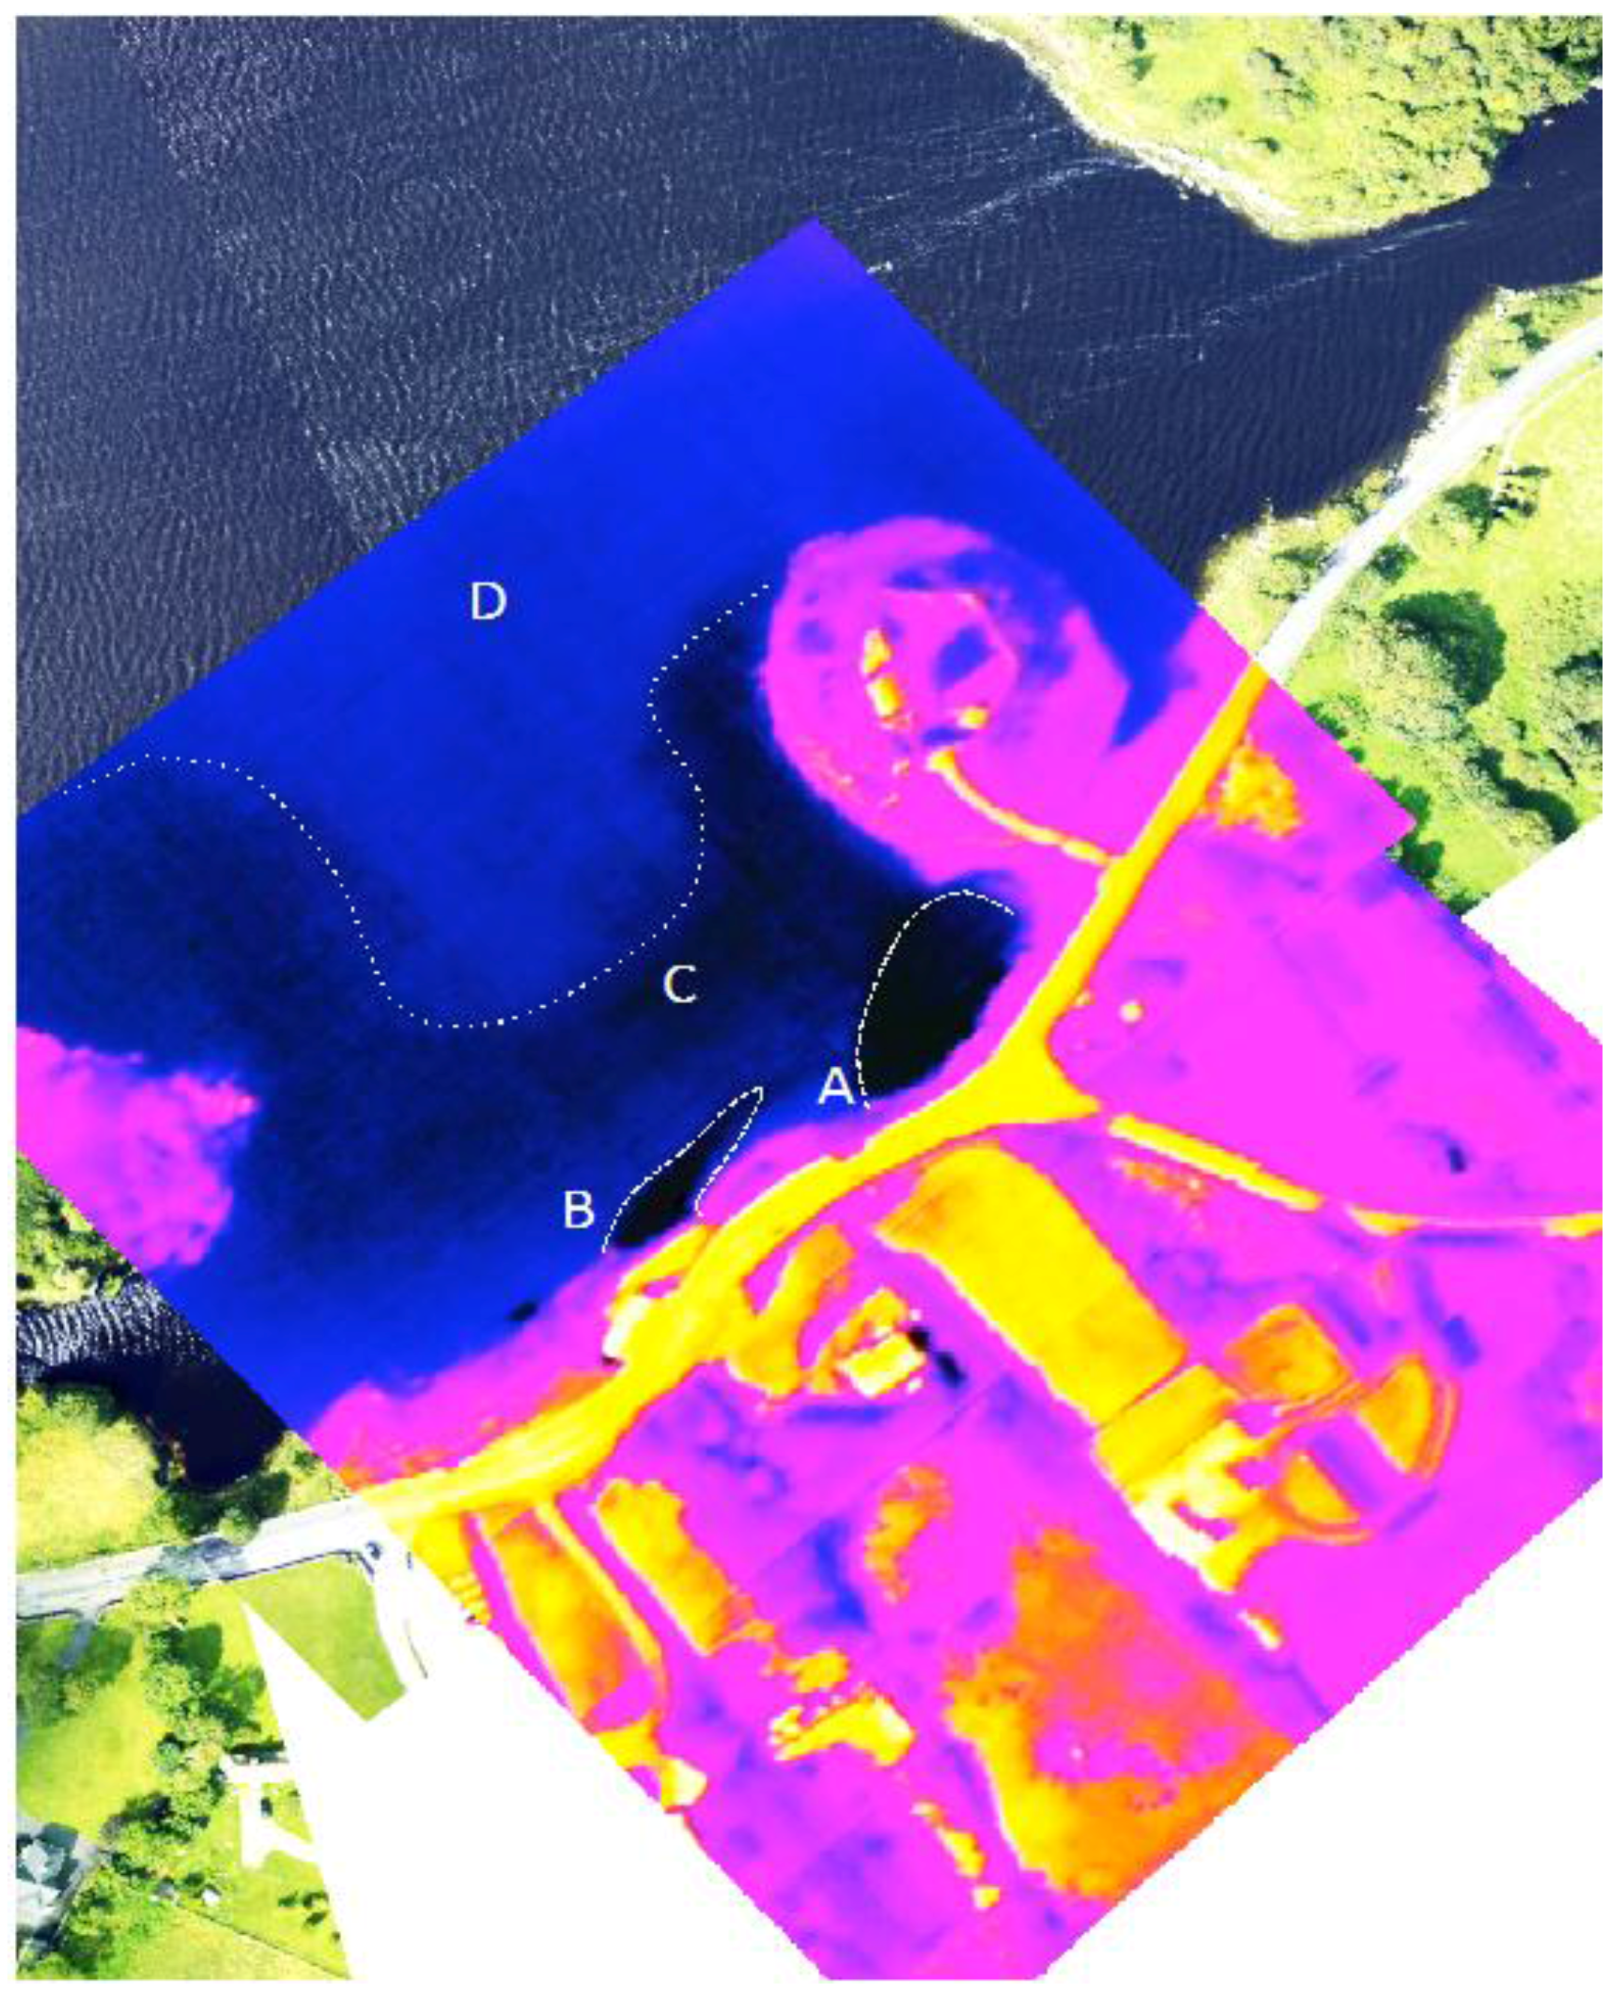
Figure 11.
Thermal Imagery of Kinvara Bay collected using LWIR Thermal Imager interpolated with high-resolution imagery collected using a Nikon D800E SLR camera. Colder freshwater sources are clearly visible near the shore (A,B) as is a more extensive area of cooler water (C) which gradually merges with warmer water (D).
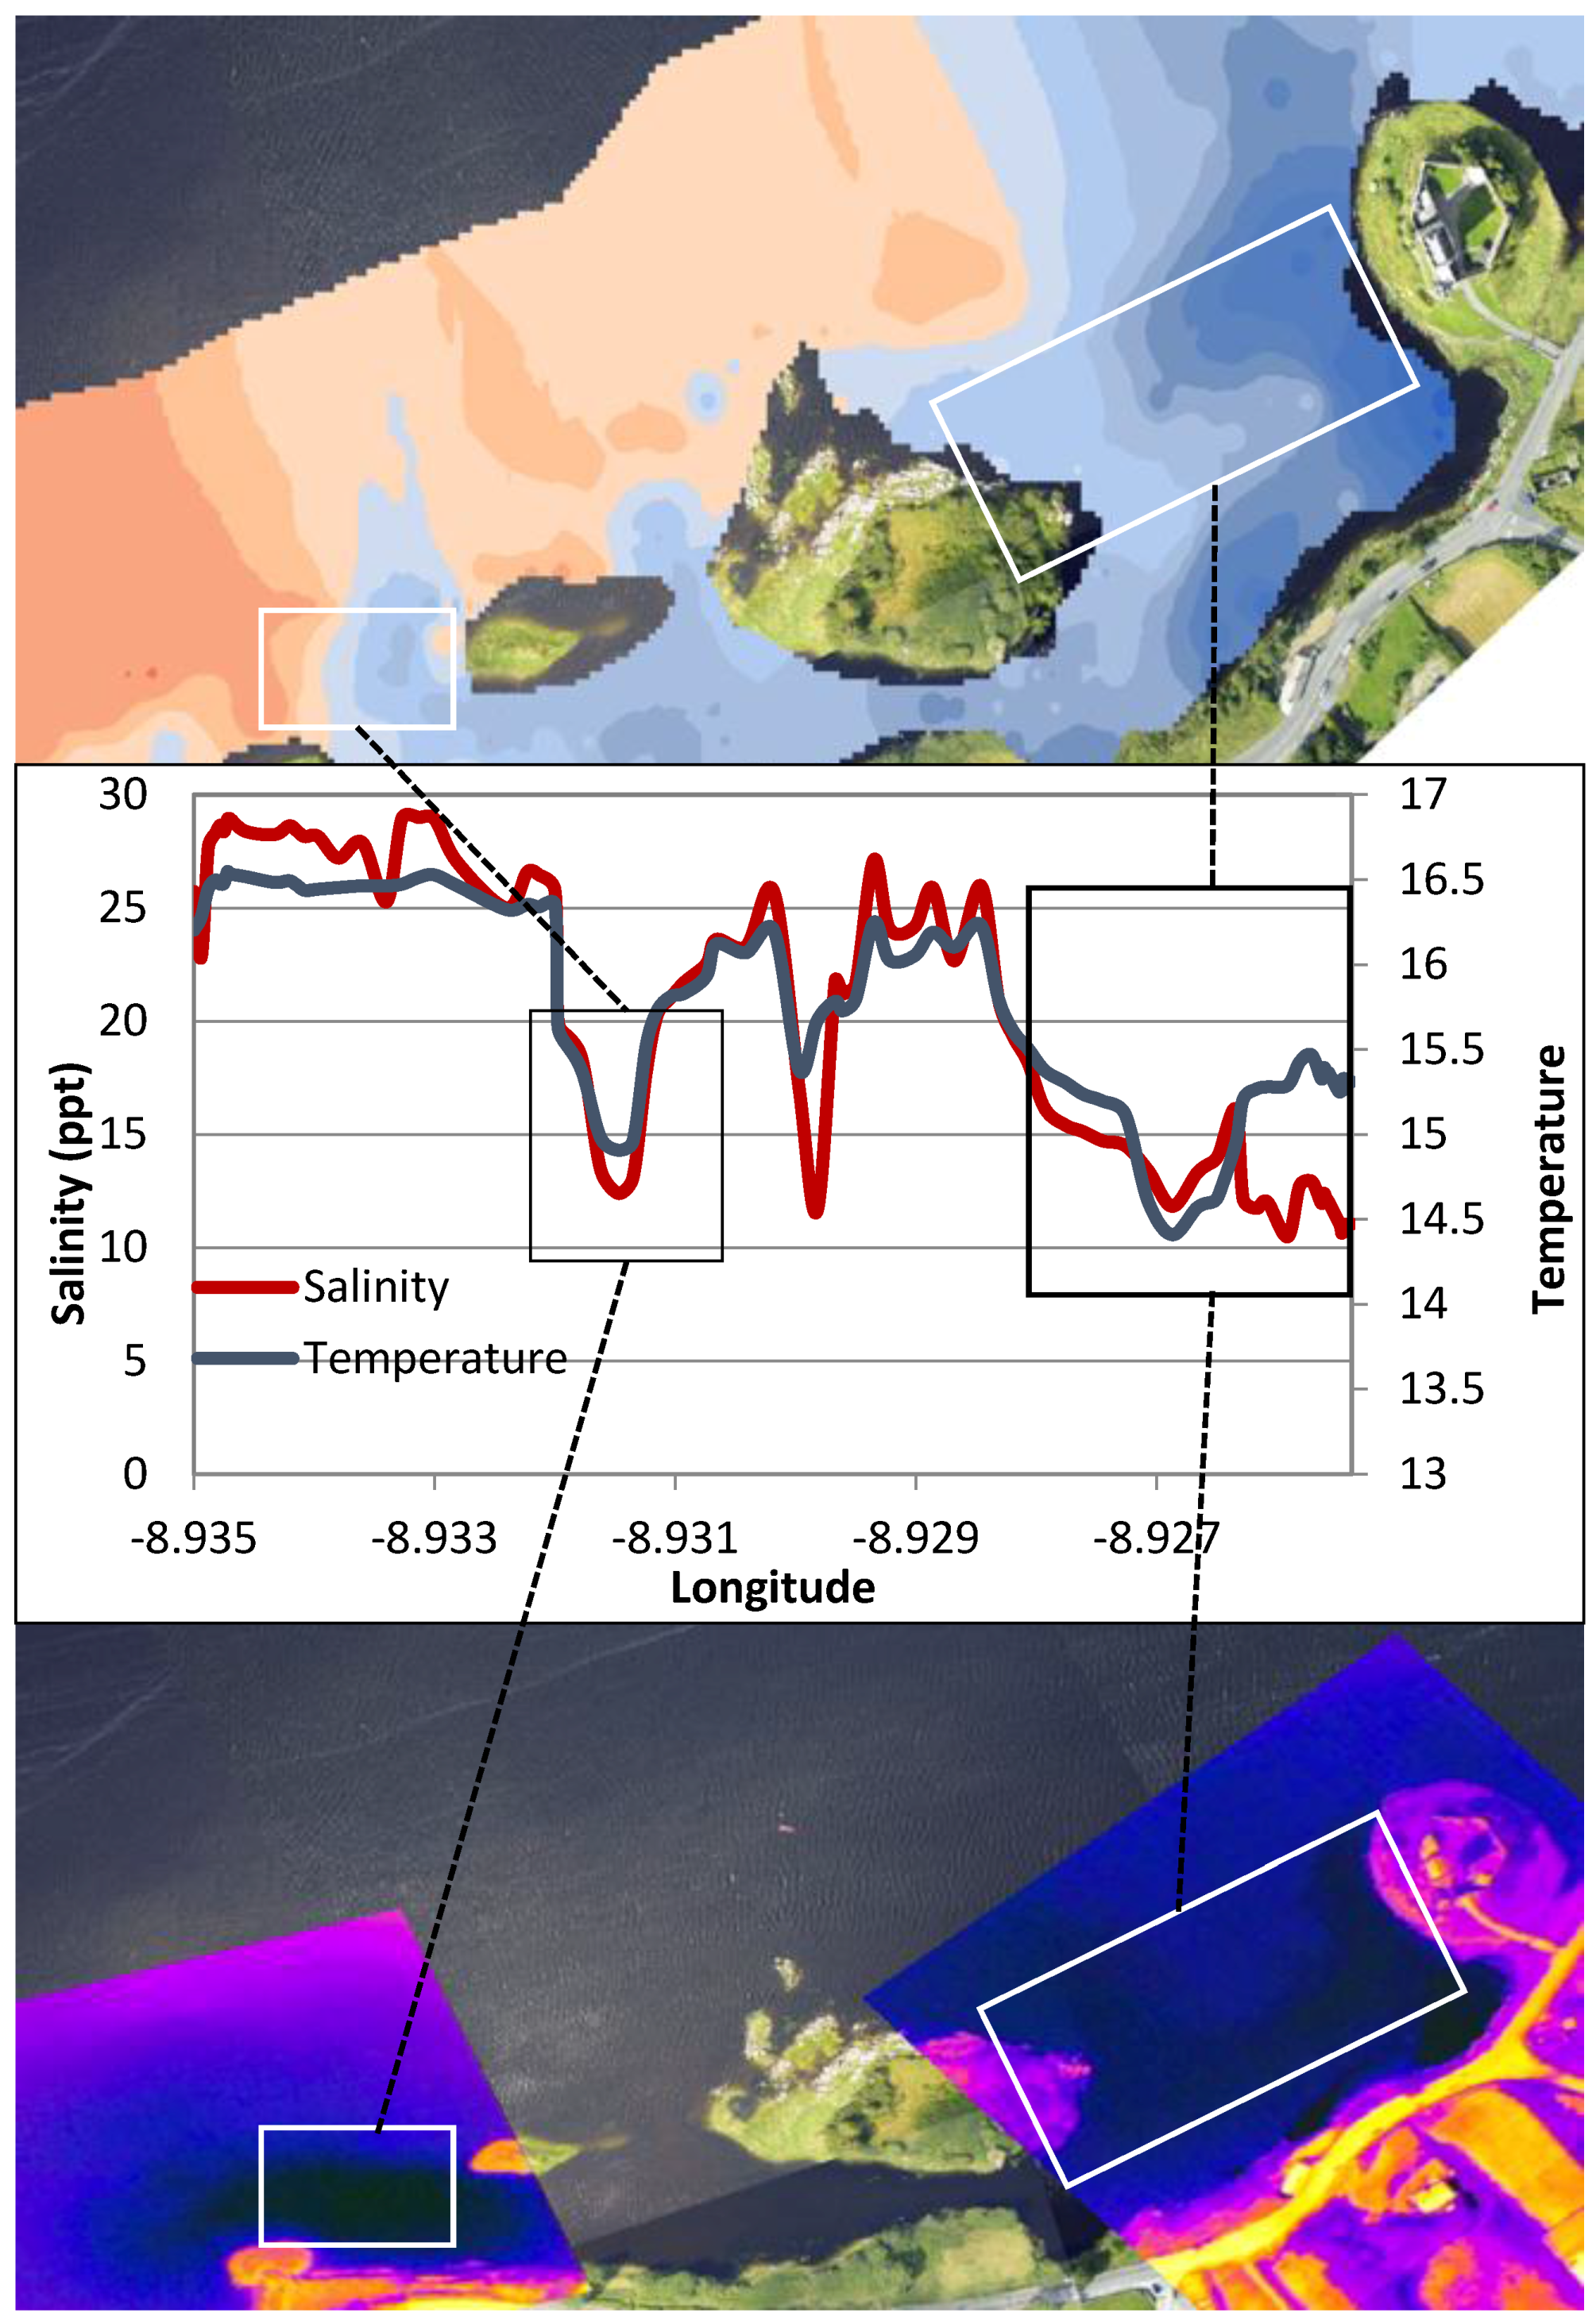
Figure 12.
Sea surface temperature map from in-situ measurements (top) showing regions of cooler water (dark blue) in the inner bay. Temperature and salinity profiles (middle) plotted along a transect that extends from the town of Kinvara (left) to Dunguaire Castle (right). Temperature and salinity profiles are highly correlated and clearly identify lower temperature features consistent with the location of known fresh water sources. These features are also clearly visible in the thermal IR images obtained from the flyover (bottom).
Figure 13.
Surface temperature map (A) and Salinity map (B) of Caherglassuan Turlough.
Figure 13.
Surface temperature map (A) and Salinity map (B) of Caherglassuan Turlough.
Figure 14.
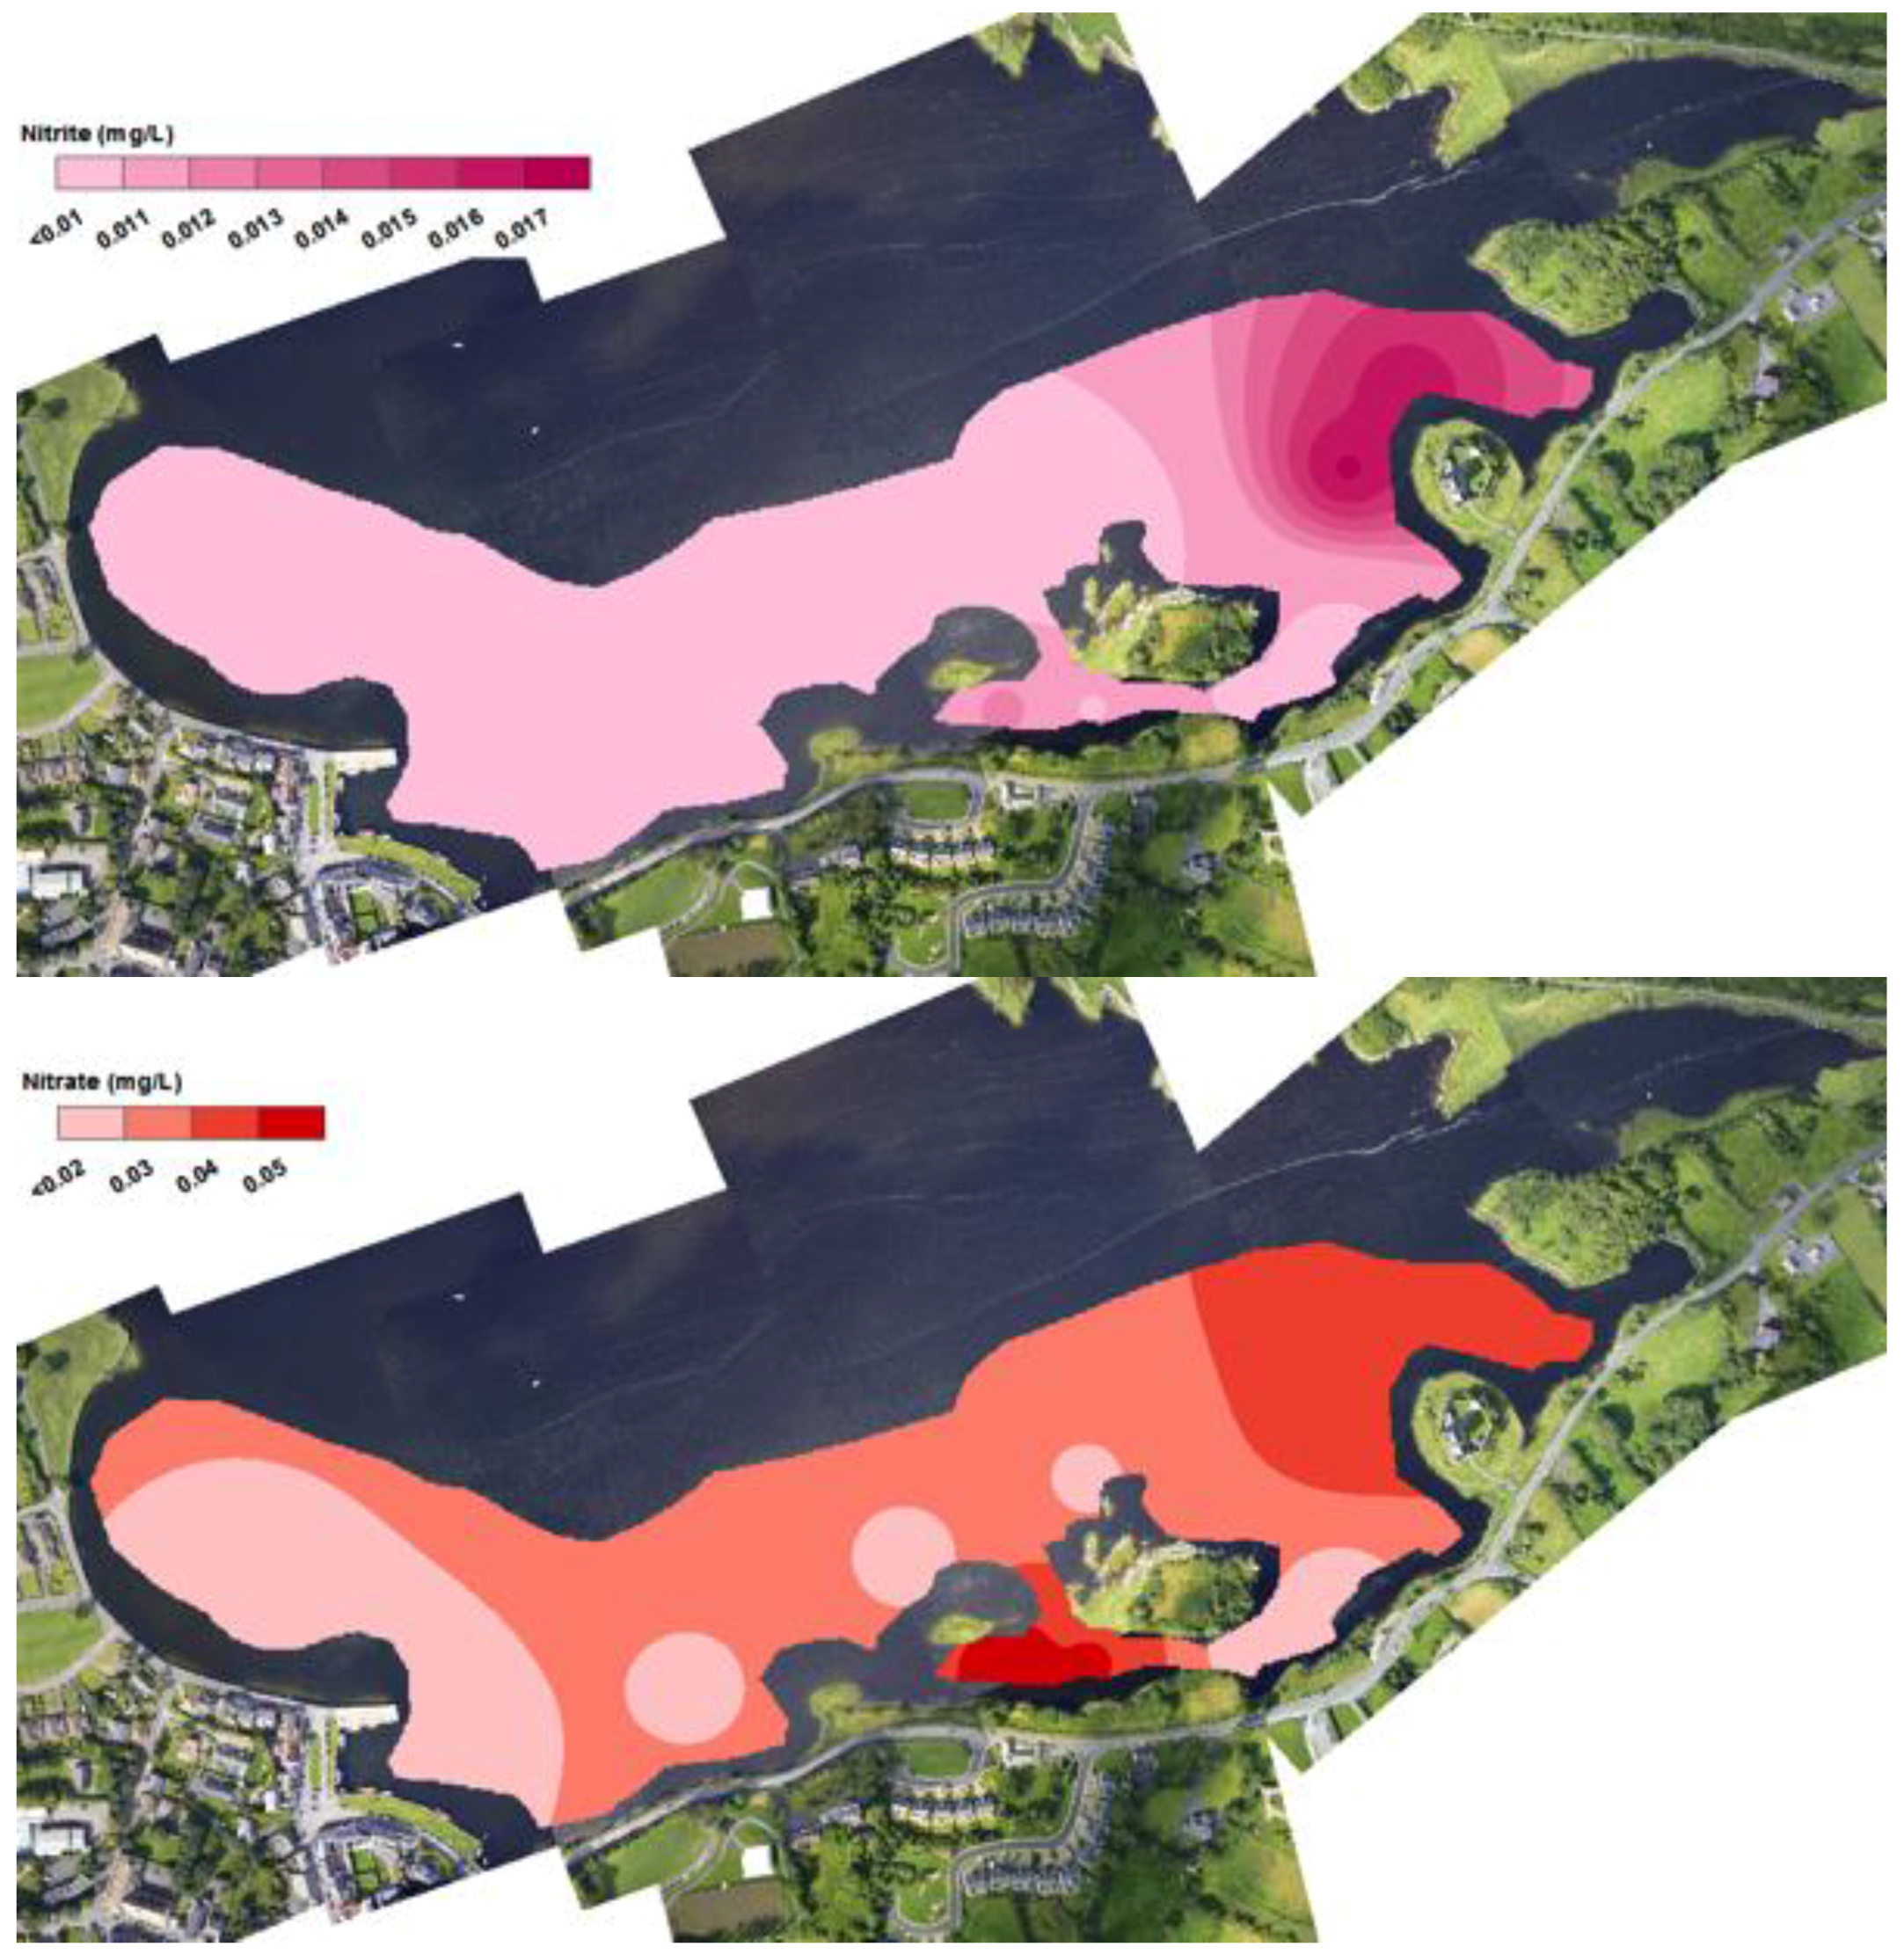
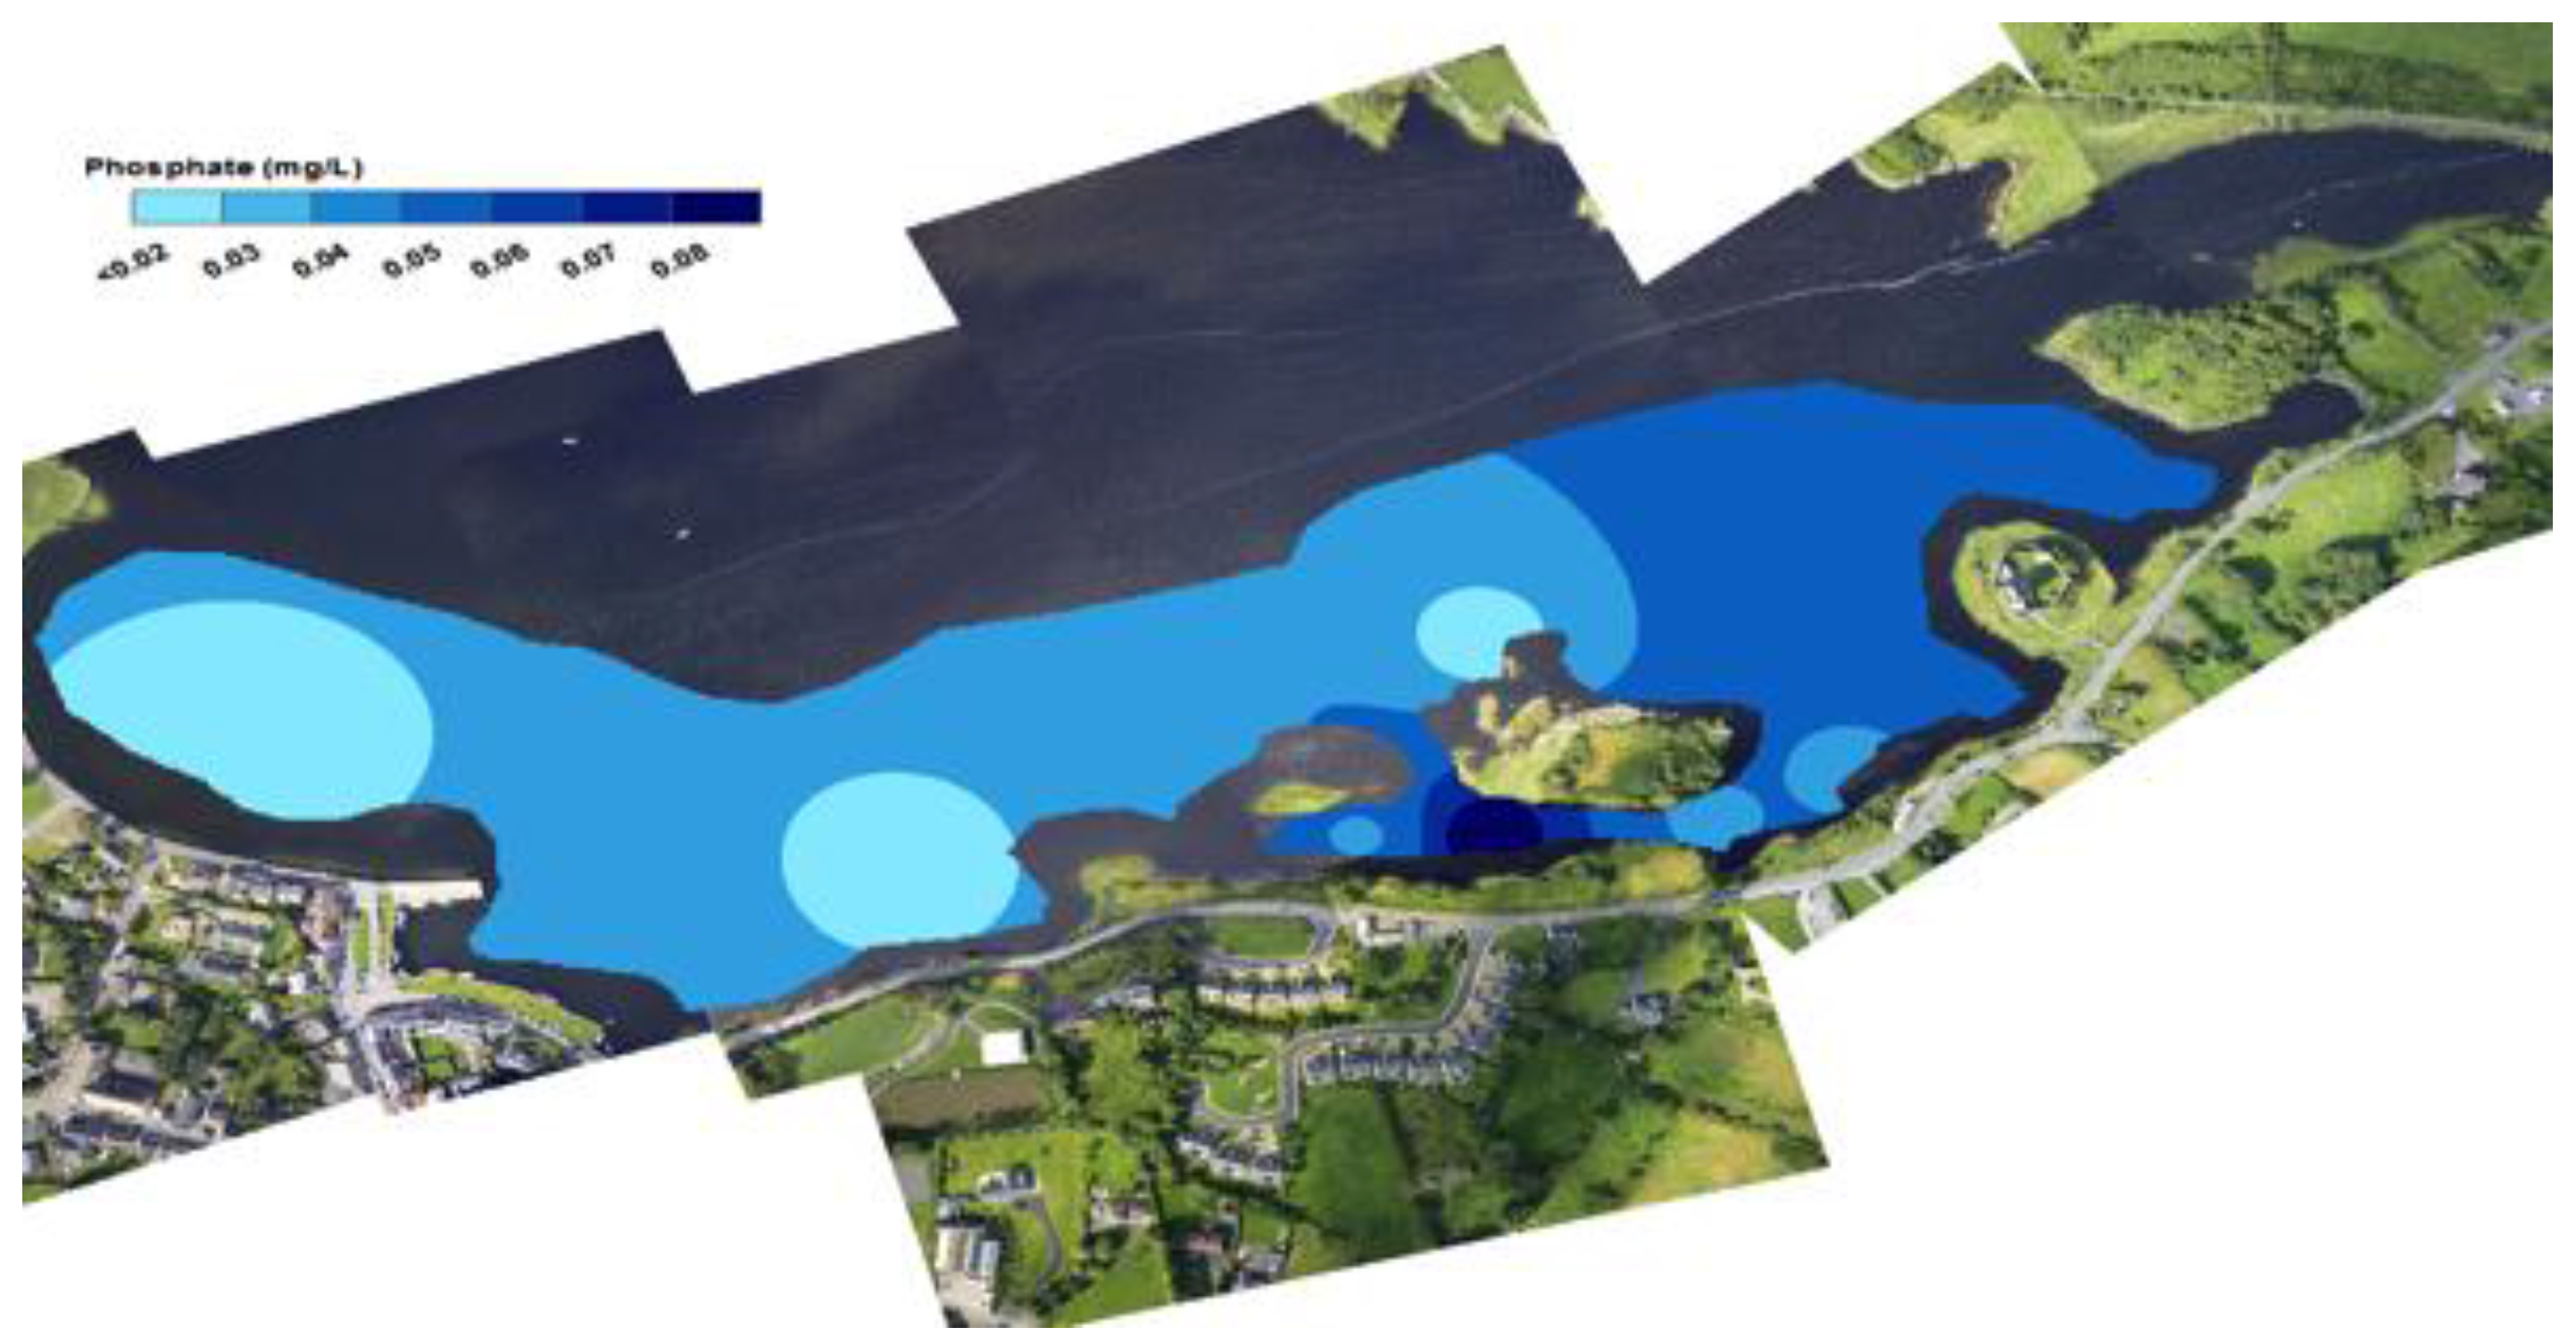
Interpolations of Nitrite (top), Nitrate (middle) and Phosphate (bottom) within Kinvara Bay at low tide during the sampling campaign (25–28 August 2015).
Figure 14.
Interpolations of Nitrite (top), Nitrate (middle) and Phosphate (bottom) within Kinvara Bay at low tide during the sampling campaign (25–28 August 2015).
Figure 15.
Nitrite (top), Nitrate (middle) and Phosphate (bottom) distribution maps generated from levels found in samples taken at each sampling point within Kinvara Bay and Caherglassuan Turlough at high tide during the sampling campaign (25–28 August 2015).
Figure 15.
Nitrite (top), Nitrate (middle) and Phosphate (bottom) distribution maps generated from levels found in samples taken at each sampling point within Kinvara Bay and Caherglassuan Turlough at high tide during the sampling campaign (25–28 August 2015).
© 2016 by the authors; licensee MDPI, Basel, Switzerland. This article is an open access article distributed under the terms and conditions of the Creative Commons Attribution (CC-BY) license (http://creativecommons.org/licenses/by/4.0/).


 ,
, 