
Design of Secure ECG-Based Biometric Authentication in Body Area Sensor Networks


Abstract
:
1. Introduction
- for fast and convenient setup of a BAN, for instance for fitness trackers, chest sensors, and smart wrist bands,
- for the setup of a trusted and secure body area environment with a shared key, and
- as a second authentication factor in BANs with critical implanted medical equipment, to prevent accidental or malicious erroneous access to the medical devices.
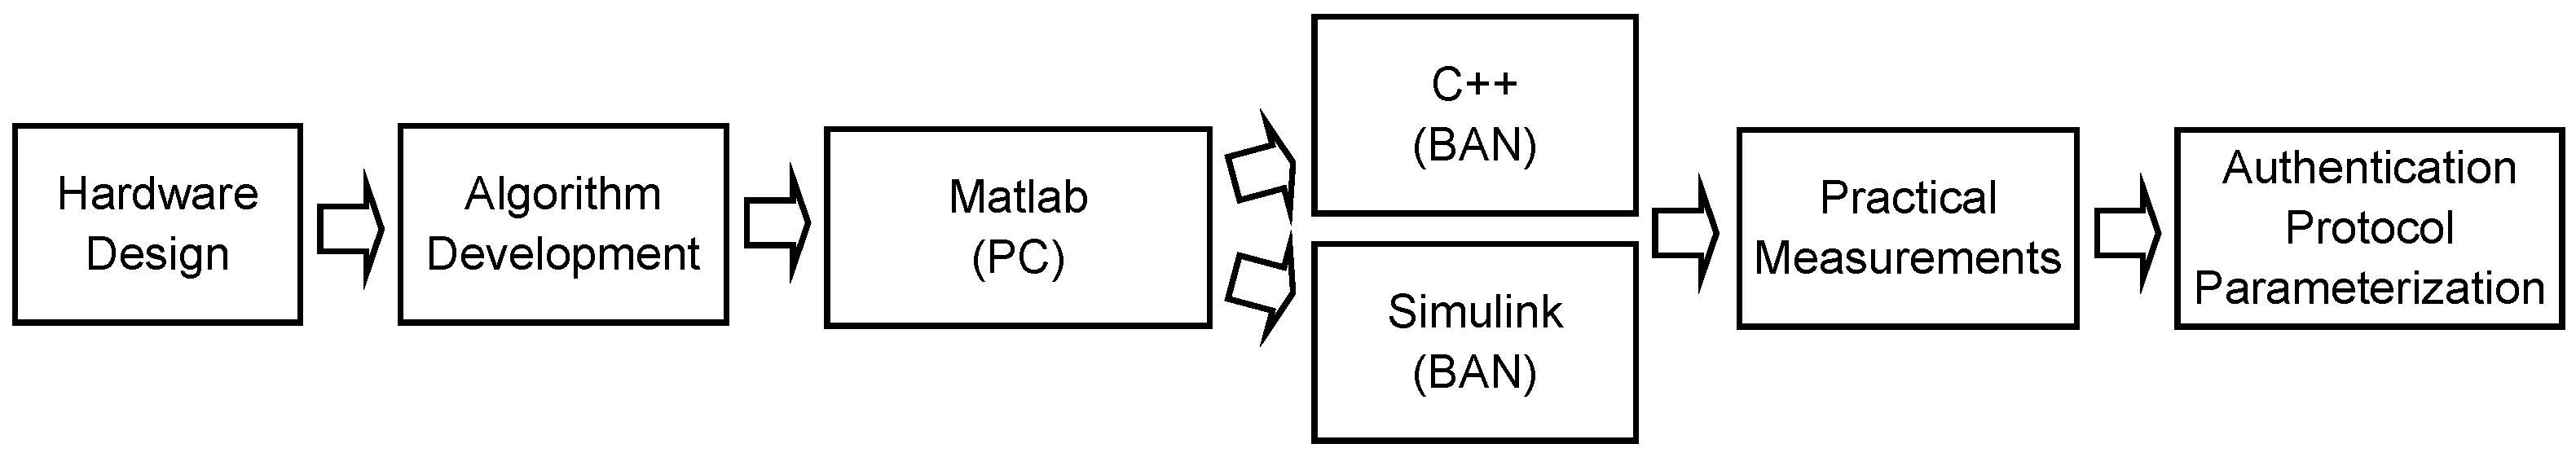
- Design and implementation of a sensor platform (Section 4) including suitable data processing and feature detection methods. We apply a model-based design flow [19], starting with an analytical model in Matlab, test it in real-time models on a PC (Section 5), and finally translate it to the embedded system platform, taking into account the limited resources of a BAN in Section 6.
- Based on empirical data gathered from the implemented sensor node, we design and parametrize a secure session establishment protocol in Section 7. We show that statistical properties of the uncertainties of the system can be harnessed to improve the confidence within the authentication process.
2. Preliminaries and Methodology
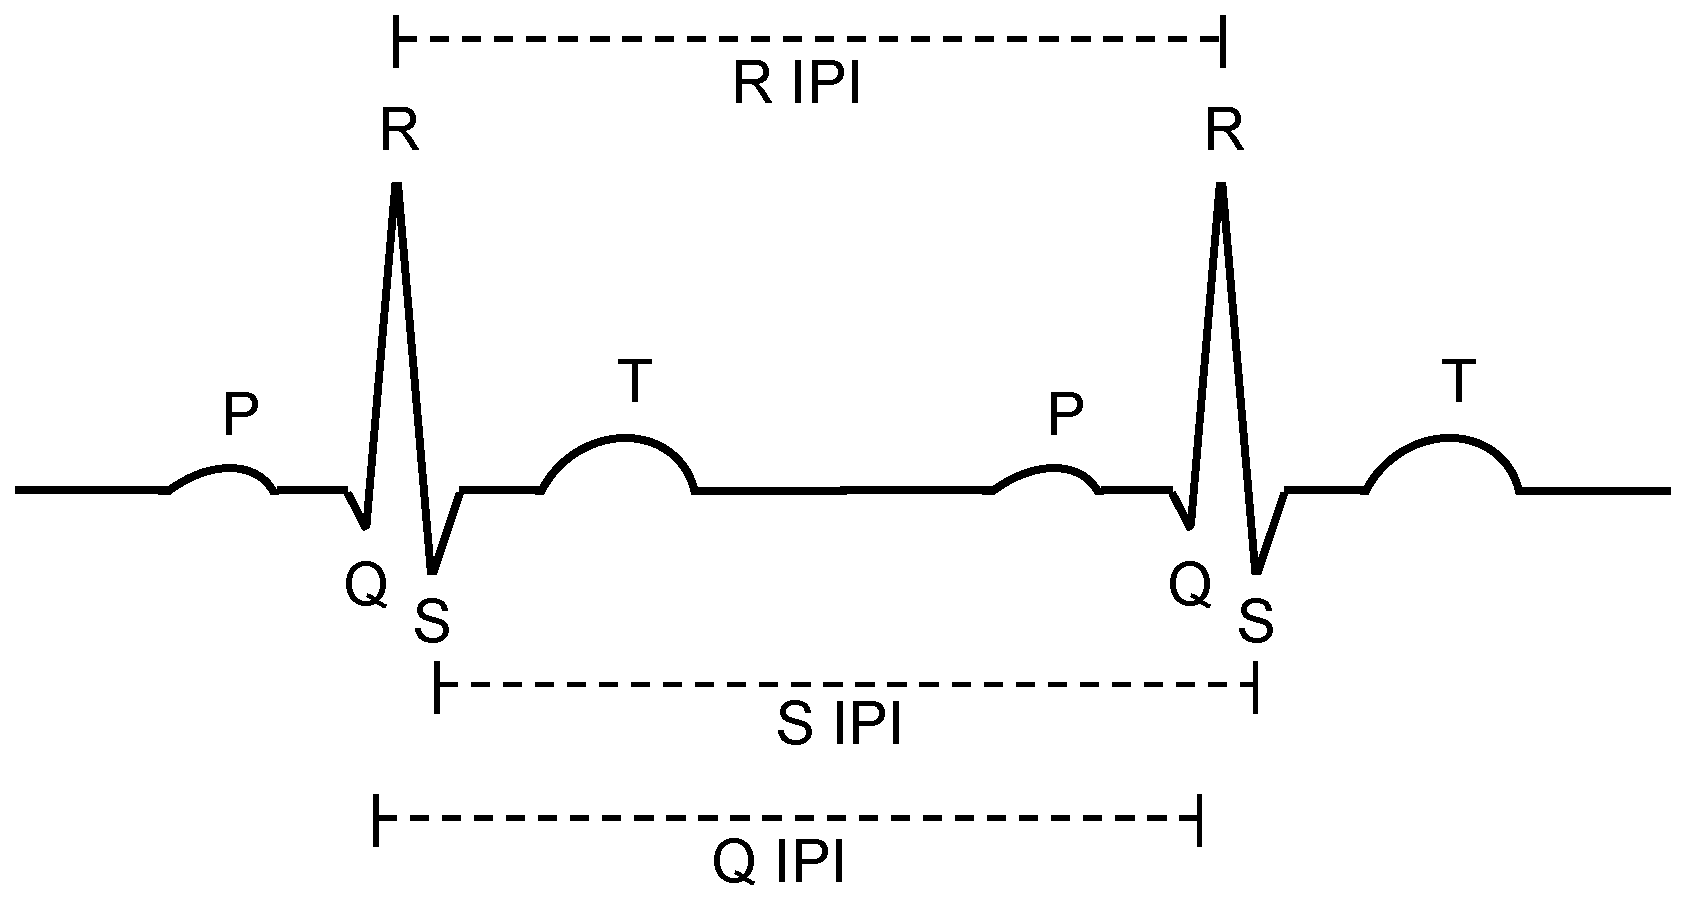
2.1. ECG Basics
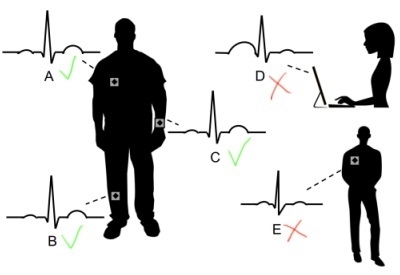
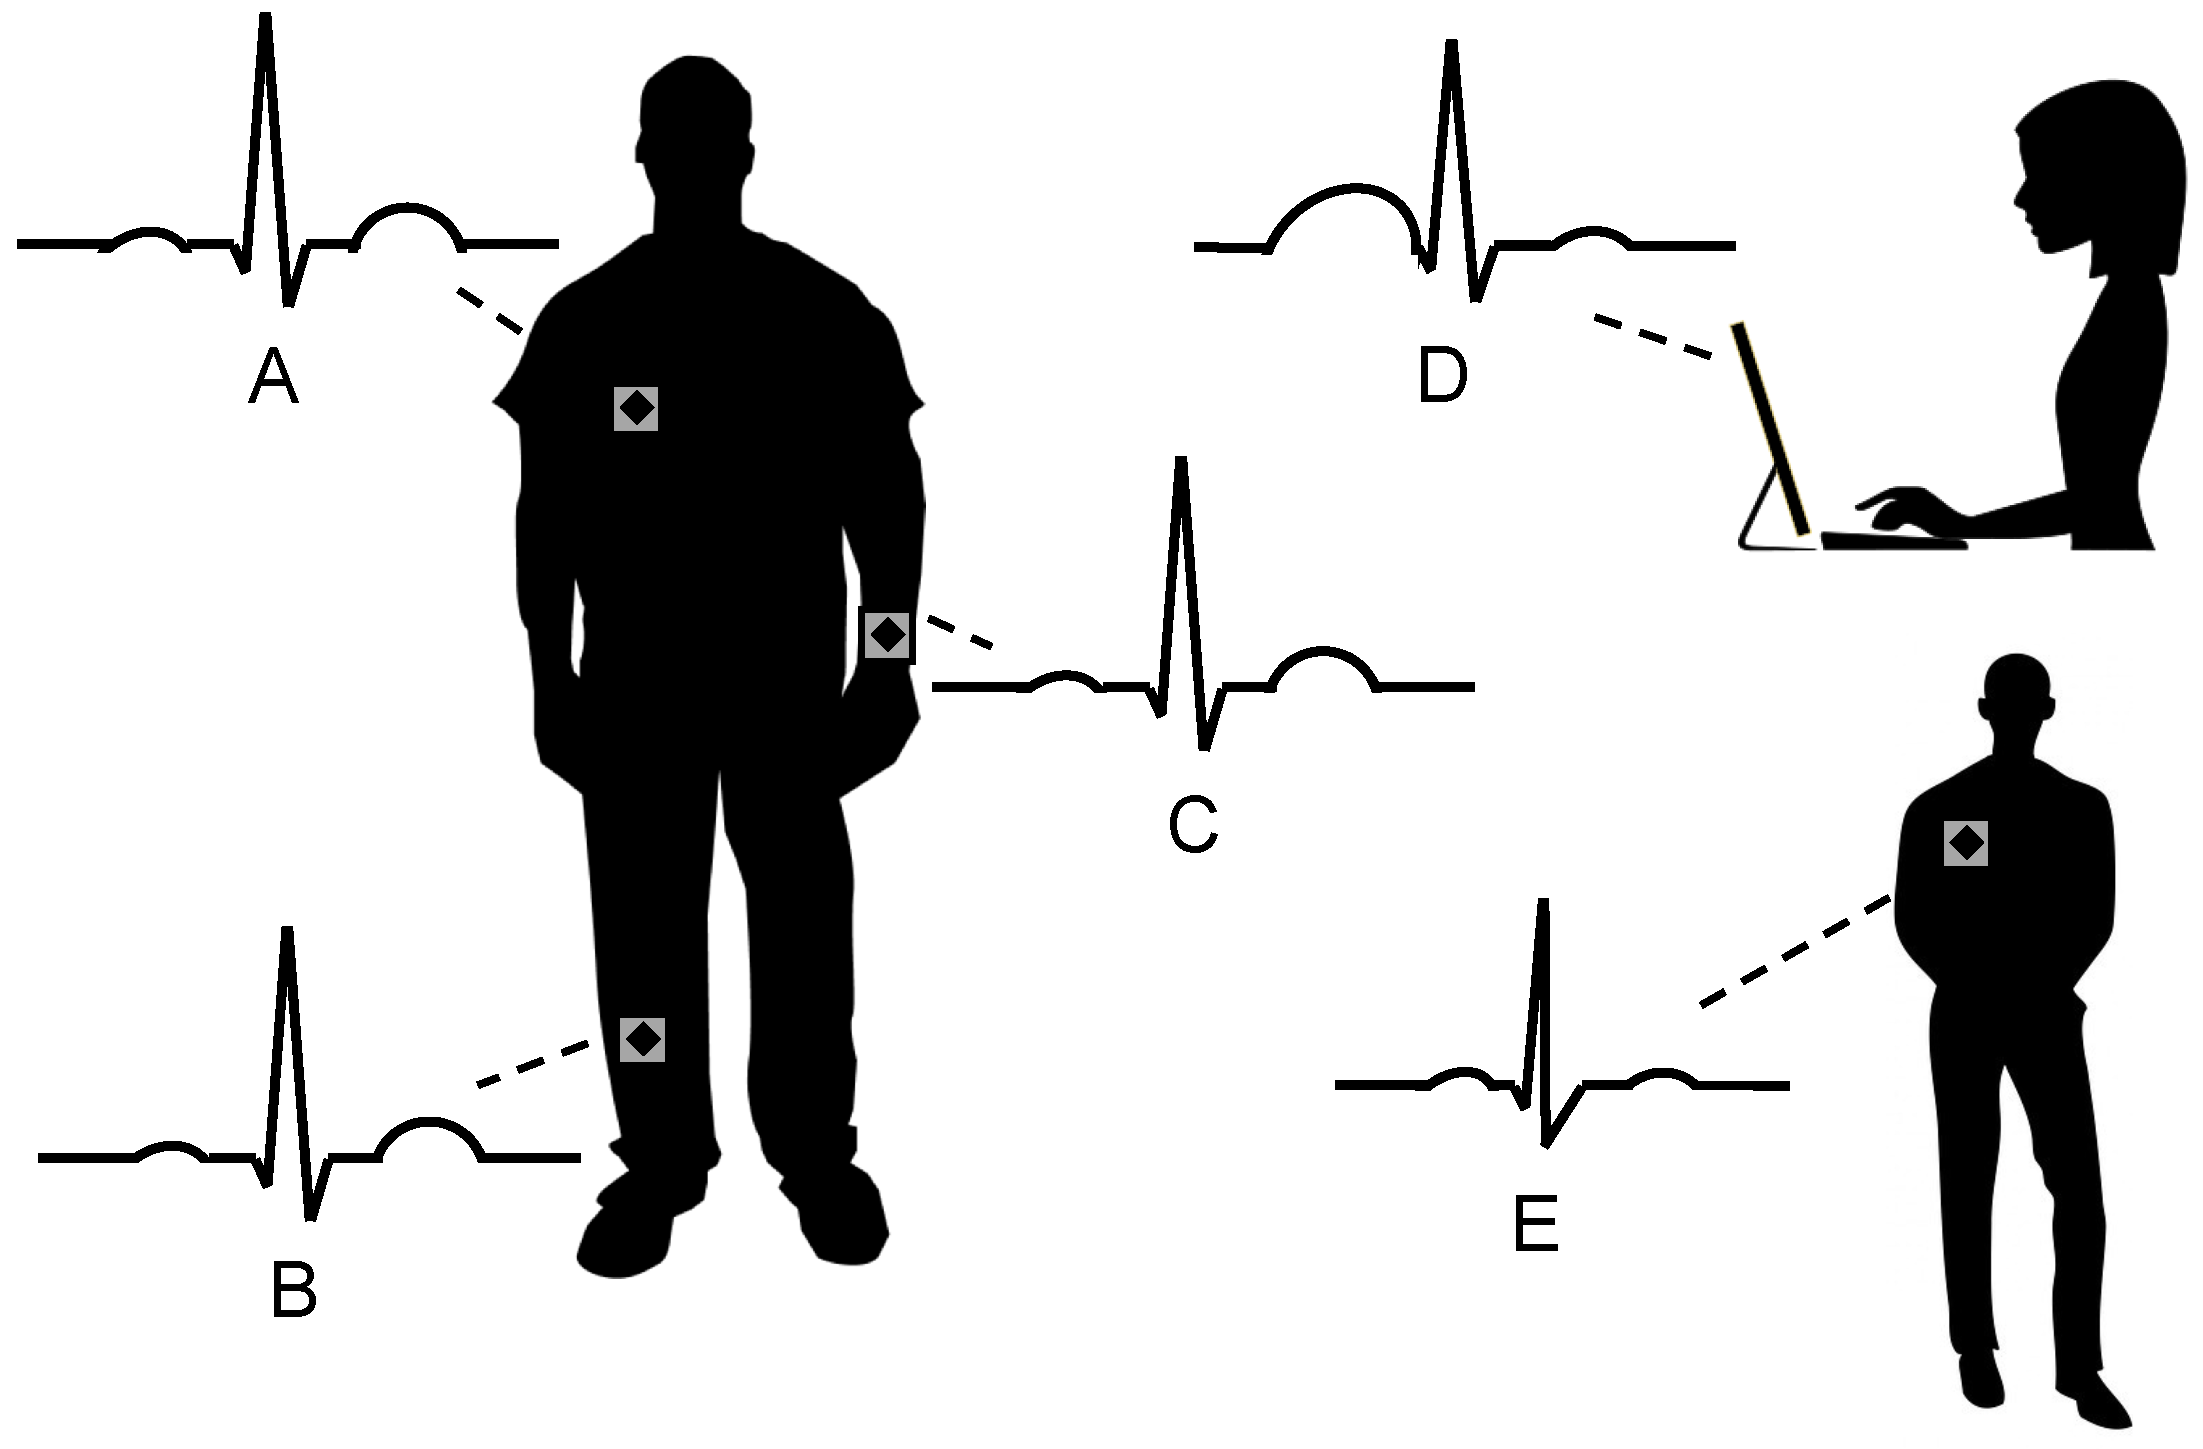
2.2. Problem Statement, Methodology and Outline
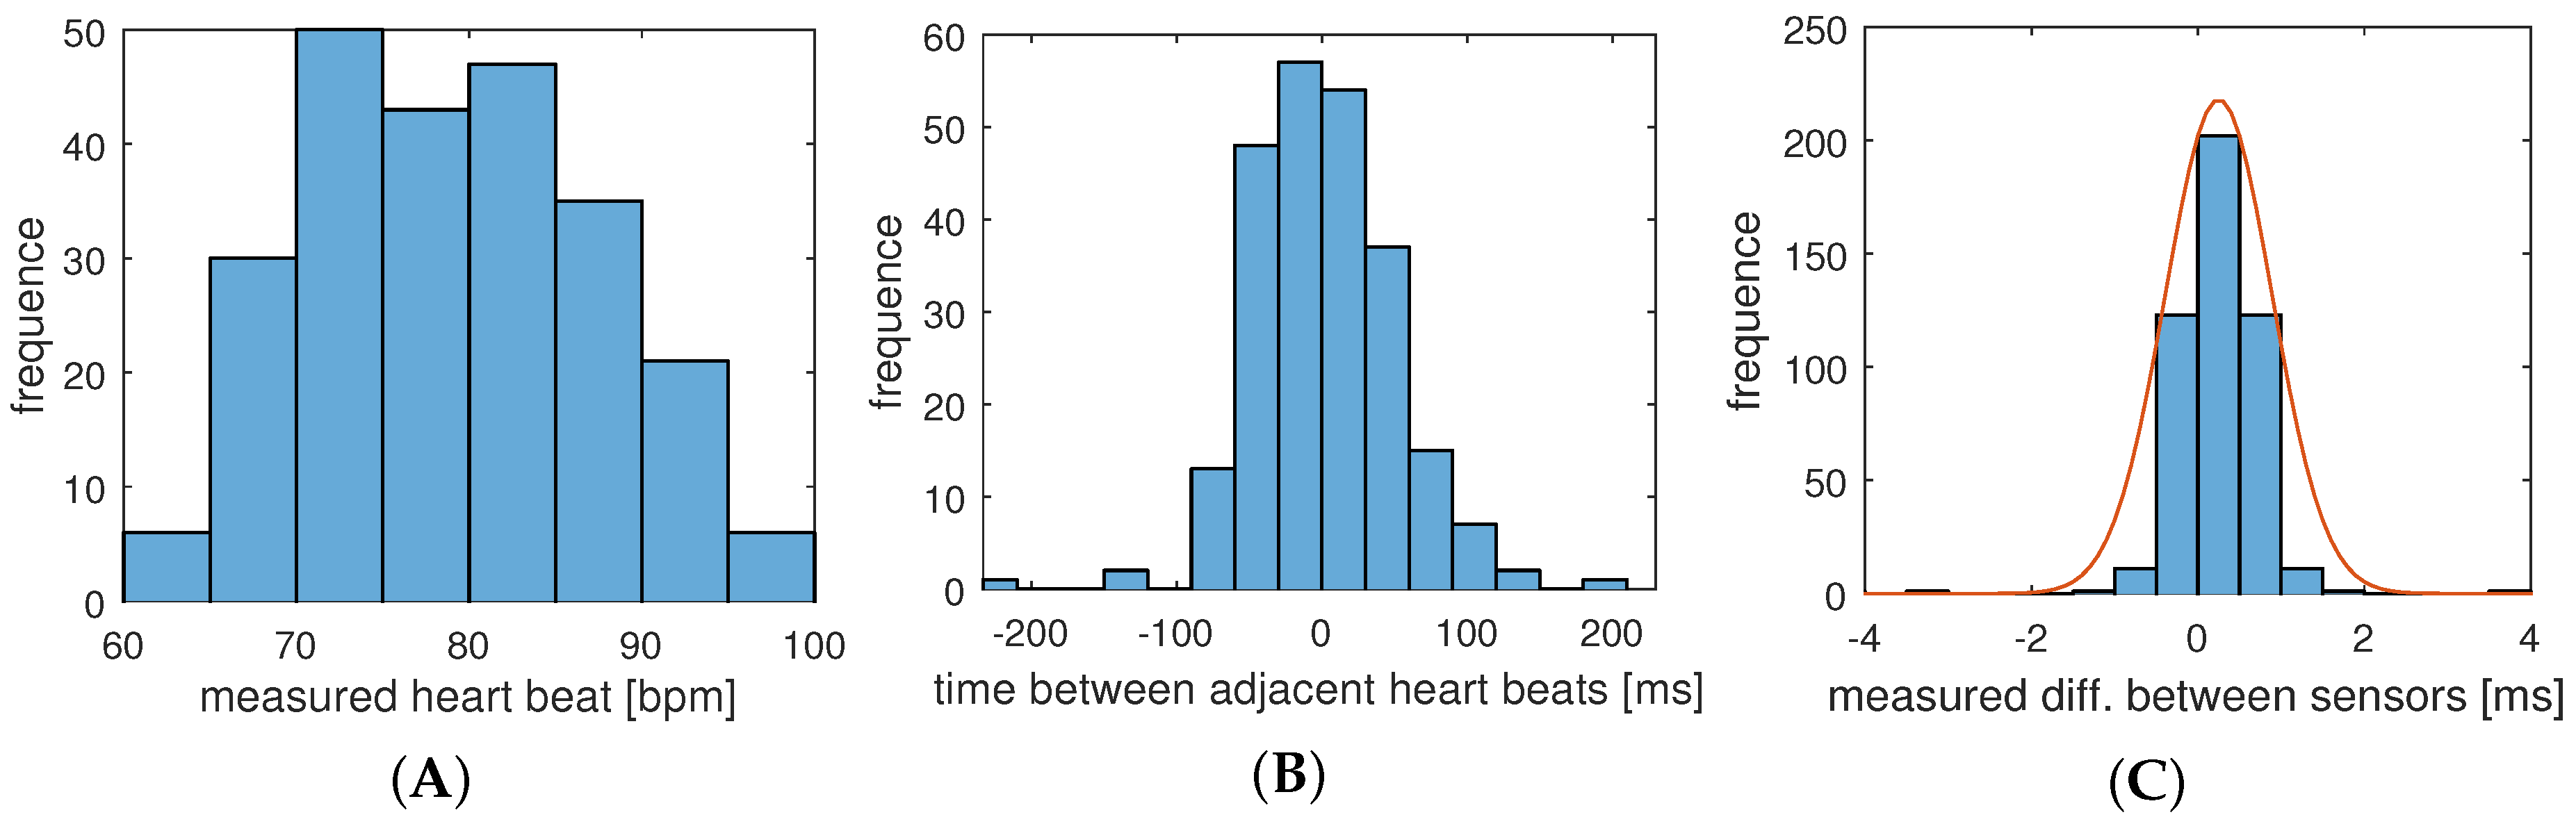
- uncertainty of the underlying physical (biological) phenomenon,
- timing uncertainty and jitter in the cyber-parts (sensors, interfaces, processing), and
- parametrization of the authentication protocol, to omit rejection of valid sensor pairings but reduce the probability of invalid pairing attempts to succeed due to a high tolerance of deviation.
3. Related Work
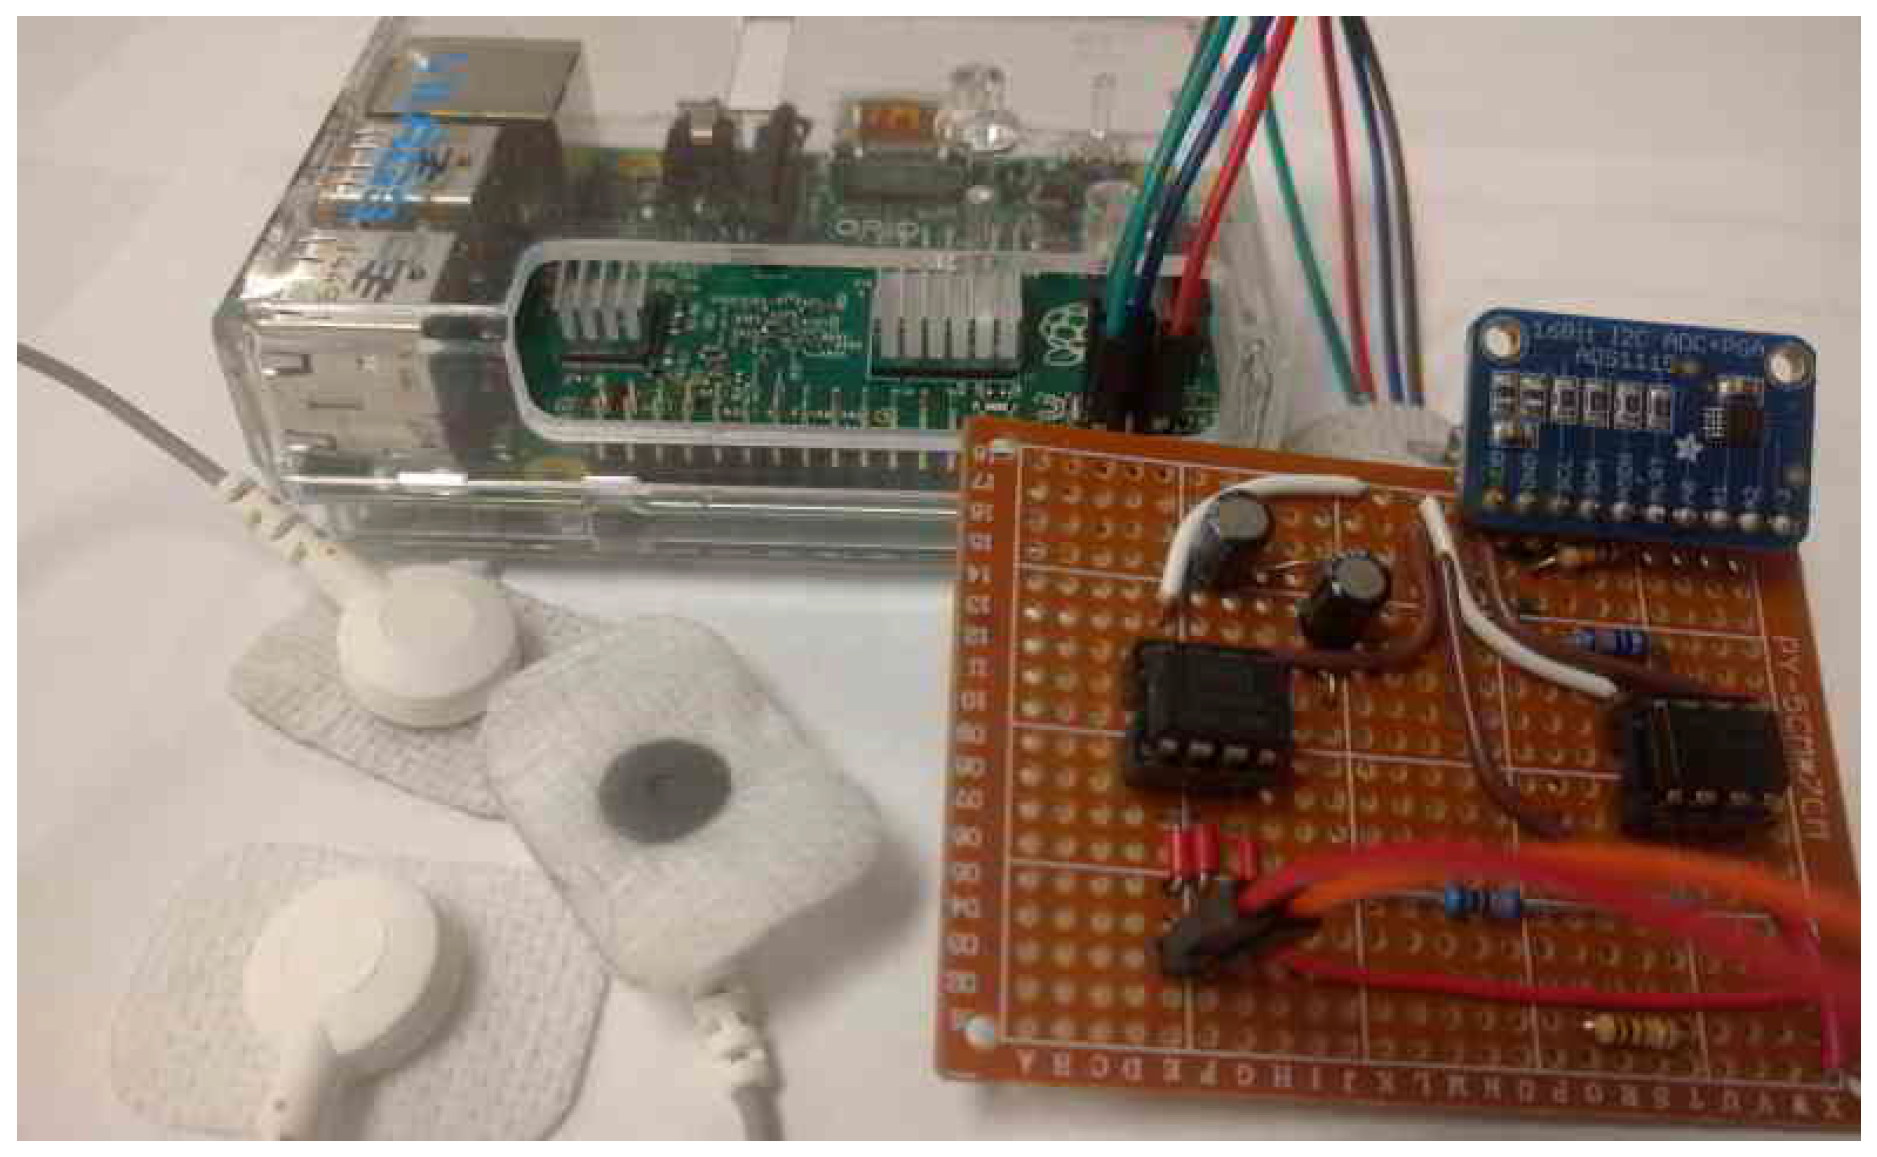
4. Sensor Hardware Interface
4.1. Sensors
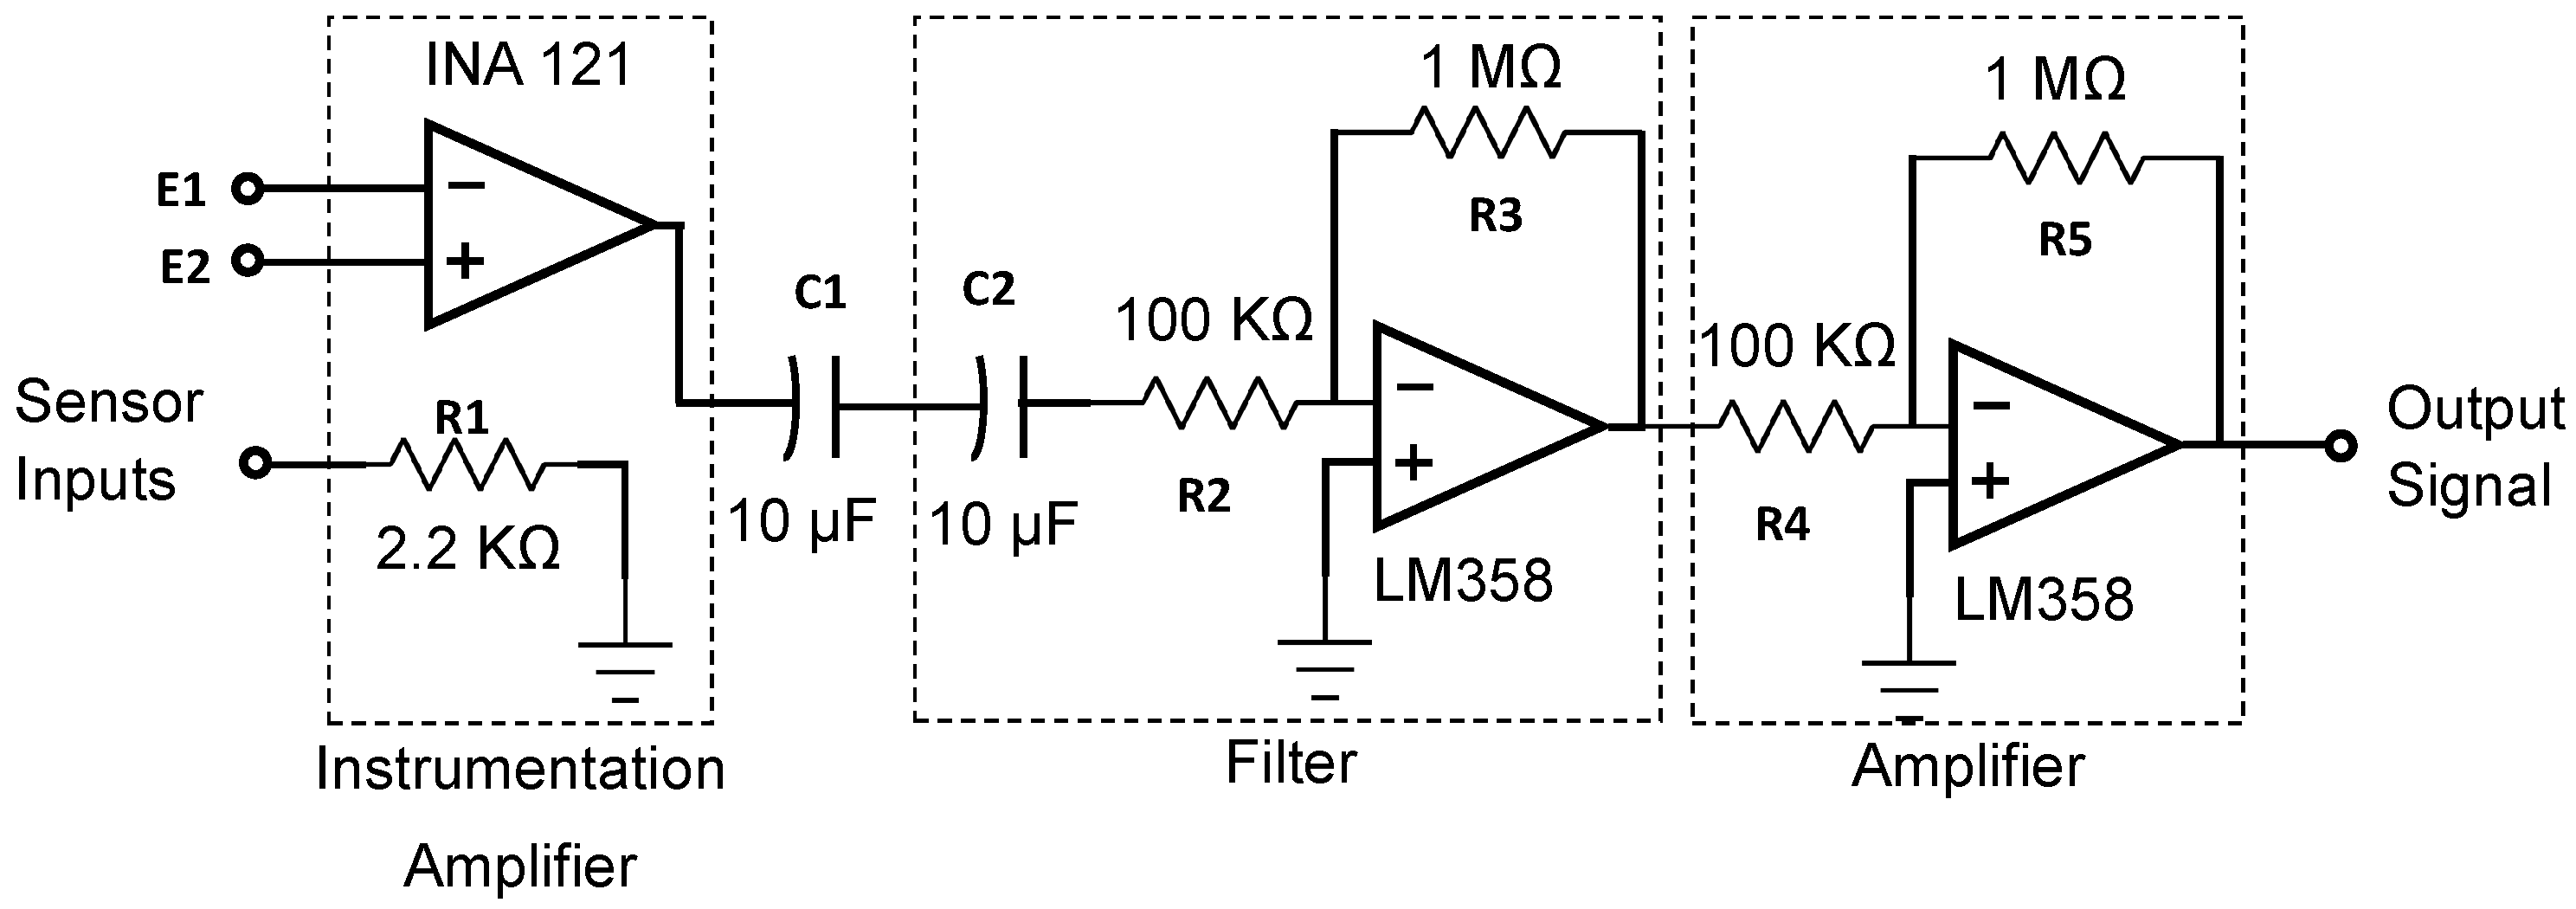
4.2. Sensor Board
4.3. Results
5. Digital Signal Processing
- digital low-pass filtering to clean the ECG signal,
- detection of the ECG features (QRS peaks), and
- validation and correction of obtained values, based on biometric model properties.
5.1. Digital Filtering
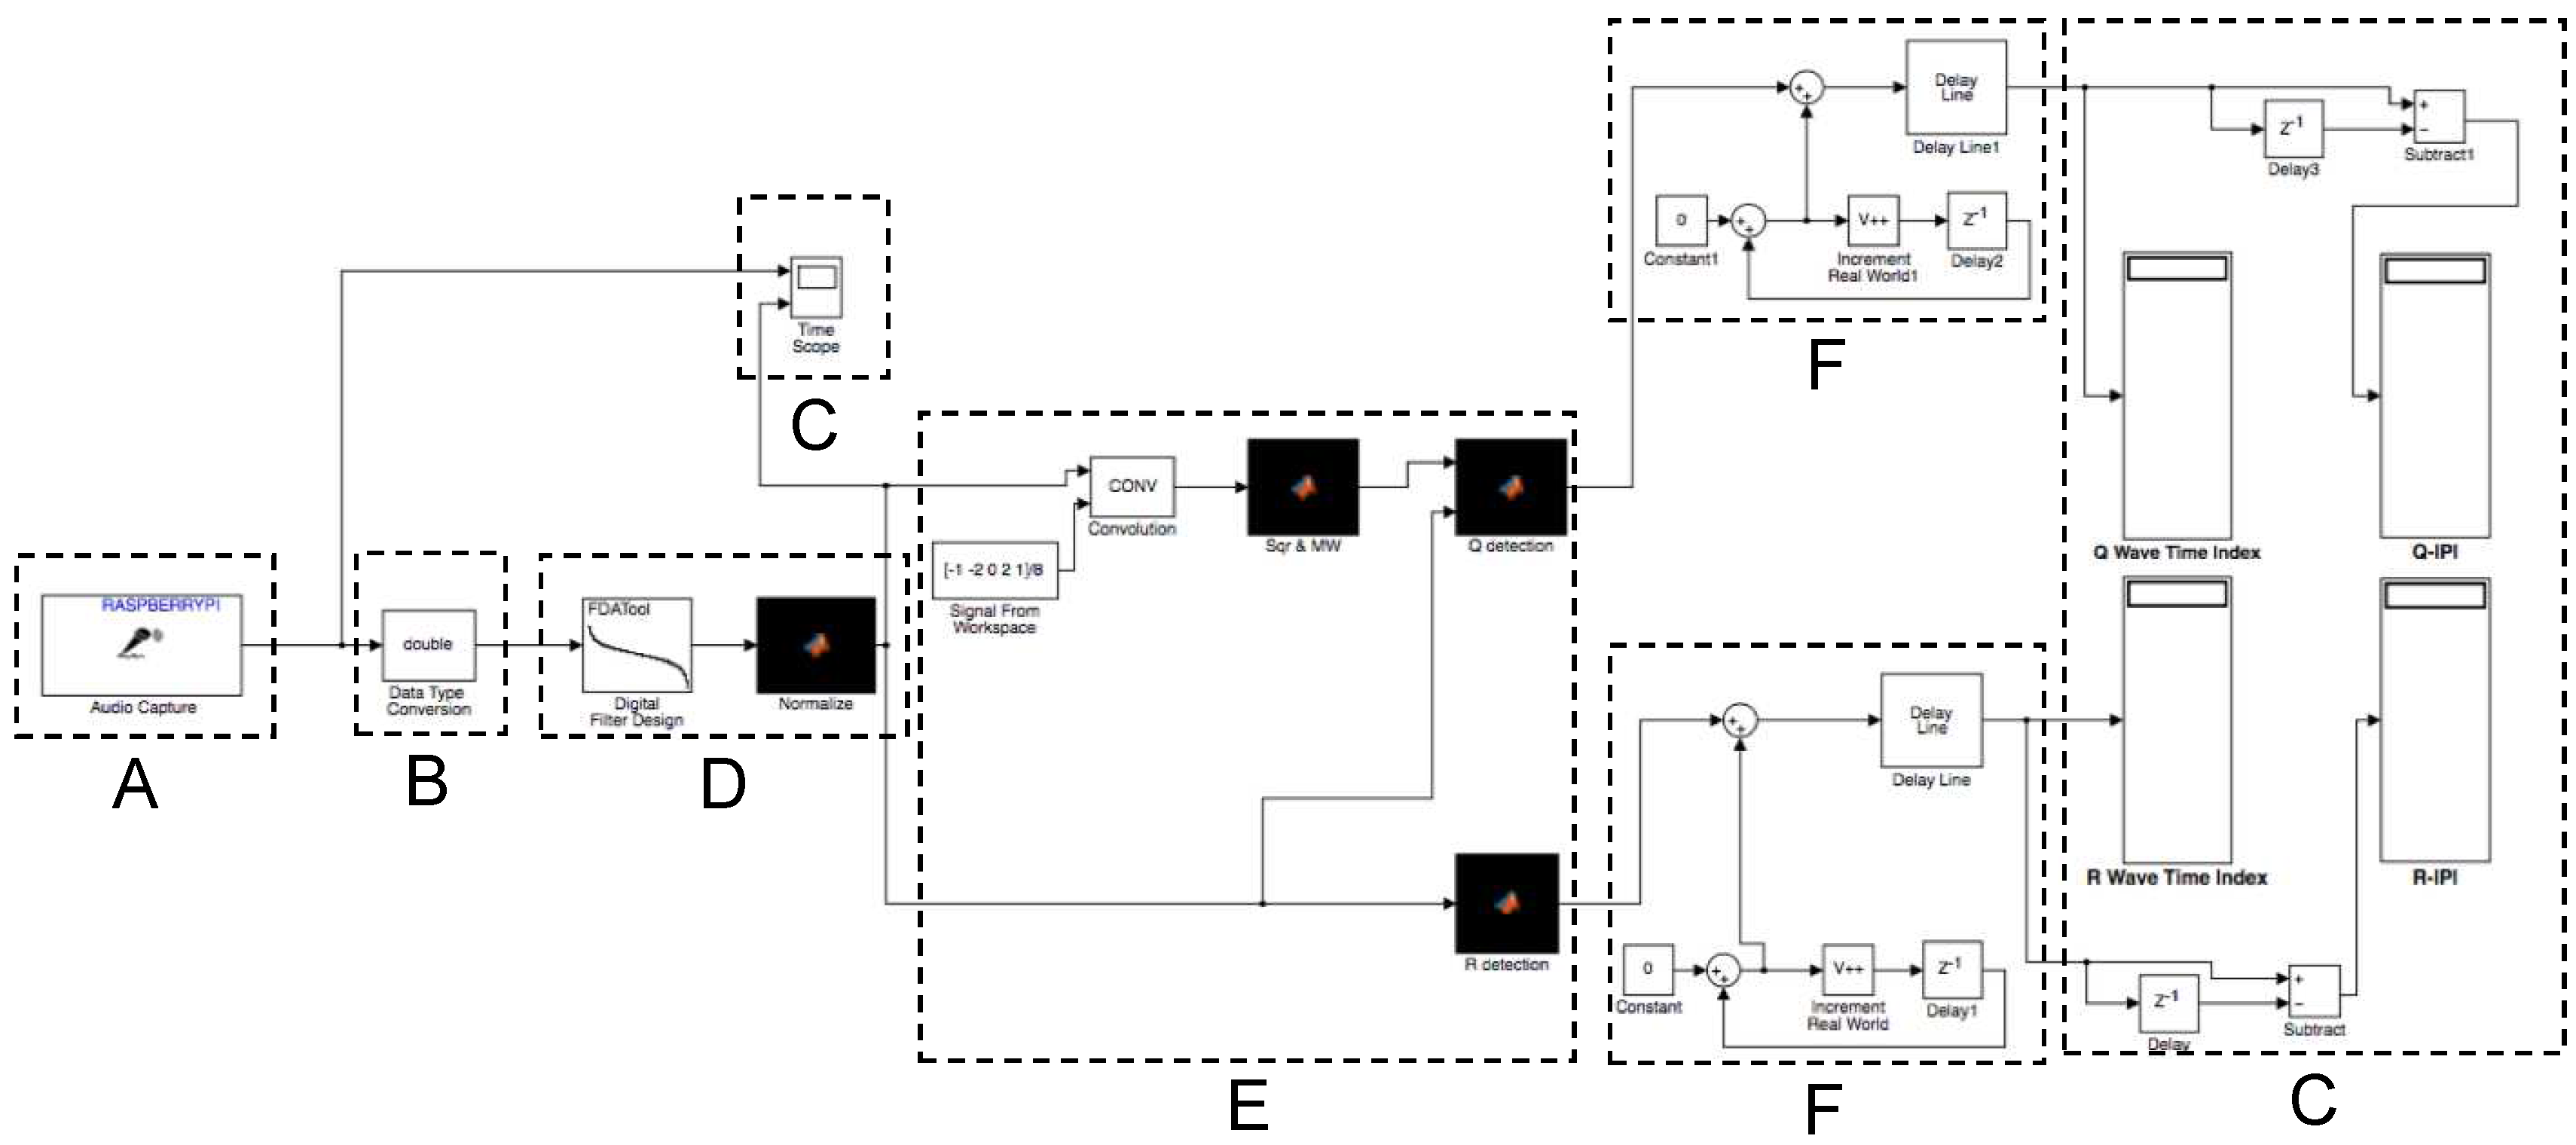
5.2. ECG Feature Detection
- a five-point derivative filtering to provide the slope information of the QRS complex, using the transfer function ,
- squaring of the signal, to obtain all positive signal values and nonlinear amplification to emphasize the characteristic higher ECG frequencies,
- fixed moving window integration to obtain waveform feature information in addition to the slope of the R wave, and
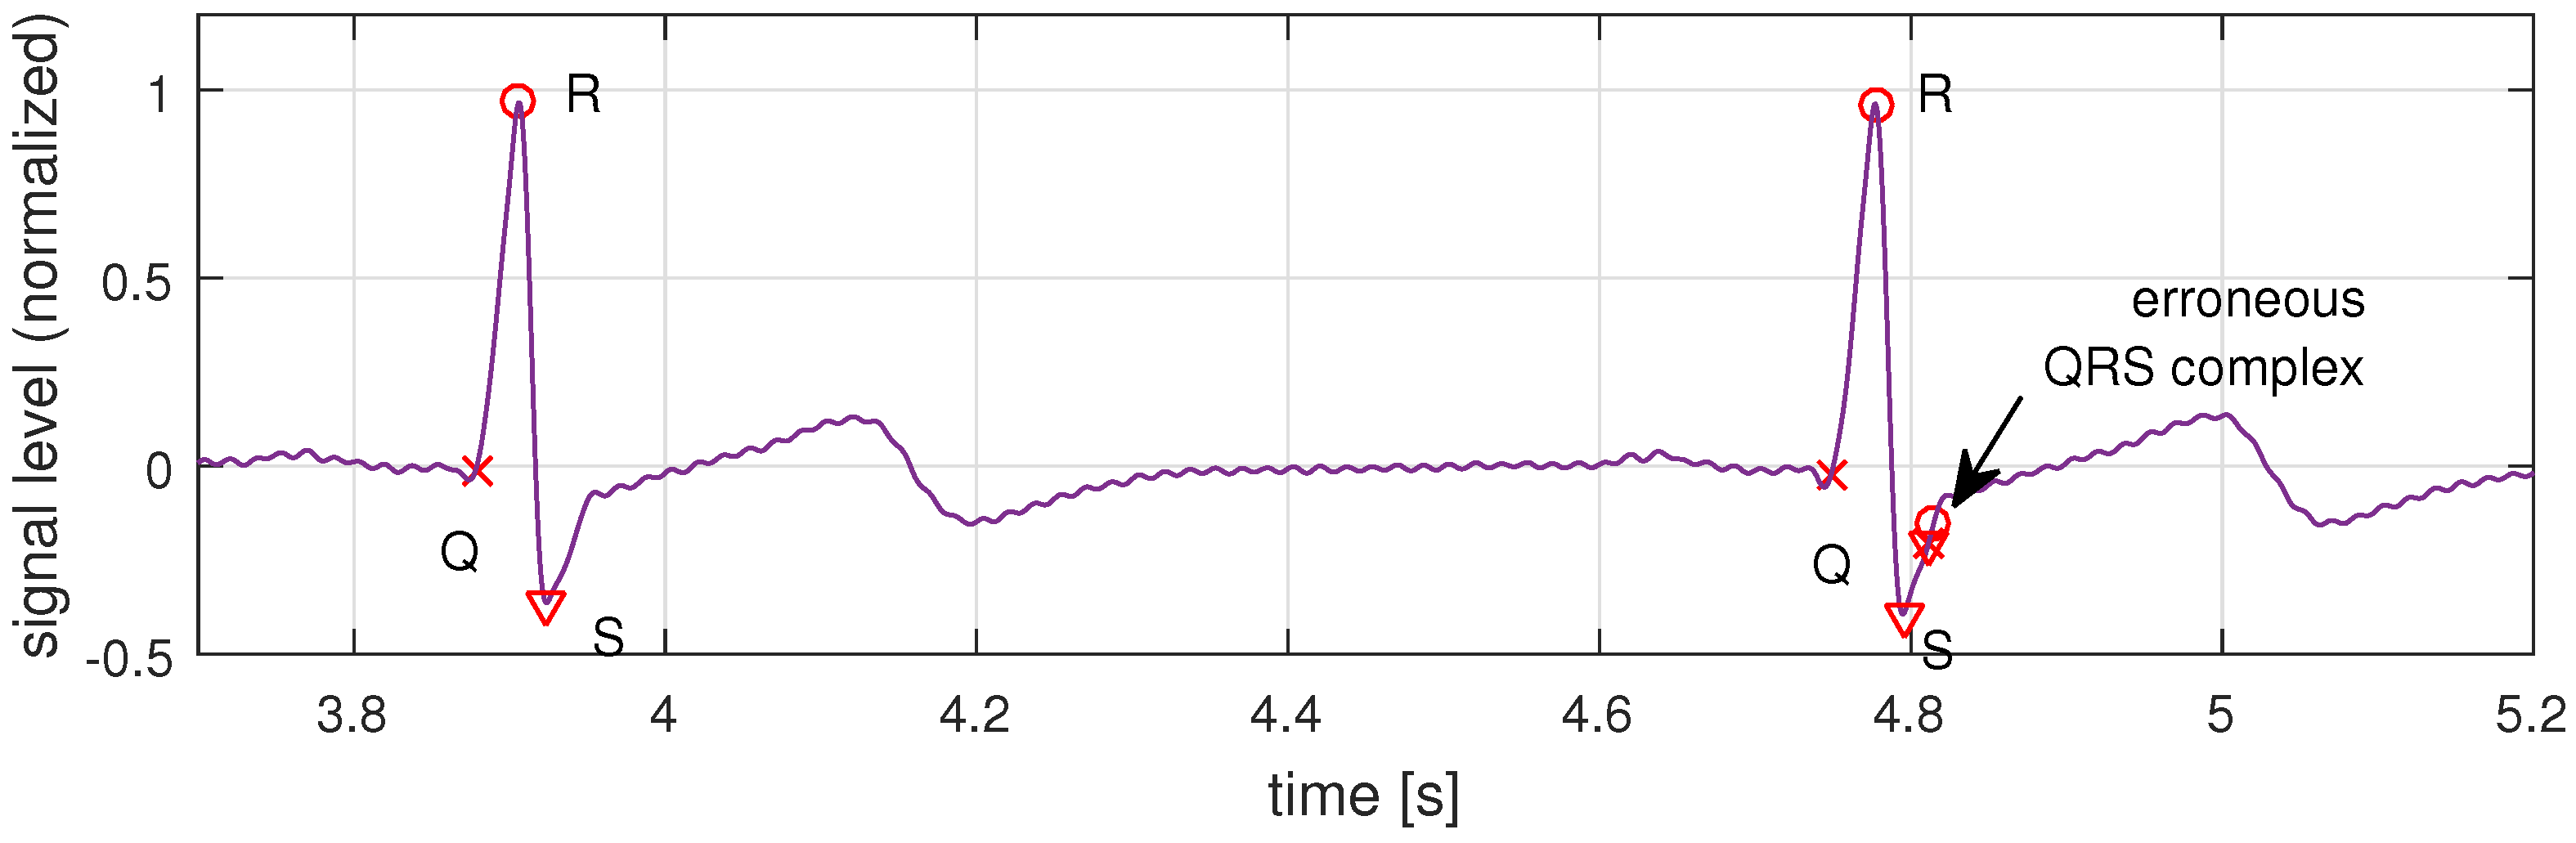
- a comparison step to identify the largest peaks in a window to locate Q, R, and S.
5.3. Model-Based Data Validation
| Algorithm 1 Model-based Validation on detected QRS peaks |
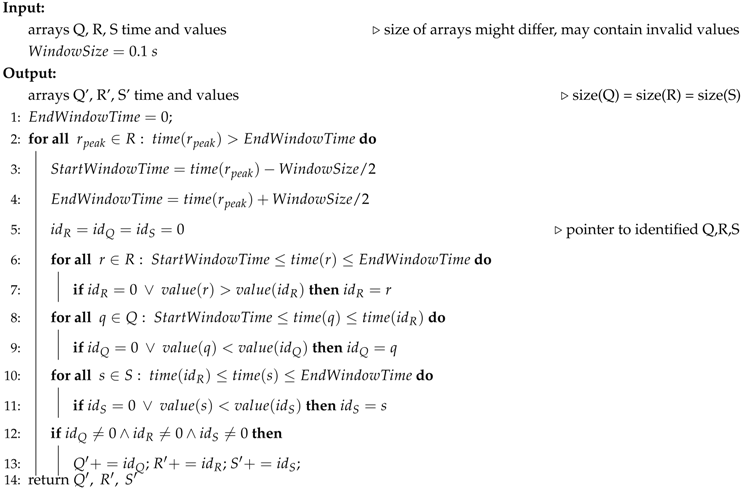 |
5.4. Matlab Implementation
5.4.1. Setup
5.4.2. Results
6. Embedded System Implementation
6.1. Target Platform
6.2. Simulink
6.3. C-Implementation
6.3.1. Filter Implementation in C
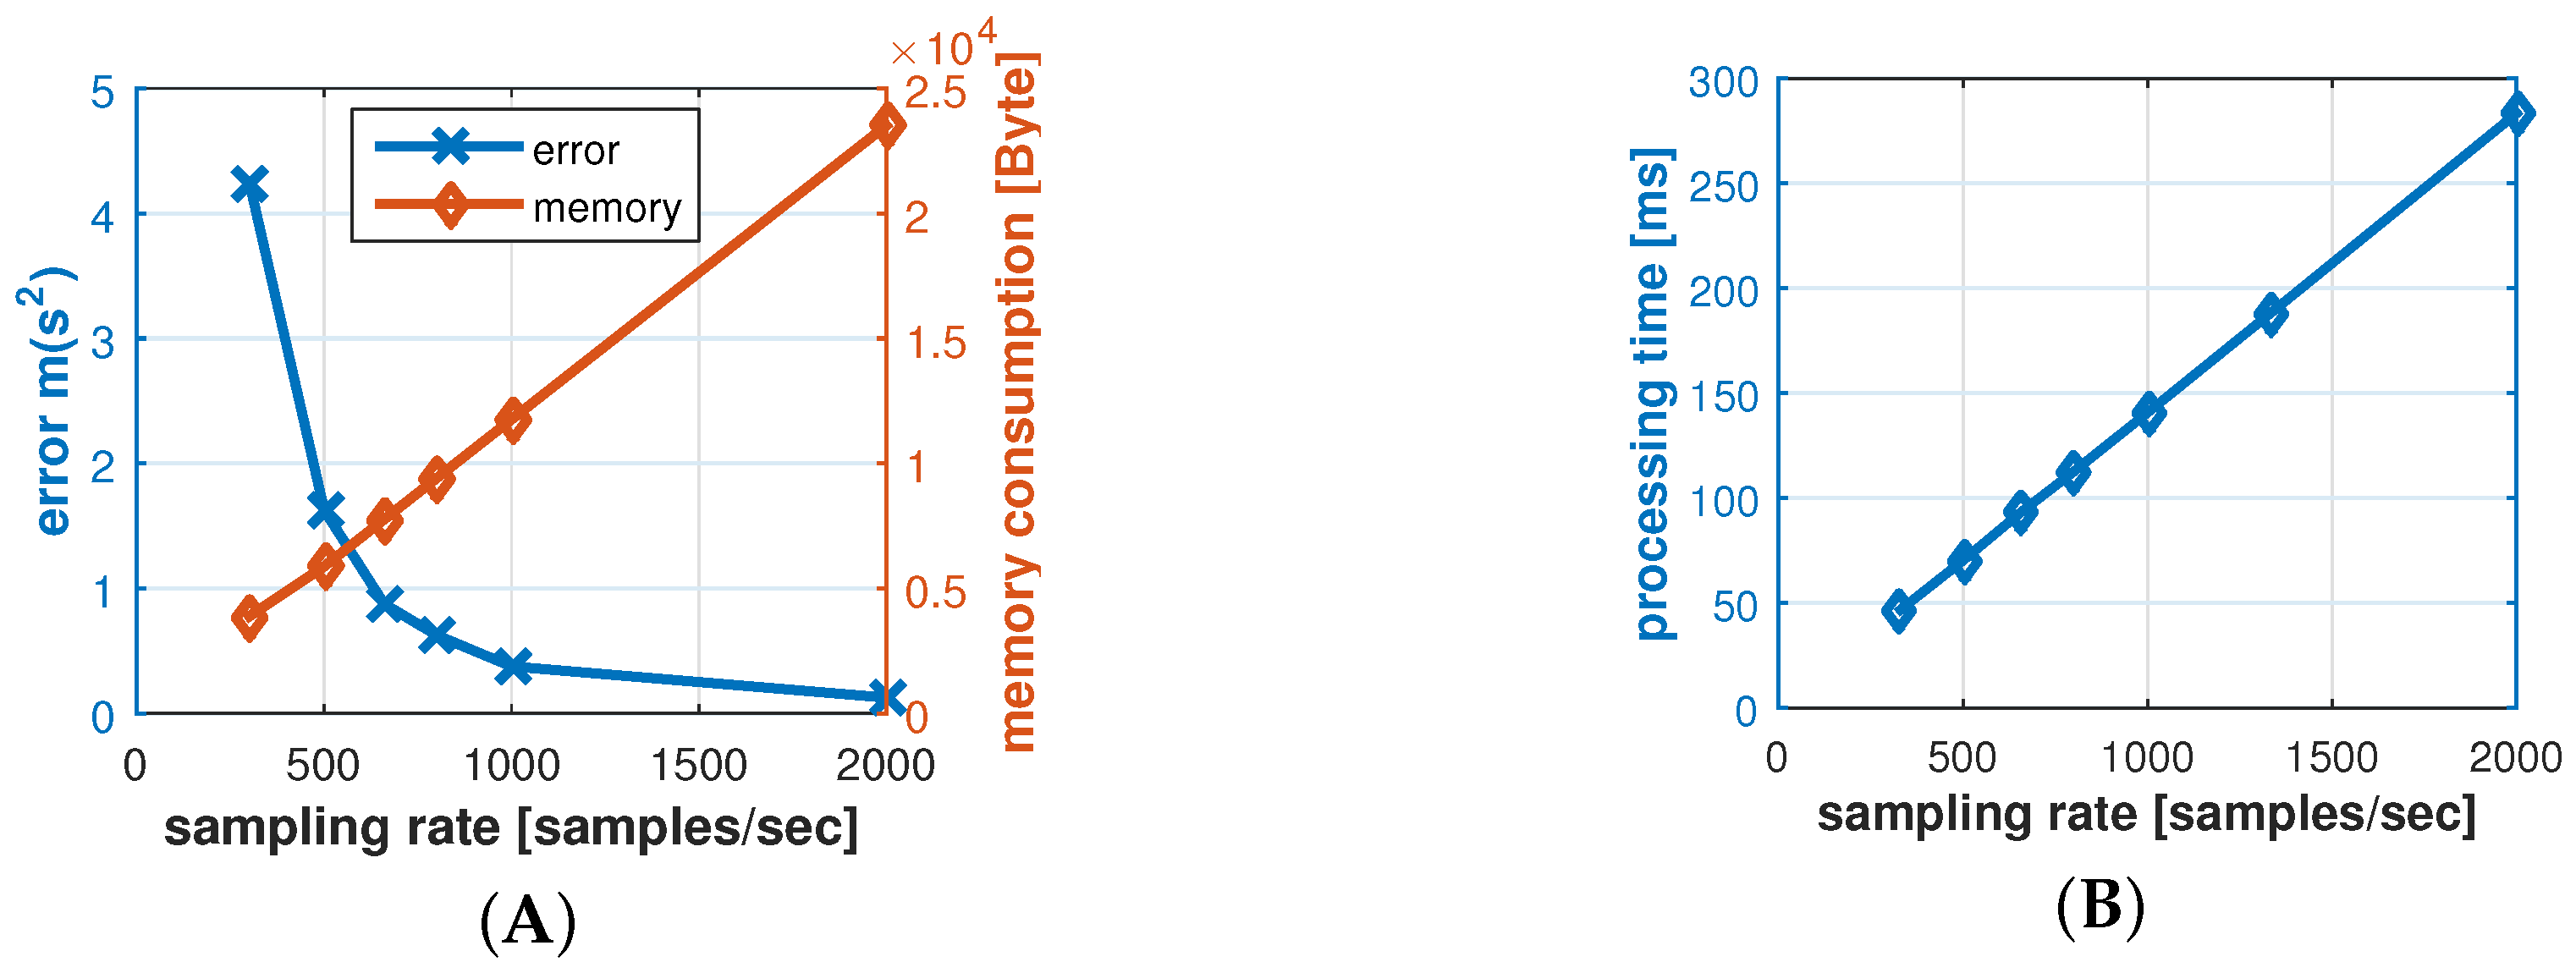
6.3.2. Sampling Rate
6.3.3. Results and Evaluation
7. Protocol
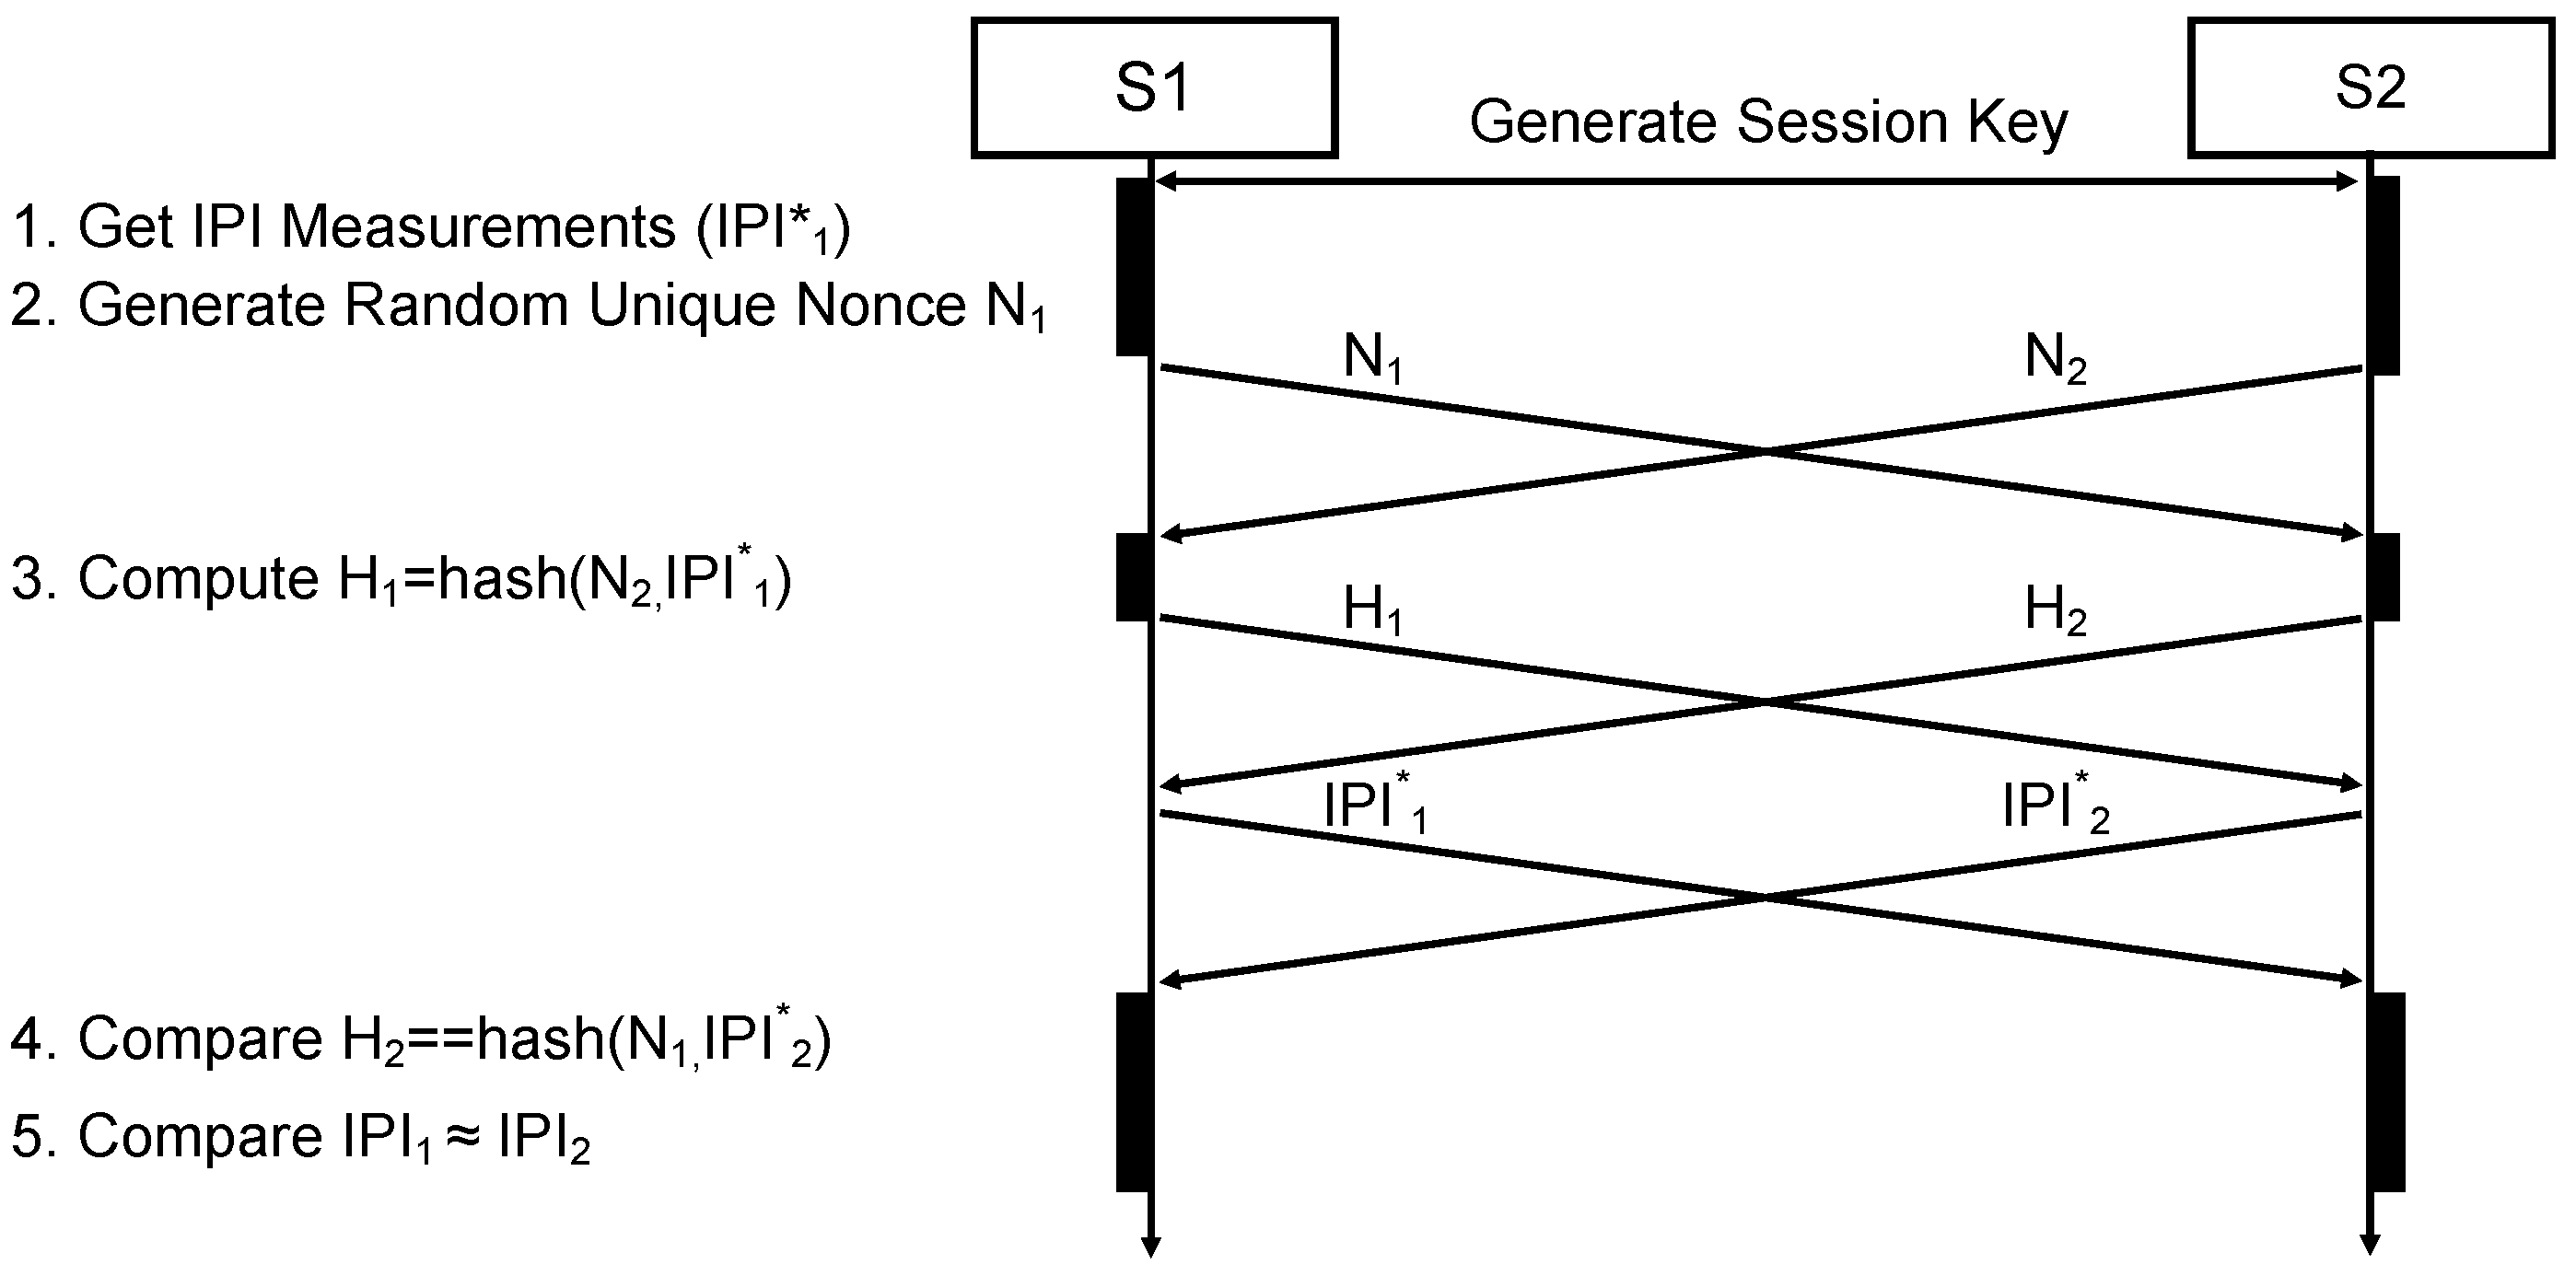
7.1. Authentication Protocol
- The IPIs of the two peers are compared based on statistical properties in the operation in Step 5. The comparison operation (≈) compares the standard deviation of the differences between the two nodes and depends on a range of uncertainties and parameters that we discuss in the next subsection.
- Each peer sends a hashed value of its measured IPIs before sending the actual IPI data (Step 3). Receiving the peer’s hash value (e.g., ) before sending the own IPIs (), prevents the peer node from forging its IPI () after receiving the authentic data. If the received IPI does not match the received hash value (Step 4) , the authentication is invalid.
- Possible replay attacks and simultaneous connection attempts are additionally hindered by enforcing the use of a unique random nonce , which in our case is a 32 bit random integer number. The nonce is generated in Step 2, and has to be used by the peer for the hash generation (Step 3). Therefore, is the hash value of the concatenated received nonce and the array of measured IPI values.
7.2. Parameters of the Authentication Protocol
7.3. Analysis
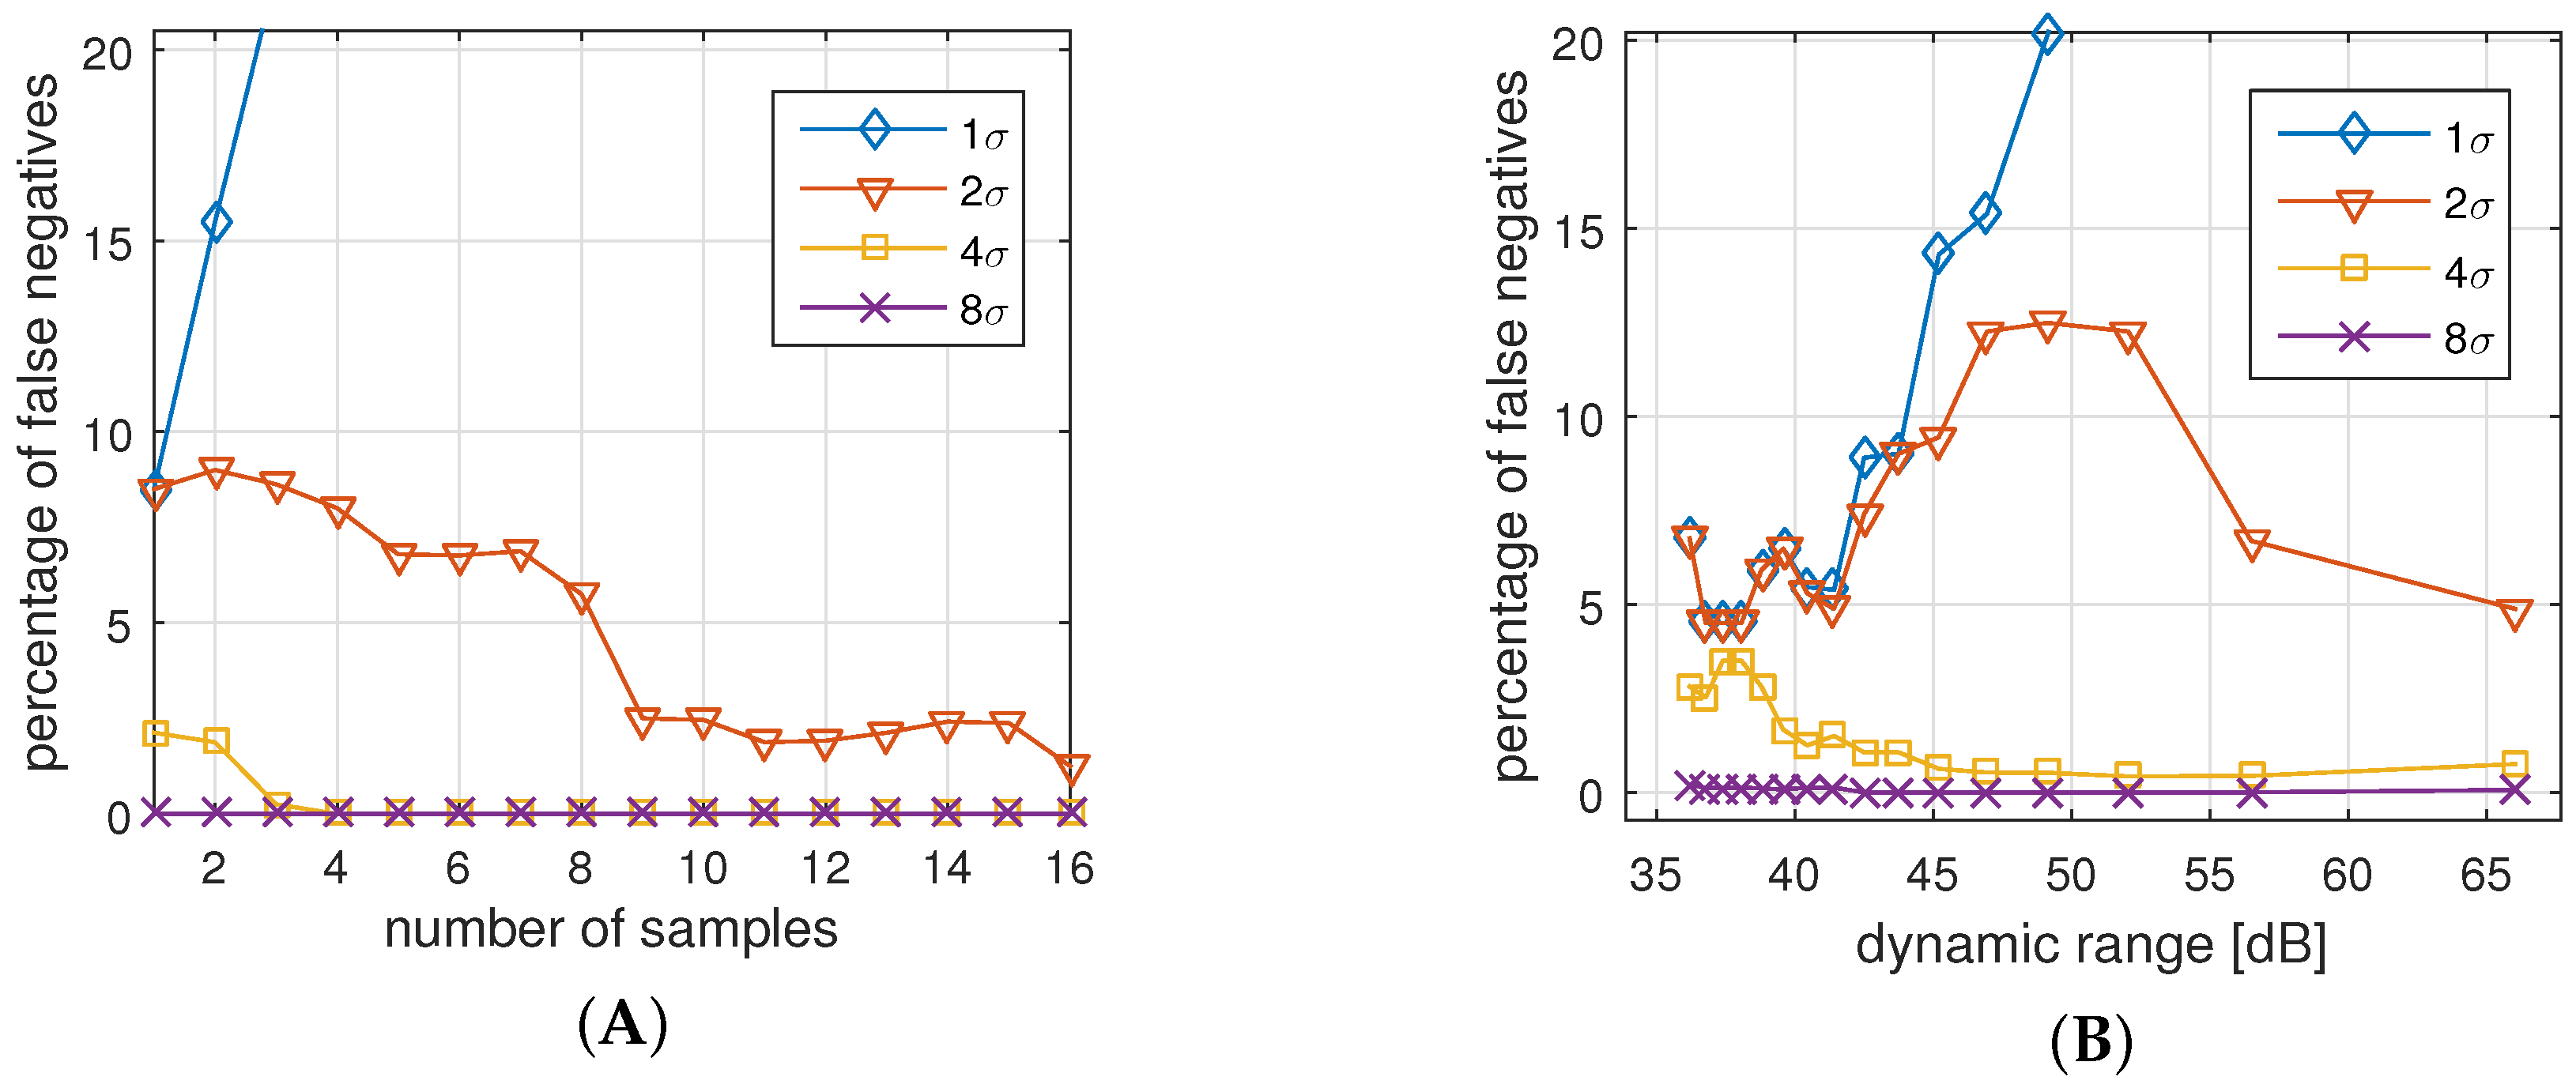
7.3.1. False Negatives Authentications (FNA)
- For all cases but , an increased number of samples reduces the number of false negatives. The reason is that a higher number of samples help to reduce the effect of possible outliers.
- Allowing only a deviation of is too strict for all settings. In fact, we see that higher number of samples increases the probability of a rejected authentication.
- With a deviation of and more, and samples and more, we practically cannot identify any false negatives anymore, i.e., all legitimate authentications are identified correctly.
- Allowed deviation of and results in too many errors regardless of the dynamic range.
- With a deviation of and more, and a dynamic range of dB (8-bit) and more, we practically cannot identify any false negatives anymore, i.e., authentication attempts are assessed correctly.
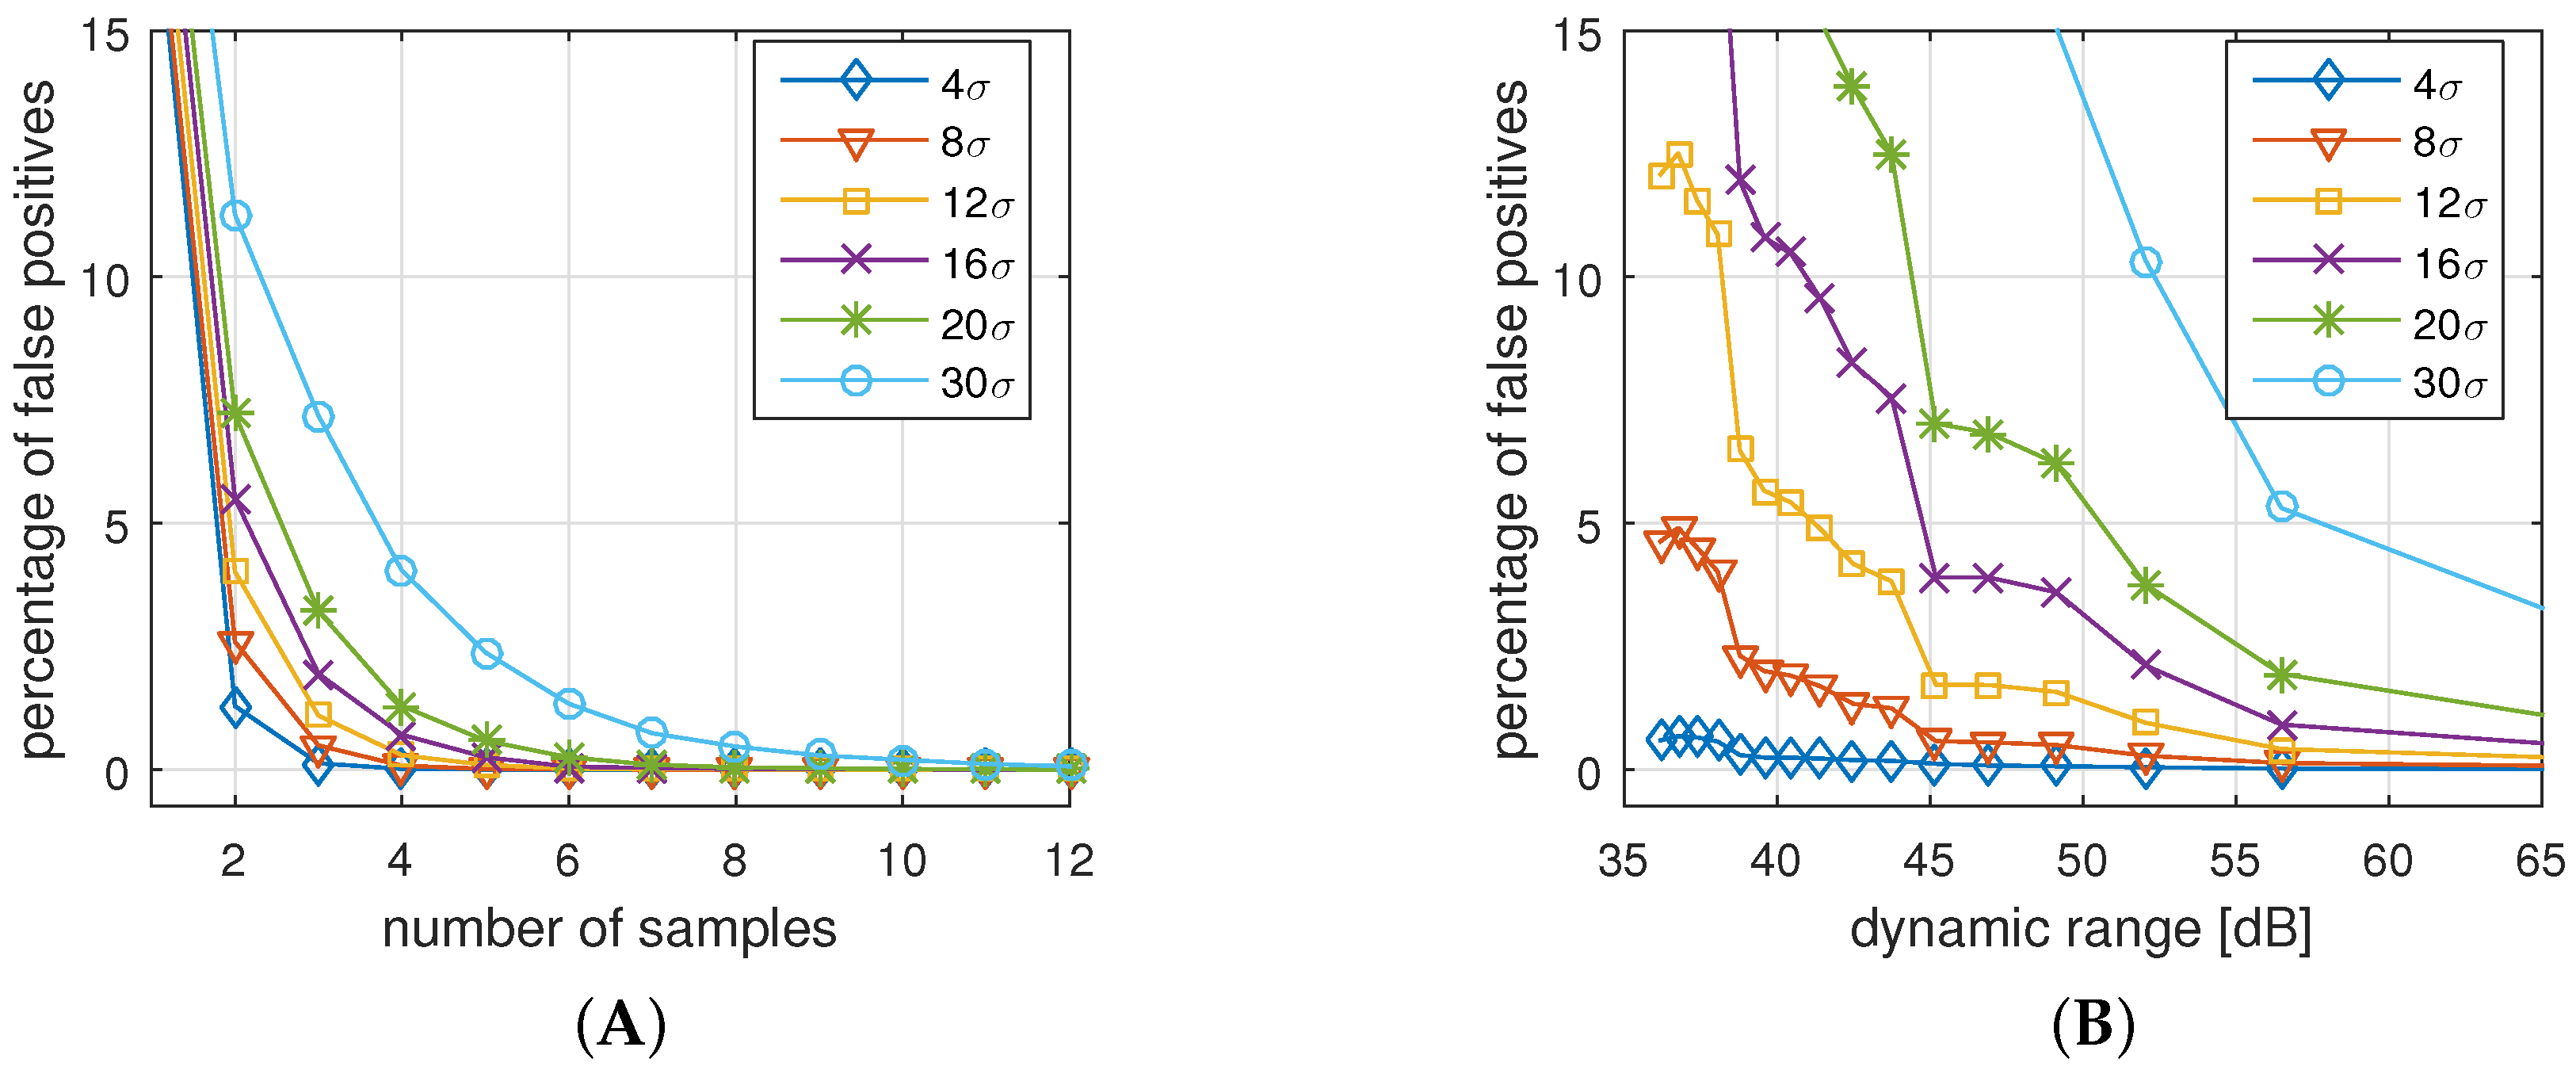
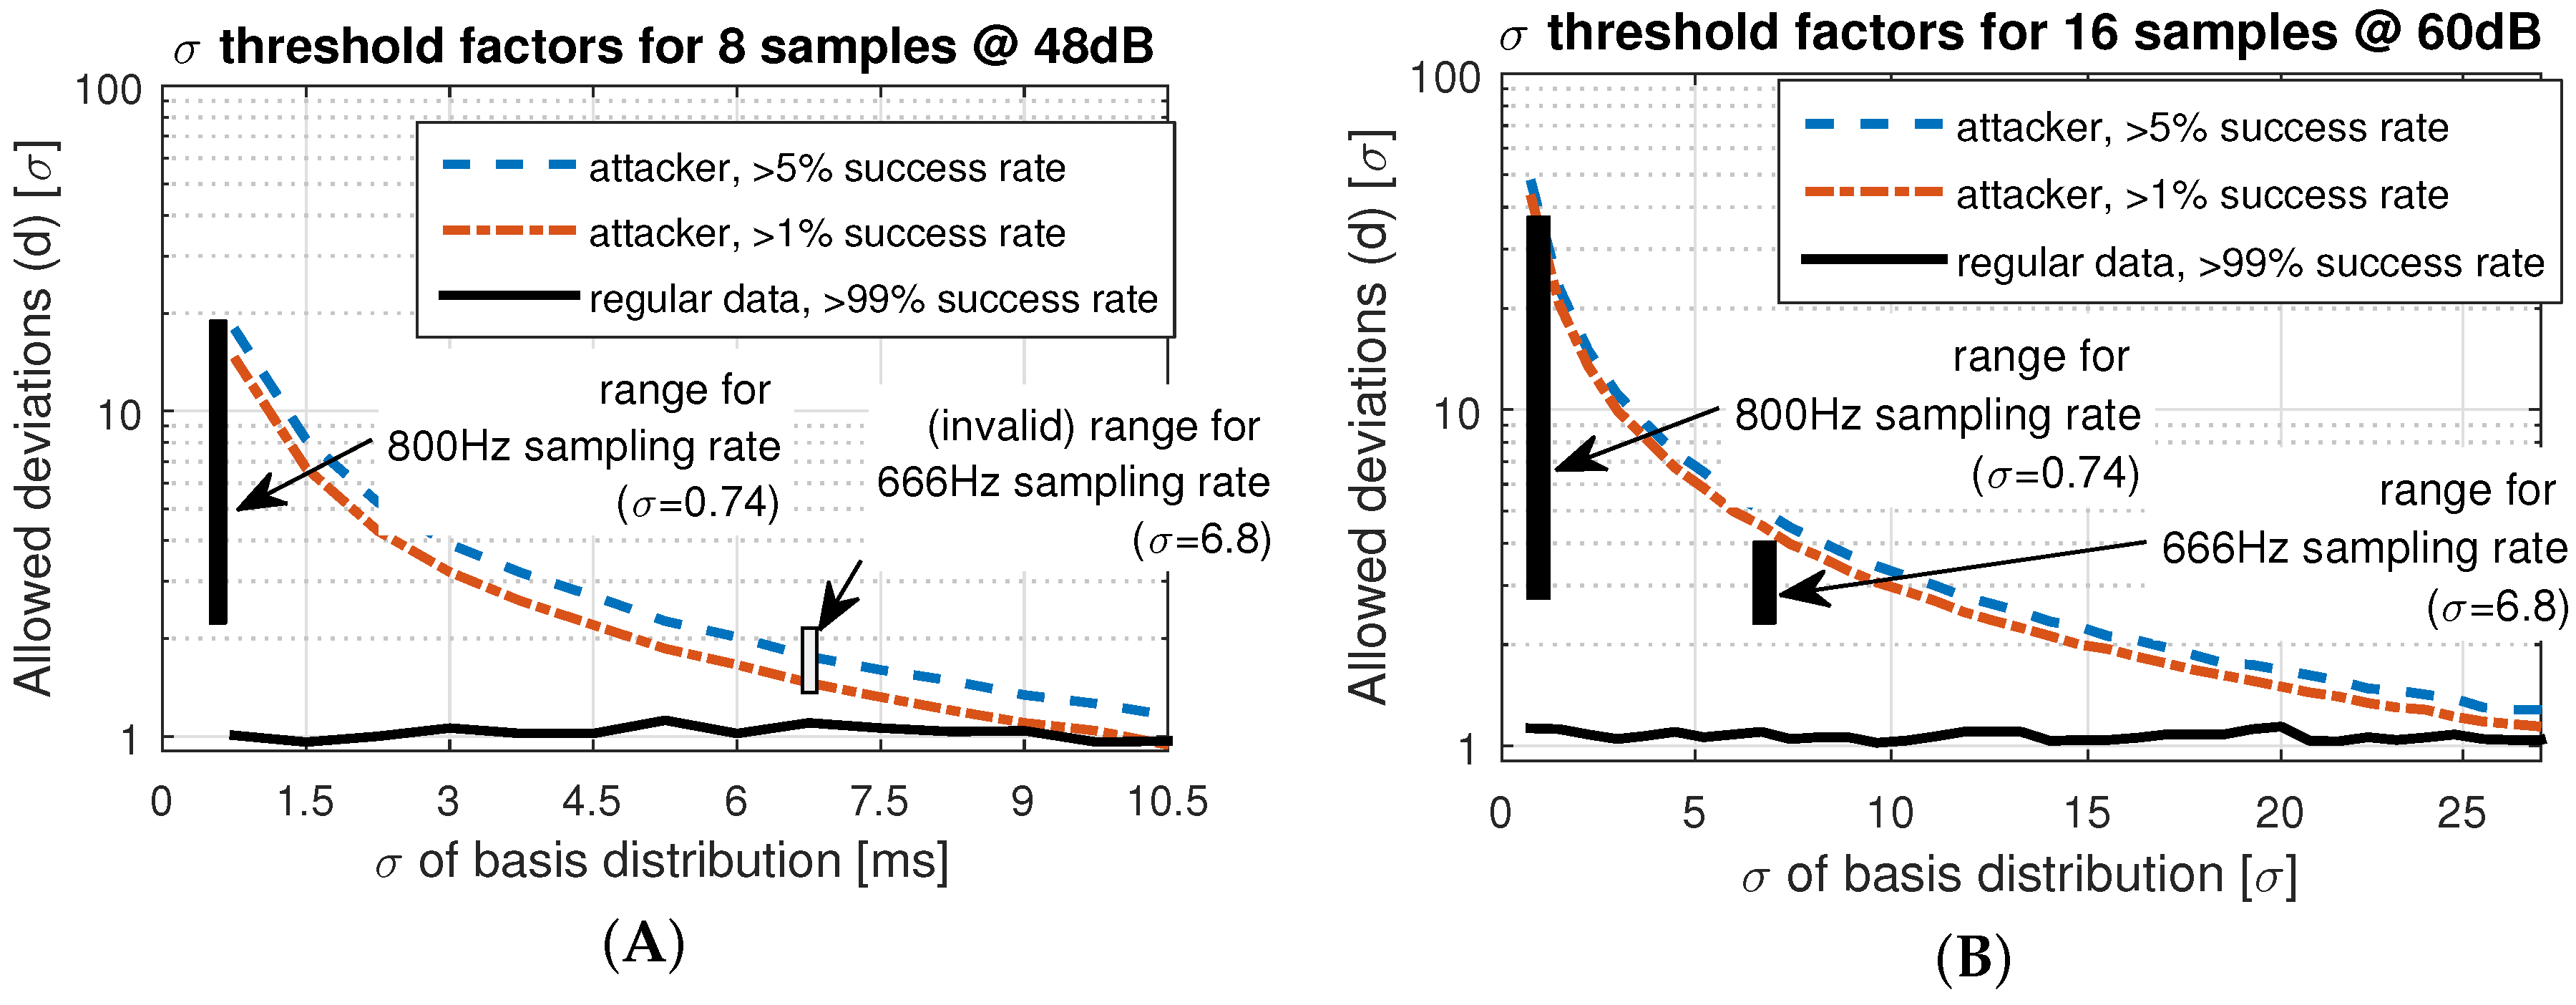
7.3.2. False Positive Authentication (FPA)
- Increasing the number of samples or increasing the dynamic range always decreases the chance for a successful attack.
- Very high allowed deviations () improve the chances for a successful attack, while small allowed deviations () prohibit attacks.
7.4. Parameter Selection and Sensitivity Analysis
8. Conclusions
Acknowledgments
Author Contributions
Conflicts of Interest
References
- Movassaghi, S.; Abolhasan, M.; Lipman, J.; Smith, D.; Jamalipour, A. Wireless body area networks: A survey. IEEE Commun. Surv. Tutor. 2014, 16, 1658–1686. [Google Scholar] [CrossRef]
- Constant, N.; Douglas-Prawl, O.; Johnson, S.; Mankodiya, K. Pulse-Glasses: An unobtrusive, wearable HR monitor with Internet-of-Things functionality. In Proceedings of the 2015 IEEE 12th International Conference on Wearable and Implantable Body Sensor Networks (BSN), Cambridge, MA, USA, 9–12 June 2015.
- Piotrowski, K.; Sojka, A.; Langendoerfer, P. Body area network for first responders: A case study. In Proceedings of the Fifth International Conference on Body Area Networks, Corfu Island, Greece, 10–12 September 2010; pp. 37–40.
- Kumar, P.; Lee, H.J. Security issues in healthcare applications using wireless medical sensor networks: A survey. Sensors 2011, 12, 55–91. [Google Scholar] [CrossRef] [PubMed]
- Sametinger, J.; Rozenblit, J.; Lysecky, R.; Ott, P. Security challenges for medical devices. Commun. ACM 2015, 58, 74–82. [Google Scholar] [CrossRef]
- Gold, R.D. Safety and Reliability Considerations. VLSI Med. VLSI Electron. Microstruct. Sci. 2014, 17, 247. [Google Scholar]
- Rushanan, M.; Rubin, A.D.; Kune, D.F.; Swanson, C.M. SoK: Security and privacy in implantable medical devices and body area networks. In Proceedings of the 2014 IEEE Symposium on Security and Privacy (SP), San Jose, CA, USA, 18–21 May 2014; pp. 524–539.
- Peter, S.; Langendoerfer, P.; Piotrowski, K. Public key cryptography empowered smart dust is affordable. Int. J. Sens. Netw. 2008, 4, 130–143. [Google Scholar] [CrossRef]
- Karlof, C.; Sastry, N.; Wagner, D. TinySec: A link layer security architecture for wireless sensor networks. In Proceedings of the 2nd International Conference on Embedded Networked Sensor Systems, Baltimore, MD, USA, 3–5 November 2004; pp. 162–175.
- Toorani, M. Cryptanalysis of two PAKE protocols for body area networks and smart environments. Int. J. Netw. Secur. 2015, 17, 629–636. [Google Scholar]
- He, D.D.; Winokur, E.S.; Sodini, C.G. A continuous, wearable, and wireless heart monitor using head ballistocardiogram (BCG) and head electrocardiogram (ECG). In Proceedings of the 2011 Annual International Conference of the IEEE Engineering in Medicine and Biology Society, Boston, MA, USA, 30 August–3 September 2011; pp. 4729–4732.
- Takano, C.; Ohta, Y. Heart rate measurement based on a time-lapse image. Med. Eng. Phys. 2007, 29, 853–857. [Google Scholar] [CrossRef] [PubMed]
- Al Taradeh, N.; Bastaki, N.; Saadat, I.; Al Ahmad, M. Non-invasive piezoelectric detection of heartbeat rate and blood pressure. Electron. Lett. 2015, 51, 452–454. [Google Scholar] [CrossRef]
- Shu, Y.; Li, C.; Wang, Z.; Mi, W.; Li, Y.; Ren, T.L. A Pressure sensing system for heart rate monitoring with polymer-based pressure sensors and an anti-interference post processing circuit. Sensors 2015, 15, 3224–3235. [Google Scholar] [CrossRef] [PubMed]
- Zhang, Z.; Wang, H.; Vasilakos, A.; Fang, H. ECG-Cryptography and Authentication in Body Area Networks. IEEE Trans. Inf. Technol. Biomed. 2012, 16, 1070–1078. [Google Scholar] [CrossRef] [PubMed]
- Yao, L.; Liu, B.; Yao, K.; Wu, G.; Wang, J. An ECG-Based Signal Key Establishment Protocol in Body Area Networks. In Proceedings of the 2010 7th International Conference on Ubiquitous Intelligence & Computing and 7th International Conference on Autonomic & Trusted Computing (UIC/ATC), Xi’an, China, 26–29 October 2010; pp. 233–238.
- Venkatasubramanian, K.K.; Banerjee, A.; Gupta, S.K.S. PSKA: Usable and secure key agreement scheme for body area networks. IEEE Trans. Inf. Technol. Biomed. 2010, 14, 60–68. [Google Scholar] [CrossRef] [PubMed]
- Poon, C.C.; Zhang, Y.T.; Bao, S.D. A novel biometrics method to secure wireless body area sensor networks for telemedicine and m-health. IEEE Commun. Mag. 2006, 44, 73–81. [Google Scholar] [CrossRef]
- Jensen, J.; Chang, D.; Lee, E. A model-based design methodology for cyber-physical systems. In Proceedings of the 2011 7th International Wireless Communications and Mobile Computing Conference (IWCMC), Istanbul, Turkey, 4–8 July 2011; pp. 1666–1671.
- Jeon, C.; Awtry, E.H.; Ware, M.G. Blueprints Cardiology; Lippincott Williams & Wilkins: Philadelphia, PA, USA, 2006. [Google Scholar]
- Li, M.; Lou, W.; Ren, K. Data security and privacy in wireless body area networks. IEEE Wirel. Commun. 2010, 17, 51–58. [Google Scholar] [CrossRef]
- Hu, C.; Cheng, X.; Zhang, F.; Wu, D.; Liao, X.; Chen, D. OPFKA: Secure and efficient ordered-physiological-feature-based key agreement for wireless body area networks. In Proceedings of the 2013 Proceedings IEEE INFOCOM, Turin, Italy, 14–19 April 2013; pp. 2274–2282.
- Wang, W.; Wang, H.; Hempel, M.; Peng, D.; Sharif, H.; Chen, H.H. Secure Stochastic ECG Signals Based on Gaussian Mixture Model for-Healthcare Systems. IEEE Syst. J. 2011, 5, 564–573. [Google Scholar] [CrossRef]
- Dodis, Y.; Reyzin, L.; Smith, A. Fuzzy extractors: How to generate strong keys from biometrics and other noisy data. Advances in Cryptology-Eurocrypt 2004; Springer: Berlin/Heidelberg, Germany, 2004; pp. 523–540. [Google Scholar]
- Moody, G.B.; Mark, R.G. The impact of the MIT-BIH arrhythmia database. IEEE Eng. Med. Biol. Mag. 2001, 20, 45–50. [Google Scholar] [CrossRef] [PubMed]
- Bao, S.D.; Poon, C.C.; Zhang, Y.T.; Shen, L.F. Using the timing information of heartbeats as an entity identifier to secure body sensor network. IEEE Trans. Inf. Technol. Biomed. 2008, 12, 772–779. [Google Scholar] [PubMed]
- Banerjee, A.; Gupta, S.K.; Venkatasubramanian, K.K. PEES: Physiology-based end-to-end security for mHealth. In Proceedings of the 4th Conference on Wireless Health, Baltimore, MD, USA, 1–3 November 2013.
- Denning, T.; Kramer, D.B.; Friedman, B.; Reynolds, M.R.; Gill, B.; Kohno, T. CPS: Beyond usability: Applying value sensitive design based methods to investigate domain characteristics for security for implantable cardiac devices. In Proceedings of the 30th Annual Computer Security Applications Conference, New Orleans, LA, USA, 8–12 December 2014; pp. 426–435.
- Maye, O.; Peter, S. How key establishment in medical sensor networks benefits from near field communication technology. In Proceedings of the 2010 IEEE/ACM Int’l Conference on Cyber, Physical and Social Computing (CPSCom), Green Computing and Communications (GreenCom), Hangzhou, China, 18–20 December 2010; pp. 566–571.
- Nie, Z.; Liu, Y.; Duan, C.; Ruan, Z.; Li, J.; Wang, L. Wearable biometric authentication based on human body communication. In Proceedings of the 2015 IEEE 12th International Conference on Wearable and Implantable Body Sensor Networks (BSN), Cambridge, MA, USA, 9–12 June 2015; pp. 1–5.
- Ali, J. Economical ECG Machine. Int. J. Appl. Phys. Math. 2012, 2, 179. [Google Scholar] [CrossRef]
- Medline. MedGel General Monitoring Foam Electrodes. 2015. Available online: http://www.medline.com/sku/item/MDPMDSM611505 (accessed on 19 April 2016).
- Proakis, J.G.; Manolakis, D.G. Digital Signal Processing: Principles, Algorithms, and Applications, 4/e; Pearson Education: New York, NY, USA, 2007. [Google Scholar]
- CPS Design Group at UC Irvine. Webpage: Biometric Authentication in Body Sensor Networks. Available online: http://tiny.cc/bioauth (accessed on 19 April 2016).
- Mehta, S.; Lingayat, N. Detection of P and T-waves in Electrocardiogram. In Proceedings of the World Congress on Engineering and Computer Science, San Francisco, CA, USA, 22–24 October 2008; pp. 22–24.
- Pan, J.; Tompkins, W.J. A real-time QRS detection algorithm. IEEE Trans. Biomed. Eng. 1985, 230–236. [Google Scholar] [CrossRef] [PubMed]
- Patel, A.M.; Gakare, P.K.; Cheeran, A. Real time ECG feature extraction and arrhythmia detection on a mobile platform. Int. J. Comput. Appl. 2012, 44, 40–45. [Google Scholar]
- Tomtsis, D.; Kontogiannis, S.; Kokkonis, G.; Kazanidis, I.; Valsamidis, S. Proposed cloud infrastructure of wearable and ubiquitous medical services. In Proceedings of the 2015 Fifth International Conference on Digital Information Processing and Communications (ICDIPC), Sierre, Switzerland, 7–9 October 2015; pp. 213–218.
- Villarrubia, G.; Bajo, J.; De Paz, J.F.; Corchado, J.M. Monitoring and detection platform to prevent anomalous situations in home care. Sensors 2014, 14, 9900–9921. [Google Scholar] [CrossRef] [PubMed]
- MathWorks. Simulink Coder-Generate C and C++ Code from Simulink and Stateflow Models. Available online: http://www.mathworks.com/products/simulink-coder/ (accessed on 19 April 2016).
- Ali, A.; Khan, F.A. Key agreement schemes in wireless body area networks: Taxonomy and state-of-the-Art. J. Med. Syst. 2015, 39, 1–14. [Google Scholar] [CrossRef] [PubMed]
- Li, N.; Li, T.; Venkatasubramanian, S. t-Closeness: Privacy beyond k-anonymity and l-diversity. In Proceedings of the 2007 IEEE 23rd International Conference on Data Engineering, Istanbul, Turkey, 15–20 April 2007; pp. 106–115.


| IPI in (s) | 1st IPI | 2nd IPI | 3rd IPI | 4th IPI | 5th IPI | 6th IPI | 7th IPI |
|---|---|---|---|---|---|---|---|
| Sensor 1 R | 0.927 | 0.908 | 0.880 | 0.864 | 0.799 | 0.828 | 0.774 |
| Sensor 2 R | 0.927 | 0.908 | 0.880 | 0.865 | 0.799 | 0.828 | 0.774 |
| Sensor 1 Q | 0.926 | 0.909 | 0.880 | 0.865 | 0.798 | 0.829 | 0.774 |
| Sensor 2 Q | 0.926 | 0.908 | 0.879 | 0.865 | 0.799 | 0.828 | 0.775 |
| Sensor 1 S | 0.927 | 0.908 | 0.879 | 0.865 | 0.799 | 0.828 | 0.774 |
| Sensor 2 S | 0.927 | 0.908 | 0.880 | 0.865 | 0.799 | 0.827 | 0.775 |
| IPI in (s) | 1st IPI | 2nd IPI | 3rd IPI | 4th IPI | 5th IPI | 6th IPI | 7th IPI |
|---|---|---|---|---|---|---|---|
| Sensor 1 R | 0.927 | 0.908 | 0.880 | 0.864 | 1.299 | 0.828 | 0.774 |
| Sensor 2 R | 0.99 | 0.7737 | 0.73 | 0.908 | 0.8617 | 1.053 | 0.977 |
| Sensor 1 Q | 0.926 | 0.909 | 0.880 | 0.865 | 0.798 | 0.829 | 0.774 |
| Sensor 2 Q | 1.1723 | 0.828 | 1.0 | 1.086 | 0.9137 | 0.994 | 0.9873 |
| IPI in (s) | 1st IPI | 2nd IPI | 3rd IPI | 4th IPI | 5th IPI | 6th IPI |
|---|---|---|---|---|---|---|
| Sensor 1 Q | 0.965 | 0.967 | 0.901 | 0.964 | 0.984 | 0.913 |
| Sensor 2 Q | 0.965 | 0.969 | 0.905 | 0.960 | 0.986 | 0.910 |
| Sensor 1 R | 0.964 | 0.969 | 0.904 | 0.960 | 0.986 | 0.910 |
| Sensor 2 R | 0.965 | 0.969 | 0.905 | 0.960 | 0.986 | 0.910 |
| Sensor 1 S | 0.964 | 0.968 | 0.901 | 0.963 | 0.985 | 0.913 |
| Sensor 2 S | 0.965 | 0.969 | 0.904 | 0.962 | 0.985 | 0.910 |
| Distance Δ (ms) | Req. Bits b | Dyn. Range r (dB) |
|---|---|---|
| 1 | 11 | 66 |
| 2 | 10 | 60 |
| 4 | 9 | 53 |
| 8 | 8 | 47 |
| 20 | 7 | 40 |
| Distance Δ | Samples | |||
|---|---|---|---|---|
| [ms] | 2 | 4 | 8 | 16 |
| 2 | 20 | 40 | 80 | 160 |
| 4 | 18 | 36 | 72 | 144 |
| 8 | 16 | 32 | 64 | 128 |
| 20 | 14 | 28 | 56 | 112 |
© 2016 by the authors; licensee MDPI, Basel, Switzerland. This article is an open access article distributed under the terms and conditions of the Creative Commons Attribution (CC-BY) license (http://creativecommons.org/licenses/by/4.0/).
Share and Cite
Peter, S.; Pratap Reddy, B.; Momtaz, F.; Givargis, T. Design of Secure ECG-Based Biometric Authentication in Body Area Sensor Networks. Sensors 2016, 16, 570. https://doi.org/10.3390/s16040570
Peter S, Pratap Reddy B, Momtaz F, Givargis T. Design of Secure ECG-Based Biometric Authentication in Body Area Sensor Networks. Sensors. 2016; 16(4):570. https://doi.org/10.3390/s16040570
Chicago/Turabian StylePeter, Steffen, Bhanu Pratap Reddy, Farshad Momtaz, and Tony Givargis. 2016. "Design of Secure ECG-Based Biometric Authentication in Body Area Sensor Networks" Sensors 16, no. 4: 570. https://doi.org/10.3390/s16040570
APA StylePeter, S., Pratap Reddy, B., Momtaz, F., & Givargis, T. (2016). Design of Secure ECG-Based Biometric Authentication in Body Area Sensor Networks. Sensors, 16(4), 570. https://doi.org/10.3390/s16040570