
Development of Microfluidic Systems Enabling High-Throughput Single-Cell Protein Characterization


Abstract
:1. Introduction

| Techniques | Key Achievements | References |
|---|---|---|
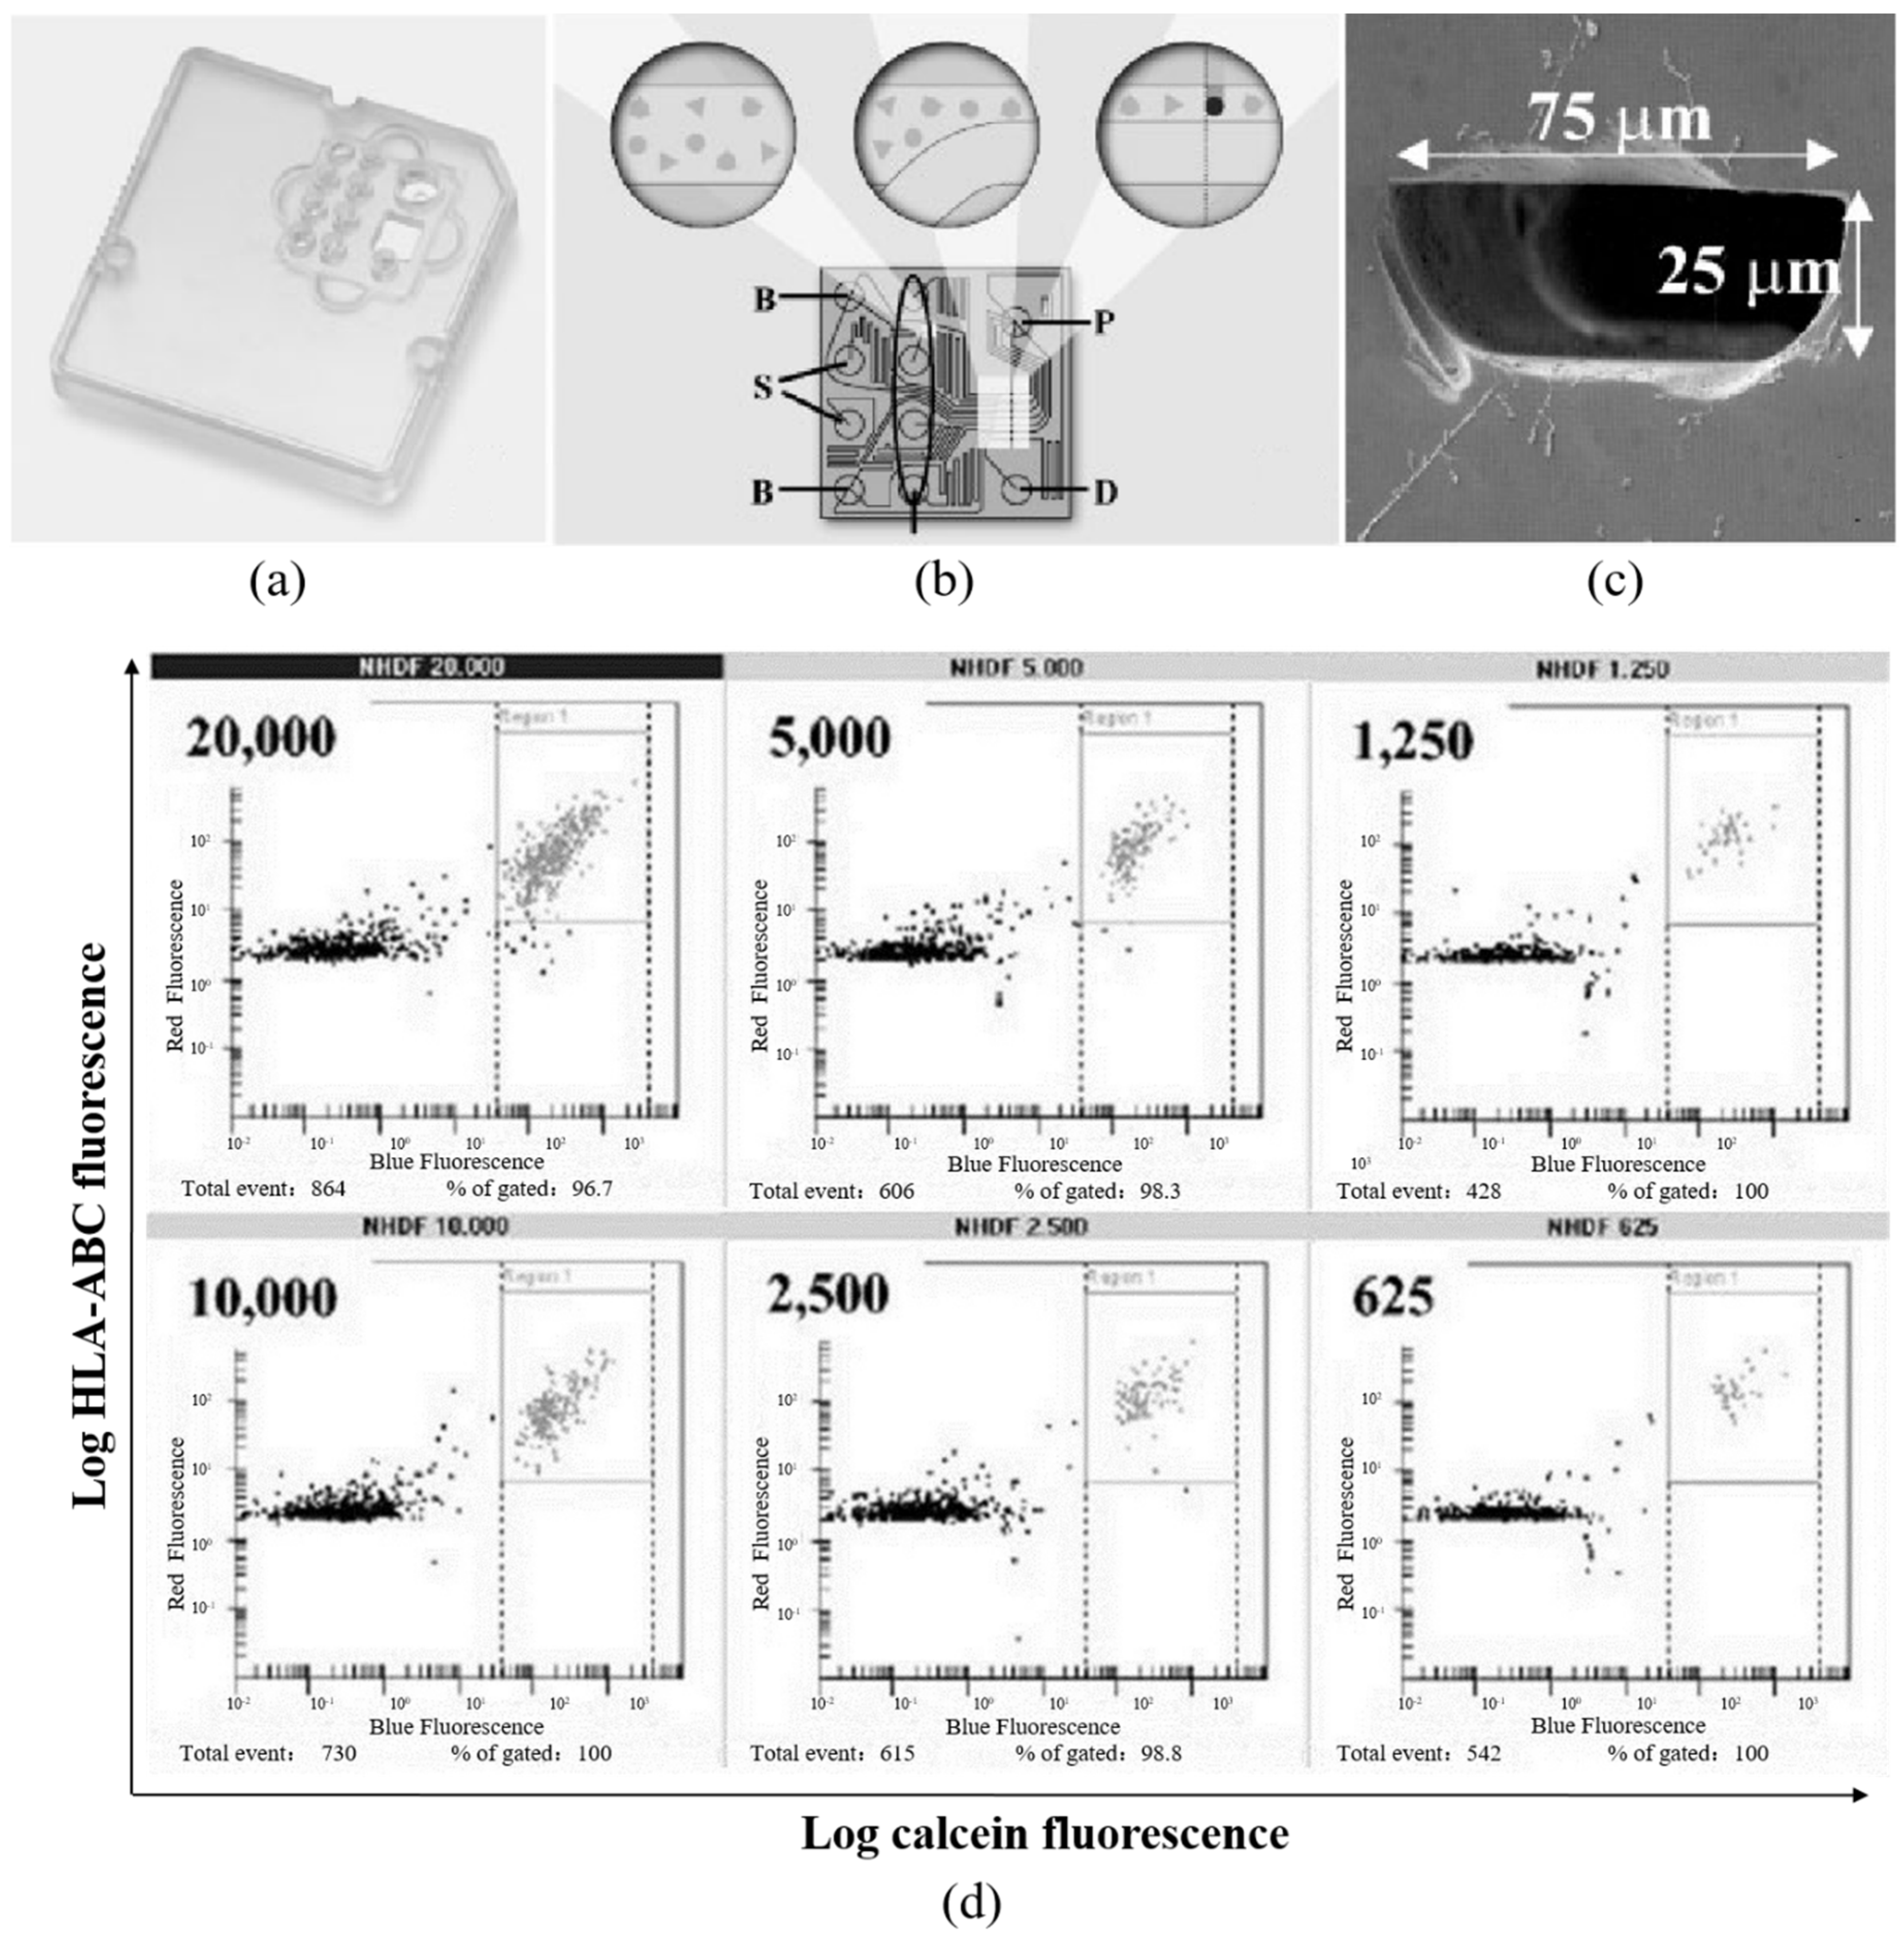
| Microfluidic Fluorescent Flow Cytometry | Characterization of small numbers of cells, ranging from 20,000 to 625 per sample | [45,46,47] |
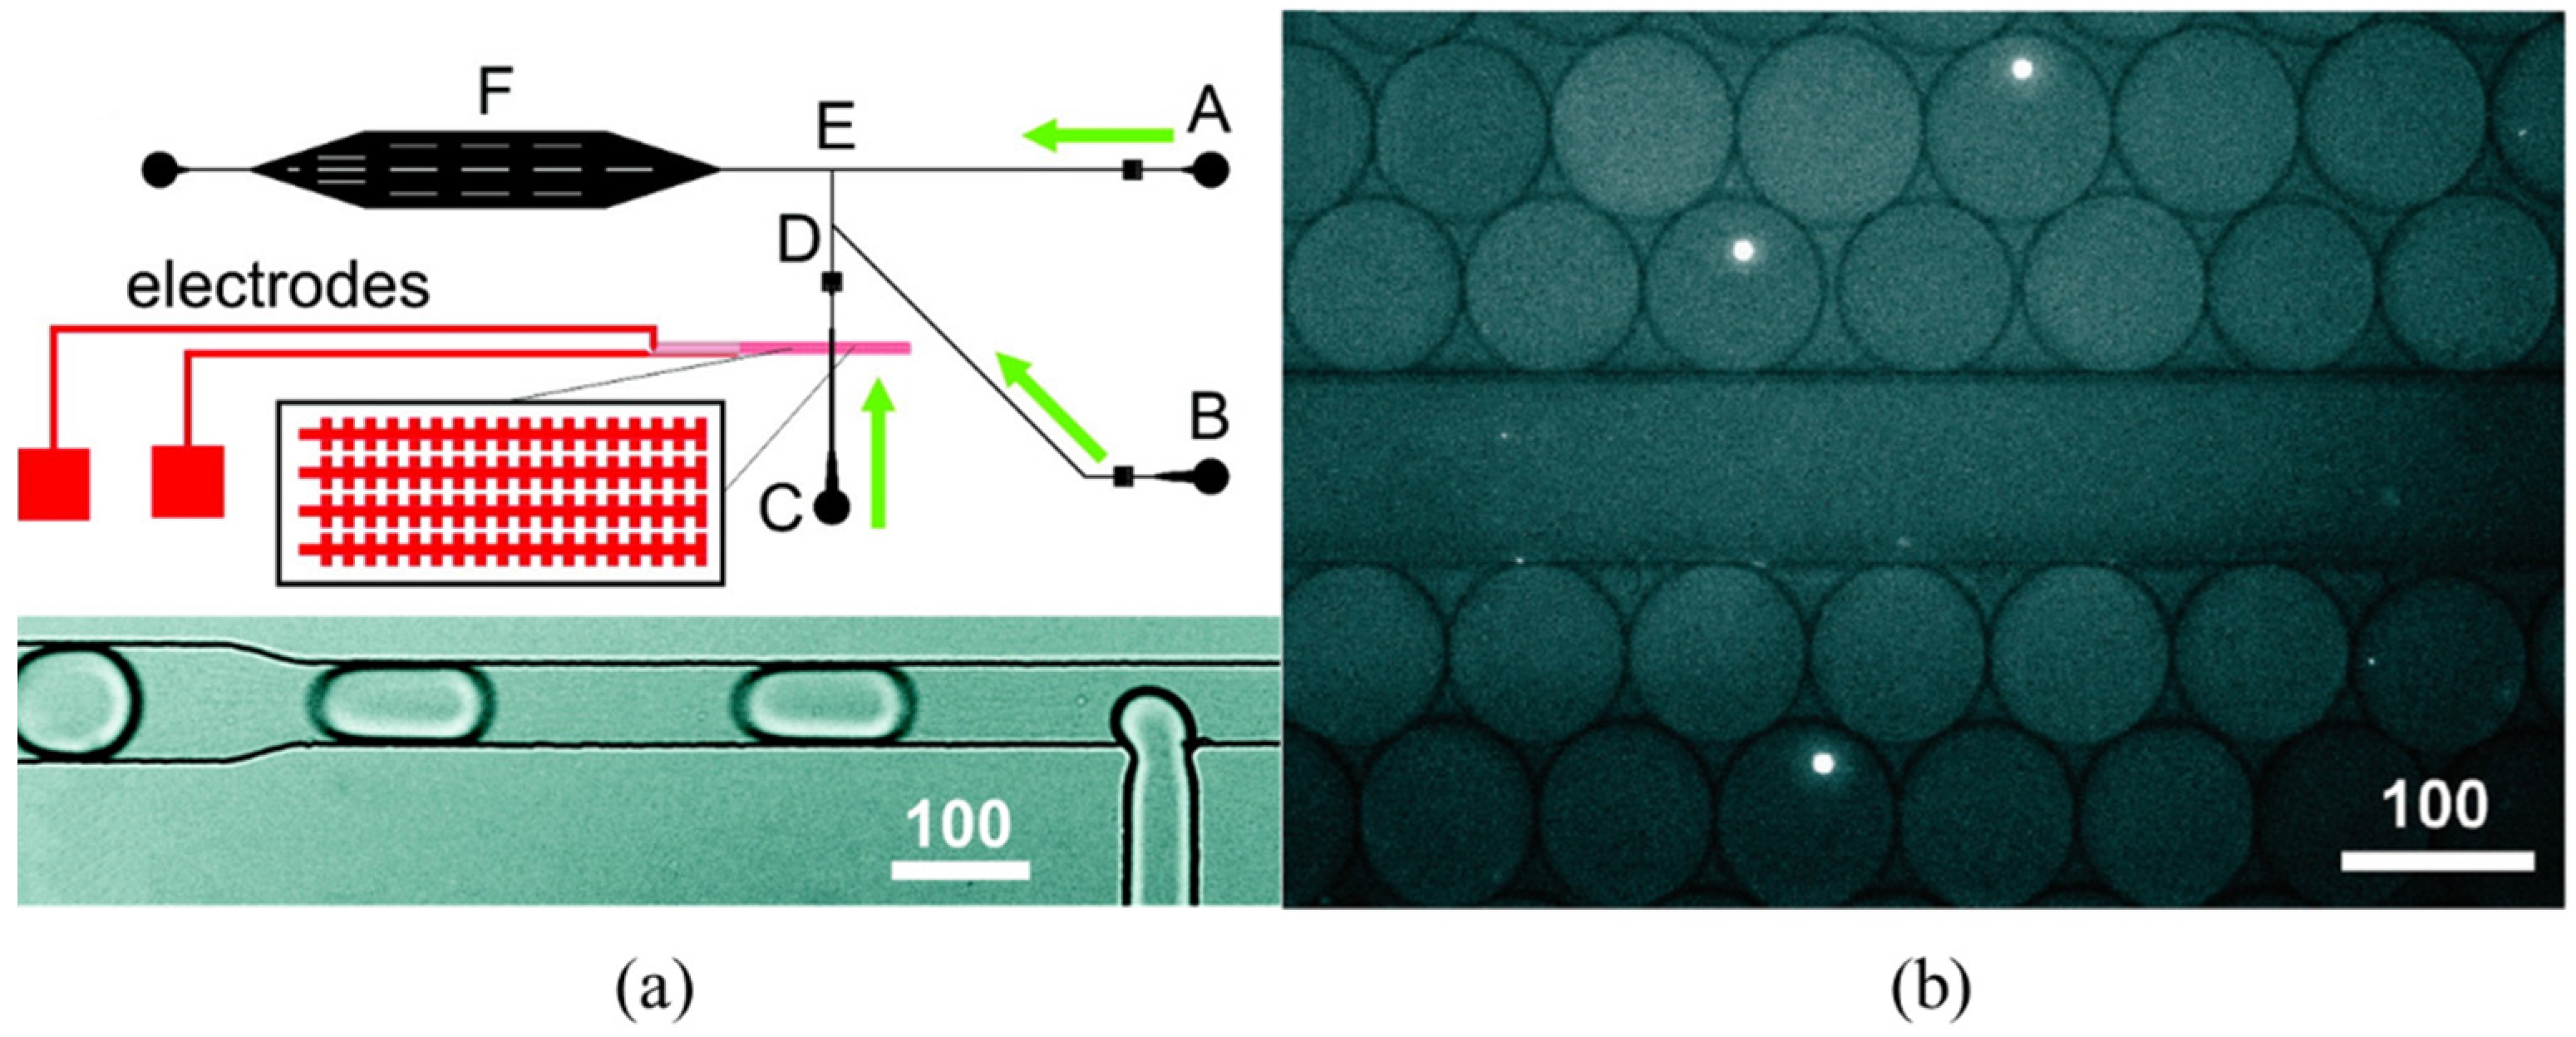
| Droplet Based Microfluidic Flow Cytometry | Detection of yellow fluorescent protein mutant “Venus” of single E. coli encapsulated in microdroplets | [48] |
| Droplet Based Microfluidic Flow Cytometry | Detection of the activities of enzyme alkaline phosphatase secreted by single E. coli encapsulated in microdroplets | [49] |
| Droplet Based Microfluidic Flow Cytometry | Detection of cytokine (IL-10) secretion of single CD4+ CD25+ regulatory T cells in microdroplets over time | [50] |
| Droplet Based Microfluidic Flow Cytometry | Detection of intracellular proteins of HRas-mCitrine, expressed within single HEK-293 cells and actin-EGFP expressed within single MCF-7 cells encapsulated in microdroplets | [51] |
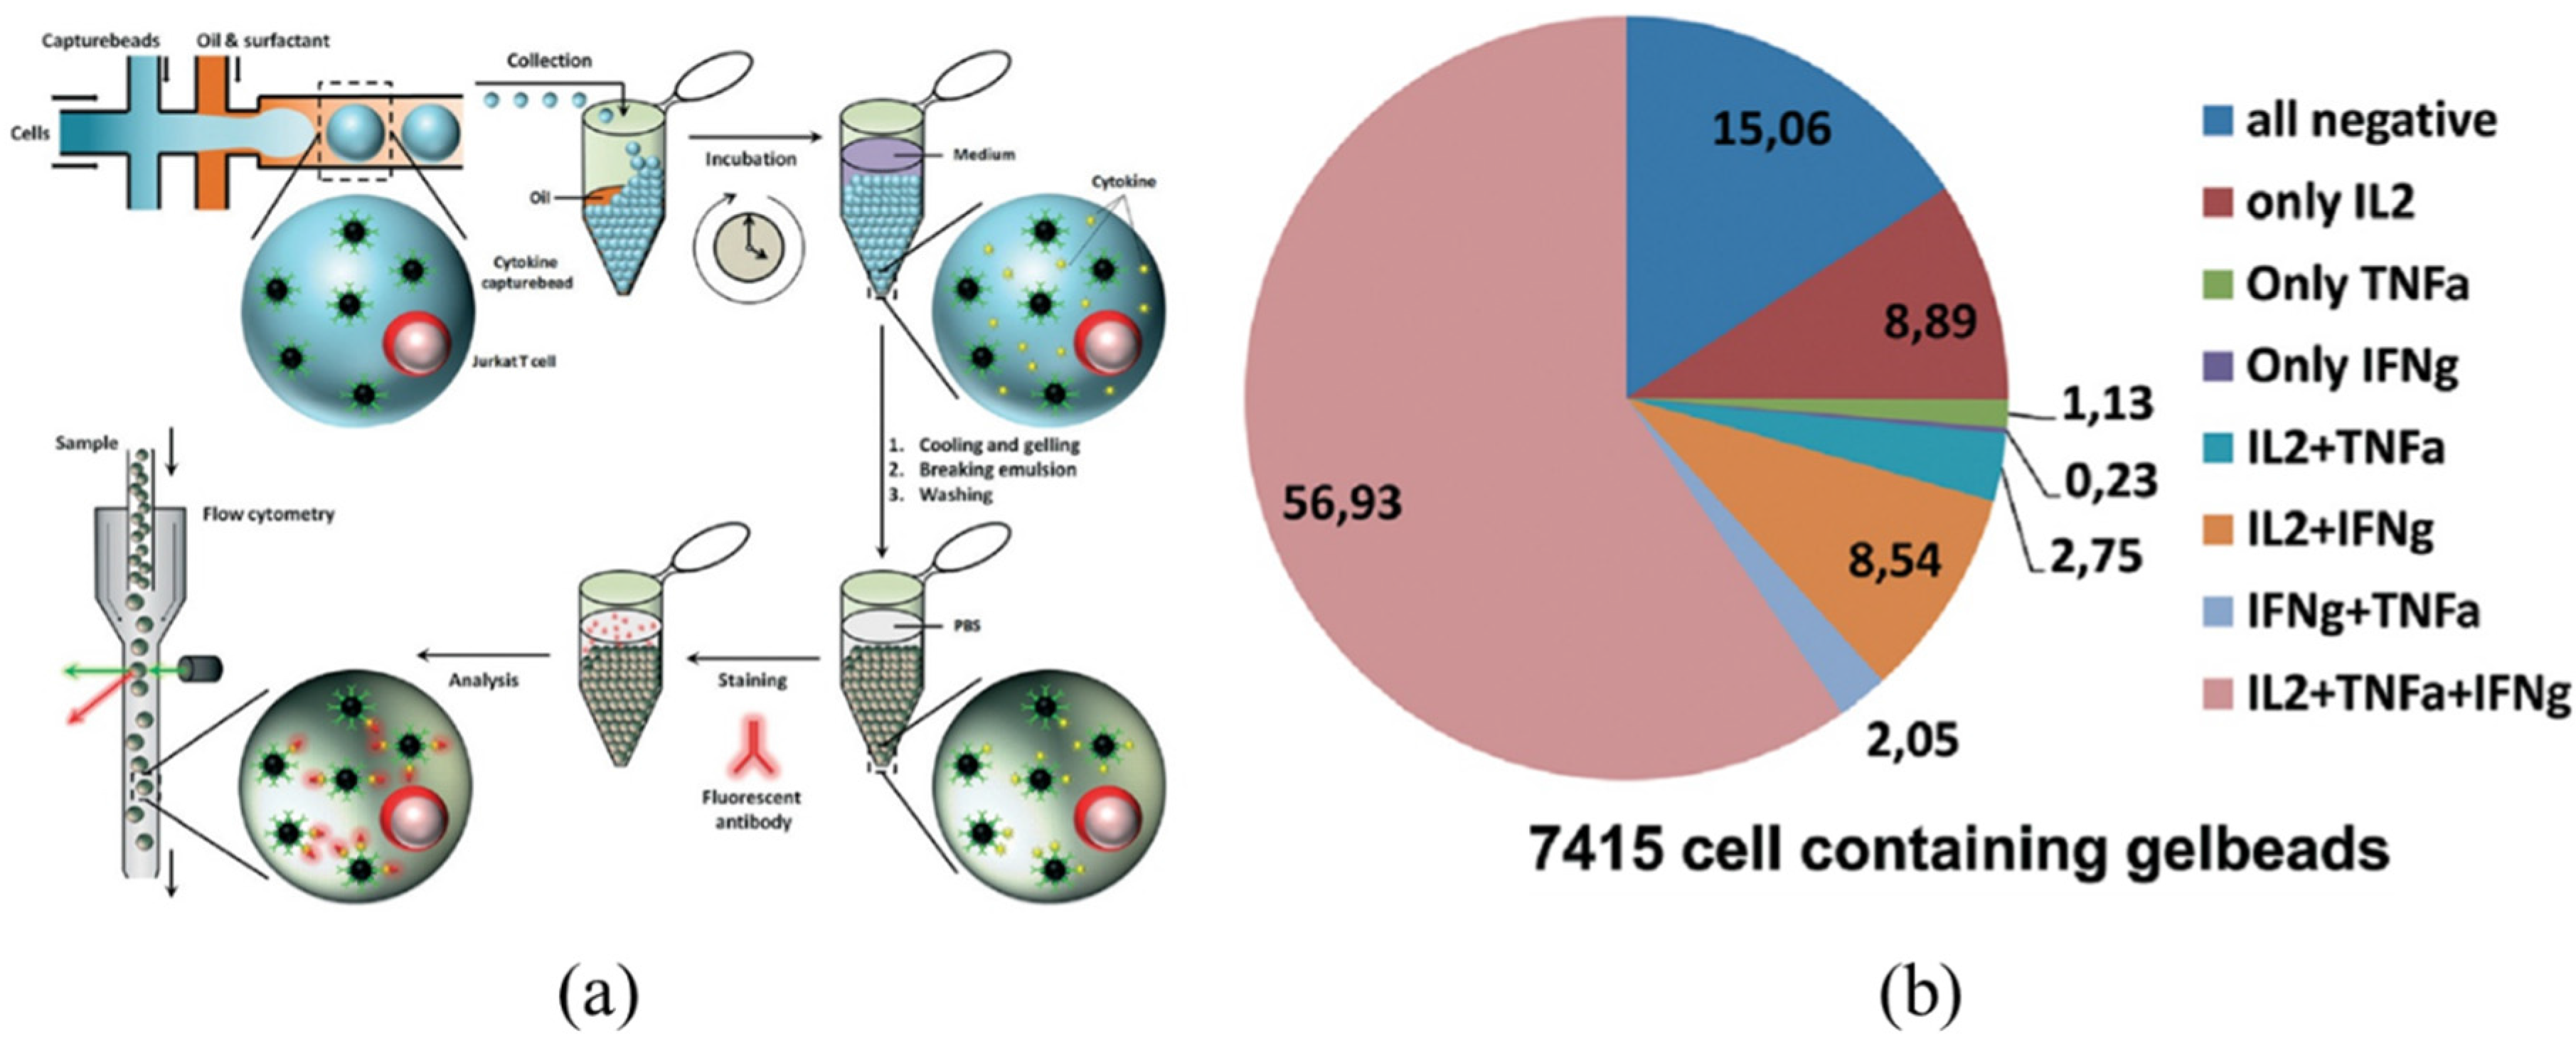
| Droplet Based Microfluidic Flow Cytometry | Detection of cytokine (IL-2, IFN-γ, TNF-α) secretion of single, activated T-cells in microdroplets over time | [52] |
| Large-Array Micro Wells (Microengraving) | Detection of secreted cytokines (IL-6, IL-17, IFN-γ, IL-2, and TNF-α) of primary T cells at the secretion rate from 0.5 to 4 molecules/s | [53] |
| Large-Array Micro Wells (Microengraving) | Detection of secreted cytokines (IFN-γ and IL-17) of individual CD4+ T cells with peptide-loaded MHC class II pre-coated on the surface of micro wells for on-chip activation | [54] |
| Large-Array Micro Wells (Microengraving) | ~200-fold improvement in the limits of detection of secreted cytokines using hybridization chain reactions | [55] |
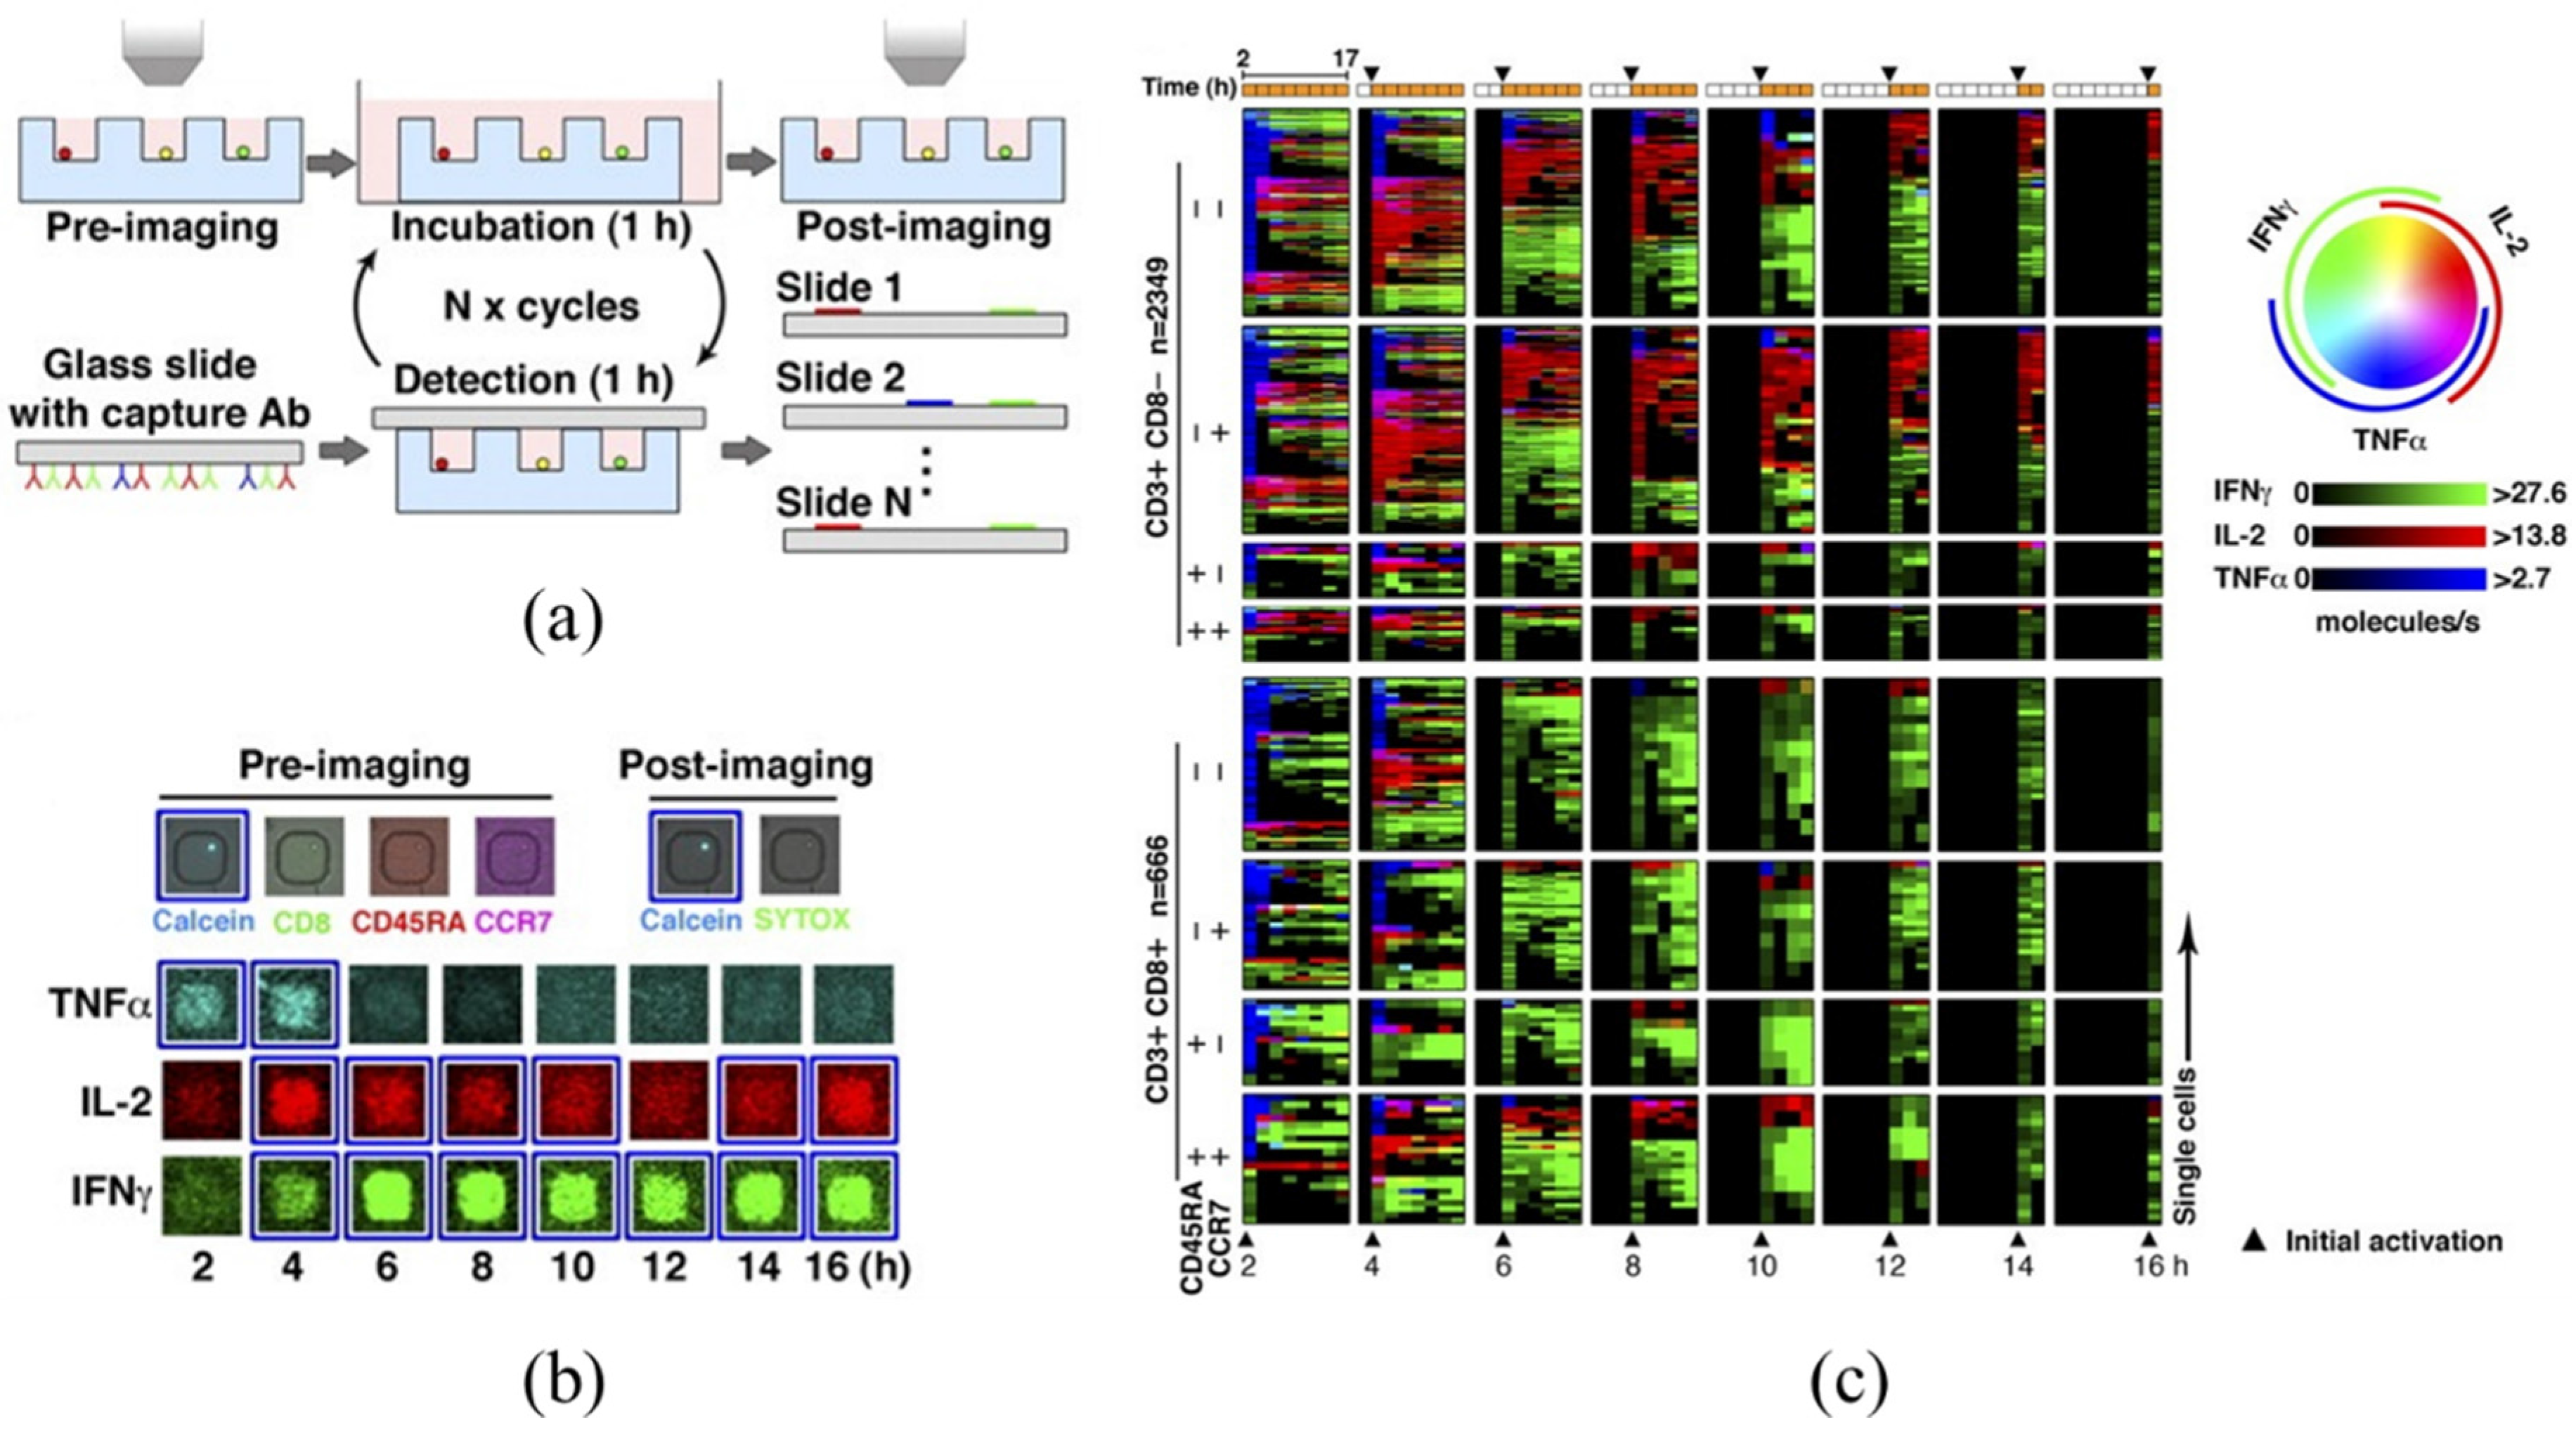
| Large-Array Micro Wells (Microengraving) | Detection of serial, time-dependent secreted cytokines (IFN-γ, IL-2, TNF-α) of primary human T cells, revealing that cells predominantly release one cytokine at a time rather than actively secret multiple cytokines simultaneously | [56] |
| Large-Array Micro Wells (Microengraving) | Detection of secreted chemokines (ELR + CXC) from single colorectal tumor and stromal cells with polyfunctional heterogeneity located | [57] |
| Large-Array Micro Chambers (Barcoding Microchips) | Detection of 12 proteins including TNF-α, IFN-γ, IL-2, IL-1α, IL-1β, IL-6, IL-10, IL-12, granulocyte-macrophage colony-stimulating factor, CCL-2, TGF-β and PSA of macrophages and cytotoxic T lymphocytes | [58] |
| Large-Array Micro Chambers (Barcoding Microchips) | Detection of 11 proteins directly or potentially associated with PI3K signaling of three isogenic cell lines representing the cancer glioblastoma multiforme, at the basal level, under EGF stimulation, and under erlotinib inhibition plus EGF stimulation | [59] |
| Large-Array Micro Chambers (Barcoding Microchips) | Detection of secreted proteins (IL-8 and VEGF) of circulating tumor cells | [60] |
2. Microfluidic Fluorescent Flow Cytometry
3. Droplet Based Microfluidic Flow Cytometry

4. Large-Array Microwells (Microengraving)
5. Large-Array Micro Chambers (Barcoding Microchips)
6. Discussions and Future Development
Acknowledgments
Author Contributions
Conflicts of Interest
References
- Borland, L.M.; Kottegoda, S.; Phillips, K.S.; Allbritton, N.L. Chemical analysis of single cells. Annu. Rev. Anal. Chem. 2008, 1, 191–227. [Google Scholar] [CrossRef] [PubMed]
- Heien, M.L.; Ewing, A.G. Quantitative chemical analysis of single cells. Methods Mol. Biol. 2009, 544, 153–162. [Google Scholar] [PubMed]
- Lin, Y.; Trouillon, R.L.; Safina, G.; Ewing, A.G. Chemical analysis of single cells. Anal. Chem. 2011, 83, 4369–4392. [Google Scholar] [CrossRef] [PubMed]
- Kurczy, M.E.; Ewing, A.G. Chemical analysis of single cells. Anal. Chem. 2012, 85, 522–542. [Google Scholar]
- Wu, M.; Singh, A.K. Single-cell protein analysis. Curr. Opin. Biotechnol. 2012, 23, 83–88. [Google Scholar] [CrossRef] [PubMed]
- Ma, C.; Fan, R.; Elitas, M. Single cell functional proteomics for assessing immune response in cancer therapy: Technology, methods, and applications. Front. Oncol. 2013, 3. [Google Scholar] [CrossRef] [PubMed]
- Krutzik, P.O.; Nolan, G.P. Intracellular phospho-protein staining techniques for flow cytometry: Monitoring single cell signaling events. Cytometry A 2003, 55, 61–70. [Google Scholar] [CrossRef] [PubMed]
- Perfetto, S.P.; Chattopadhyay, P.K.; Roederer, M. Seventeen-colour flow cytometry: Unravelling the immune system. Nat. Rev. Immunol. 2004, 4, 648–655. [Google Scholar] [CrossRef] [PubMed]
- Telford, W.G.; Hawley, T.; Subach, F.; Verkhusha, V.; Hawley, R.G. Flow cytometry of fluorescent proteins. Methods 2012, 57, 318–330. [Google Scholar] [CrossRef] [PubMed]
- Chattopadhyay, P.K.; Roederer, M. Cytometry: Today’s technology and tomorrow’s horizons. Methods 2012, 57, 251–258. [Google Scholar] [CrossRef] [PubMed]
- Maher, K.J.; Fletcher, M.A. Quantitative flow cytometry in the clinical laboratory. Clin. Appl. Immunol. Rev. 2005, 5, 353–372. [Google Scholar] [CrossRef]
- Marti, G.E.; Zenger, V.E.; Vogt, R.; Gaigalas, A. Quantitative flow cytometry: History, practice, theory, consensus, inter-laboratory variation and present status. Cytotherapy 2002, 4, 97–98. [Google Scholar] [CrossRef] [PubMed]
- Schwartz, A.; Fernandez-Repollet, E. Quantitative flow cytometry. Clin. Lab. Med. 2001, 21, 743–761. [Google Scholar] [PubMed]
- Zenger, V.E.; Vogt, R.; Mandy, F.; Schwartz, A.; Marti, G.E. Quantitative flow cytometry: Inter-laboratory variation. Cytometry 1998, 33, 138–145. [Google Scholar] [CrossRef]
- Serke, S.; van Lessen, A.; Huhn, D. Quantitative fluorescence flow cytometry: A comparison of the three techniques for direct and indirect immunofluorescence. Cytometry 1998, 33, 179–187. [Google Scholar] [CrossRef]
- Wootton, R.C.; Demello, A.J. Microfluidics: Exploiting elephants in the room. Nature 2010, 464, 839–840. [Google Scholar] [CrossRef] [PubMed]
- Whitesides, G.M. The origins and the future of microfluidics. Nature 2006, 442, 368–373. [Google Scholar] [CrossRef] [PubMed]
- Squires, T.M.; Quake, S.R. Microfluidics: Fluid physics at the nanoliter scale. Rev. Mod. Phys. 2005, 77, 977–1026. [Google Scholar] [CrossRef]
- Sackmann, E.K.; Fulton, A.L.; Beebe, D.J. The present and future role of microfluidics in biomedical research. Nature 2014, 507, 181–189. [Google Scholar] [CrossRef] [PubMed]
- El-Ali, J.; Sorger, P.K.; Jensen, K.F. Cells on chips. Nature 2006, 442, 403–411. [Google Scholar] [CrossRef] [PubMed]
- Xiong, B.; Ren, K.; Shu, Y.; Chen, Y.; Shen, B.; Wu, H. Recent developments in microfluidics for cell studies. Adv. Mater. 2014, 26, 5525–5532. [Google Scholar] [CrossRef] [PubMed]
- Zhang, C.; van Noort, D. Cells in microfluidics. Top. Curr. Chem. 2011, 304, 295–321. [Google Scholar] [PubMed]
- Young, E.W.; Beebe, D.J. Fundamentals of microfluidic cell culture in controlled microenvironments. Chem. Soc. Rev. 2010, 39, 1036–1048. [Google Scholar] [CrossRef] [PubMed]
- Thompson, A.M.; Paguirigan, A.L.; Kreutz, J.E.; Radich, J.P.; Chiu, D.T. Microfluidics for single-cell genetic analysis. Lab Chip 2014, 14, 3135–3142. [Google Scholar] [CrossRef] [PubMed]
- Swami, M. Technology: Dropping in on single-cell epigenetic profiles. Nat. Rev. Genet. 2015, 16, 684–685. [Google Scholar] [CrossRef] [PubMed]
- Yu, J.; Zhou, J.; Sutherland, A.; Wei, W.; Shin, Y.S.; Xue, M.; Heath, J.R. Microfluidics-based single-cell functional proteomics for fundamental and applied biomedical applications. Annu. Rev. Anal. Chem. 2014, 7, 275–295. [Google Scholar] [CrossRef] [PubMed]
- Junkin, M.; Tay, S. Microfluidic single-cell analysis for systems immunology. Lab Chip 2014, 14, 1246–1260. [Google Scholar] [CrossRef] [PubMed]
- Chattopadhyay, P.K.; Gierahn, T.M.; Roederer, M.; Love, J.C. Single-cell technologies for monitoring immune systems. Nat. Immunol. 2014, 15, 128–135. [Google Scholar] [CrossRef] [PubMed]
- Wei, W.; Shin, Y.S.; Ma, C.; Wang, J.; Elitas, M.; Fan, R.; Heath, J.R. Microchip platforms for multiplex single-cell functional proteomics with applications to immunology and cancer research. Genome Med. 2013, 5. [Google Scholar] [CrossRef] [PubMed]
- Liu, Y.; Singh, A.K. Microfluidic platforms for single-cell protein analysis. J. Lab. Autom. 2013, 18, 446–454. [Google Scholar] [CrossRef] [PubMed]
- Chen, W.; Huang, N.T.; Li, X.; Yu, Z.T.; Kurabayashi, K.; Fu, J. Emerging microfluidic tools for functional cellular immunophenotyping: A new potential paradigm for immune status characterization. Front. Oncol. 2013, 3. [Google Scholar] [CrossRef] [PubMed]
- Xue, C.; Wang, J.; Zhao, Y.; Chen, D.; Yue, W.; Chen, J. Constriction channel based single-cell mechanical property characterization. Micromachines 2015, 6, 1794–1804. [Google Scholar] [CrossRef]
- Zheng, Y.; Nguyen, J.; Wei, Y.; Sun, Y. Recent advances in microfluidic techniques for single-cell biophysical characterization. Lab Chip 2013, 13, 2464–2483. [Google Scholar] [CrossRef] [PubMed]
- Polacheck, W.J.; Li, R.; Uzel, S.G.M.; Kamm, R.D. Microfluidic platforms for mechanobiology. Lab Chip 2013, 13, 2252–2267. [Google Scholar] [CrossRef] [PubMed]
- Mao, X.; Huang, T.J. Exploiting mechanical biomarkers in microfluidics. Lab Chip 2012, 12, 4006–4009. [Google Scholar] [CrossRef] [PubMed]
- Zheng, Y.; Sun, Y. Microfluidic devices for mechanical characterisation of single cells in suspension. Micro Nano Lett. 2011, 6, 327–331. [Google Scholar] [CrossRef]
- Chen, J.; Xue, C.; Zhao, Y.; Chen, D.; Wu, M.H.; Wang, J. Microfluidic impedance flow cytometry enabling high-throughput single-cell electrical property characterization. Int. J. Mol. Sci. 2015, 16, 9804–9830. [Google Scholar] [CrossRef] [PubMed]
- Valero, A.; Braschler, T.; Renaud, P. A unified approach to dielectric single cell analysis: Impedance and dielectrophoretic force spectroscopy. Lab Chip 2010, 10, 2216–2225. [Google Scholar] [CrossRef] [PubMed]
- Sun, T.; Morgan, H. Single-cell microfluidic impedance cytometry: A review. Microfluid. Nanofluid. 2010, 8, 423–443. [Google Scholar] [CrossRef]
- Weaver, W.M.; Tseng, P.; Kunze, A.; Masaeli, M.; Chung, A.J.; Dudani, J.S.; Kittur, H.; Kulkarni, R.P.; Di Carlo, D. Advances in high-throughput single-cell microtechnologies. Curr. Opin. Biotechnol. 2014, 25, 114–123. [Google Scholar] [CrossRef] [PubMed]
- Yin, H.; Marshall, D. Microfluidics for single cell analysis. Curr. Opin. Biotechnol. 2012, 23, 110–119. [Google Scholar] [CrossRef] [PubMed]
- Lecault, V.; White, A.K.; Singhal, A.; Hansen, C.L. Microfluidic single cell analysis: From promise to practice. Curr. Opin. Chem. Biol. 2012, 16, 381–390. [Google Scholar] [CrossRef] [PubMed]
- Zare, R.N.; Kim, S. Microfluidic platforms for single-cell analysis. Annu. Rev. Biomed. Eng. 2010, 12, 187–201. [Google Scholar] [CrossRef] [PubMed]
- Sims, C.E.; Allbritton, N.L. Analysis of single mammalian cells on-chip. Lab Chip 2007, 7, 423–440. [Google Scholar] [CrossRef] [PubMed]
- Preckel, T.; Luedke, G.; Chan, S.D.H.; Wang, B.N.; Dubrow, R.; Buhlmann, C. Detection of cellular parameters using a microfluidic chip-based system. J. Assoc. Lab. Autom. 2002, 7, 85–89. [Google Scholar] [CrossRef]
- Buhlmann, C.; Preckel, T.; Chan, S.; Luedke, G.; Valer, M. A new tool for routine testing of cellular protein expression: Integration of cell staining and analysis of protein expression on a microfluidic chip-based system. J. Biomol. Tech. 2003, 14, 119–127. [Google Scholar] [PubMed]
- Chan, S.D.; Luedke, G.; Valer, M.; Buhlmann, C.; Preckel, T. Cytometric analysis of protein expression and apoptosis in human primary cells with a novel microfluidic chip-based system. Cytometry A 2003, 55, 119–125. [Google Scholar] [CrossRef] [PubMed]
- Huebner, A.; Srisa-Art, M.; Holt, D.; Abell, C.; Hollfelder, F.; deMello, A.J.; Edel, J.B. Quantitative detection of protein expression in single cells using droplet microfluidics. Chem. Commun. 2007, 12, 1218–1220. [Google Scholar] [CrossRef] [PubMed]
- Huebner, A.; Olguin, L.F.; Bratton, D.; Whyte, G.; Huck, W.T.; de Mello, A.J.; Edel, J.B.; Abell, C.; Hollfelder, F. Development of quantitative cell-based enzyme assays in microdroplets. Anal. Chem. 2008, 80, 3890–3896. [Google Scholar] [CrossRef] [PubMed]
- Konry, T.; Dominguez-Villar, M.; Baecher-Allan, C.; Hafler, D.A.; Yarmush, M.L. Droplet-based microfluidic platforms for single T cell secretion analysis of IL-10 cytokine. Biosens. Bioelectron. 2011, 26, 2707–2710. [Google Scholar] [CrossRef] [PubMed]
- Martino, C.; Zagnoni, M.; Sandison, M.E.; Chanasakulniyom, M.; Pitt, A.R.; Cooper, J.M. Intracellular protein determination using droplet-based immunoassays. Anal. Chem. 2011, 83, 5361–5368. [Google Scholar] [CrossRef] [PubMed]
- Chokkalingam, V.; Tel, J.; Wimmers, F.; Liu, X.; Semenov, S.; Thiele, J.; Figdor, C.G.; Huck, W.T. Probing cellular heterogeneity in cytokine-secreting immune cells using droplet-based microfluidics. Lab Chip 2013, 13, 4740–4744. [Google Scholar] [CrossRef] [PubMed]
- Han, Q.; Bradshaw, E.M.; Nilsson, B.; Hafler, D.A.; Love, J.C. Multidimensional analysis of the frequencies and rates of cytokine secretion from single cells by quantitative microengraving. Lab Chip 2010, 10, 1391–1400. [Google Scholar] [CrossRef] [PubMed]
- Song, Q.; Han, Q.; Bradshaw, E.M.; Kent, S.C.; Raddassi, K.; Nilsson, B.; Nepom, G.T.; Hafler, D.A.; Love, J.C. On-chip activation and subsequent detection of individual antigen-specific T cells. Anal. Chem. 2010, 82, 473–477. [Google Scholar] [CrossRef] [PubMed]
- Choi, J.; Love, K.R.; Gong, Y.; Gierahn, T.M.; Love, J.C. Immuno-hybridization chain reaction for enhancing detection of individual cytokine-secreting human peripheral mononuclear cells. Anal. Chem. 2011, 83, 6890–6895. [Google Scholar] [CrossRef] [PubMed]
- Han, Q.; Bagheri, N.; Bradshaw, E.M.; Hafler, D.A.; Lauffenburger, D.A.; Love, J.C. Polyfunctional responses by human T cells result from sequential release of cytokines. Proc. Natl. Acad. Sci. USA 2012, 109, 1607–1612. [Google Scholar] [CrossRef] [PubMed]
- Adalsteinsson, V.A.; Tahirova, N.; Tallapragada, N.; Yao, X.; Campion, L.; Angelini, A.; Douce, T.B.; Huang, C.; Bowman, B.; Williamson, C.A.; et al. Single cells from human primary colorectal tumors exhibit polyfunctional heterogeneity in secretions of ELR+ CXC chemokines. Integr. Biol. 2013, 5, 1272–1281. [Google Scholar] [CrossRef] [PubMed]
- Ma, C.; Fan, R.; Ahmad, H.; Shi, Q.; Comin-Anduix, B.; Chodon, T.; Koya, R.C.; Liu, C.C.; Kwong, G.A.; Radu, C.G.; et al. A clinical microchip for evaluation of single immune cells reveals high functional heterogeneity in phenotypically similar T cells. Nat. Med. 2011, 17, 738–743. [Google Scholar] [CrossRef] [PubMed]
- Shi, Q.; Qin, L.; Wei, W.; Geng, F.; Fan, R.; Shin, Y.S.; Guo, D.; Hood, L.; Mischel, P.S.; Heath, J.R. Single-cell proteomic chip for profiling intracellular signaling pathways in single tumor cells. Proc. Natl. Acad. Sci. USA 2012, 109, 419–424. [Google Scholar] [CrossRef] [PubMed]
- Deng, Y.; Zhang, Y.; Sun, S.; Wang, Z.; Wang, M.; Yu, B.; Czajkowsky, D.M.; Liu, B.; Li, Y.; Wei, W.; et al. An integrated microfluidic chip system for single-cell secretion profiling of rare circulating tumor cells. Sci. Rep. 2014, 4. [Google Scholar] [CrossRef] [PubMed]
- Ateya, D.A.; Erickson, J.S.; Howell, P.B.; Hilliard, L.R.; Golden, J.P.; Ligler, F.S. The good, the bad, and the tiny: A review of microflow cytometry. Anal. Bioanal. Chem. 2008, 391, 1485–1498. [Google Scholar] [CrossRef] [PubMed]
- Chung, T.D.; Kim, H.C. Recent advances in miniaturized microfluidic flow cytometry for clinical use. Electrophoresis 2007, 28, 4511–4520. [Google Scholar] [CrossRef] [PubMed]
- Huh, D.; Gu, W.; Kamotani, Y.; Grotberg, J.B.; Takayama, S. Microfluidics for flow cytometric analysis of cells and particles. Physiol. Meas. 2005, 26, R73–R98. [Google Scholar] [CrossRef] [PubMed]
- Piyasena, M.E.; Graves, S.W. The intersection of flow cytometry with microfluidics and microfabrication. Lab Chip 2014, 14, 1044–1059. [Google Scholar] [CrossRef] [PubMed]
- Teh, S.Y.; Lin, R.; Hung, L.H.; Lee, A.P. Droplet microfluidics. Lab Chip 2008, 8, 198–220. [Google Scholar] [CrossRef] [PubMed]
- Basova, E.Y.; Foret, F. Droplet microfluidics in (bio)chemical analysis. Analyst 2015, 140, 22–38. [Google Scholar] [CrossRef] [PubMed]
- Leman, M.; Abouakil, F.; Griffiths, A.D.; Tabeling, P. Droplet-based microfluidics at the femtolitre scale. Lab Chip 2015, 15, 753–765. [Google Scholar] [CrossRef] [PubMed]
- Clausell-Tormos, J.; Lieber, D.; Baret, J.C.; El-Harrak, A.; Miller, O.J.; Frenz, L.; Blouwolff, J.; Humphry, K.J.; Koster, S.; Duan, H.; et al. Droplet-based microfluidic platforms for the encapsulation and screening of mammalian cells and multicellular organisms. Chem. Biol. 2008, 15, 427–437. [Google Scholar] [CrossRef] [PubMed]
- Baret, J.C.; Miller, O.J.; Taly, V.; Ryckelynck, M.; El-Harrak, A.; Frenz, L.; Rick, C.; Samuels, M.L.; Hutchison, J.B.; Agresti, J.J.; et al. Fluorescence-activated droplet sorting (FADS): Efficient microfluidic cell sorting based on enzymatic activity. Lab Chip 2009, 9, 1850–1858. [Google Scholar] [CrossRef] [PubMed]
- Brouzes, E.; Medkova, M.; Savenelli, N.; Marran, D.; Twardowski, M.; Hutchison, J.B.; Rothberg, J.M.; Link, D.R.; Perrimon, N.; Samuels, M.L. Droplet microfluidic technology for single-cell high-throughput screening. Proc. Natl. Acad. Sci. USA 2009, 106, 14195–14200. [Google Scholar] [CrossRef] [PubMed]
- Srisa-Art, M.; Bonzani, I.C.; Williams, A.; Stevens, M.M.; deMello, A.J.; Edel, J.B. Identification of rare progenitor cells from human periosteal tissue using droplet microfluidics. Analyst 2009, 134, 2239–2245. [Google Scholar] [CrossRef] [PubMed]
- Marcoux, P.R.; Dupoy, M.; Mathey, R.; Novelli-Rousseau, A.; Heran, V.; Morales, S.; Rivera, F.; Joly, P.L.; Moy, J.-P.; Mallard, F. Micro-confinement of bacteria into w/o emulsion droplets for rapid detection and enumeration. Colloids Surf. A 2011, 377, 54–62. [Google Scholar] [CrossRef] [Green Version]
- Mazutis, L.; Gilbert, J.; Ung, W.L.; Weitz, D.A.; Griffiths, A.D.; Heyman, J.A. Single-cell analysis and sorting using droplet-based microfluidics. Nat. Protoc. 2013, 8, 870–891. [Google Scholar] [CrossRef] [PubMed]
- Wang, B.L.; Ghaderi, A.; Zhou, H.; Agresti, J.; Weitz, D.A.; Fink, G.R.; Stephanopoulos, G. Microfluidic high-throughput culturing of single cells for selection based on extracellular metabolite production or consumption. Nat. Biotechnol. 2014, 32, 473–478. [Google Scholar] [CrossRef] [PubMed]
- Ramji, R.; Wang, M.; Bhagat, A.A.S.; Weng, D.T.S.; Thakor, N.V.; Lim, C.K.; Chen, C.H. Single cell kinase signaling assay using pinched flow coupled droplet microfluidics. Biomicrofluidics 2014, 8. [Google Scholar] [CrossRef] [PubMed]
- Bradshaw, E.M.; Kent, S.C.; Tripuraneni, V.; Orban, T.; Ploegh, H.L.; Hafler, D.A.; Love, J.C. Concurrent detection of secreted products from human lymphocytes by microengraving: Cytokines and antigen-reactive antibodies. Clin. Immunol. 2008, 129, 10–18. [Google Scholar] [CrossRef] [PubMed]
- Panagiotou, V.; Love, K.R.; Jiang, B.; Nett, J.; Stadheim, T.; Love, J.C. Generation and screening of pichia pastoris strains with enhanced protein production by use of microengraving. Appl. Environ. Microbiol. 2011, 77, 3154–3156. [Google Scholar] [CrossRef] [PubMed]
- Varadarajan, N.; Julg, B.; Yamanaka, Y.J.; Chen, H.; Ogunniyi, A.O.; McAndrew, E.; Porter, L.C.; Piechocka-Trocha, A.; Hill, B.J.; Douek, D.C.; et al. A high-throughput single-cell analysis of human CD8(+) T cell functions reveals discordance for cytokine secretion and cytolysis. J. Clin. Investig. 2011, 121, 4322–4331. [Google Scholar] [CrossRef] [PubMed]
- Varadarajan, N.; Kwon, D.S.; Law, K.M.; Ogunniyi, A.O.; Anahtar, M.N.; Richter, J.M.; Walker, B.D.; Love, J.C. Rapid, efficient functional characterization and recovery of hiv-specific human CD8+ T cells using microengraving. Proc. Natl. Acad. Sci. USA 2012, 109, 3885–3890. [Google Scholar] [CrossRef] [PubMed]
- Yamanaka, Y.J.; Szeto, G.L.; Gierahn, T.M.; Forcier, T.L.; Benedict, K.F.; Brefo, M.S.; Lauffenburger, D.A.; Irvine, D.J.; Love, J.C. Cellular barcodes for efficiently profiling single-cell secretory responses by microengraving. Anal. Chem. 2012, 84, 10531–10536. [Google Scholar] [CrossRef] [PubMed]
- Nguyen, C.Q.; Ogunniyi, A.O.; Karabiyik, A.; Love, J.C. Single-cell analysis reveals isotype-specific autoreactive B cell repertoires in sjogren’s syndrome. PLoS ONE 2013, 8. [Google Scholar] [CrossRef]
- Torres, A.J.; Contento, R.L.; Gordo, S.; Wucherpfennig, K.W.; Love, J.C. Functional single-cell analysis of T-cell activation by supported lipid bilayer-tethered ligands on arrays of nanowells. Lab Chip 2013, 13, 90–99. [Google Scholar] [CrossRef] [PubMed]
- Fan, R.; Vermesh, O.; Srivastava, A.; Yen, B.K.; Qin, L.; Ahmad, H.; Kwong, G.A.; Liu, C.C.; Gould, J.; Hood, L.; et al. Integrated barcode chips for rapid, multiplexed analysis of proteins in microliter quantities of blood. Nat. Biotechnol. 2008, 26, 1373–1378. [Google Scholar] [CrossRef] [PubMed]
- Shin, Y.S.; Ahmad, H.; Shi, Q.; Kim, H.; Pascal, T.A.; Fan, R.; Goddard, W.A., 3rd; Heath, J.R. Chemistries for patterning robust DNA microbarcodes enable multiplex assays of cytoplasm proteins from single cancer cells. Chemphyschem 2010, 11, 3063–3069. [Google Scholar] [CrossRef] [PubMed]
- Ahmad, H.; Sutherland, A.; Shin, Y.S.; Hwang, K.; Qin, L.; Krom, R.-J.; Heath, J.R. A robotics platform for automated batch fabrication of high density, microfluidics-based DNA microarrays, with applications to single cell, multiplex assays of secreted proteins. Rev. Sci. Instrum. 2011, 82. [Google Scholar] [CrossRef] [PubMed]
- Shin, Y.S.; Remacle, F.; Fan, R.; Hwang, K.; Wei, W.; Ahmad, H.; Levine, R.D.; Heath, J.R. Protein signaling networks from single cell fluctuations and information theory profiling. Biophys. J. 2011, 100, 2378–2386. [Google Scholar] [CrossRef] [PubMed]
- Vermesh, U.; Vermesh, O.; Wang, J.; Kwong, G.A.; Ma, C.; Hwang, K.; Heath, J.R. High-density, multiplexed patterning of cells at single-cell resolution for tissue engineering and other applications. Angew. Chem. 2011, 123, 7516–7518. [Google Scholar] [CrossRef]
- Wang, J.; Tham, D.; Wei, W.; Shin, Y.S.; Ma, C.; Ahmad, H.; Shi, Q.; Yu, J.; Levine, R.D.; Heath, J.R. Quantitating cell-cell interaction functions with applications to glioblastoma multiforme cancer cells. Nano Lett. 2012, 12, 6101–6106. [Google Scholar] [CrossRef] [PubMed]
- Kwak, M.; Mu, L.; Lu, Y.; Chen, J.J.; Wu, Y.; Brower, K.; Fan, R. Single-cell protein secretomic signatures as potential correlates to tumor cell lineage evolution and cell-cell interaction. Front. Oncol. 2013, 3. [Google Scholar] [CrossRef]
- Lu, Y.; Chen, J.J.; Mu, L.; Xue, Q.; Wu, Y.; Wu, P.H.; Li, J.; Vortmeyer, A.O.; Miller-Jensen, K.; Wirtz, D.; et al. High-throughput secretomic analysis of single cells to assess functional cellular heterogeneity. Anal. Chem. 2013, 85, 2548–2556. [Google Scholar] [CrossRef] [PubMed]
- Ma, C.; Cheung, A.F.; Chodon, T.; Koya, R.C.; Wu, Z.; Ng, C.; Avramis, E.; Cochran, A.J.; Witte, O.N.; Baltimore, D.; et al. Multifunctional T-cell analyses to study response and progression in adoptive cell transfer immunotherapy. Cancer Discov. 2013, 3, 418–429. [Google Scholar] [CrossRef] [PubMed]
- Wei, W.; Shi, Q.; Remacle, F.; Qin, L.; Shackelford, D.B.; Shin, Y.S.; Mischel, P.S.; Levine, R.D.; Heath, J.R. Hypoxia induces a phase transition within a kinase signaling network in cancer cells. Proc. Natl. Acad. Sci. USA 2013, 110, E1352–E1360. [Google Scholar] [CrossRef] [PubMed]
- Elitas, M.; Brower, K.; Lu, Y.; Chen, J.J.; Fan, R. A microchip platform for interrogating tumor-macrophage paracrine signaling at the single-cell level. Lab Chip 2014, 14, 3582–3588. [Google Scholar] [CrossRef] [PubMed]
- Lu, Y.; Xue, Q.; Eisele, M.R.; Sulistijo, E.S.; Brower, K.; Han, L.; Amir el, A.D.; Pe’er, D.; Miller-Jensen, K.; Fan, R. Highly multiplexed profiling of single-cell effector functions reveals deep functional heterogeneity in response to pathogenic ligands. Proc. Natl. Acad. Sci. USA 2015, 112, E607–615. [Google Scholar] [CrossRef] [PubMed]
- Zhang, Y.; Tang, Y.; Sun, S.; Wang, Z.; Wu, W.; Zhao, X.; Czajkowsky, D.M.; Li, Y.; Tian, J.; Xu, L.; et al. Single-cell codetection of metabolic activity, intracellular functional proteins, and genetic mutations from rare circulating tumor cells. Anal. Chem. 2015, 87, 9761–9768. [Google Scholar] [CrossRef] [PubMed]
© 2016 by the authors; licensee MDPI, Basel, Switzerland. This article is an open access article distributed under the terms and conditions of the Creative Commons by Attribution (CC-BY) license (http://creativecommons.org/licenses/by/4.0/).
Share and Cite
Fan, B.; Li, X.; Chen, D.; Peng, H.; Wang, J.; Chen, J. Development of Microfluidic Systems Enabling High-Throughput Single-Cell Protein Characterization. Sensors 2016, 16, 232. https://doi.org/10.3390/s16020232
Fan B, Li X, Chen D, Peng H, Wang J, Chen J. Development of Microfluidic Systems Enabling High-Throughput Single-Cell Protein Characterization. Sensors. 2016; 16(2):232. https://doi.org/10.3390/s16020232
Chicago/Turabian StyleFan, Beiyuan, Xiufeng Li, Deyong Chen, Hongshang Peng, Junbo Wang, and Jian Chen. 2016. "Development of Microfluidic Systems Enabling High-Throughput Single-Cell Protein Characterization" Sensors 16, no. 2: 232. https://doi.org/10.3390/s16020232