
An Electrochemical Impedance Spectroscopy System for Monitoring Pineapple Waste Saccharification

 ,
,  ,
,
Abstract
:1. Introduction
2. Experimental
2.1. Sample Preparation
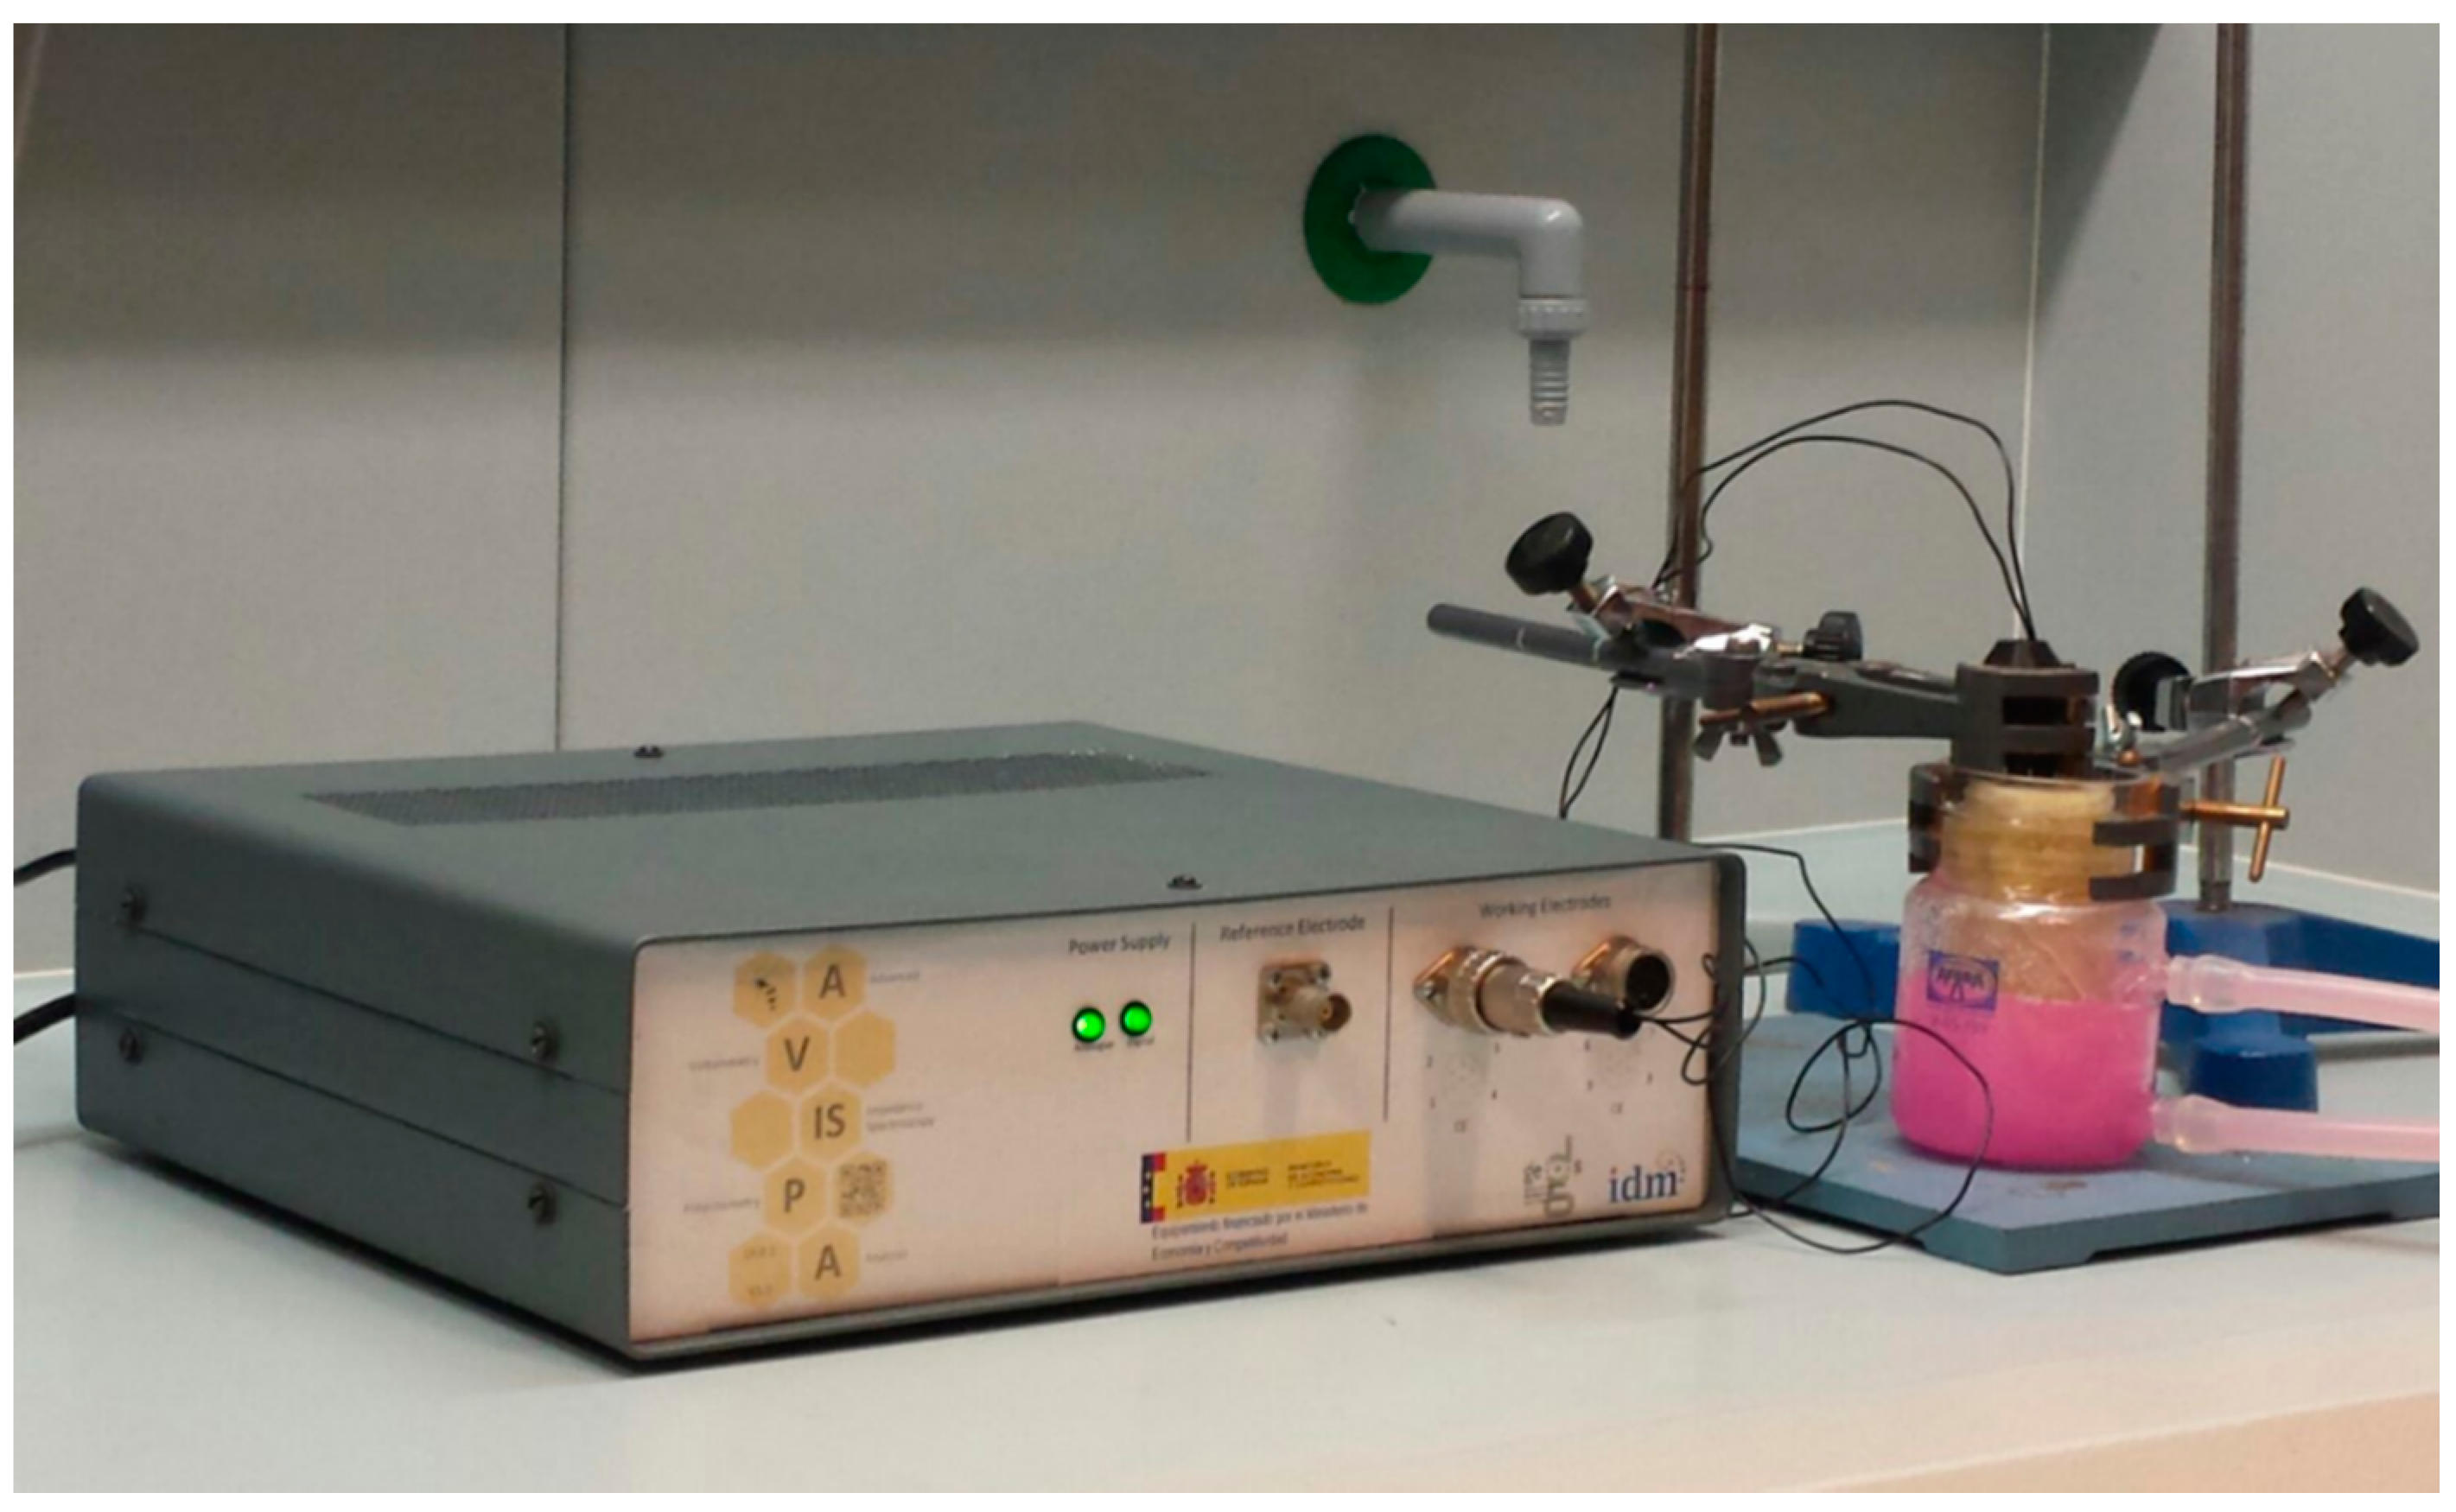
2.2. Electrochemical Impedance Spectroscopy Equipment
2.3. Electrochemical Impedance Spectroscopy Measurements
2.4. High Performance Anion-Exchange Chromatography-Pulsed Amperometric Detection (HPAEC-PAD) Analyses
2.5. Statistical Analysis and Modeling
3. Results and Discussion
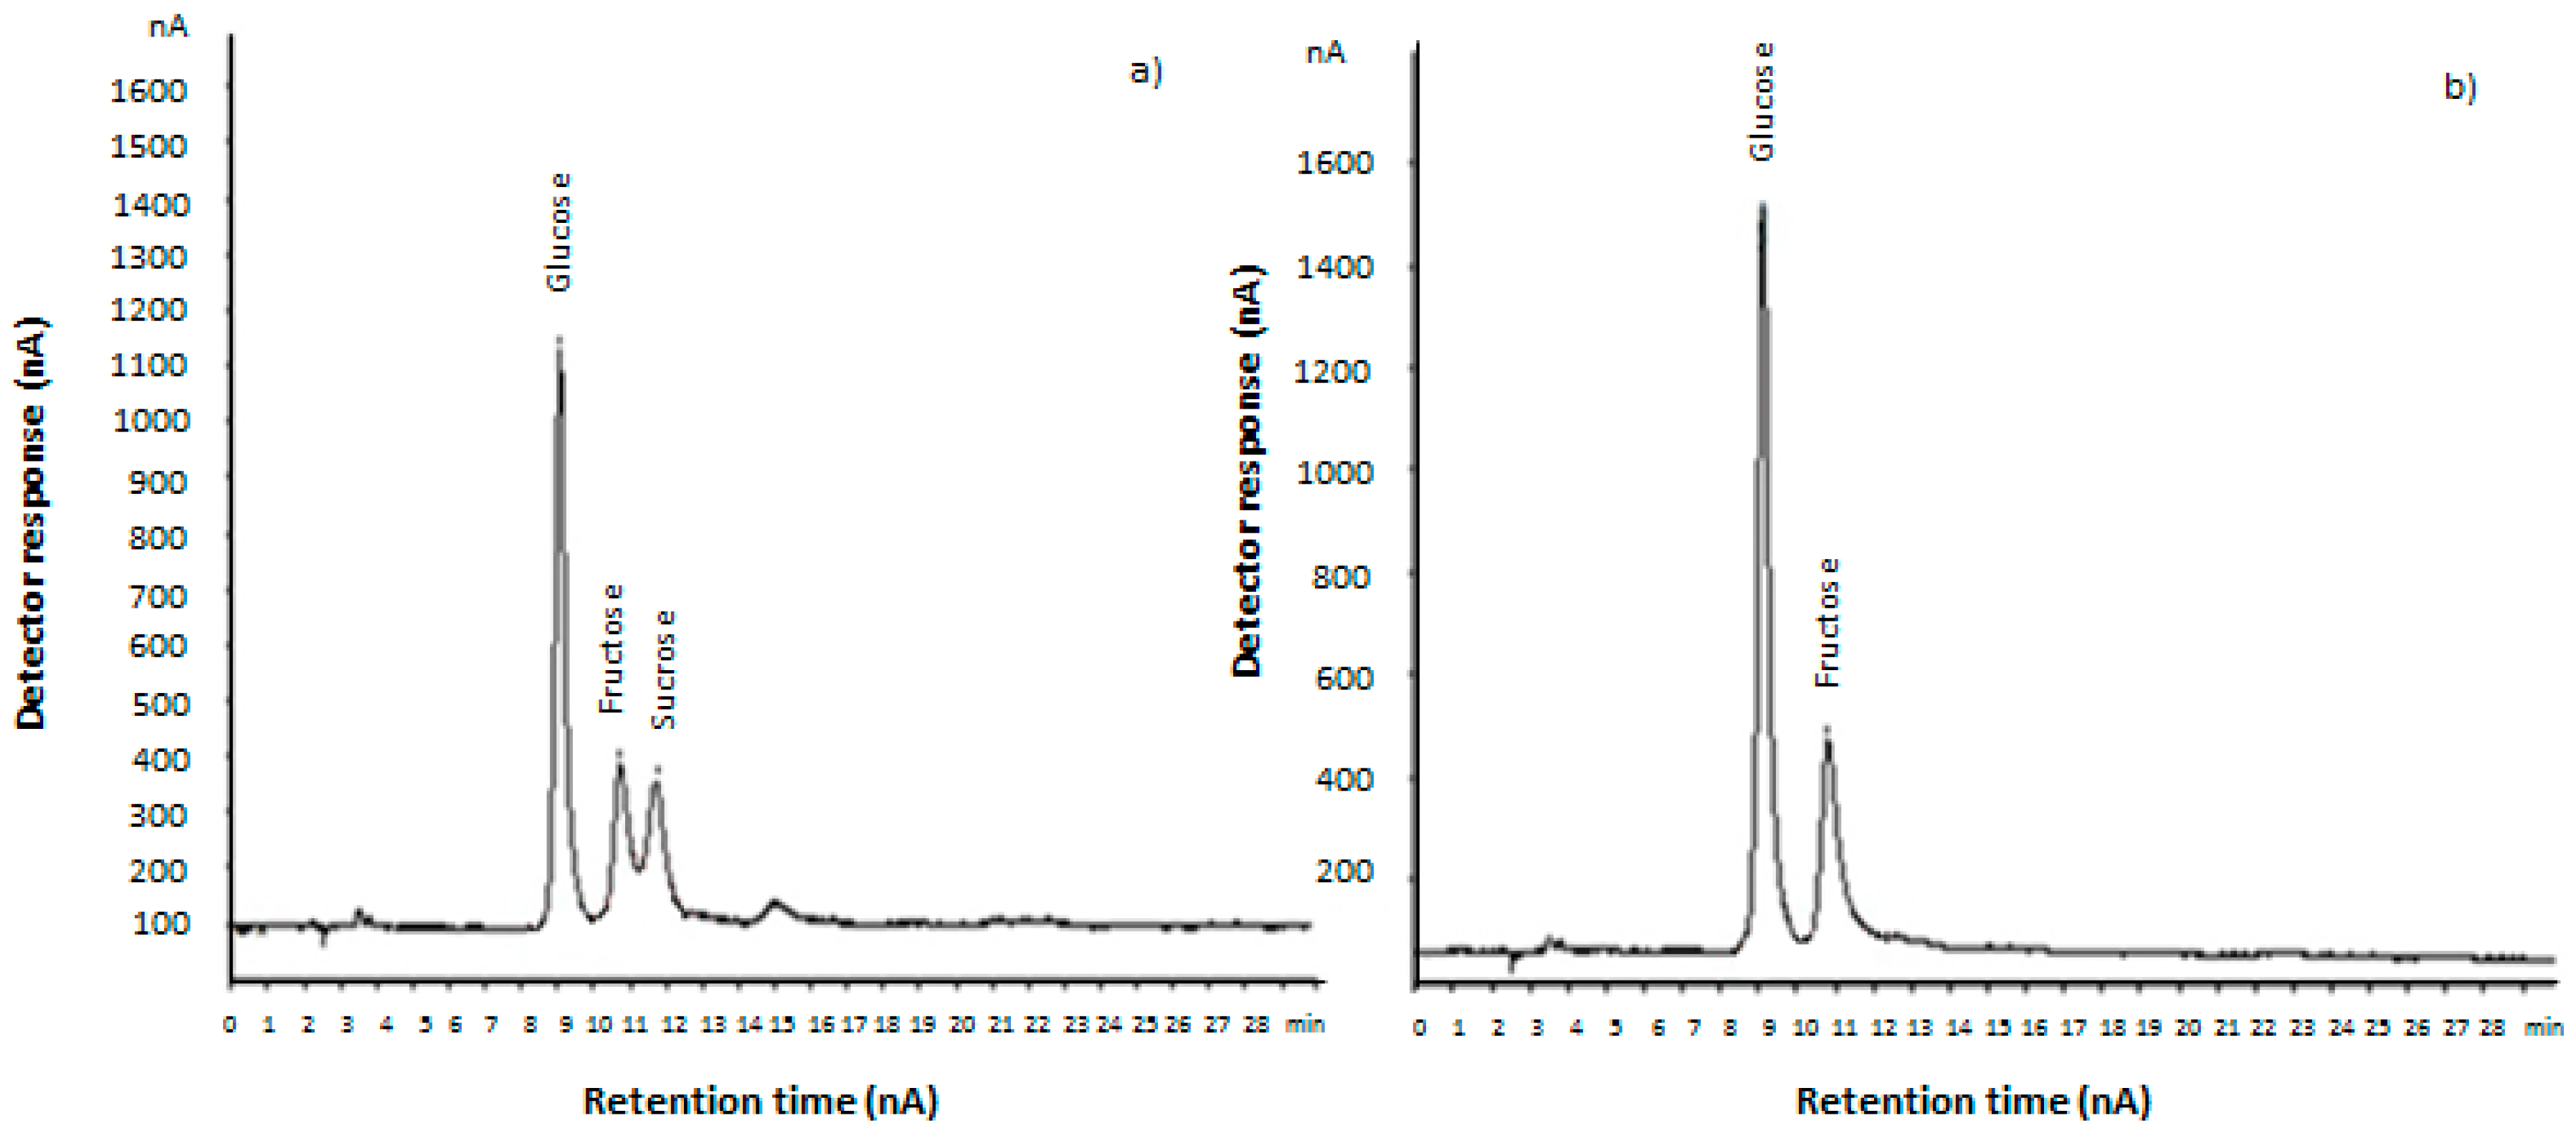
3.1. Sugar Determination by HPAEC-PAD


| Saccharification Time (h) | Glucose (g/L) | Fructose (g/L) | Sucrose (g/L) | Total Sugars 1 (g/L) |
|---|---|---|---|---|
| 0 | 33.5 (1.2) a | 33.18 (1.1) a | 28.1 (0.3) e | 94.8 (0.3) a |
| 0.75 | 36.4 (1.6) b | 36.69 (0.15) b | 20.6 (1.5) d | 95.7 (0.2) b |
| 1.5 | 36.1 (0.9) b | 41.3 (0.5) c | 19.0 (0.7) c | 96.5 (1.4) b |
| 6 | 44.3 (0.5) c | 51.3 (1.1) d | 9.4 (0.3) b | 105.0 (0.9) c |
| 12 | 47.63 (1.07) d | 58.9 (1.2) e | 0.0 (0.0) a | 107.0 (0.7) d |
| 24 | 48.8 (0.8) d | 60 (2) e | 0.0 (0.0) a | 108 (3) d |
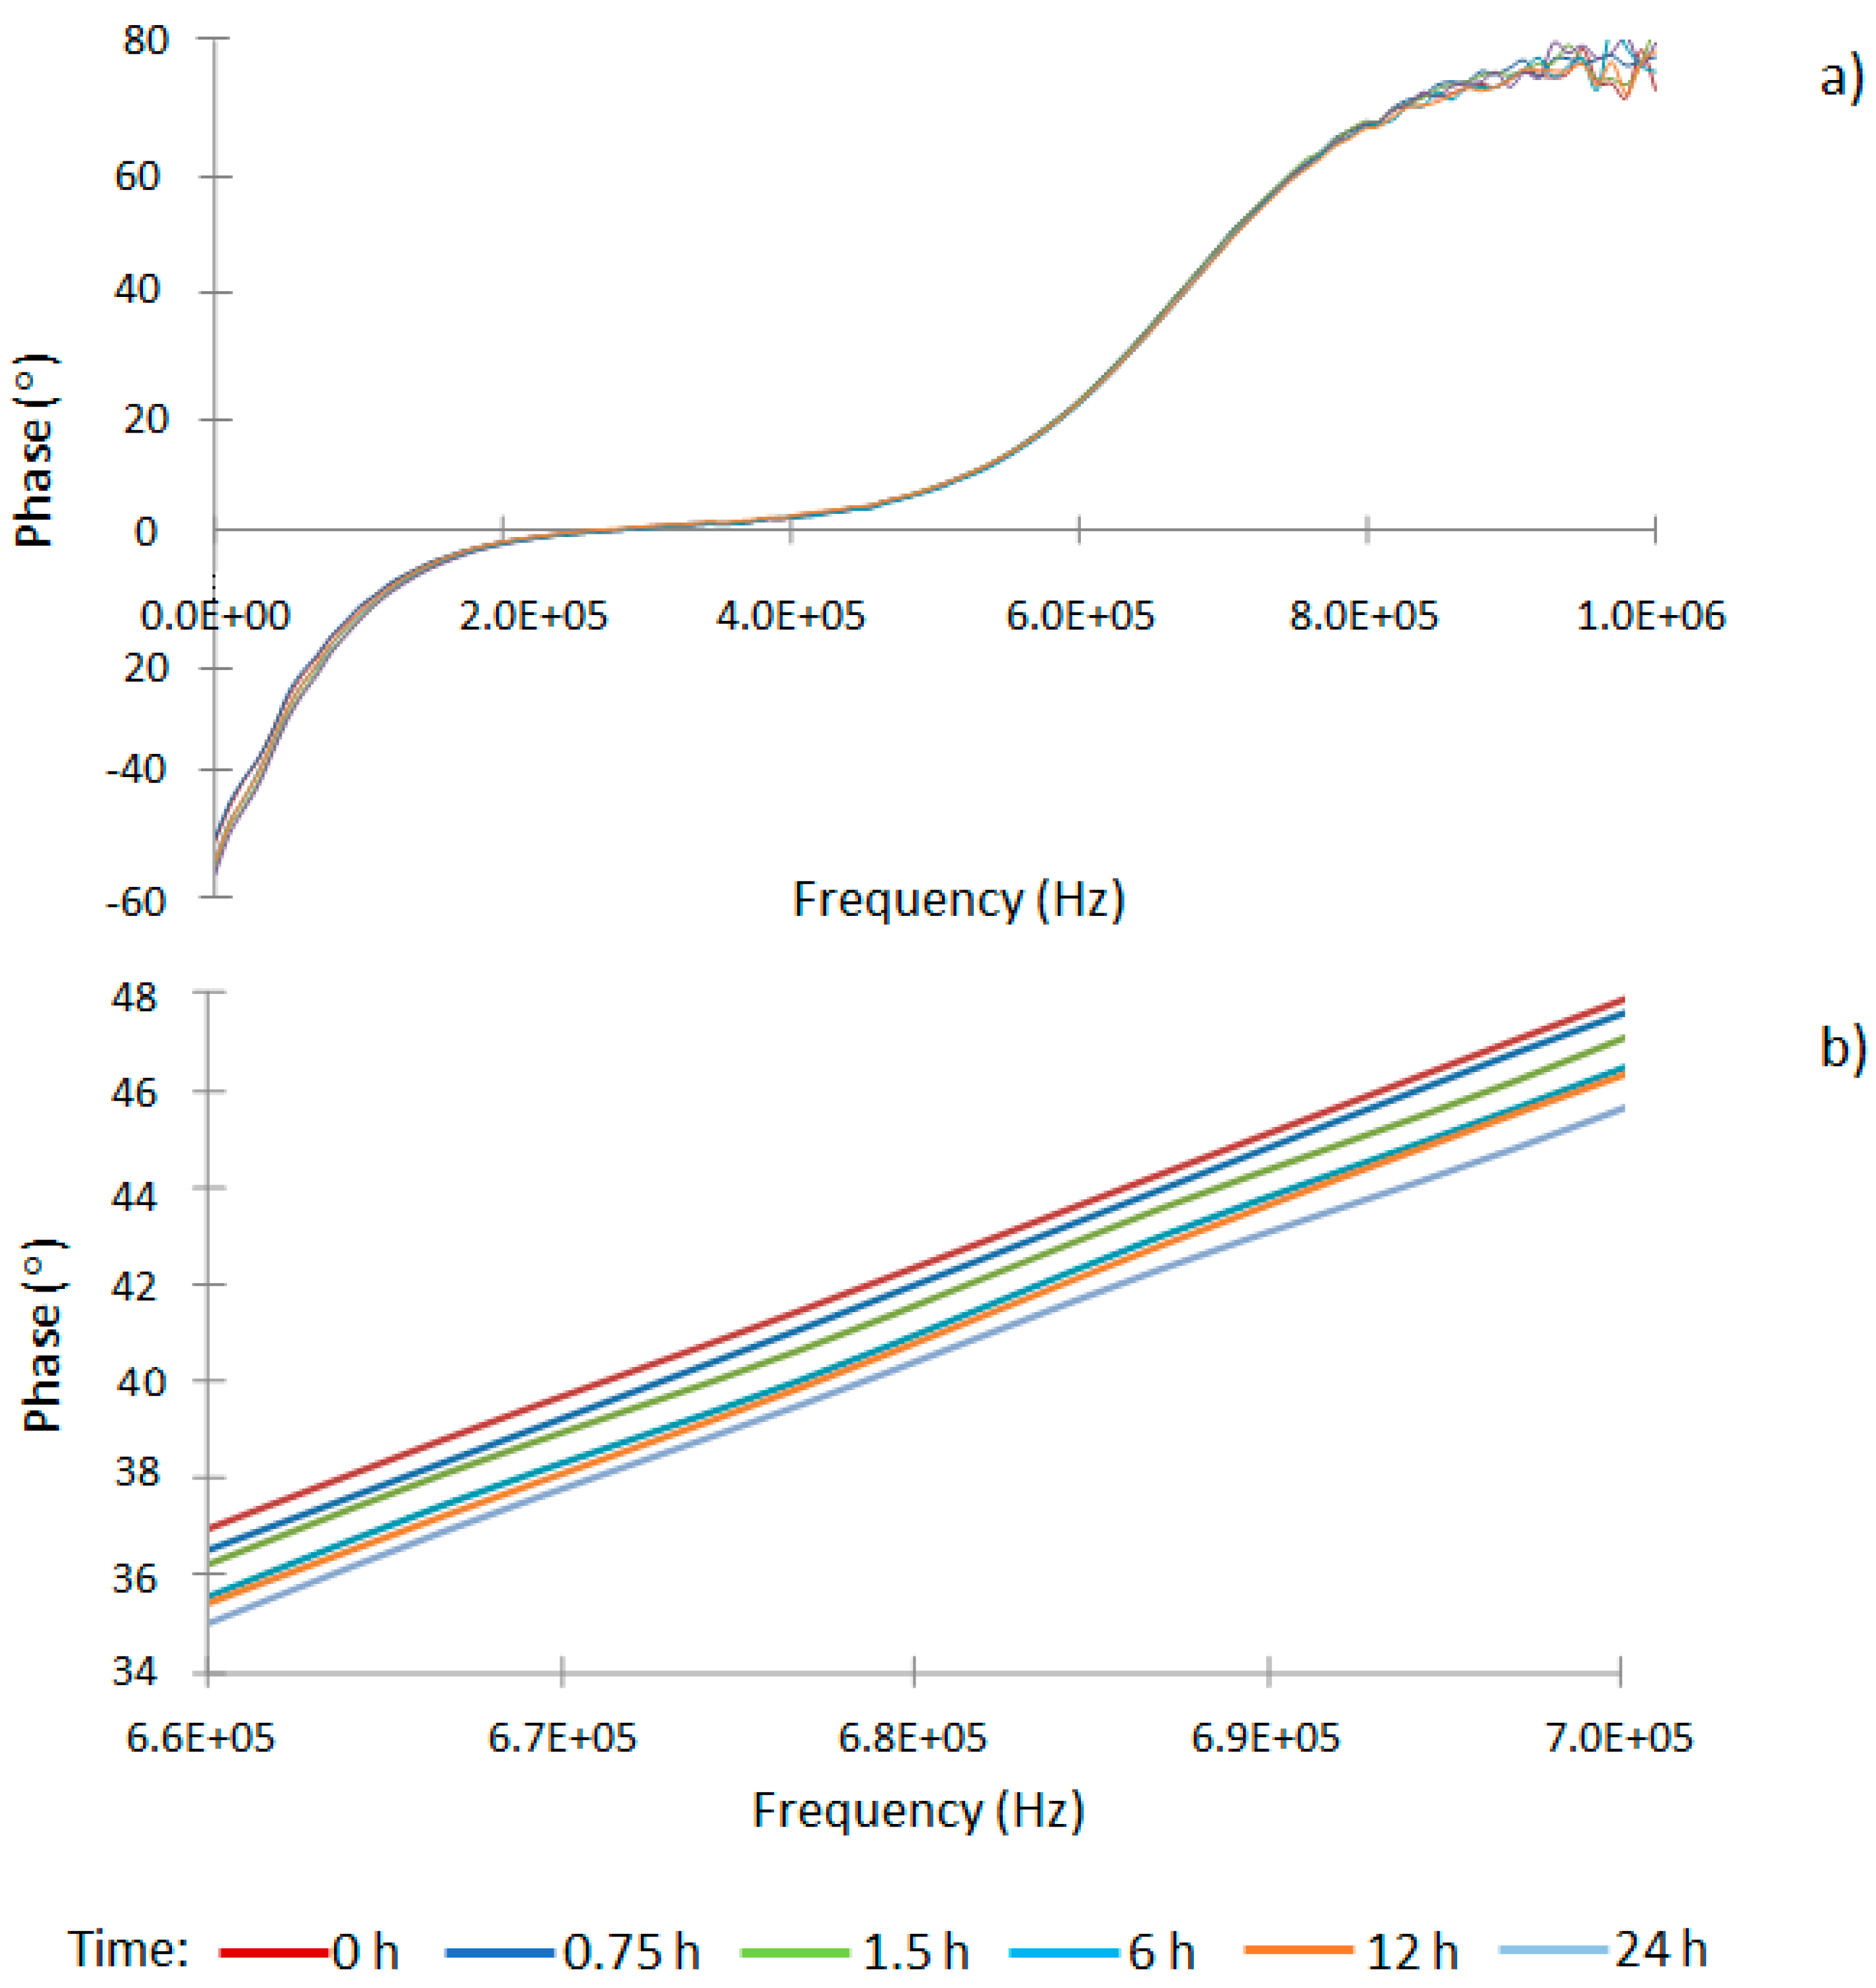
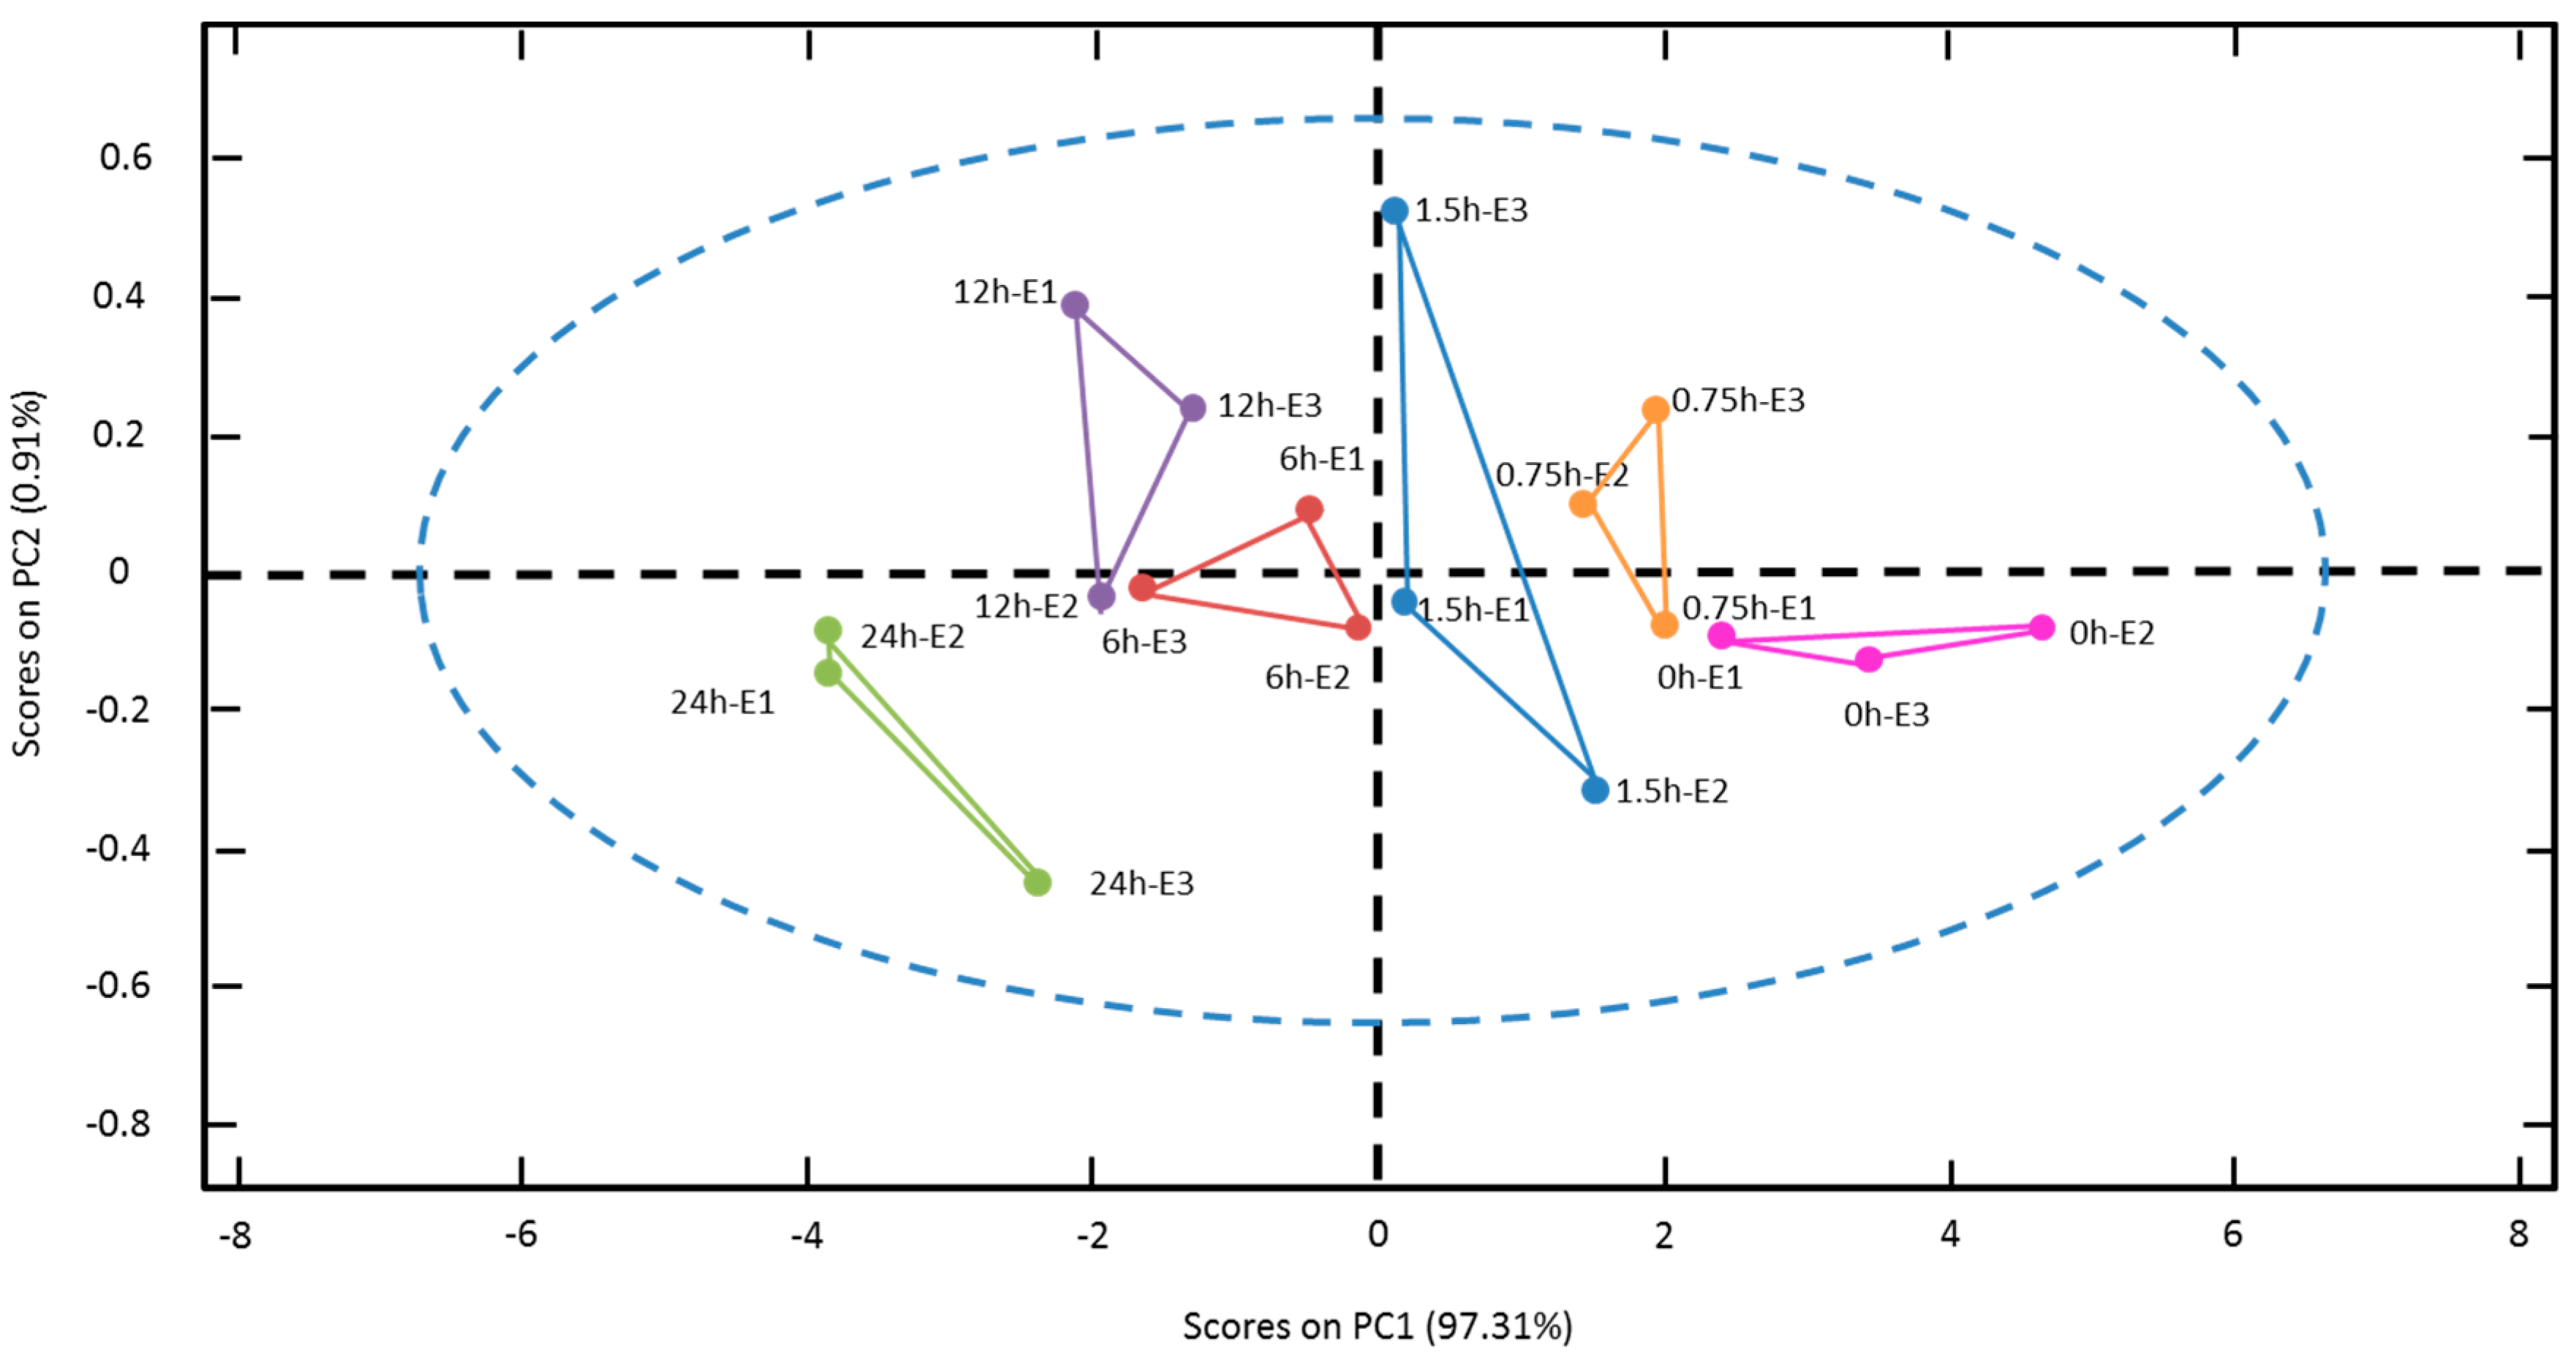
3.2. Electrochemical Impedance Spectroscopy Measurements


| Sugars | Statistics | ||
|---|---|---|---|
| R2 | RMSEP | LV | |
| Glucose | 0.955 | 1.306 | 1 |
| Fructose | 0.970 | 1.782 | 1 |
| Sucrose | 0.975 | 1.645 | 1 |
| Total Sugars | 0.944 | 1.353 | 2 |
| R2 | RMSEP | |
|---|---|---|
| Glucose | ||
| Training | 0.970 | 0.686 |
| Validation | 0.995 | 0.251 |
| Test | 0.998 | 0.233 |
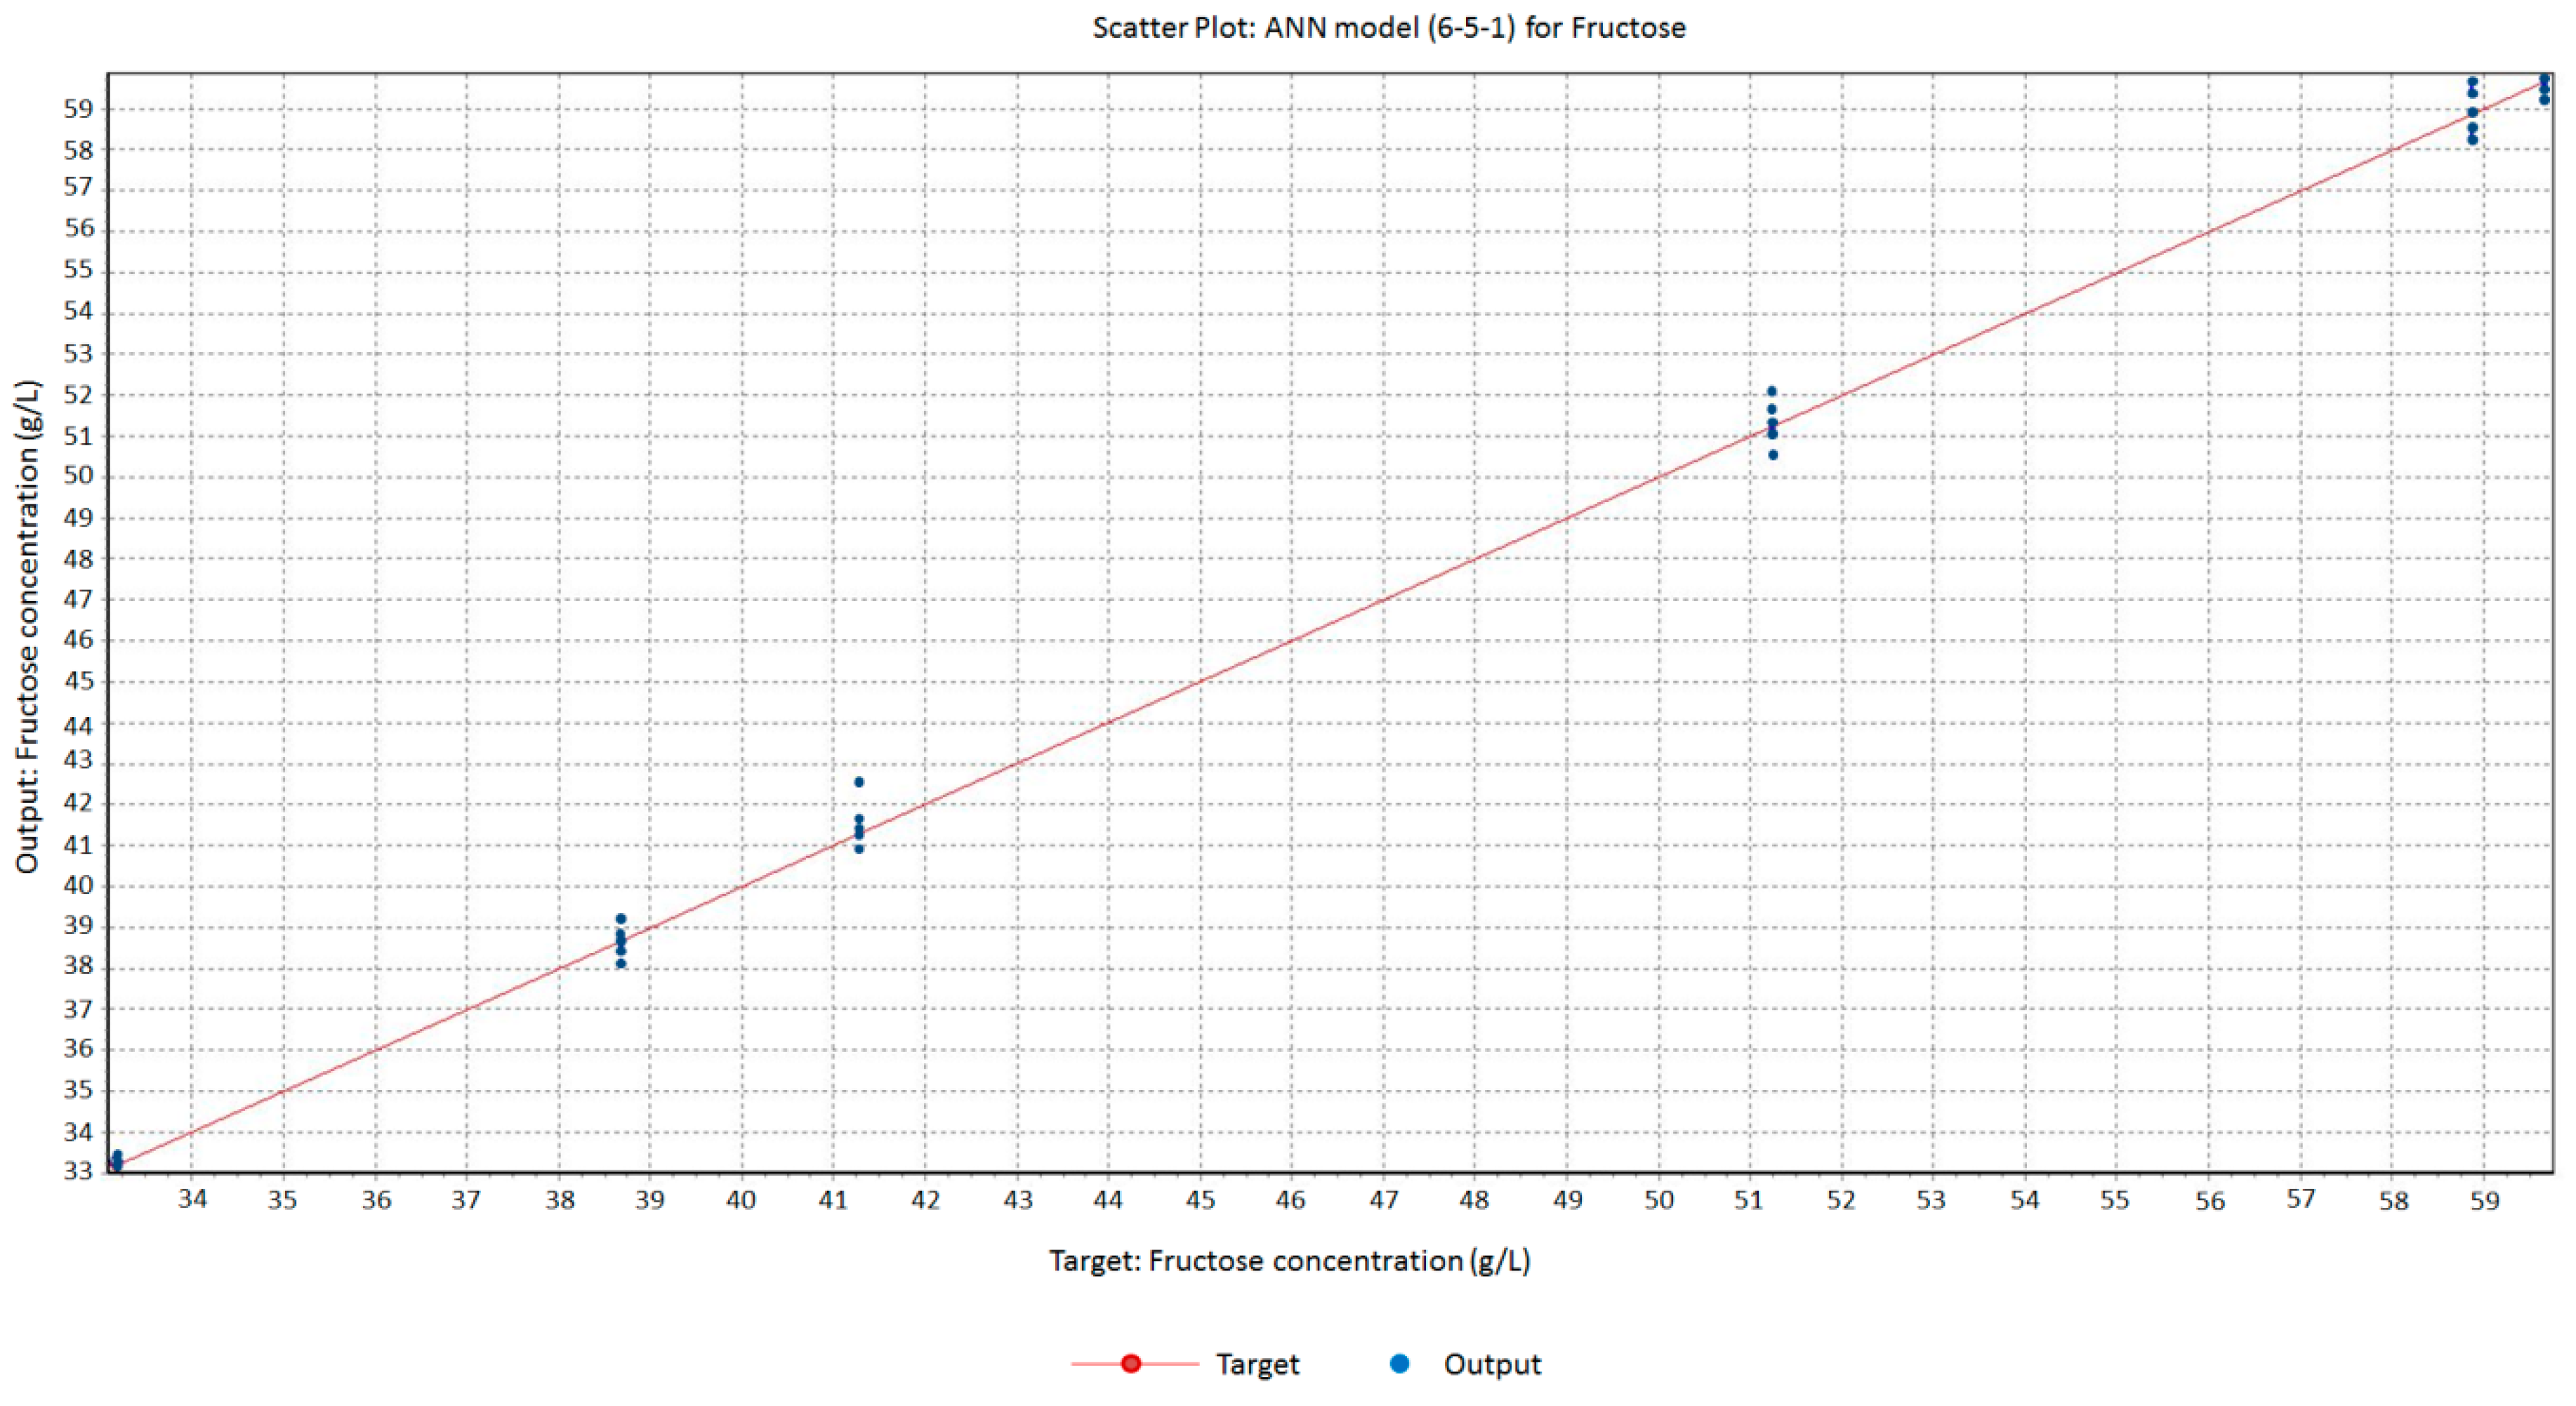
| Fructose | ||
| Training | 0.986 | 0.414 |
| Validation | 0.998 | 0.309 |
| Test | 0.996 | 0.486 |
| Sucrose | ||
| Training | 0.995 | 0.666 |
| Validation | 0.987 | 1.206 |
| Test | 0.998 | 0.901 |
| Total Sugars | ||
| Training | 0.989 | 0.420 |
| Validation | 0.991 | 0.298 |
| Test | 0.991 | 0.333 |
4. Conclusions
Acknowledgments
Author Contributions
Conflicts of Interest
References
- Ma, H.; Wang, Q.; Gong, L.; Wang, X.; Wang, X.; Yin, W. Ethanol production from kitchen garbage by Zymomonas mobilis: Optimization of parameters through statistical experimental designs. Chem. Biochem. Eng. Q. 2008, 22, 369–375. [Google Scholar]
- Betiku, E.; Taiwo, A.E. Modeling and optimization of bioethanol production from breadfruit starch hydrolyzate vis-à-vis response surface methodology and artificial neural network. Renew. Energy 2015, 74, 87–94. [Google Scholar] [CrossRef]
- Binod, P.; Sindhu, R.; Singhania, R.R.; Vikram, S.; Devi, L.; Nagalakshmi, S.; Kurien, N.; Sukumaran, R.K.; Pandey, A. Bioethanol production from rice straw: An overview. Bioresour. Technol. 2010, 101, 4767–4774. [Google Scholar] [CrossRef] [PubMed]
- Cadoche, L.; Lopez, G.D. Assessment of size reduction as a preliminary step in the production of ethanol from lignocellulosic wastes. Biol. Wastes 1989, 30, 153–157. [Google Scholar] [CrossRef]
- Duff, S.J.B.; Murray, W.D. Bioconversion of forest products industry waste cellulosics to fuel ethanol: A review. Bioresour. Technol. 1996, 55, 1–33. [Google Scholar] [CrossRef]
- Sarkar, N.; Ghosh, S.K.; Bannerjee, S.; Aikat, K. Bioethanol production from agricultural wastes: An overview. Renew. Energy 2012, 37, 19–27. [Google Scholar] [CrossRef]
- Song, C.L.; Zhang, W.M.; Pei, Y.Q.; Fan, G.L.; Xu, G.P. Comparative effects of MTBE and ethanol additions into gasoline on exhaust emissions. Atmos. Environ. 2006, 40, 1957–1970. [Google Scholar] [CrossRef]
- Ketnawa, S.; Chaiwut, P.; Rawdkuen, S. Pineapple wastes: A potential source for bromelain extraction. Food Bioprod. Process. 2012, 90, 385–391. [Google Scholar] [CrossRef]
- Nigam, J.N. Continuous ethanol production from pineapple cannery waste. J. Biotechnol. 1999, 72, 197–202. [Google Scholar] [CrossRef]
- Ruangviriyachai, C.; Niwaswong, C.; Kosaikanon, N.; Chanthai, S.; Chaimart, P. Pineapple Peel Waste for Bioethanol Production. J. Biotechnol. 2010, 150, 10. [Google Scholar] [CrossRef]
- Tanaka, K.; Hilary, Z.D.; Ishizaki, A. Investigation of the utility of pineapple juice and pineapple waste material as low-cost substrate for ethanol fermentation by Zymomonas Mobilis. J. Biosci. Bioeng. 1999, 87, 642–646. [Google Scholar] [CrossRef]
- Scheller, H.V.; Ulvskov, P. Hemicelluloses. Annu. Rev. Plant Biol. 2010, 61, 263–289. [Google Scholar] [CrossRef] [PubMed]
- Taherzadeh, M.J.; Karimi, K. Enzyme-based hydrolysis processes for ethanol from lignocellulosic materials: A review. Bioresources 2007, 2, 707–738. [Google Scholar]
- Yang, B.; Dai, Z.; Ding, S.Y.; Wyman, C.E. Enzymatic Hydrolysis of Cellulosic Biomass. Biofuels 2011, 2, 421–450. [Google Scholar] [CrossRef]
- Eklund, R.; Zacchi, G. Simultaneous saccharification and fermentation of steam-pretreated willow. Enzym. Microb. Technol. 1995, 17, 255–259. [Google Scholar] [CrossRef]
- Hari Krishna, S.; Chowdary, G.V. Optimization of simultaneous saccharification and fermentation for the production of ethanol from lignocellulosic biomass. J. Agric. Food Chem. 2000, 48, 1971–1976. [Google Scholar] [CrossRef] [PubMed]
- Kádár, Z.; Szengyel, Z.; Réczey, K. Simultaneous saccharification and fermentation (SSF) of industrial wastes for the production of ethanol. Ind. Crop. Prod. 2004, 20, 103–110. [Google Scholar] [CrossRef]
- Linde, M.; Galbe, M.; Zacchi, G. Simultaneous saccharification and fermentation of steam-pretreated barley straw at low enzyme loadings and low yeast concentration. Enzym. Microb. Technol. 2007, 40, 1100–1107. [Google Scholar] [CrossRef]
- Raessler, M. Sample preparation and current applications of liquid chromatography for the determination of non-structural carbohydrates in plants. TRAC Trend. Anal. Chem. 2011, 11, 1833–1843. [Google Scholar] [CrossRef]
- Stefansson, M.; Westerlund, D. Ligand-exchange chromatography of carbohydrates and glycoconjugates. J. Chromatogr. A 1996, 720, 127–136. [Google Scholar] [CrossRef]
- Sanz, M.L.; Sanz, J.; Martínez-Castro, I. Gas chromatographic–mass spectrometric method for the qualitative and quantitative determination of disaccharides and trisaccharides in honey. J. Chromatogr. A 2004, 1059, 143–148. [Google Scholar] [CrossRef] [PubMed]
- Terrab, A.; Vega-Pérez, J.M.; Díez, M.J.; Heredia, F.J. Characterization of northwest Moroccan honeys by gas chromatographic-mass spectrometric analysis of their sugar components. J. Sci. Food Agric. 2001, 82, 179–185. [Google Scholar] [CrossRef]
- LaCourse, W.R. Pulsed electrochemical detection of carbohydrates at nobel metal electrodes following liquid chromatographic and electrophoretic separation. J. Chromatogr. Lib. 2002, 66, 905–946. [Google Scholar]
- Jie, D.; Xie, L.; Rao, X.; Ying, Y. Using visible and near infrared diffuse transmittance technique to predict soluble solids content of watermelon in an on-line detection system. Postharvest Biol. Technol. 2014, 90, 1–6. [Google Scholar] [CrossRef]
- Bard, A.J.; Faulkner, L.R. Electrochemical Methods: Fundamentals and Applications; John Wiley & Sons Inc.: New York, NY, USA, 2001; p. 833. [Google Scholar]
- Barsoukov, E.; Ross Macdonald, J. Impedance Spectroscopy: Theory, Experiment and Applications; John Wiley & Sons Inc.: Hoboken, NJ, USA, 2005; p. 595. [Google Scholar]
- Fuentes, A.; Vázquez-Gutiérrez, J.L.; Pérez-Gago, M.B.; Vonasek, E.; Nitin, N.; Barret, D.M. Application of nondestructive impedance spectroscopy to determination of the effect of temperature on potato microstructure and texture. J. Food Eng. 2014, 133, 16–22. [Google Scholar] [CrossRef]
- Ohnishi, S.; Shimiya, Y.; Kumagai, H.; Miyawaki, O. Effect of freezing on electrical and rheological properties of food materials. Food Sci. Technol. 2004, 10, 453–459. [Google Scholar] [CrossRef]
- Wu, L.; Ogawa, Y.; Tagawa, A. Electrical impedance spectroscopy analysis of eggplant pulp and effects of drying and freezing-thawing treatments on its impedance characteristics. J. Food Eng. 2008, 87, 274–280. [Google Scholar] [CrossRef]
- Ulrich, C.; Petersson, H.; Sundgren, H.; Björefors, F.; Krantz-Rülcker, C. Simultaneous estimation of soot and diesel contamination in engine oil using electrochemical impedance spectroscopy. Sens. Actuators B Chem. 2007, 127, 613–618. [Google Scholar] [CrossRef]
- Olivati, C.A.; Riul, A.; Balogh, D.T.; Oliveira, O.N.; Ferreira, M. Detection of phenolic compounds using impedance spectroscopy measurements. Bioproc. Biosys. Eng. 2009, 32, 41–46. [Google Scholar] [CrossRef] [PubMed]
- Kumar, G.; Buchheit, R.G. Use of Artificial Neural Network Models to Predict Coated Component Life from Short-Term Electrochemical Impedance Spectroscopy Measurements. Corrosion 2008, 64, 241–254. [Google Scholar] [CrossRef]
- Eddahech, A.; Briat, O.; Bertrand, N.; Delétage, J.Y.; Vinassa, J.M. Behavior and state-of-health monitoring of Li-ion batteries using impedance spectroscopy and recurrent neural networks. Int. J. Electr. Power Energy Syst. 2012, 42, 487–494. [Google Scholar] [CrossRef]
- Kasuba, T. Simplified fuzzy ARTMAP. AI Expert 1993, 8, 18–25. [Google Scholar]
- Garcia-Breijo, E.; Atkinson, J.; Gil-Sanchez, L.; Masot, R.; Ibañez, J.; Garrigues, J.; Glanc, M.; Laguarda-Miro, N.; Olguin, C. A comparison study of pattern recognition algorithms implemented on a microcontroller for use in an electronic tongue for monitoring drinking waters. Sens. Actuators A Phys. 2011, 2, 570–582. [Google Scholar] [CrossRef]
- Rajasekaran, S.; Vijayalakshmi Pai, G.A. Neural Networks, Fuzzy Logic and Genetic Lgorithms: Synthesis and Applications; Prentice Hall: New Delhi, India, 2004. [Google Scholar]
- Garcia-Breijo, E.; Garrigues, J.; Gil Sanchez, L.; Laguarda-Miró, N. An Embedded Simplified Fuzzzy ARTMAP Implemented on a Microcontroller for Food Classification. Sensors 2013, 13, 10418–10429. [Google Scholar] [CrossRef] [PubMed]
- Conesa, C.; Gracía-Breijo, E.; Loeff, E.; Seguí, L.; Fito, P.; Laguarda-Miró, N. An Electrochemical Impedance Spectroscopy-Based Technique to Identify and Quantify Fermentable Sugars in Pineapple Waste Valorization for Bioethanol Production. Sensors 2015, 15, 22941–22955. [Google Scholar] [CrossRef] [PubMed]
- Hastie, T.; Tibshirani, R.T.; Friedman, J. The elements of Statistical Learning; Springer: Stanford, CA, USA, 2009; p. 764. [Google Scholar]
- Civera, J.I.; Breijo, E.G.; Miró, N.L.; Sánchez, L.G.; Baixauli, J.G.; Gil, I.R.; Peris, R.M.; Fillol, M.A. Artificial neural network onto eight bit microcontroller for Secchi depth calculation. Sens. Actuators B Chem. 2011, 156, 132–139. [Google Scholar] [CrossRef]
- Laguarda-Miró, N.; Ferreira, F.W.; García-Breijo, E.; Ibañez-Civera, J.; Gil-Sánchez, L.; Garrigues-Baixauli, J. Glyphosate detection by voltammetric techniques. A comparison between statistical methods and an artificial neural network. Sens. Actuators B Chem. 2012, 171–172, 528–536. [Google Scholar] [CrossRef]
- Martín del Brío, B.; Sanz Molina, A. Redes Neuronales y Sistemas Borrosos; Ra-Ma: Madrid, Spain, 2001; p. 399. [Google Scholar]
- Priddy, K.L.; Keller, P.E. Artificial Neural Networks: An Introduction; SPIE PRESS: Bellingham, WA, USA, 2005. [Google Scholar]
- Abdullah, B.; Hanafi, M. Characterisation of solid and liquid pineapple waste. Reaktor 2008, 12, 48–52. [Google Scholar]
- Krueger, D.A.; Krueger, R.G.; Maciel, J. Composition of pineapple juice. J. AOAC Int. 1992, 75, 280–282. [Google Scholar]
- Goyal, A.; Ghosh, B.; Eveleigh, D. Characteristics of fungal cellulases. Bioresour. Technol. 1991, 36, 37–50. [Google Scholar] [CrossRef]
- Ting, C.L.; Makarov, D.E.; Wang, Z.G. A Kinetic Model for the Enzymatic Action of Cellulase. J. Phys. Chem. B 2009, 14, 4970–4977. [Google Scholar] [CrossRef] [PubMed]
- Ban-Koffi, L.; Han, Y.W. Alcohol production from pineapple waste. World J. Microbiol. Biotechnol. 1990, 6, 281–284. [Google Scholar] [CrossRef] [PubMed]
© 2016 by the authors; licensee MDPI, Basel, Switzerland. This article is an open access article distributed under the terms and conditions of the Creative Commons by Attribution (CC-BY) license (http://creativecommons.org/licenses/by/4.0/).
Share and Cite
Conesa, C.; Ibáñez Civera, J.; Seguí, L.; Fito, P.; Laguarda-Miró, N. An Electrochemical Impedance Spectroscopy System for Monitoring Pineapple Waste Saccharification. Sensors 2016, 16, 188. https://doi.org/10.3390/s16020188
Conesa C, Ibáñez Civera J, Seguí L, Fito P, Laguarda-Miró N. An Electrochemical Impedance Spectroscopy System for Monitoring Pineapple Waste Saccharification. Sensors. 2016; 16(2):188. https://doi.org/10.3390/s16020188
Chicago/Turabian StyleConesa, Claudia, Javier Ibáñez Civera, Lucía Seguí, Pedro Fito, and Nicolás Laguarda-Miró. 2016. "An Electrochemical Impedance Spectroscopy System for Monitoring Pineapple Waste Saccharification" Sensors 16, no. 2: 188. https://doi.org/10.3390/s16020188