Article

Elimination of Drifts in Long-Duration Monitoring for Apnea-Hypopnea of Human Respiration

State Key Laboratory of Precision Measurement Technology and Instrument, Department of Precision Instrument, Tsinghua University, Beijing 100084, China
*
Author to whom correspondence should be addressed.
Sensors 2016, 16(11), 1779; https://doi.org/10.3390/s16111779
Submission received: 22 July 2016 / Revised: 28 September 2016 / Accepted: 19 October 2016 / Published: 25 October 2016
(This article belongs to the Special Issue Wearable Biomedical Sensors)

Abstract

:
This paper reports a methodology to eliminate an uncertain baseline drift in respiratory monitoring using a thermal airflow sensor exposed in a high humidity environment. Human respiratory airflow usually contains a large amount of moisture (relative humidity, RH > 85%). Water vapors in breathing air condense gradually on the surface of the sensor so as to form a thin water film that leads to a significant sensor drift in long-duration respiratory monitoring. The water film is formed by a combination of condensation and evaporation, and therefore the behavior of the humidity drift is complicated. Fortunately, the exhale and inhale responses of the sensor exhibit distinguishing features that are different from the humidity drift. Using a wavelet analysis method, we removed the baseline drift of the sensor and successfully recovered the respiratory waveform. Finally, we extracted apnea-hypopnea events from the respiratory signals monitored in whole-night sleeps of patients and compared them with golden standard polysomnography (PSG) results.

Graphical Abstract

1. Introduction

Sensor drift is a common phenomenon that exists in biomedical electric recordings [1]. A gradual change in any quantitative characteristics induced by environment variation, such as temperature and humidity, is called drift. Drifts usually bring about a lot of problems. For example, electrocardiographs (ECG), electroencephalographs (EEG), and electromyograms (EMG) are sometimes affected by perspiration [2]; a photoplethysmogram (PPG) also suffers with a baseline drift due to activity or respiration [3]. Temperature and humidity may arouse chemical gas sensor drift [4]. To overcome sensor drifts, a commonly used method is done through complicated calibration measurements and conducting real-time compensation with the aid of temperature or humidity sensors [5]. However, the calibration method is not valid in some cases when the environment variation cannot be detected accurately. It is necessary to find out alternative effective methods to eliminate drifts, simultaneously retain desired characteristic signals, and ultimately execute feature extraction.
Physiological signals are typically non-stationary and complex. Interference sources are always multifold and unstable as well. The human respiratory signal is a vital physiological signal. Sleep apnea is an involuntary cessation of breathing that occurs while the patient is asleep [6]. Obstructive sleep apnea-hypopnea syndrome (OSAHS) directly relates to human respiration, which is suffered by 20%–40% of elderly people, and more than half of patients remain undiagnosed [7]. As a matter of fact, sleep apnea may strike anyone at any age, even children [8]. In order to diagnose OSAHS, a system called polysomnography (PSG) [9] is commonly used in professional sleep labs and operated by physicians, which is relatively inconvenient and expensive. Consequently, a portable monitor (PM) has been proposed as a substitute for the PSG in pre-diagnostic assessment on patients with suspected OSAHS by using micro airflow sensors [10,11,12,13]. Respiratory airflow is an important parameter for diagnosing OSAHS. However, human exhaled gas contains many water vapors (RH > 85%) [14]. The water vapors gradually condense on the surface of the respiratory sensors to form a thin water film and thus lead to a significant sensor drift in long-duration respiratory monitoring. To eliminate respiration sensor drifts, effective methods based on features of physiological signals are necessary.
As mentioned above, an uncertain drift generally exists in respiratory sensor outputs due to variations of airflow temperature and humidity. An effective method to eliminate baseline drifts is necessary. To realize temperature compensation, we have proposed to use a constant-temperature difference (CTD) mode to operate the hot-film sensor [15,16]. To eliminate humidity-induced baseline drift in the respiratory signals, we propose to use the discrete wavelet transform (DWT) approach in this paper. Wavelet transform allows not only frequency but also time localization, and enables us to analyze nonlinear and nonstationary signals [17]. Wavelet signal processing can represent signals sparsely, captures the transient features of signals, and enables signal analysis at multiple resolutions, which has advantage in processing respiration signals.
We developed a micro hot-film airflow sensor for monitoring OSAHS [15,16]. The micro-sensor was installed in a pipeline [15] or adhered on a sensing strip underneath a human nostril [16] to detect respiratory airflows. Figure 1 shows two different installation modes for respiration monitoring. Using either of the modes, we observed a significant baseline drift existing in the sensor signals when monitoring respiration over a whole night’s sleep, which greatly damaged apnea-hypopnea extraction. In this paper, we propose an advanced algorithm to eliminate sensor baseline drifts and reconstruct respiratory waveforms. Finally, we used the monitor with the advanced method to extract apnea-hypopnea events from the respiratory signals detected in sleeps of OSAHS patients and compared them with the PSG results to validate the effectiveness.

2. Mechanism Analysis for Humidity Drift

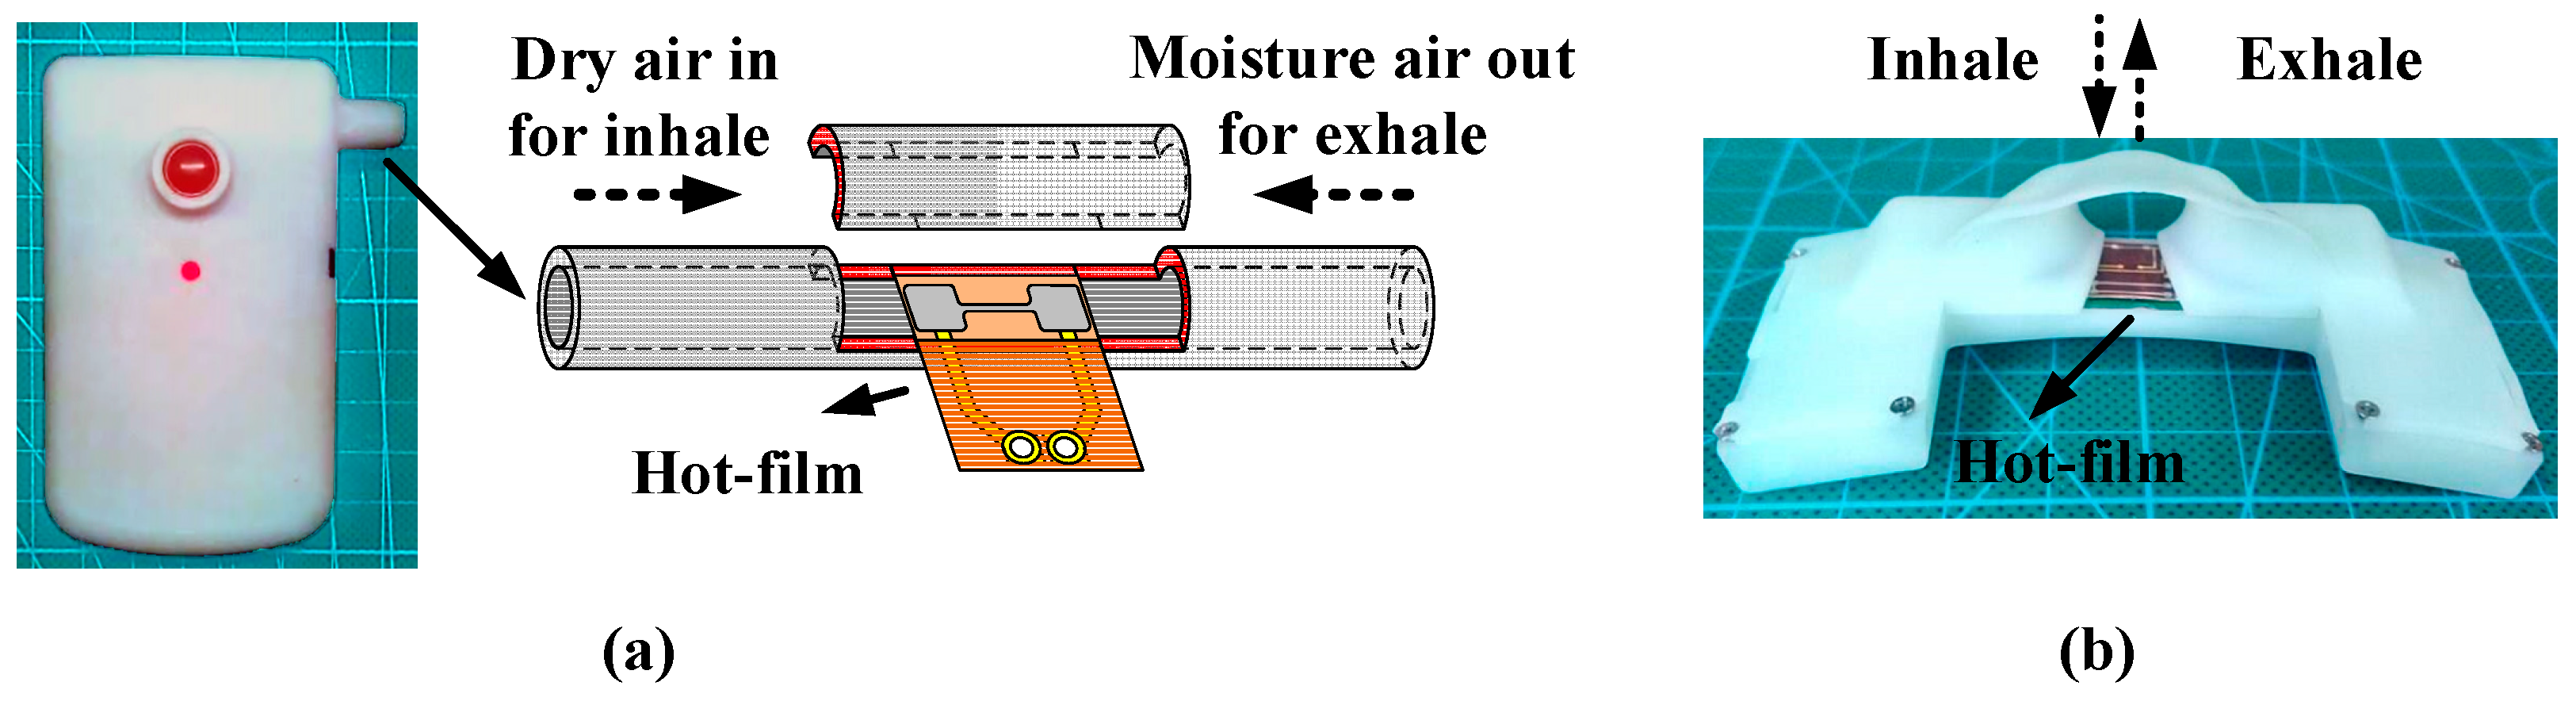
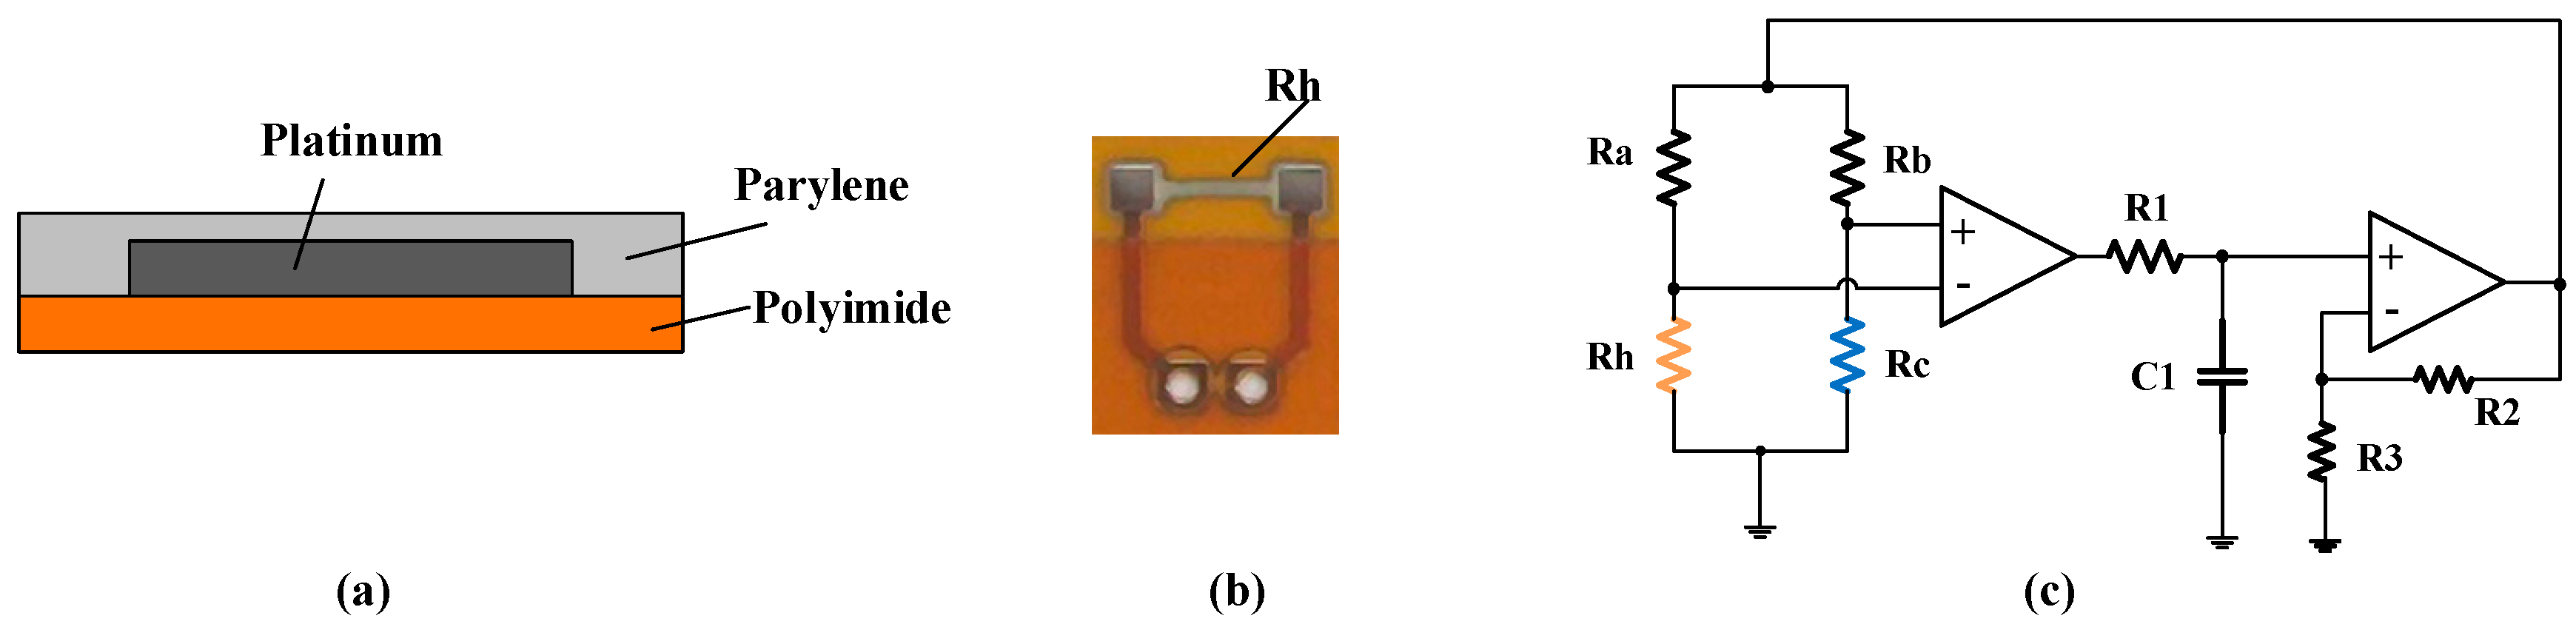
2.1. Hot-Film Airflow Sensor

The hot-film flow sensor is composed of a platinum thin film fabricated on a flexible polyimide substrate by using micromachining deposition [15,16], shown in Figure 2a,b. A nanoscale thick parylene film was deposited on the sensor surface and served as an encapsulation for waterproof and dustproof characteristics. The measuring principle of the hot-film flow sensor is based on convective heat transfer. The sensor is operated in a CTD mode, which keeps the temperature difference (ΔT) of the hot-film from the ambient temperature constant while changing the heating voltage. The temperature difference ΔT is set as about 10–30 °C for respiration detection. The hot-film flow sensor operated in the CTD mode has a fast dynamic response and high sensitivity due to using feedback to provide the automatic adjustment of electrical compensation [15].
Figure 2c shows a CTD circuit diagram of the sensor. Rh represents a hot-film resistor, Rc is a temperature compensation resistor, Ra and Rb are the balance resistors. Based on the CTD principle and King’s law [18], the output voltage U of the hot-film flow sensor can be formulated by
U 2 = R h ( 1 + β ) 2 Δ T ( A + B V n )
where V is the airflow velocity, β = R a / R h . A and B are the constant parameters depending on the fluid properties and geometric features of the hot-film, n is a geometric factor; A λ ( C p μ λ ) 0.2 and B λ ρ μ ( C p μ λ ) 0.33 , where ρ ,   μ ,   C p , λ are the fluid density, viscosity coefficient, specific heat capacity, and thermal conductivity. It is shown that the baseline output and the scale factor of the airflow sensor are dependent on the fluid properties and the heating source. The fluidic humidity changes the fluid properties and also affects the heat source when the water condenses on the sensor surface, which brings about drifts.

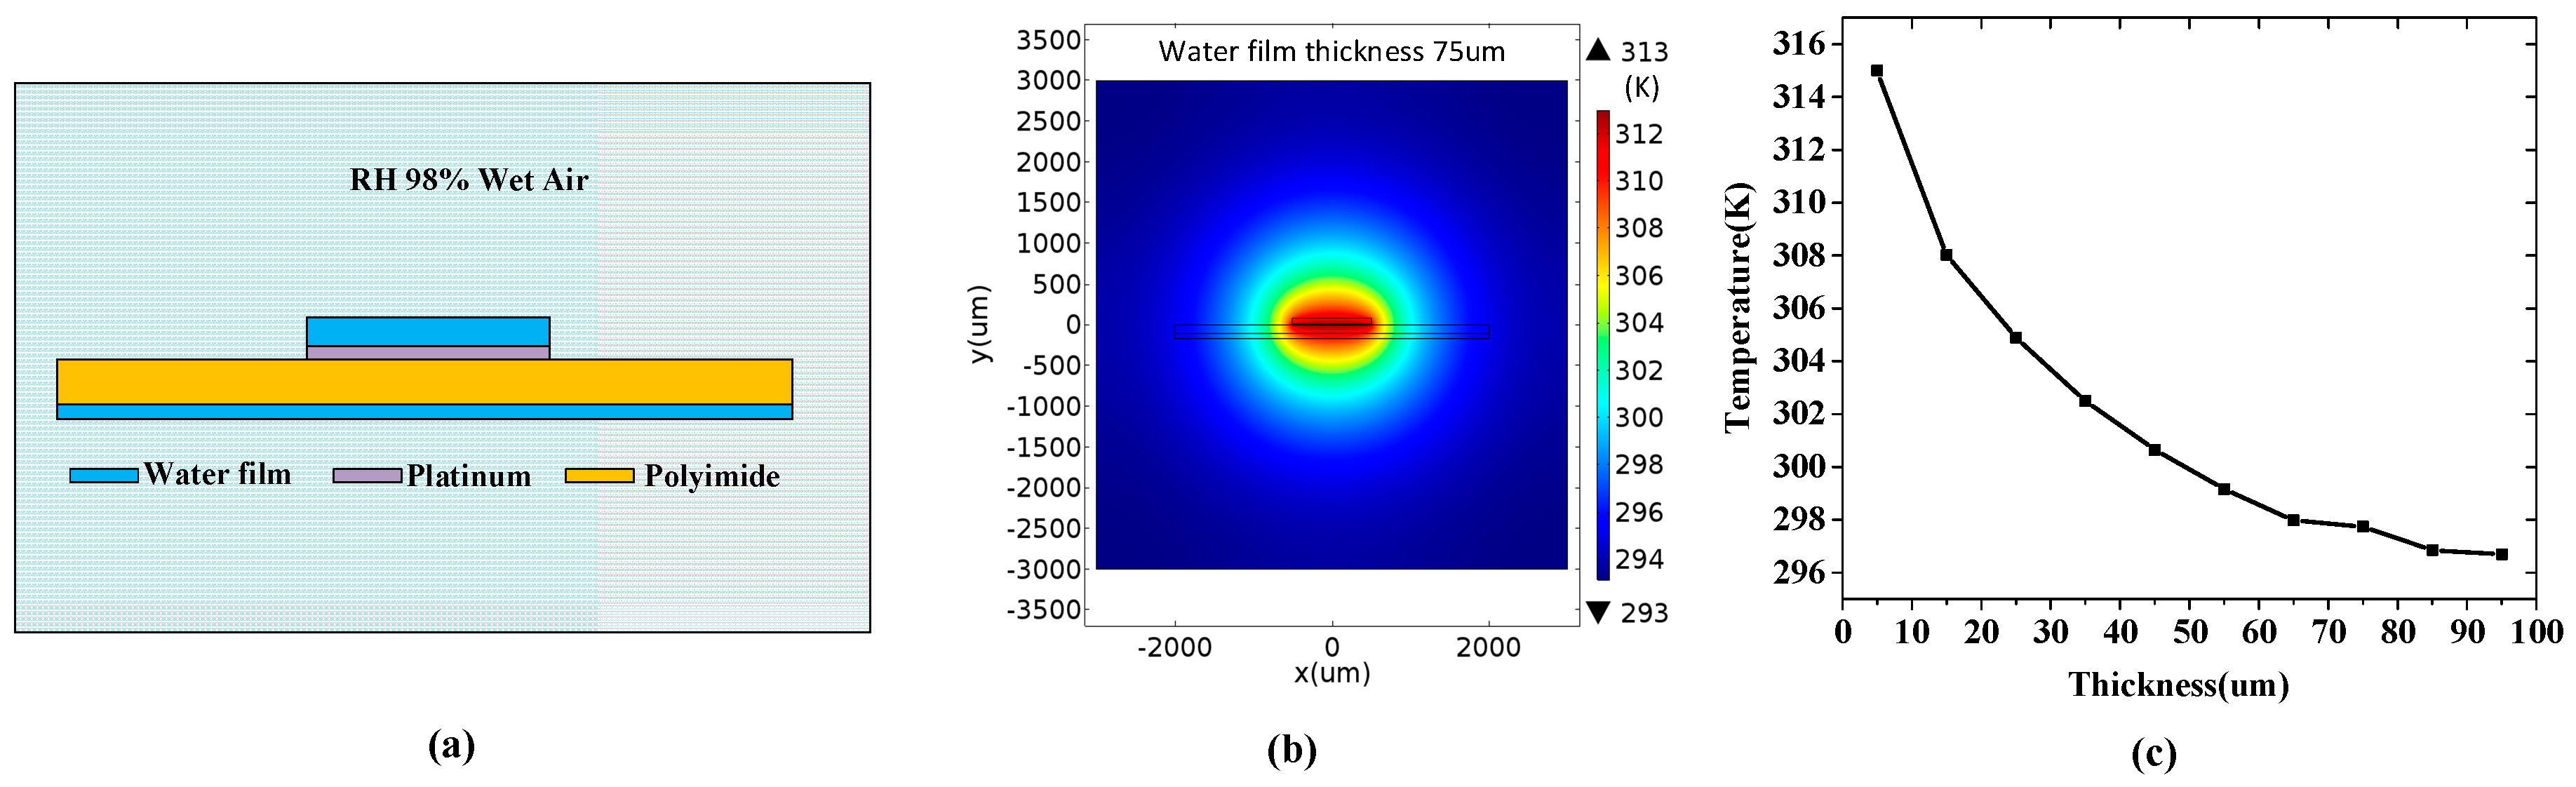
2.2. Simulation of Humidity Drift for Hot-Film Flow Sensor

After long exposure duration in a high humidity environment, e.g., human exhaled air, the water vapor gradually condenses on the surface of the hot-film sensor so as to form a thin water film on the sensor surface. The dynamic behavior of the water film forming on the sensor surface is complicated in respiratory monitoring; the vapor condensation makes the water film gradually thicken, but the thermal diffusion of the hot-film sensor and the inhaled dry air make the water film evaporate. After a long respiratory monitoring duration, the formation of the water film may reach equilibrium. This water film formation affects the temperature distribution around the hot-film, and thereby affects the sensor output, exhibiting a drift over time. To demonstrate the humidity drift, we conducted a numerical simulation to establish a relationship between the condensed water film and the temperature of the hot-film electrically heated by a constant power.
Figure 3a shows a schematic view of a hot-film covered with a thin water film in a 98% RH wet air environment. The temperature distribution around the hot-film electrically heated by a constant power (10 mW) was simulated using a non-isothermal flow model in Comsol Multiphysics [19]. In the non-isothermal flow model, there is heat transfer in solids and laminar fluids, and they are coupled with each other. The laminar flow wall was set as a no-slip boundary. The thickness of the water film was set from 5 μm to 100 μm. The ambient temperature was set as 293 K and the ambient moisture air humidity was set to be 98% RH. The simulated temperature distribution is shown in Figure 3b. The extracted hot-film temperature changing with the thickness of the condensed water film is shown in Figure 3c, which demonstrates that the hot-film temperature decreases with the increase of the water film thickness.

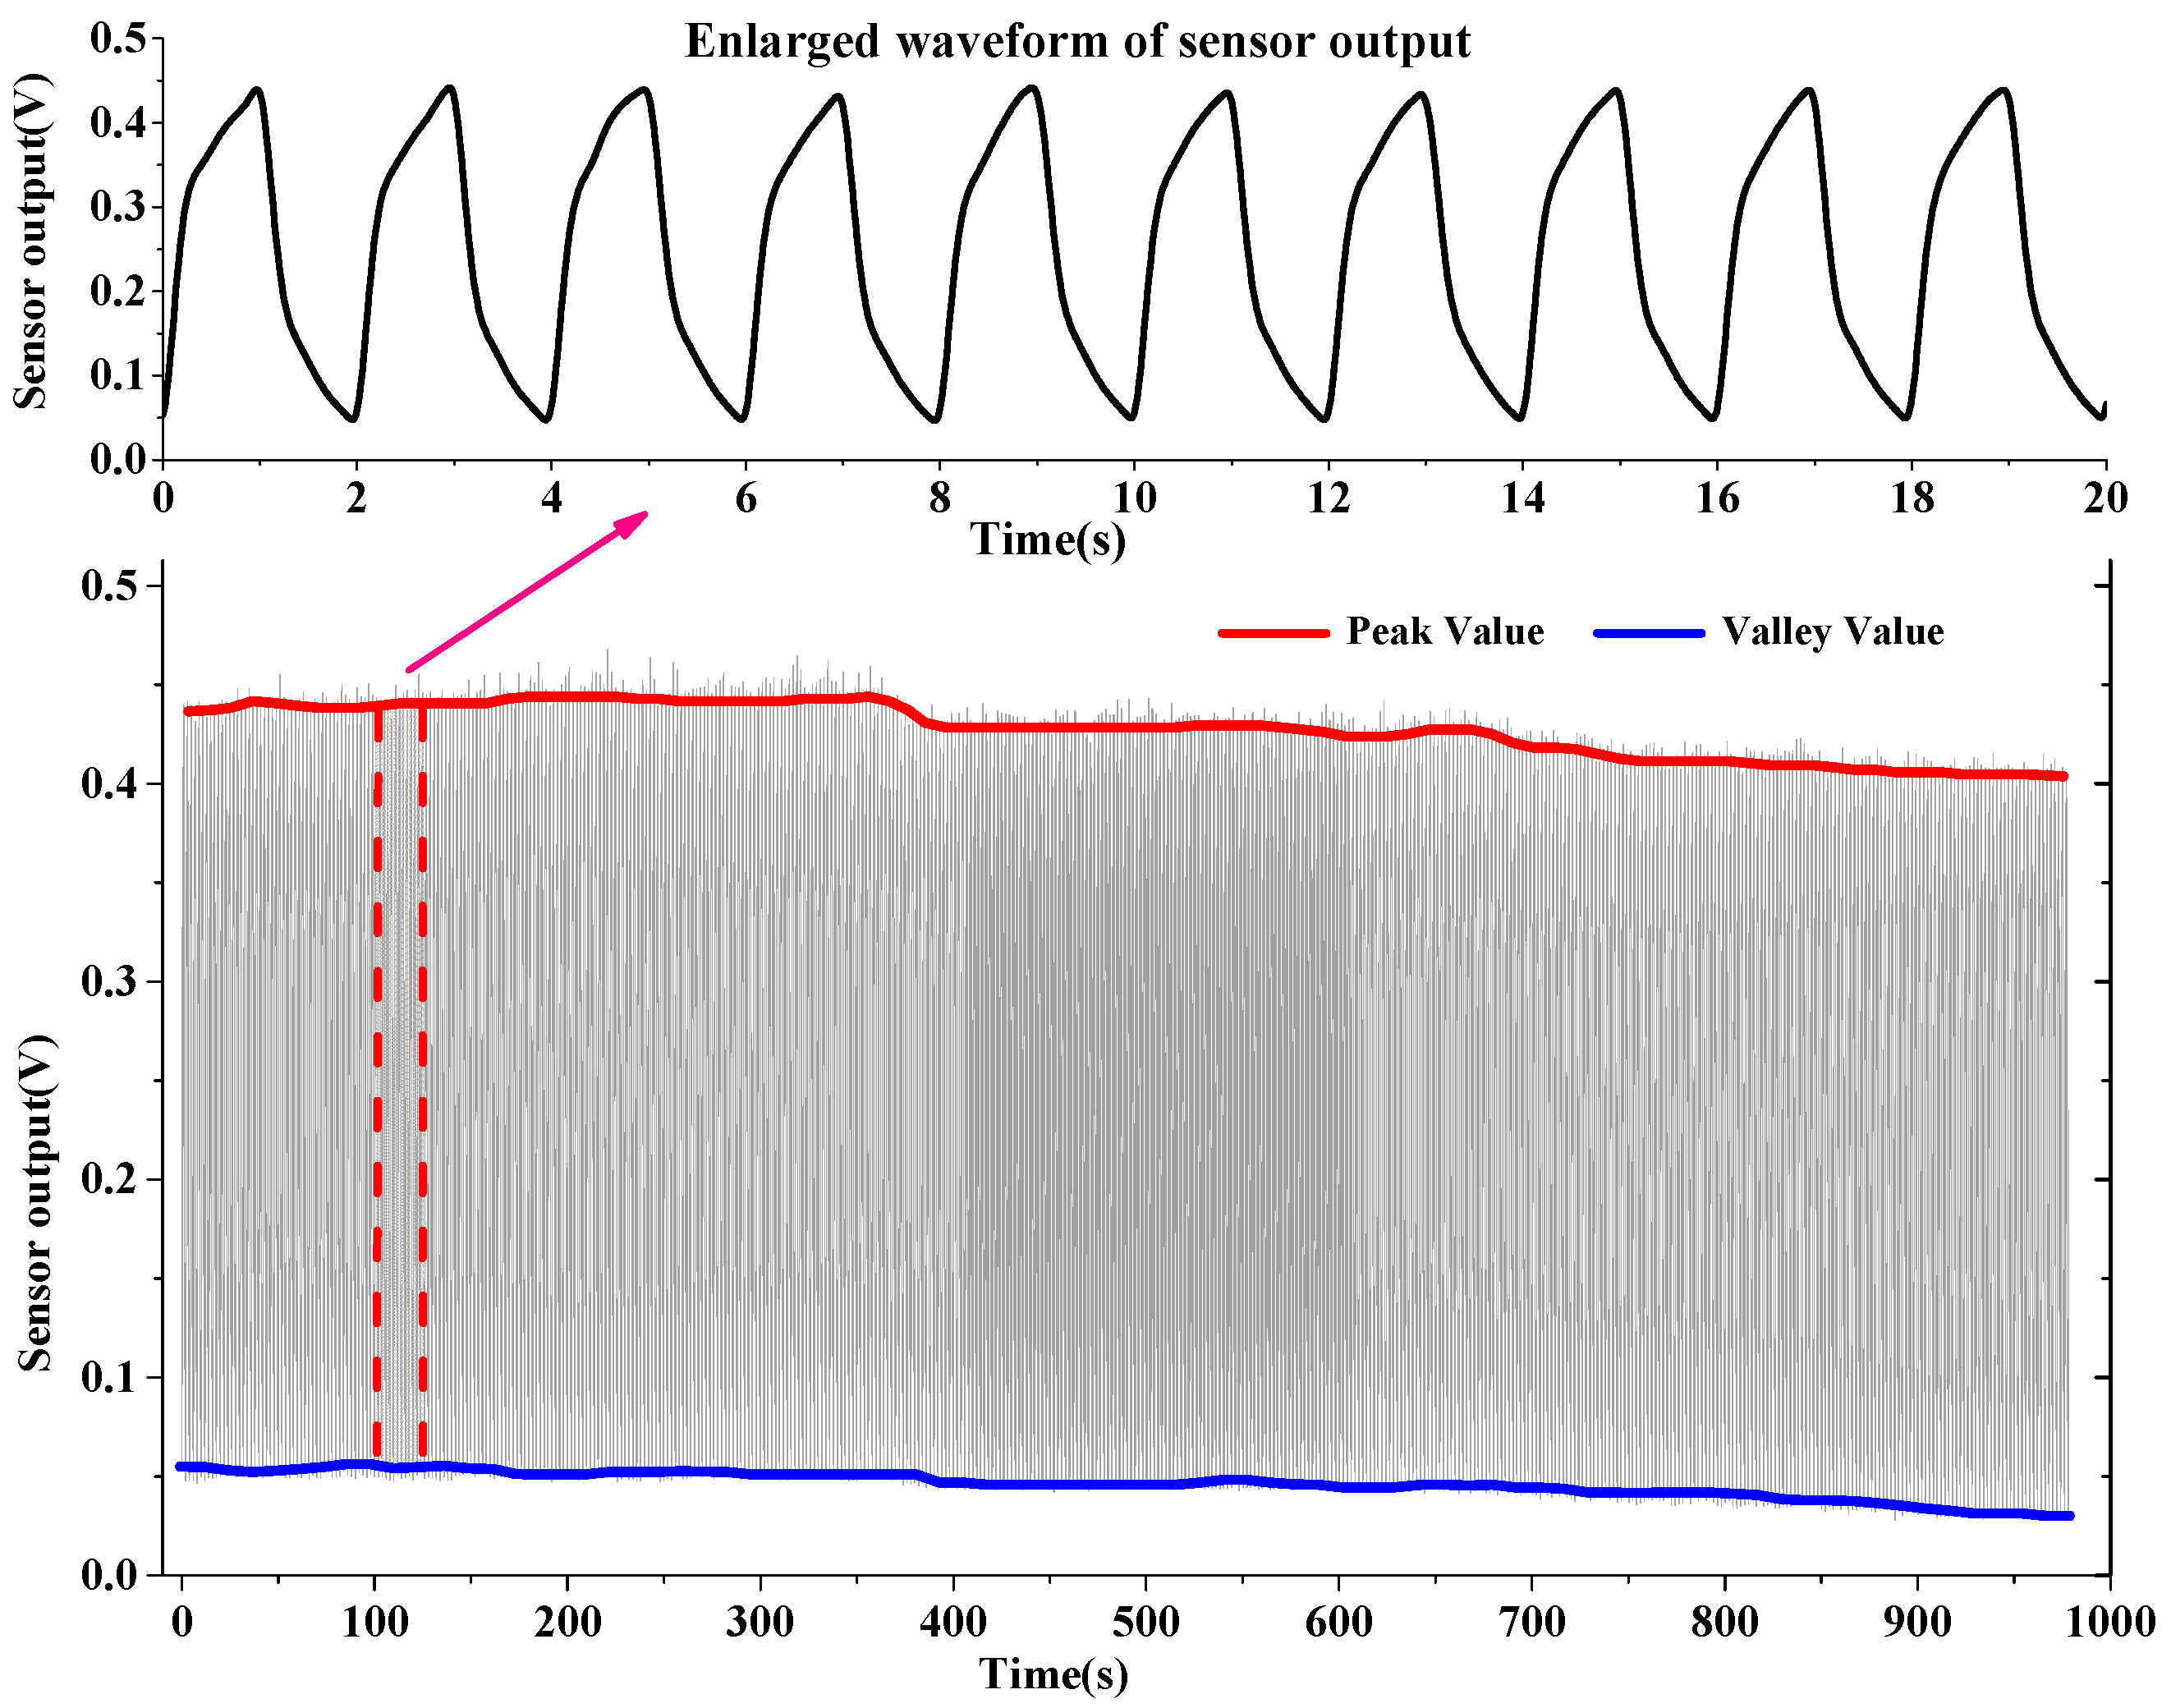
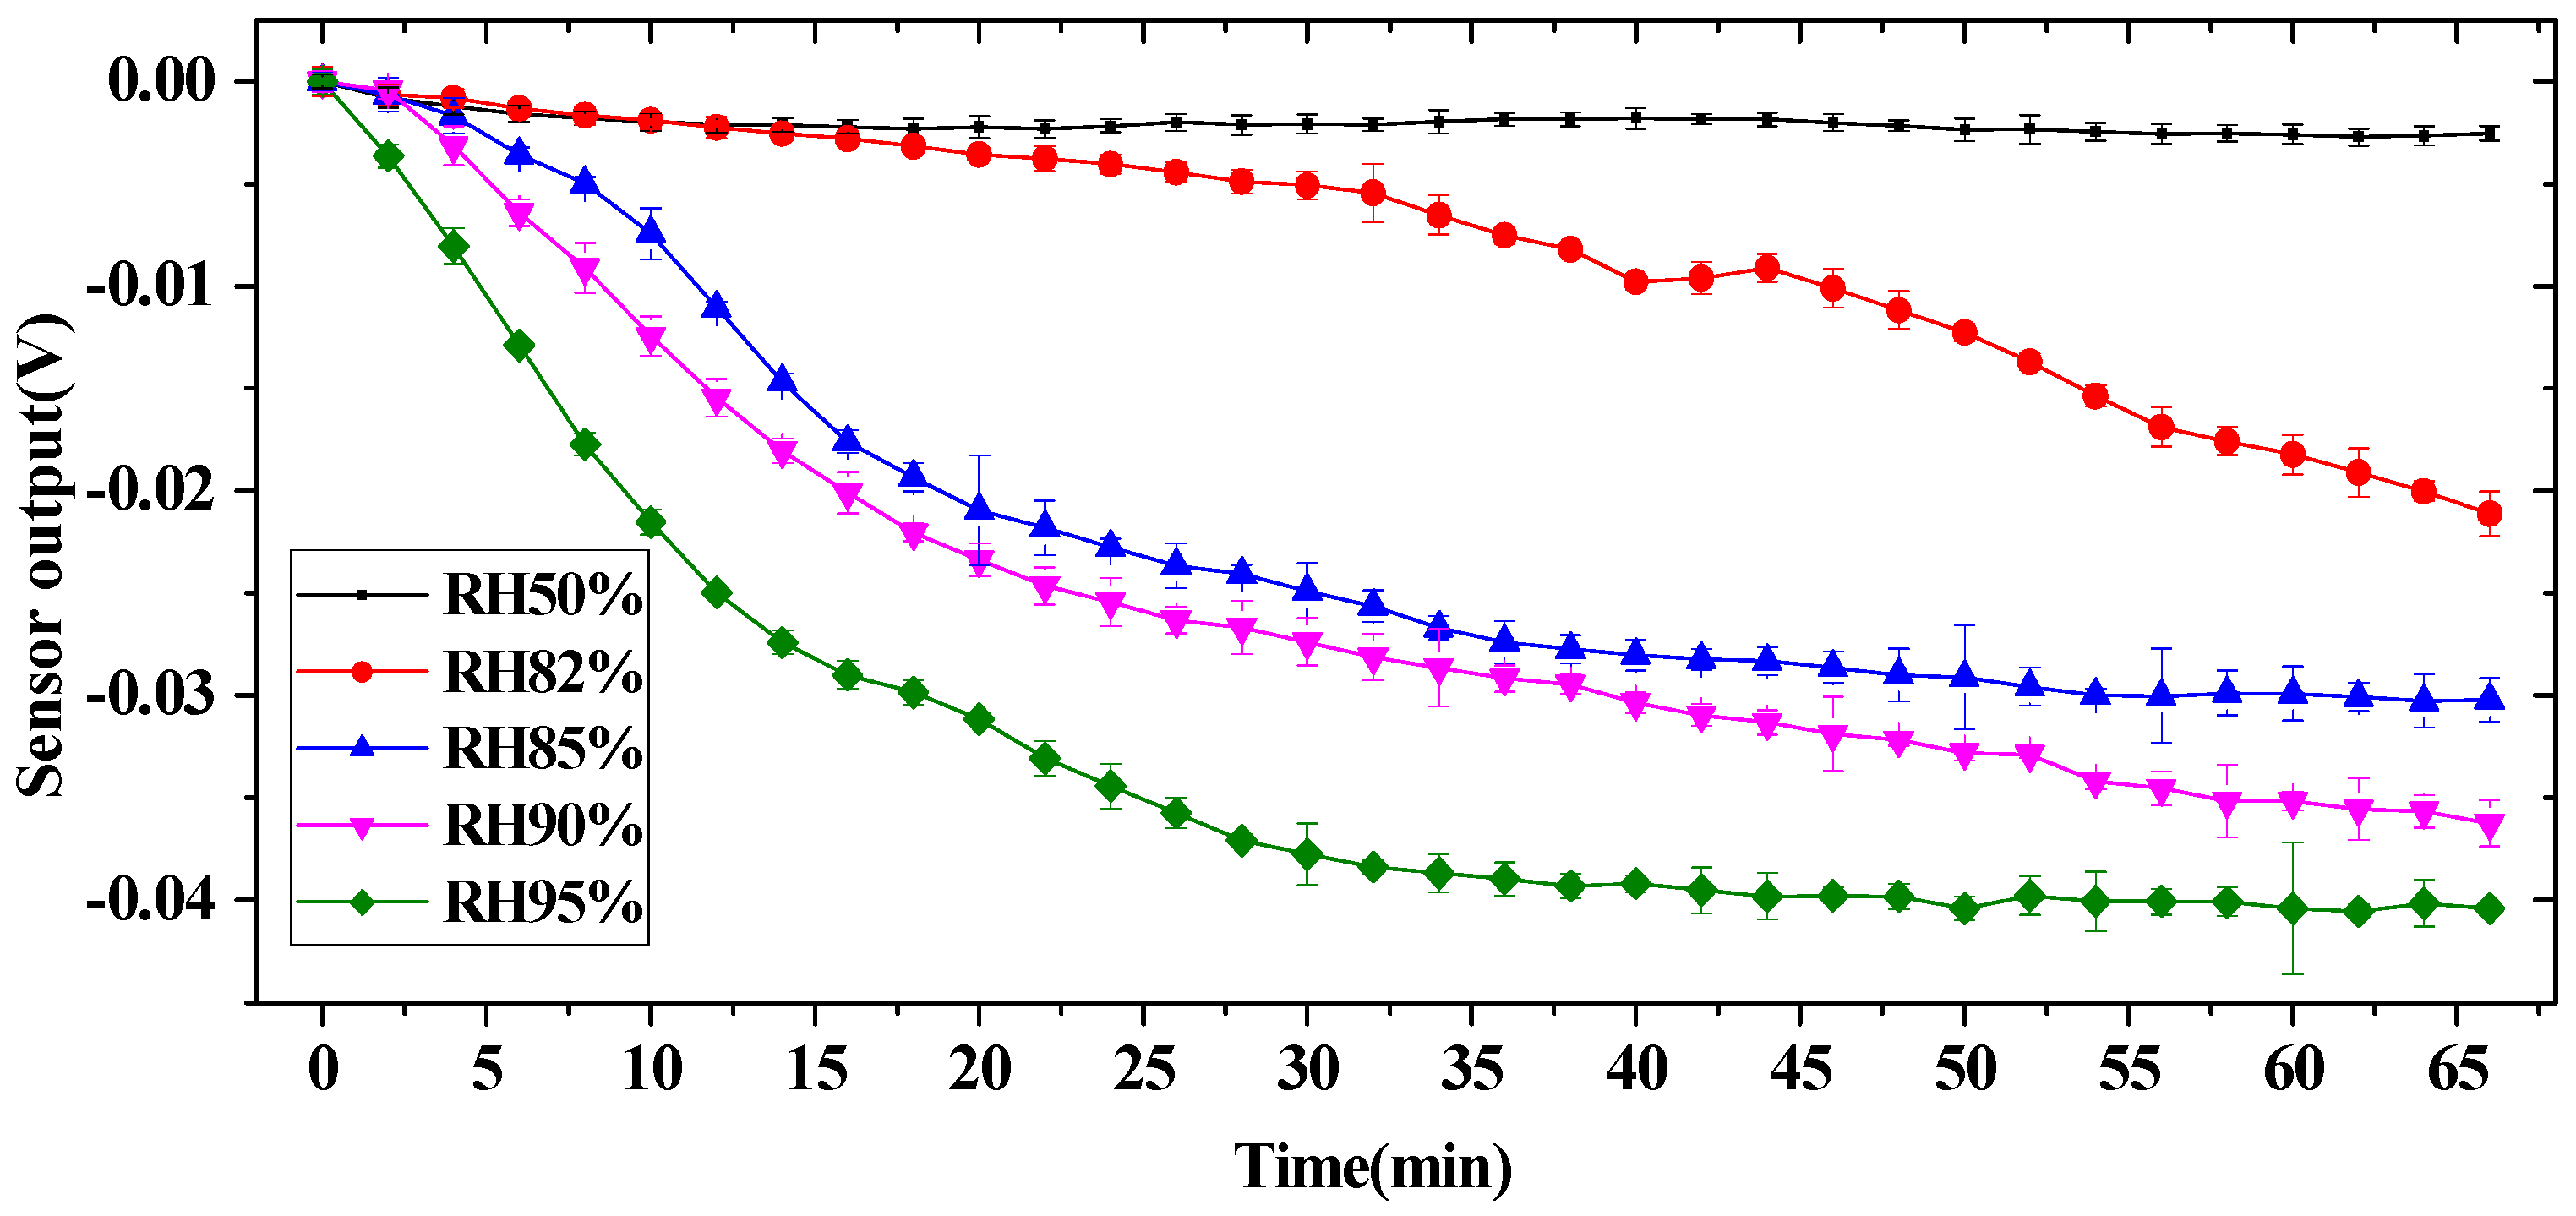
2.3. Experiment and Results

Two experiments were conducted to understand the relationship between the humidity and the airflow sensor output. In first experiment, a controllable moist air cabinet was used to establish a humid environment to mimic human respiratory airflow. An ultrasonic humidifier (LifePlus®) was used to generate an air humidity that was measured by a hygrometer SHT15 (Sensirion®) with a ±2% accuracy in 10%–90% RH and ±3% in 90%–95% RH. A pulse-width-modulation proportional-integral-derivative(PWM-PID) controller was used to keep the environment humidity at a certain constant value. As mentioned before, the water vapors would evaporate simultaneously with the condensation over the sensor surface. The evaporation rate is dependent on the heating temperature of the hot-film and the airflow rate. The condensation rate is dependent on the humidity. When the humidity is lower than a certain value (called the threshold), the evaporation rate is larger than the condensation rate, which means the humidity-induced water film cannot be formed on the sensor surface. When the humidity is higher than the threshold, the condensation rate is larger than the evaporation rate, and the water film accumulates. It means the thickness of the water film condensed on the sensor surface will increase over time. Consequently, sensor drift occurs.
Figure 4 shows the experiment results under different humidity conditions in still air, where error bars representing the standard deviation of uncertainty are provided. The sampling frequency of the respiratory sensor was set as 100 Hz. It was observed that the sensor output decreased over time under a high humidity environment (RH > 82%), whereas the sensor output was comparatively stable under low humidity 50% RH, which indicated that the water film was not formed on the sensor surface due to the evaporation rate being larger than the condensation rate. When the relative humidity was larger than 85%, the sensor output decreased dramatically over time at first and then approached equilibrium, which indicated the water film was gradually thickening and finally approached saturation. The results also show that higher air humidity corresponds to a faster response of the sensor output. Specifically, the response time of the sensor to a higher humidity of 95% RH was about 30 min and over 50 min for 90% RH and 85% RH.
Another measurement on alternating airflow mimicking exhaled and inhaled airflow of human respiration under humidity 98% RH was further conducted by using air pumps to blow the moist airflow into and out of a tube where the hot-film flow sensor was installed. The experiment results are shown in Figure 5, where the peak and valley of the sensor output obviously drift. The valley represents the baseline of the sensor output. The baseline drift deflected the respiratory signals, and brought about a significant error in apnea and hypopnea. Comparatively, the peak-to-peak values of the sensor outputs were less influenced by the humidity.
In practical application, e.g., in clinical testing, the circumstance is more complicated than that of the above simulation test. The airflow humidity is unsteady and the exhaled breathing gas contains complex compounds which also arouse uncertain baseline drifts in the respiratory sensor outputs.

3. Remove Drifts for Respiratory Sensors

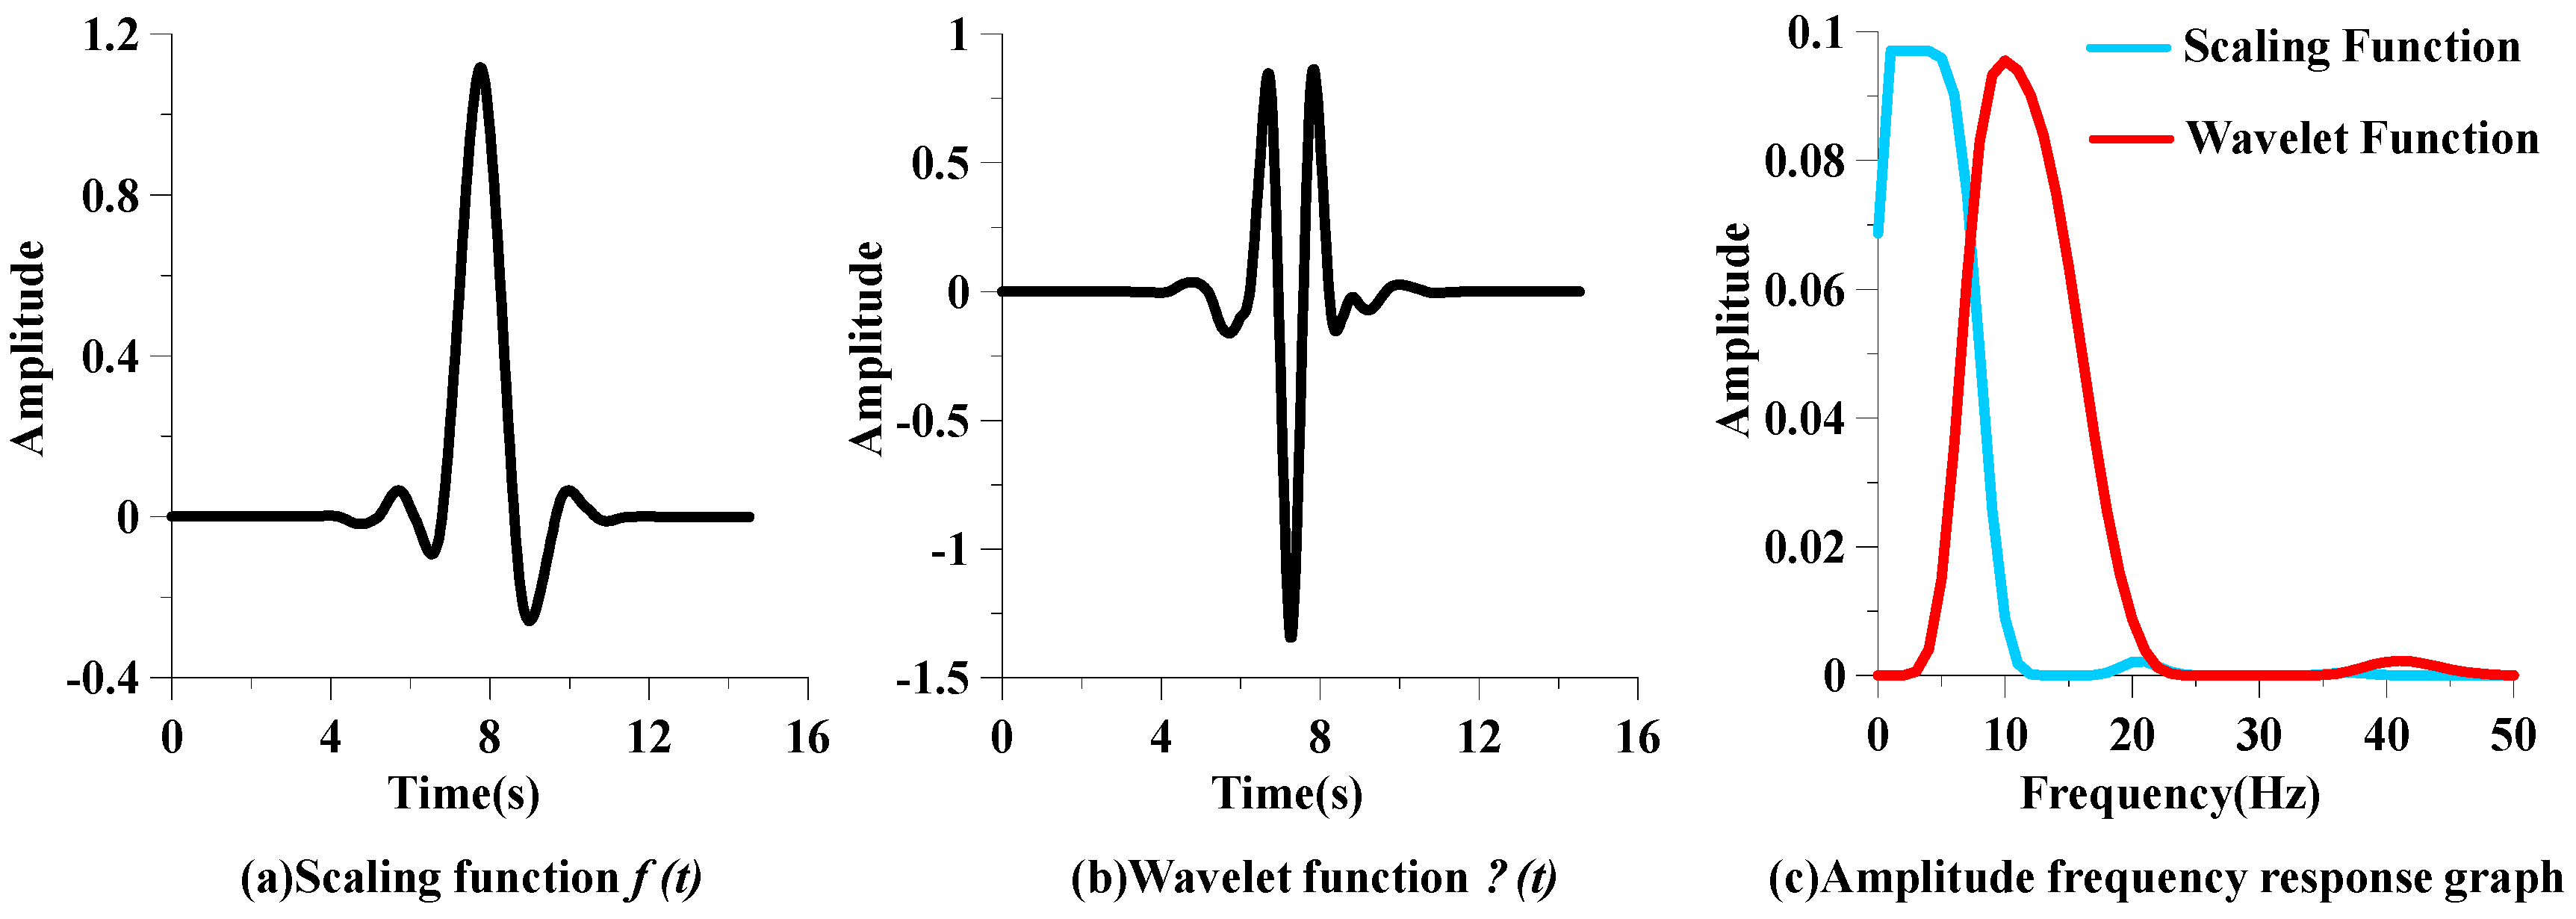
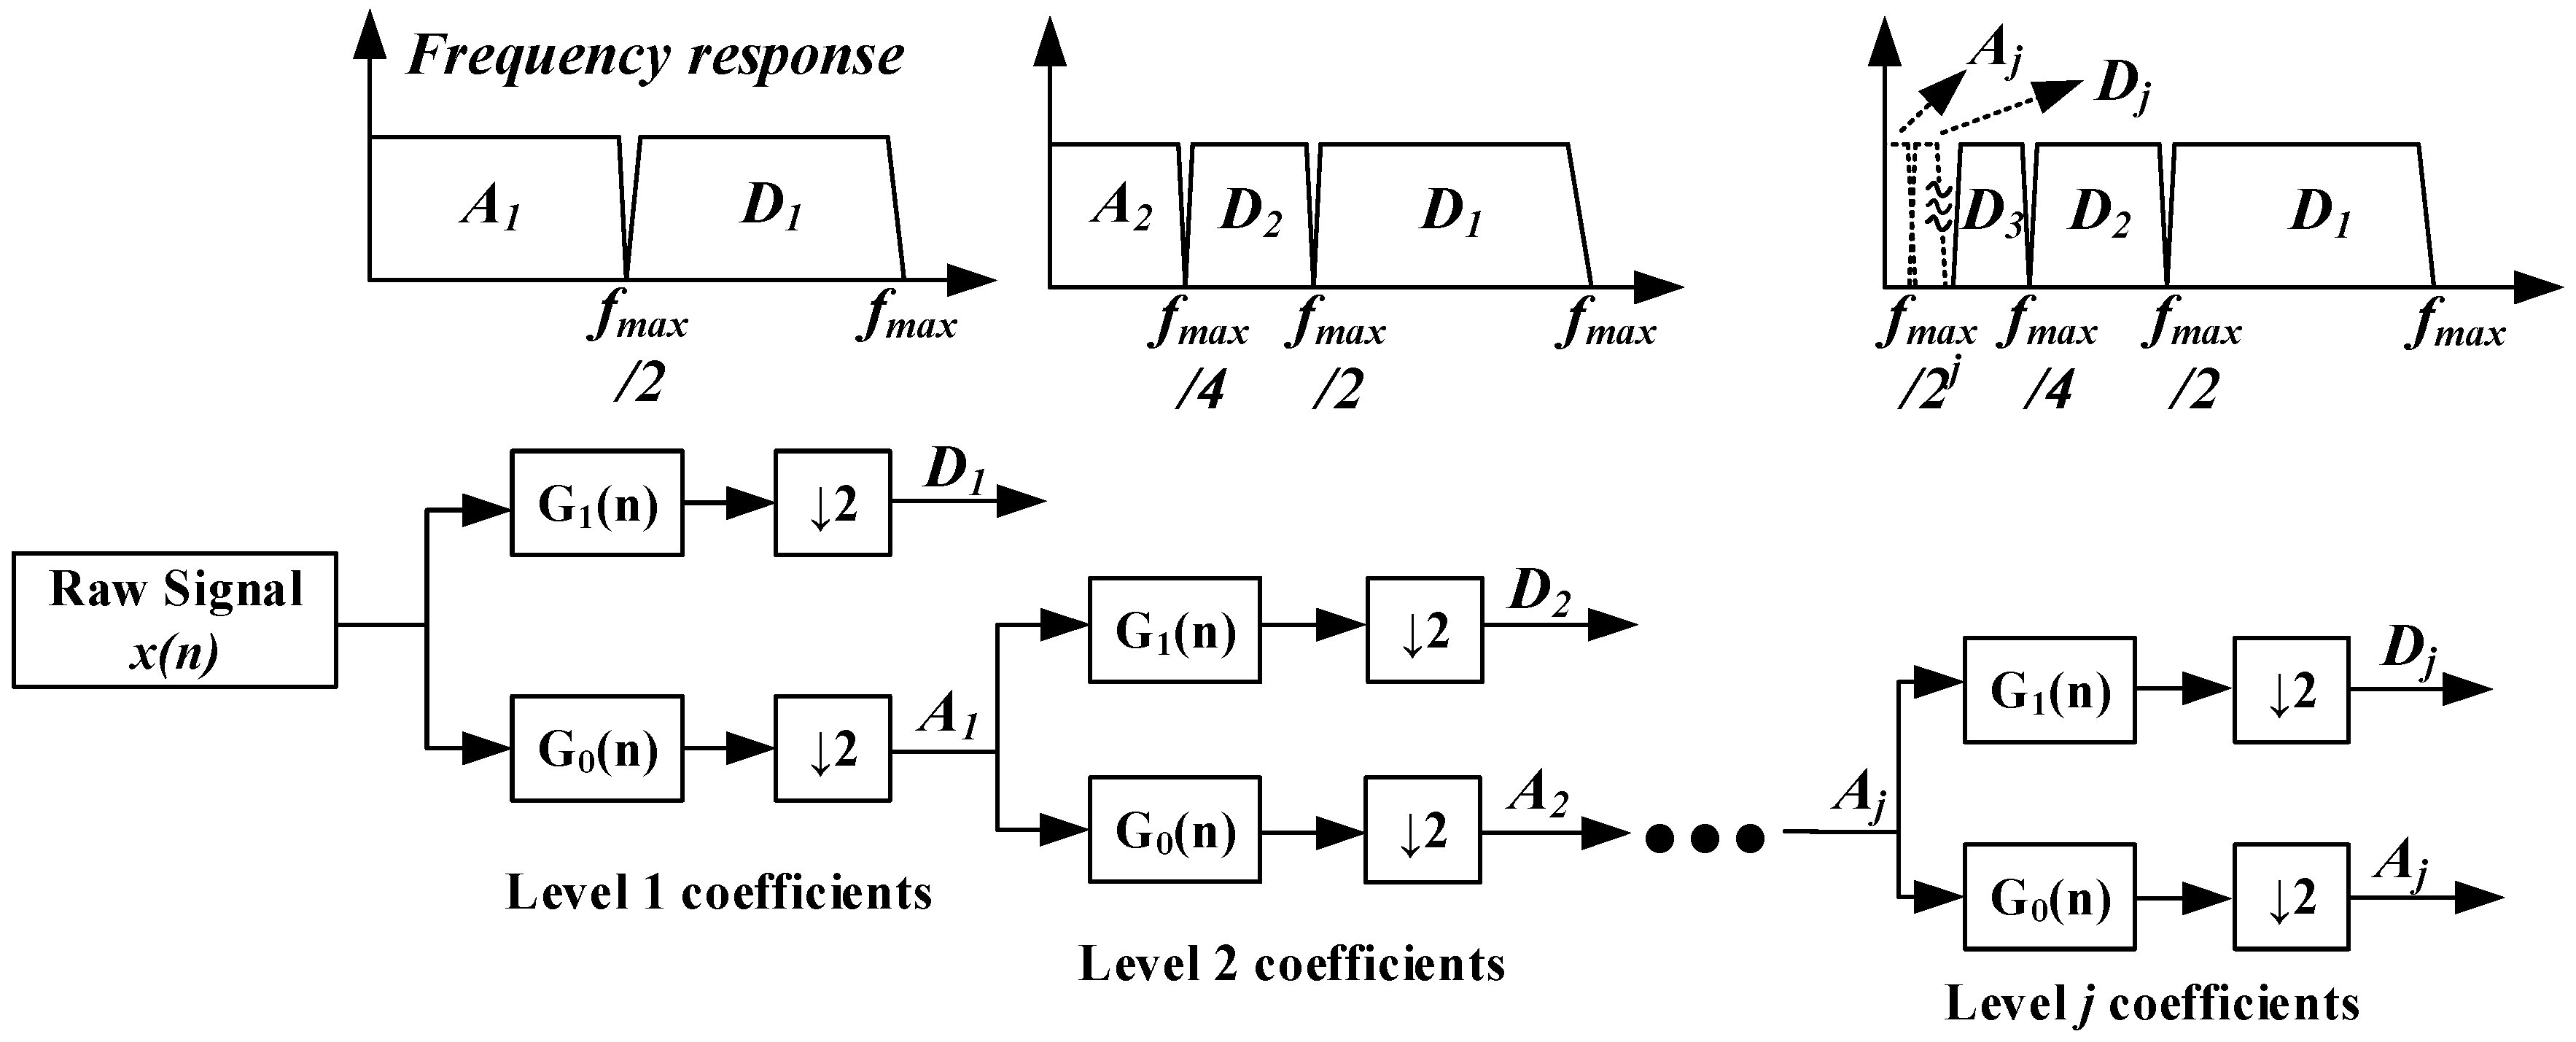
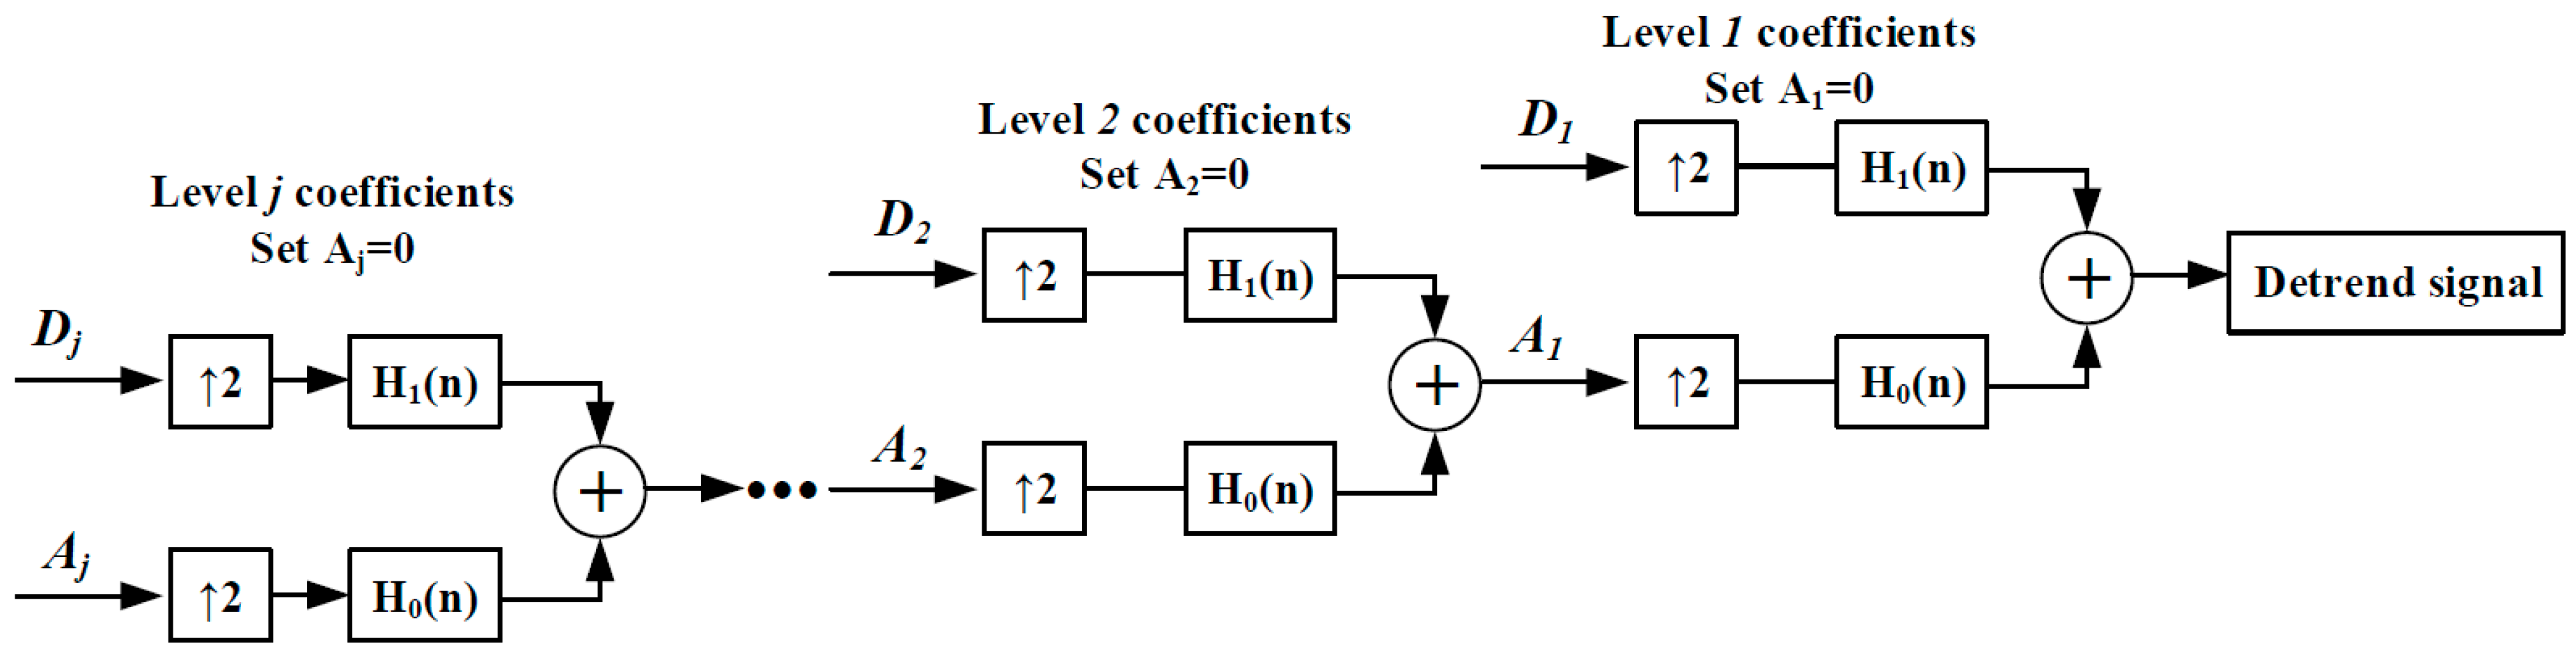
3.1. Wavelet Signal Processing

A wavelet is a wave-like oscillation with an amplitude that begins at zero, increases, and then decreases back to zero [20]. Compared with other wavelet effects, the orthogonal Symlet8 (sym8) wavelet was selected to remove the baseline drift of the respiration signal and retain the apnea-hypopnea features. The Sym8 wavelet [21] has a scaling function, shown in Figure 6a, and a wavelet function, shown in Figure 6b. The amplitude frequency responses of the scaling and wavelet functions of sym are shown in Figure 6c, which reveals the scaling function φ (t) can be regarded as a low-pass filter and the wavelet function ψ (t) is as a band-pass filter.
In discrete wavelet processing, the raw signal x(n) goes through the filter banks G1(n) and G0(n). G1(n) and G0(n) are associated with a half-band low-pass filter φ ( t ) and a half-band high-pass filter ψ ( t ) , as shown in Figure 7. After being filtered by G0(n) and G1(n), half of the samples can be eliminated, which can be seen as the symbol 2 in Figure 7. After a cascade decomposition, the raw signal can be calculated to be a series of low-frequency trend signals A j and a series of high-frequency detail signals D j . It is also called multi-resolution analysis [22]. The trend signal A j contains all of the sensor drifts. The signal D j contains apnea-hypopnea features. To eliminate low-frequency baseline drift and simultaneously retain apnea-hypopnea features, we set each level A j to zero and then reconstruct each level signal; this process is also called the detrend process. The reconstruction process is just a reverse cascade calculation, as shown in Figure 8. H0(n) and H1(n) are inverse sequences of G0(n) and G1(n), which contain the characteristics of low-pass filter G0(n) and high-pass filter G1(n). After a cascade reconstruction, each level of A j is set to zero and up-sampled by two; each D j ( t ) is also up-sampled by 2, as shown in Figure 8.
Using the discrete wavelet detrend processing algorithm, the baseline drift can be well eliminated from the raw respiratory signals. The key parameters of respiration should be set correctly. Normal respiratory frequency is about 8–24 bpm, i.e., about 0.13–0.4 Hz. According to the fact that a cycle of breath includes one inhale and one exhale process, and the hot-film sensor was not capable of identifying the direction of airflow, and thus the frequency of the detected respiratory signal is the double of the real respiratory frequency, i.e., 0.26–0.8 Hz. Therefore, we set 0.2 Hz as the wavelet cut-off frequency of a high-pass filter. All above processings are operated in LabVIEW software. Compared with the conventional band-pass filter, the above wavelet approach has advantages in signal analysis and feature extraction for complex and unsteady human respiratory signals. The wavelet approach can help us to make a multi-resolution analysis of the signal, and thus we can comprehensively understand the signal features. Furthermore, the wavelet approach can give us a means to reconstruct the signals with specific frequency bands, which can be recognized by the wavelet analysis. For example, it is seen that the detected respiratory signal has a frequency of 0.26–0.8 Hz, and an apnea-hypopnea event contains transient signals in 3–8 Hz. To pick up these features, two frequency bands can be used to reconstruct the respiration in the detrend process, where the low-frequency drift and other disturbances (e.g., body movement) can be eliminated.
To validate the processing algorithm, we conducted several sleep respiratory monitorings for OSAHS patients using the hot-film respiratory sensor [15] and a PSG (ALICE 5, PHILIPS RESPIRONICS) simultaneously. The experiments on human subjects were approved by the Ethical Review Board of Tsinghua University (No. 20140084). We chose one patient (60 years old, 175 cm height, weight of 84 kg) as an example. The raw respiration signal detected by the hot-film sensor, the oxygen saturation and nasal pressure detected by a PSG, and the processed signals are demonstrated in Figure 9. Normal breath and typical apnea events are marked to show the apnea feature, where the apnea was identified by a respiratory flow drop of 90% for more than 10 s incorporated with 3% oxygen desaturation [23,24].

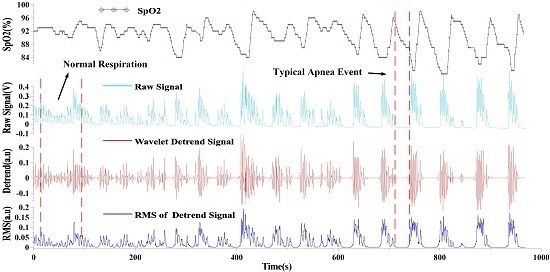
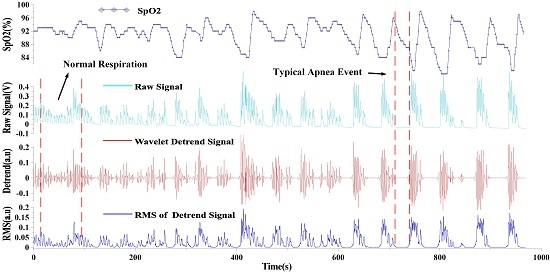
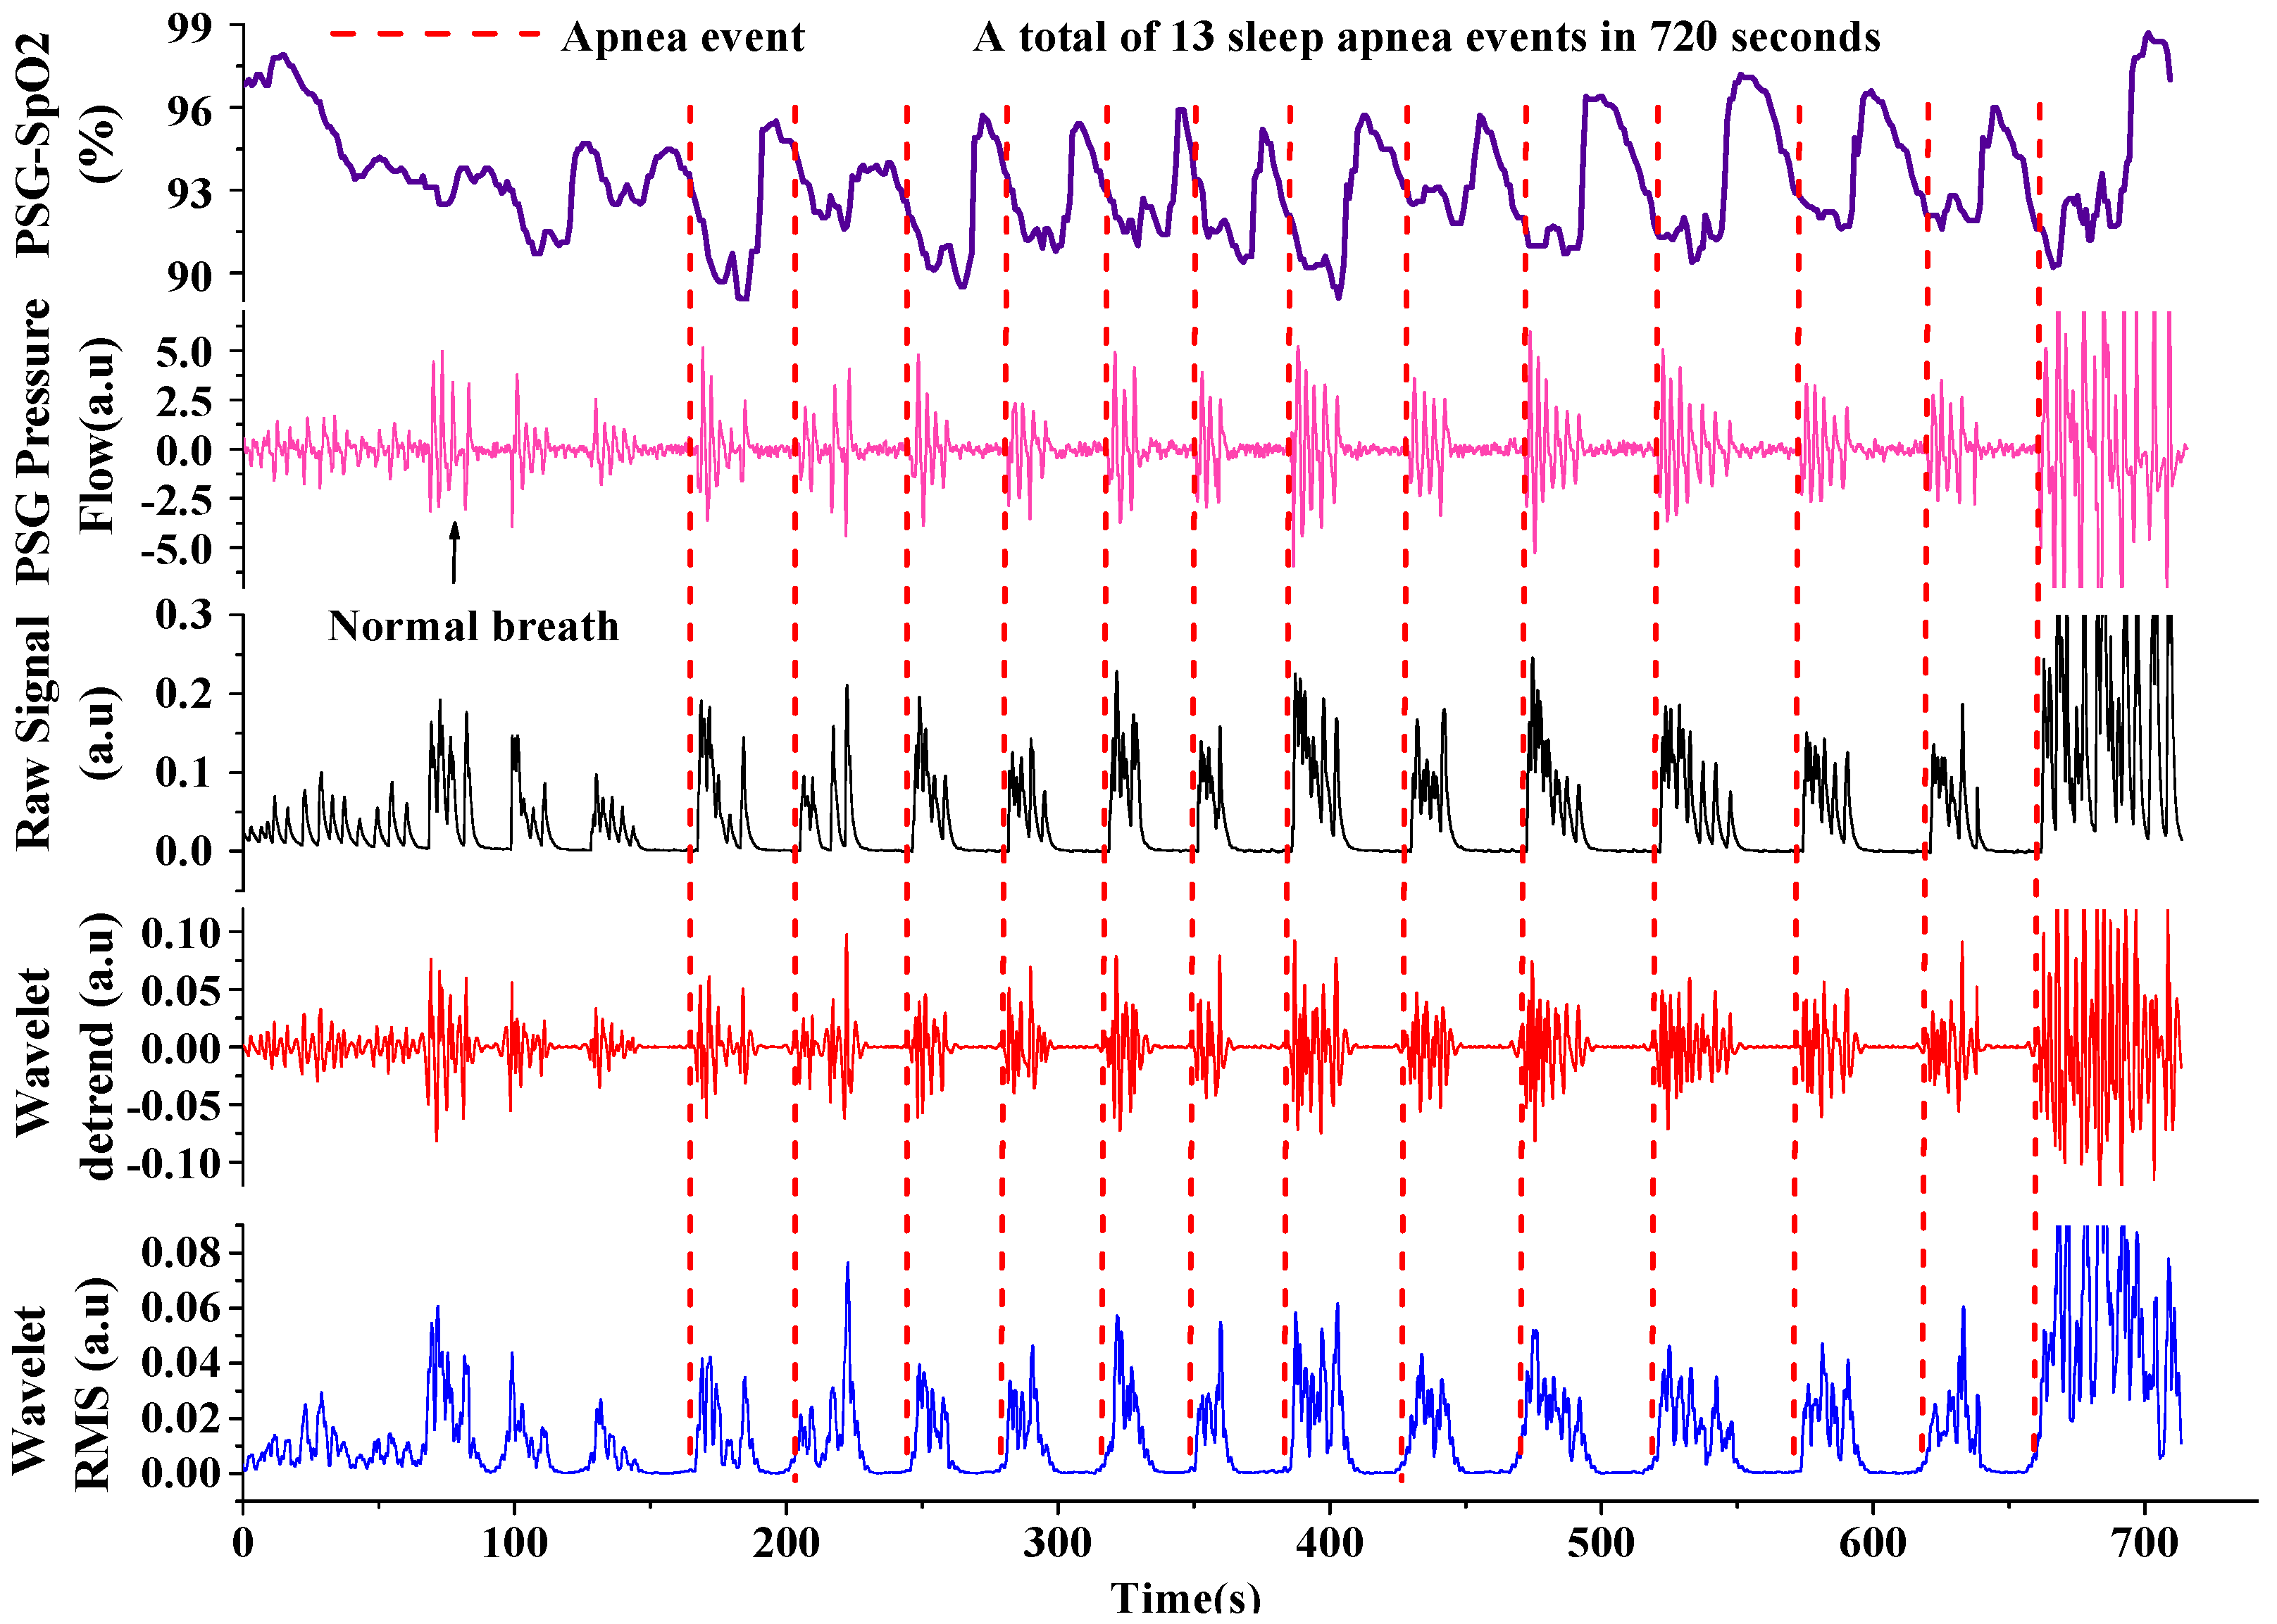
3.2. Extracting Apnea-Hypopnea Events and Results

Figure 10 shows the signal processing algorithm to extract apnea-hypopnea events from the respiratory signals. Firstly, the raw respiratory signals were processed by using the wavelet detrend processing introduced in Section 3.1 to remove the baseline drift.
The modified signals were further processed by a band-pass filter to denoise them. Then the root-mean-square (RMS) of the processed signals was calculated by setting a time window with a width of 1 s and used to identify the apnea-hypopnea events according to specific threshold values, such as 50% of the average peak value of pre-event respiration for hypopnea and 10% for apnea [23]. The index of the gold standard PSG served as an indicator to evaluate our device and algorithm. Table 1 lists the apnea-hypopnea index (AHI) figured out from the whole night’s sleep monitoring data of seven OSAHS patients by using our device and PSG at the same time. AHI is an index used to indicate the severity of sleep apnea, which is represented by the number of apnea and hypopnea events occurring per hour during sleep (normal 0–5, mild 5–15, moderate 15–30, severe >30). The comparison results indicate that the effective ratio of the proposed device and algorithm for extracting the apnea-hypopnea events is more than 95%. The current limitation of our study is the insufficience of clinical test for a larger sample of patients, which will be done in our future work. In addition, the methodology will be further optimized in self-adaptability and on-line operations.

4. Conclusions

In this paper, we theoretically analyzed and eliminated the baseline drift of the respiration sensor induced by moist respiratory airflow. It has been shown that human exhaled air contains a lot of water vapor, a long exposure duration to which makes leads to respiratory sensor drift. To overcome the humidity-induced baseline drift and extract apnea-hypopnea events from the monitored respiratory signals, a wavelet-based processing algorithm was proposed. The proposed signal processing was used to automatically extract the apnea-hypopnea events from the monitored respiratory signals of OSAHS patients and compared with PSG results. The effective ratio of AHI extraction is more than 95%, which validates the effectiveness of the drift elimination and feature extraction methodology. The proposed wavelet detrend method can be used for eliminating not only humidity drifts but also other drifts induced by elements such as temperature variation, tilt variation of the monitor, etc.

Acknowledgments

This work was financially supported by the National High-tech Program “863” of China under Grant No. 2012AA02A604.

Author Contributions

Peng Jiang developed the system and the algorithm, conducted the experiments, and wrote the article under the supervision of Rong Zhu.

Conflicts of Interest

The authors declare no conflict of interest.

References

  1. Martens, S.M.M.; Rabotti, C.; Mischi, M.; Sluijter, R.J. A robust fetal ECG detection method for abdominal recordings. Physiol. Meas. 2007, 28, 373. [Google Scholar] [CrossRef] [PubMed]
  2. Libourel, P.-A.; Corneyllie, A.; Luppi, P.-H.; Chouvet, G.; Gervasoni, D. Unsupervised online classifier in sleep scoring for sleep deprivation studies. Sleep 2015, 38, 815–828. [Google Scholar] [CrossRef] [PubMed]
  3. Addison, P.S.; Watson, J.N.; Mestek, M.L.; Ochs, J.P.; Uribe, A.A.; Bergese, S.D. Pulse oximetry-derived respiratory rate in general care floor patients. J. Clin. Monit. Comput. 2015, 29, 113–120. [Google Scholar] [CrossRef] [PubMed]
  4. Liu, Q.; Hu, X.; Ye, M.; Cheng, X.; Li, F. Gas Recognition under Sensor Drift by Using Deep Learning. Int. J. Intell. Syst. 2015, 30, 907–922. [Google Scholar] [CrossRef]
  5. Deshmukh, S.; Bandyopadhyay, R.; Bhattacharyya, N.; Pandey, R.; Jana, A. Application of electronic nose for industrial odors and gaseous emissions measurement and monitoring, an overview. Talanta 2015, 144, 329–340. [Google Scholar] [CrossRef] [PubMed]
  6. World Health Organization. The 10 Leading Causes of Death in the World, 2000 and 2012; World Health Organization: Geneva, Switzerland, 2014. [Google Scholar]
  7. Jain, C.D.; Bhaskar, D.J.; Kalra, M.; Gandhi, R.; Bohra, P. Recent Improvements in the Management of Obstructive Sleep Apnea: The Dental Perception. Int. J. Adv. Health Sci. 2015, 1, 7–10. [Google Scholar]
  8. Vaessen, T.J.; Overeem, S.; Sitskoorn, M.M. Cognitive complaints in obstructive sleep apnea. Sleep Med. Rev. 2015, 19, 51–58. [Google Scholar] [CrossRef] [PubMed]
  9. Tan, H.-L.; Gozal, D.; Ramirez, H.M.; Bandla, H.P.; Kheirandish-Gozal, L. Overnight polysomnography versus respiratory polygraphy in the diagnosis of pediatric obstructive sleep apnea. Sleep 2014, 37, 255–260. [Google Scholar] [CrossRef] [PubMed]
  10. Tardi, G.; Massaroni, C.; Saccomandi, P.; Schena, E. Experimental Assessment of a Variable Orifice Flowmeter for Respiratory Monitoring. J. Sens. 2015, 2015, 752540. [Google Scholar] [CrossRef]
  11. Schena, E.; Massaroni, C.; Saccomandi, P.; Cecchini, S. Flow measurement in mechanical ventilation: A review. Med. Eng. Phys. 2015, 37, 257–264. [Google Scholar] [CrossRef] [PubMed]
  12. Snepvangers, Y.; de Winter, P.; Burger, H.; Brouwers, H.A.; Bogaard, J.M.; van der Ent, K. Correction factors for oxygen and flow-rate effects on neonatal Fleisch and Lilly pneumotachometers. Pediatr. Crit. Care Med. 2003, 4, 227–232. [Google Scholar] [CrossRef] [PubMed] [Green Version]
  13. Schena, E.; Cecchini, S.; Silvestri, S. An orifice meter for bidirectional air flow measurements: Influence of gas thermo-hygrometric content on static response and bidirectionality. Flow Meas. Instrum. 2013, 34, 105–112. [Google Scholar] [CrossRef]
  14. Konvalina, G.; Haick, H. Sensors for breath testing: from nanomaterials to comprehensive disease detection. Acc. Chem. Res. 2013, 47, 66–76. [Google Scholar] [CrossRef] [PubMed]
  15. Cao, Z.; Zhu, R.; Que, R. A Wireless Portable System with Micro Sensors for Monitoring Respiratory Diseases. IEEE Trans. Biomed. Eng. 2012, 59, 3110–3116. [Google Scholar] [PubMed]
  16. Jiang, P.; Zhao, S.; Zhu, R. Smart Sensing Strip Using Monolithically Integrated Flexible Flow Sensor for Noninvasively Monitoring Respiratory Flow. Sensors 2015, 15, 31738–31750. [Google Scholar] [CrossRef] [PubMed]
  17. Hramov, A.E.; Koronovskii, A.A.; Makarov, V.A.; Pavlov, A.N.; Sitnikova, E. Wavelets in Neuroscience; Springer: Berlin, Germany, 2015. [Google Scholar]
  18. Zhu, R.; Que, R.; Cao, Z. Micro thermal flow sensors/systems on flexible PCB and extensive applications. In Proceedings of the 8th IEEE International Conference on Nano/Micro Engineered and Molecular Systems (NEMS), Suzhou, China, 7–10 April 2013; pp. 179–182.
  19. Multiphysics, C.; Module, C.M.H.T. COMSOL Multiphysics User’s Guide. In Version: COMSOL Multiphysics; COMSOL Inc.: Burlington, MA, USA, 2014. [Google Scholar]
  20. Addison, P.S. The Illustrated Wavelet Transform Handbook: Introductory Theory and Applications in Science, Engineering, Medicine And Finance; IOP Publishing: Bristol, UK, 2002. [Google Scholar]
  21. Daubechies, I. Ten Lectures on Wavelets; Society for Industrial and Applied Mathematics: Philadelphia, PA, USA, 1992; Volume 61. [Google Scholar]
  22. Abo-Zahhad, M.; Al-Ajlouni, A.F.; Ahmed, S.M.; Schilling, R.J. A new algorithm for the compression of ECG signals based on mother wavelet parameterization and best-threshold levels selection. Digit. Signal Process. 2013, 23, 1002–1011. [Google Scholar] [CrossRef]
  23. Berry, R.B.; Brooks, R.; Gamaldo, C.E.; Harding, S.M.; Marcus, C.L.; Vaughn, B.V. The AASM Manual for the Scoring of Sleep and Associated Events: Rules, Terminology and Technical Specifications; American Academy of Sleep Medicine: Darien, IL, USA, 2012. [Google Scholar]
  24. De Backer, W. Obstructive sleep apnea/hypopnea syndrome. Panminerva Med. 2013, 55, 191–195. [Google Scholar] [PubMed]
Figure 1. (a) Hot-film installation in a tube for respiration monitoring; (b) Hot-film installation on surface of sensing strip adhered underneath nostril.
Sensors 16 01779 g001
Figure 2. (a) Configuration of hot-film sensor; (b) Sensor prototype; (c) CTD circuit.
Sensors 16 01779 g002
Figure 3. (a) Schematic view of hot-film covered by thin water film in 98% RH wet air; (b) Simulated temperature distribution around the hot-film; (c) Hot-film temperature changing with the thickness of the water film.
Sensors 16 01779 g003
Figure 4. Sensor drift under different humidity environments.
Sensors 16 01779 g004
Figure 5. Measurements on alternating airflow mimicking respiratory fluctuation in moist air.
Sensors 16 01779 g005
Figure 6. Sym8 scaling function and wavelet function with their amplitude frequency response.
Sensors 16 01779 g006
Figure 7. Discrete wavelet transform decomposition processing diagram.
Sensors 16 01779 g007
Figure 8. DWT-based reconstructed signal for drift elimination.
Sensors 16 01779 g008
Figure 9. Identification of apnea-hypopnea events from respiratory signals by the wavelet algorithm.
Sensors 16 01779 g009
Figure 10. Feature extraction algorithm for apnea and hypopnea events.
Sensors 16 01779 g010
Table 1. Apnea-hypopnea events extracted by PSG and the proposed respirometry.
PatientsInfomationPSG Total TimesOur Device Total TimesAHI (times/h)Effective Ratio
AgeSexPSGDevice
Patient 131Female259266373897.3% Good
Patient 234Male517507706898.1% Good
Patient 370Male115117272798.3% Good
Patient 455Female327336545597.2% Good
Patient 545Male125129202196.8% Good
Patient 673Male356345565496.9 % Good
Patient 760Male393410596195.7% Good

