Article

Analysis of Hollow Fiber Temperature Sensor Filled with Graphene-Ag Composite Nanowire and Liquid

1
College of Precision Instrument and Opto-Electronics Engineering, Tianjin University, Tianjin 300072, China
2
School of Electronics and Information Engineering, Tianjin Polytechnic University, Tianjin 300387, China
*
Author to whom correspondence should be addressed.
These authors contributed equally to this work.
Sensors 2016, 16(10), 1656; https://doi.org/10.3390/s16101656
Submission received: 19 August 2016 / Revised: 29 September 2016 / Accepted: 29 September 2016 / Published: 8 October 2016
(This article belongs to the Section Physical Sensors)

Abstract

:
A hollow fiber temperature sensor filled with graphene-Ag composite nanowire and liquid is presented and numerically characterized. The coupling properties and sensing performances are analyzed by finite element method (FEM) using both wavelength and amplitude interrogations. Due to the asymmetrical surface plasmon resonance sensing (SPR) region, the designed sensor exhibits strong birefringence, supporting two separate resonance peaks in orthogonal polarizations. Results show that x-polarized resonance peak can provide much better signal to noise ratio (SNR), wavelength and amplitude sensitivities than y-polarized, which is more suitable for tempertature detecting. The graphene-Ag composite nanowire filled into the hollow fiber core can not only solve the oxidation problem but also avoid the metal coating. A wide temperature range from 22 C to 47 C with steps of 5 C is calculated and the temperature sensitivities we obtained are 9.44 nm/ C for x-polarized and 5.33 nm/ C for y-polarized, much higher than other sensors of the same type.

1. Introduction

Photonics crystal fiber (PCF) [1,2], which is also called micro-structured optical fiber (MOF) has attracted considerable research interest in recent years due to its special structure and unique properties. PCFs are usually divided into two categories according to the guiding mechanisms. One category is refractive index-guiding, the other is photonic bandgap(BG)-guiding. Different kinds of PCFs can introduce some new applications by filling the air holes with different materials [3]. Moreover, it is possible to infiltrate functional materials into the air holes of those PCFs, which can tune the effective refractive index ( n e f f ) of the core guided mode efficiently, solving the mode coupling problem. Recently, various kinds of sensors based on PCF have been reported. They are used to measure factors such as temperature [4], strain [5], vibration [6], twist [7], refractive index (RI) [8], gas absorption [9], magnetic field [10] and so on, which are widely applied in chemical, physical and biochemical sensing fields.
Surface plasmon (SP) is a charge density wave of free electrons that occurs on the surface of a thin metal film interfacing with an adjacent dielectric. The amplitude of enhanced electric field reaches its maximum value at the metal surface and decays exponentially away from it [11]. Surface plasmon resonance (SPR) occurs at a certain frequency under the condition of phase matching between SPs and p-polarized incident light. Plasmon modes can also form on the metal wire [12] and the localized SPR (LSPR) [13] can be excited. Then, the metal coating or selective metal coating problem can be avoided by filling metal nanoparticles. Luan et al. [14] presented a temperature sensor based on PCF filled with silver nanowires and achieved a sensitivity 4 nm/ C. Peng et al. [3] proposed the same type sensor with PCF selectively filled with liquid and gold nanoparticles, and a temperature sensitivity of −5.5 nm/ C is realized by an experiment using the bandgap-like effect.
In this work, a temperature sensor based on a hollow fiber (HF) is presented and numerically analyzed. The air hole in the fiber core is filled with graphene-Ag composite nanowire and liquid ( n = 1 . 55 at 26.9 C, α = - 4 . 15 × 10 - 4 / C) to form the sensing region. The RI of the liquid is higher than fused silica, which can satisfy the condition of total reflection. As the silver nanowire is asymmetrical to the fiber core, the sensor exhibits strong birefringence. One mode (y-pol) is polarized essentially parallel to the axis of symmetry and the other mode (x-pol) is orthogonal to it. The grapheme-Ag composite nanowire can not only solve the metal coating problem but also improve the sensitivity. Simulation results show that x-pol is better for temperature detecting due to its higher signal to noise ratio (SNR), wavelength and amplitude sensitivities than y-pol. A wide temperature range from 22 C to 47 C with steps of 5 C is calculated and the increased temperature sensitivities obtained are 9.44 nm/ C for x-pol and 5.33 nm/ C for y-pol, which are much higher than those in other sensors of same type as described in [3,14].

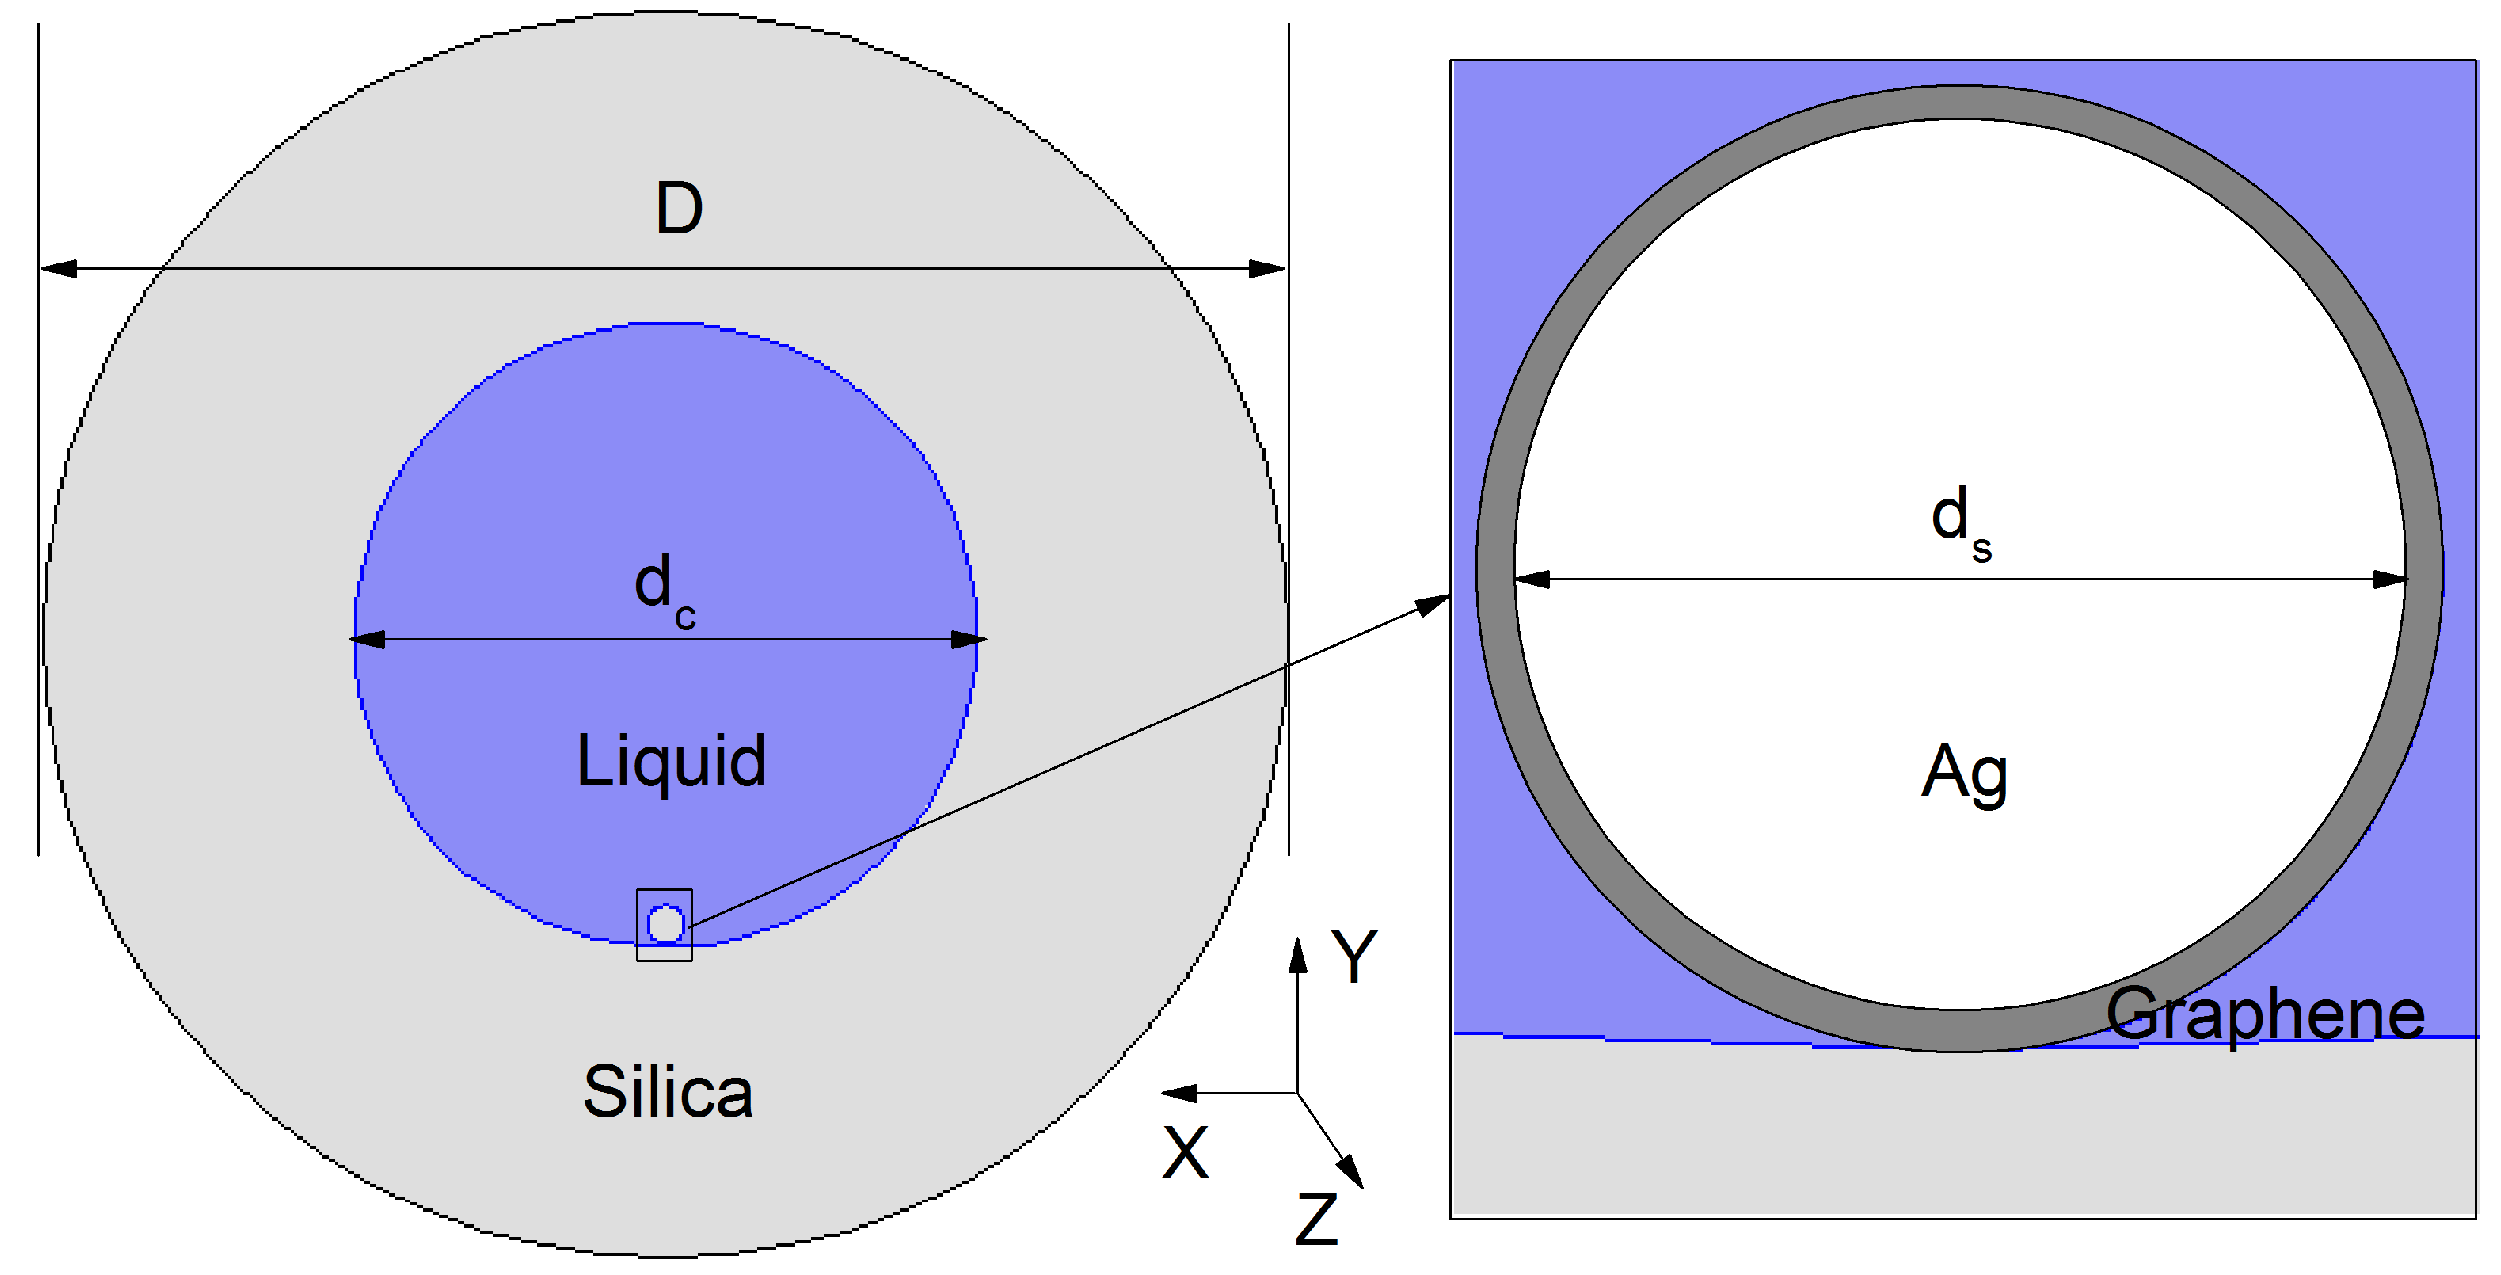
2. Sensor Design and Numerical Modeling

The cross section of the designed sensor is shown in Figure 1. The diameters of the fiber, the core, and the nanowire are D = 40 μ m, d c = 20 μ m, and d s = 1 μ m, respectively. The nanowire and the liquid are filled into the fiber core and eventually the nanowire sinks to the bottom of the inner surface because of gravity effects. The filling process should be easy to operate because the holes of the HFs are available over a relatively wide range of diameter, from several hundred microns to several millimeters or more [8,15]. Graphene’s good features as high electron density of hexagonal rings, high surface to volume ratio, broadband optical and plasmonic properties make it an appropriate candidate to be used as a functional coating material for existing plasmonic devices. The graphene-Ag composite nanowire can solve the metal coating and silver oxidation problem, and improve the sensitivity [16,17,18]. The RI of graphene is calculated by [17]:
n g = 3 + i C 1 λ 3 ,
where C 1 = 5.446 μ m - 1 , n g is the RI of graphene and λ is the vacuum wavelength. The total thickness of the graphene layer is 0.34 × L as each single layer is 0.34 nm, where L is the number of graphene layers. In Figure 1, the Ag nanowire is coated with a single graphene layer. The thermo-optic coefficient of the filling liquid we used is α = - 4 . 15 × 10 - 4 / C as described in [19]. The background material of the HF is fused silica and the RI is assumed to be 1.45. The RI of Ag is referred to in [20].
We use the finite element method (FEM) to calculate with COMSOL Multiphysics software. The boundary condition is the perfectly matched layer (PML) and the whole section of the sensor in Figure 1 is divided into 183,578 triangular subdomains. The modal analysis is simulated in the XY plane and the light is propagated along the Z direction.
The dispersion relationship between core guided modes and plasmon modes at temperature T = 22 C is shown in Figure 2. Obviously, we can see that the asymmetrical SPR region leads to strong birefringence and most of the light is coupled into a particular direction. Two real parts of n e f f of the core guided modes (black solid and black dotted curves) and plasmon modes (red solid and red dotted curves) result in two different intersections and resonance peaks (blue solid and blue dotted curves) for the same analyte of RI. When SPR occurs, most of the energy transfers from the core-guided mode to the plasmon mode and the resonant loss peak will be formed at the resonance wavelength.

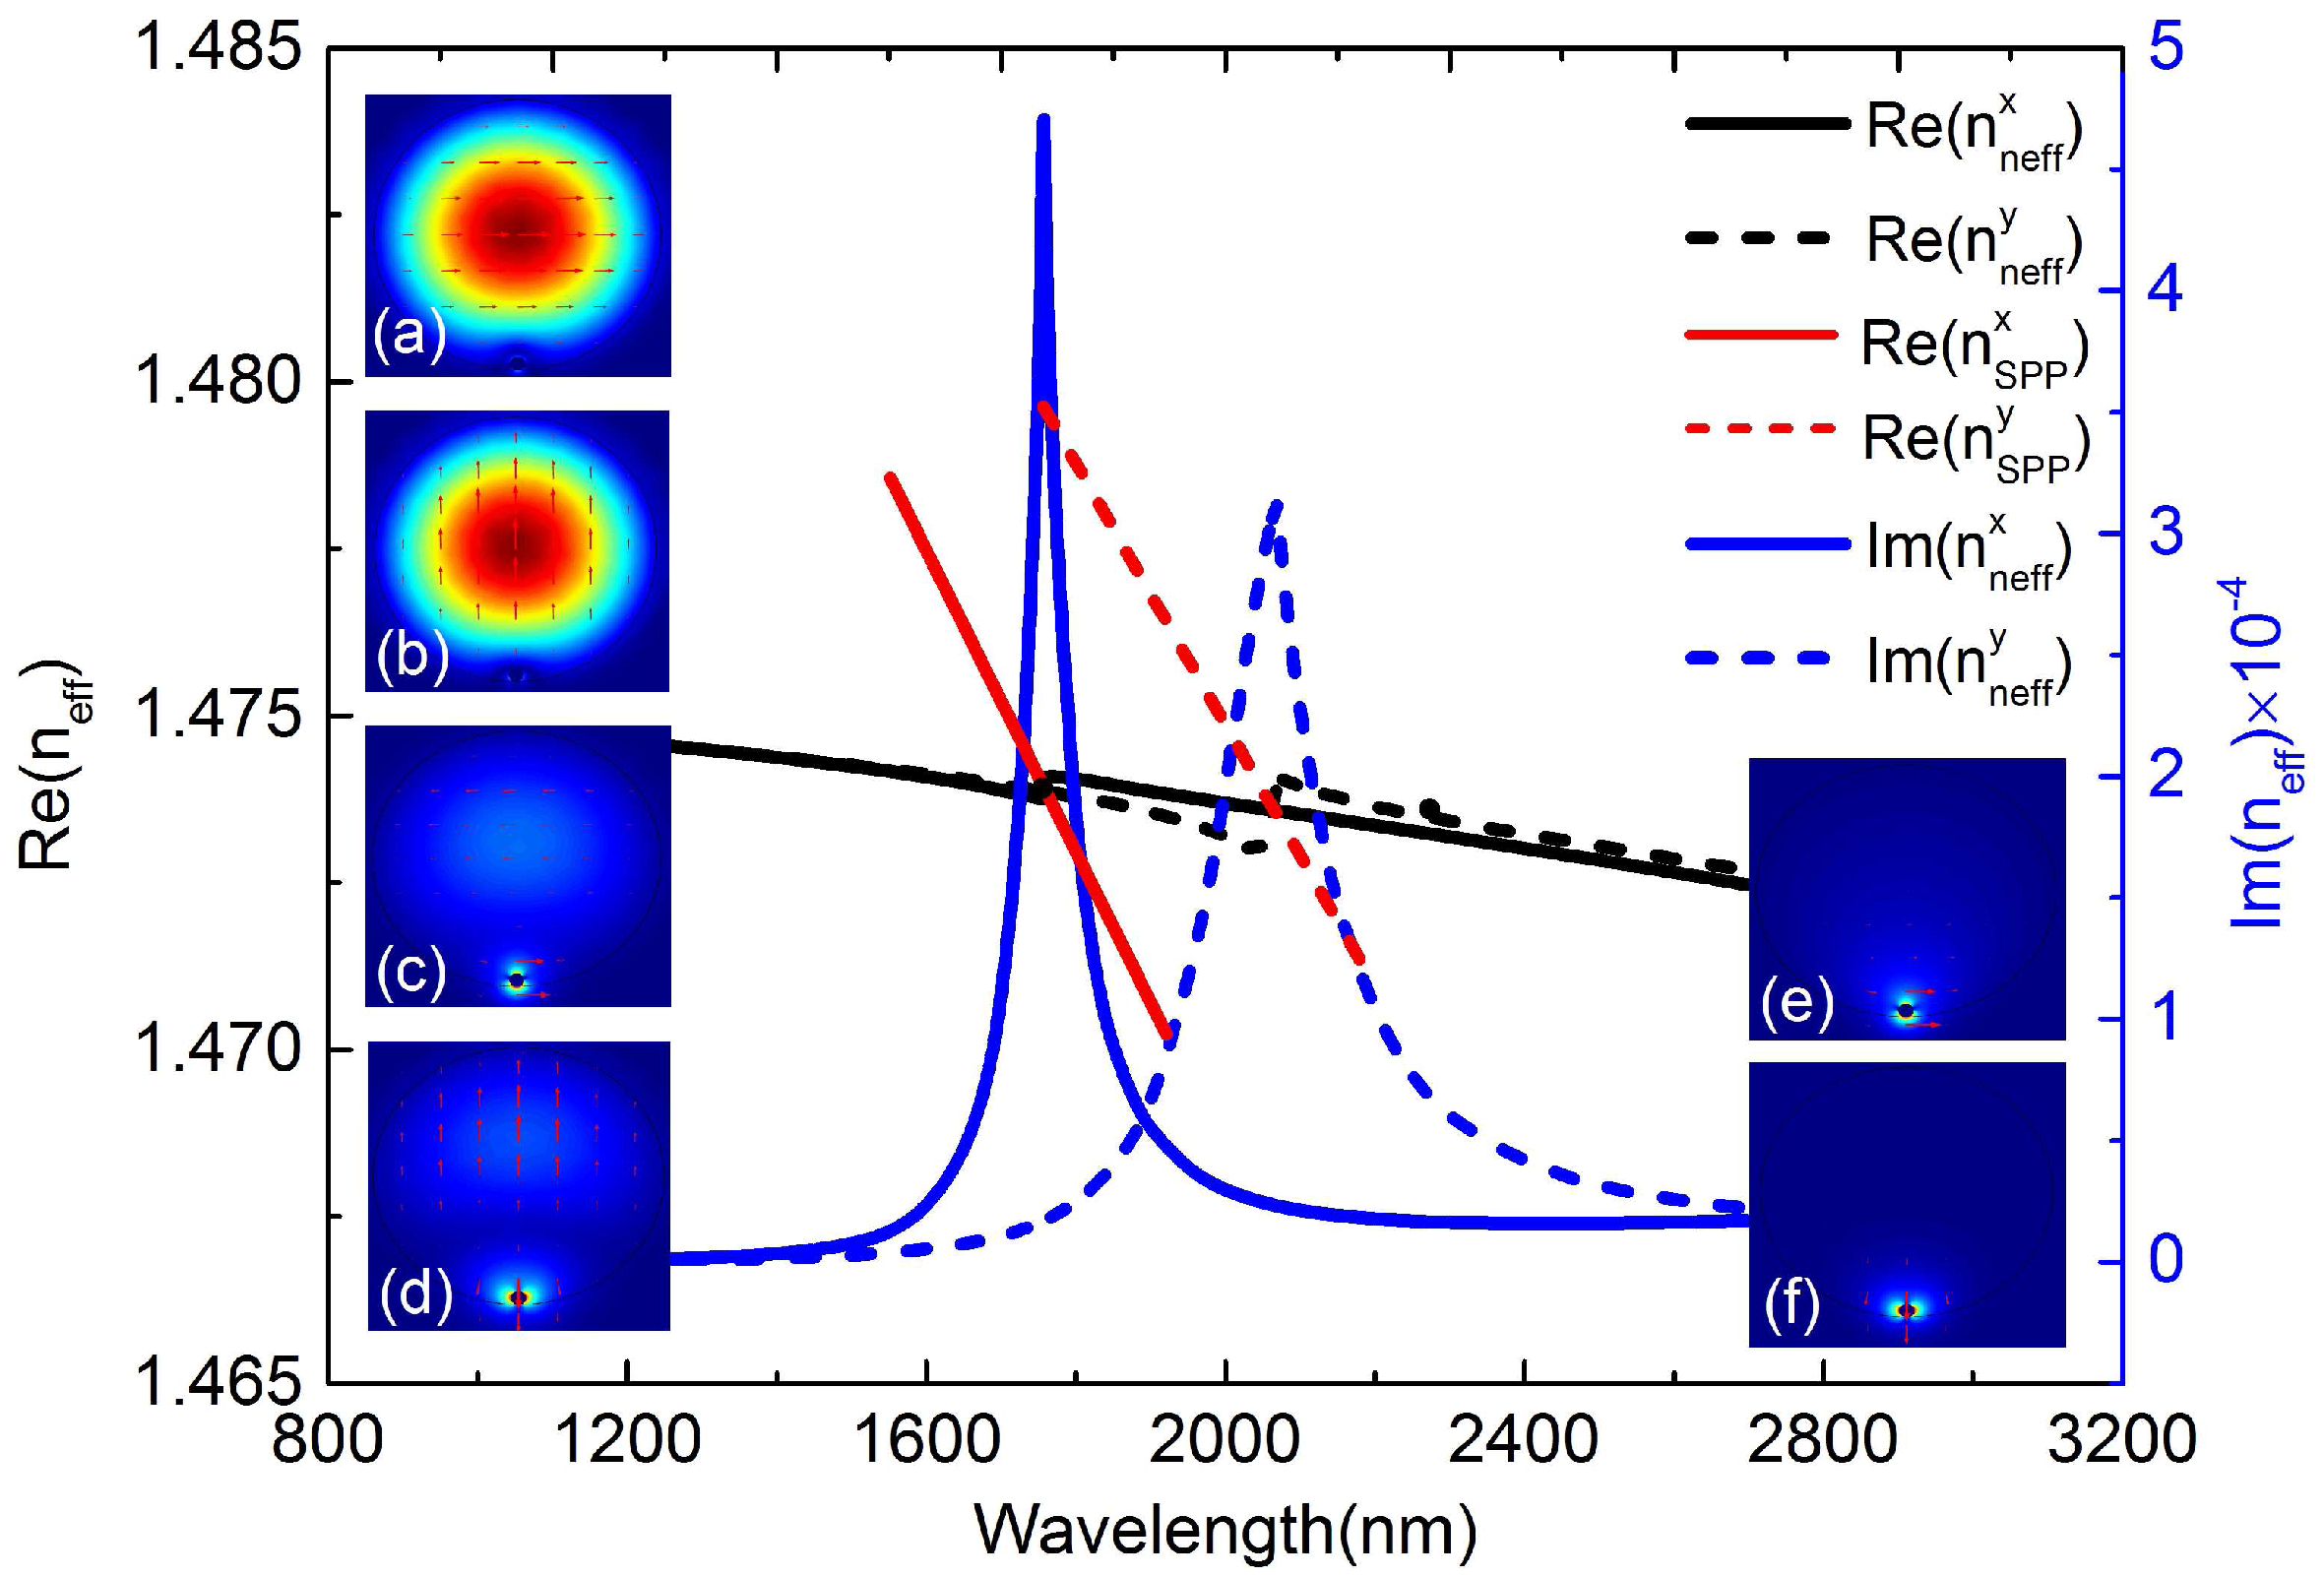
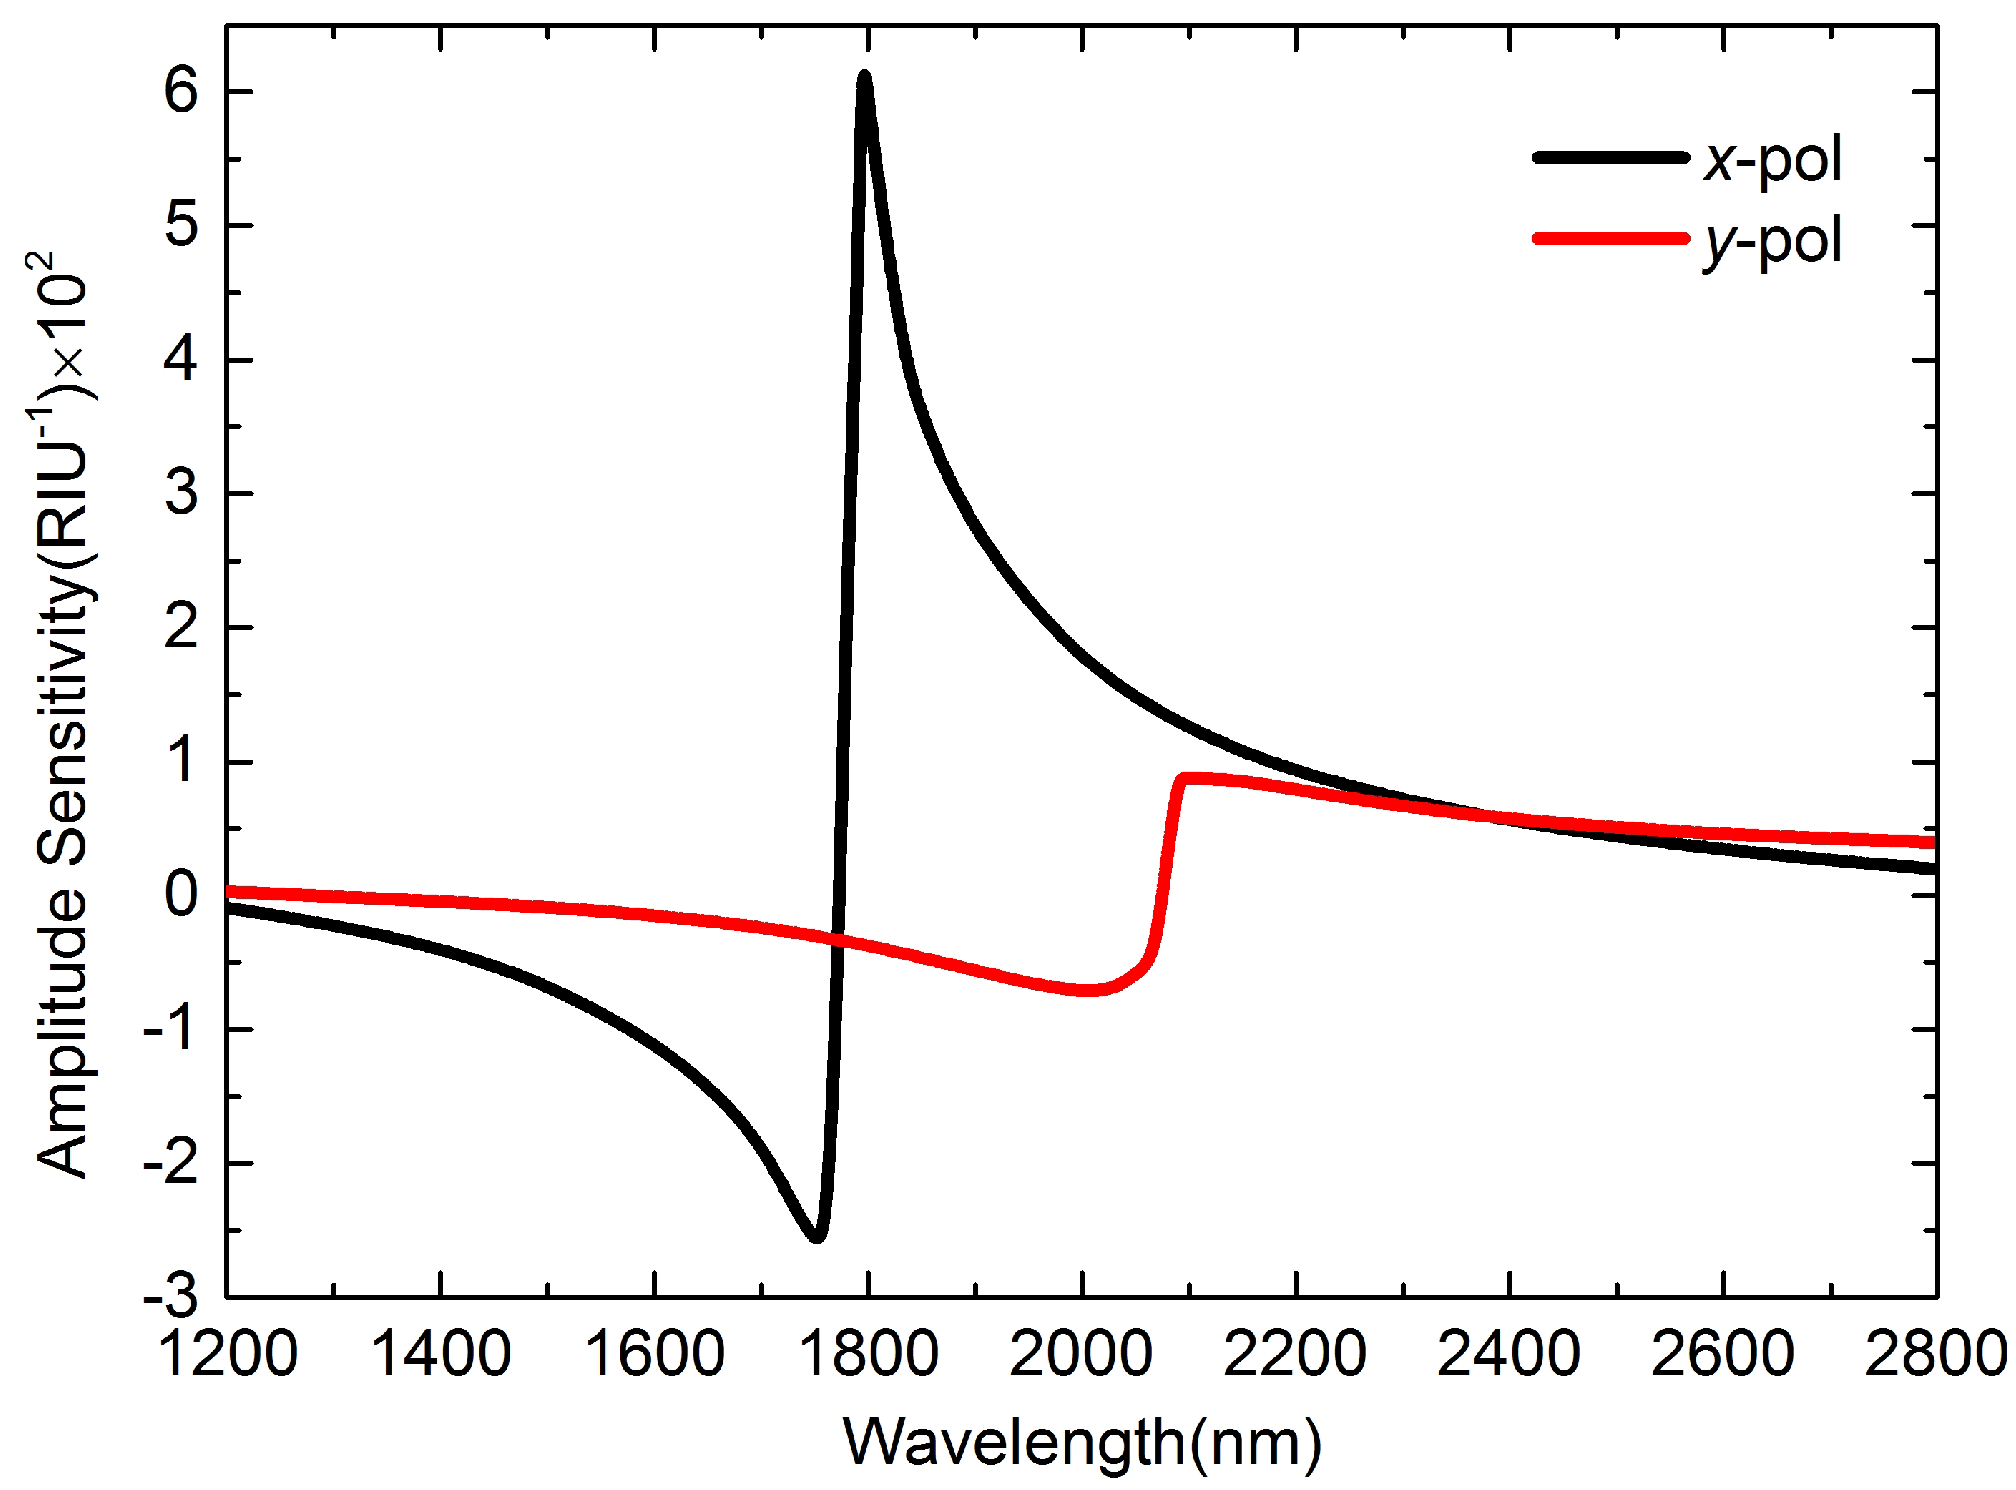
3. Results and Discussion

To investigate the sensor’s performance, the temperature at T = 22 C, 27 C, 32 C, 37 C, 42 C, 47 C is illustrated in Figure 3. Clearly, we can see that the peak intensities of x-pol are about 6 × 10 3 dB higher than y-pol. Moreover, the resonance wavelength range of x-pol is 1750 nm∼2000 nm, shorter than y-pol of 2060 nm∼2200 nm due to the strong birefringence. In contrast with the blue-shift of traditional SPR temperature sensors, the resonance wavelength in our designed sensor changes to a longer wavelength and the intensity of peak loss gradually decreases. The differences are mainly caused by the different ways of liquid filling. In traditional SPR temperature sensors, the liquid with large thermo-optic coefficient is injected into the air holes located at the fiber cladding. Then the n e f f of the plasmon mode will decrease when temperature increases. It approaches the RI of the liquid, resulting in the phase matching point (see Figure 2) with core guided mode shifts to the shorter wavelength. However, in this sensor, the liquid and nanowire are filled into the fiber core, thus the n e f f of core guided mode approaches the RI of the liquid. Then, when temperature increases, the n e f f of core guided mode will decrease, resulting in the phase matching point with plasmon mode corresponding to the resonance wavelength (see Figure 2) shifts to the longer wavelength.
In wavelength interrogation, changes in temperature can be detected though measuring the shift of resonance peak. The wavelength sensitivity is defined as [14]:
S λ ( n m / C ) = λ p e a k n a ,
According to Equation (2), when the temperature changes from 22 C to 27 C, the wavelength sensitivities of x- and y-pol are 7.8 nm/ C and 3.8 nm/ C, respectively.
The detection accuracy is closely related to the peak width. The narrower the width, the higher the detection accuracy. SNR is an important parameter to evaluate the peak width and can be calculated by [21]:
S N R = δ λ r e s δ λ 0 . 5 ,
where δ λ 0 . 5 is the peak width corresponding to 50% of peak loss and δ λ r e s is the resonance wavelength shifts. According to Equation (3), the SNRs of x- and y-pol are 0.75 and 0.12, respectively.
Another method that is frequently-used is the amplitude interrogation. Suppose that the light wavelength is λ, the analyte RI is n a , the HF length is L, the function of core guided mode loss and wavelength is α ( λ , n a ) . The amplitude sensitivity is defined as [22]:
S ( R I U - 1 ) = 1 α ( λ , n a ) α ( λ , n a ) n a ,
Figure 4 depicts the amplitude sensitivities of x- and y-pol when temperature changes from 22 °C to 27 C. From Figure 4 we know that the maximum S of x-pol is 644.5 RIU - 1 , much higher than 87.9 RIU - 1 of y-pol.
The relationships between resonance peaks and temperature are described in Figure 5. The curves of matching function can be set up as λ = 1540.98667 + 9.44T for x-pol and λ = 1944.23238 + 5.33143T for y-pol. The correlations are respectively 0.98997 and 0.95953 between fitting and experimental results, showing a good linear relationship. Then the temperature sensitivities 9.44 nm/ C for x-pol and 5.33 nm/ C for y-pol can be obtained,which are higher than the 4 nm/ C of Ag nanowire filled temperature sensor [14].

4. Conclusions

In this paper, we present and numerically characterize a hollow fiber temperature sensor filled with graphene-Ag composite nanowire and liquid. The coupling properties and sensing performances are analyzed by FEM using wavelength and amplitude interrogations. The sensor exhibits strong birefringence because of the asymmetrically SPR sensing region and simulation results show that x-pol is better suited to temperature detecting in consideration of SNR, wavelength and amplitude sensitivities. A wide temperature range from 22 C to 47 C with steps of 5 C is calculated and the high temperature sensitivities we obtained are 9.44 nm/ C for x-pol and 5.33 nm/ C for y-pol. This work is a promising step in developing a highly sensitive, real-time, fast response and distributed SPR temperature sensor.

Acknowledgments

This work was supported by the National Basic Research Program of China (973) (Grant No. 2015CB755403, 2014CB339802), the National Natural Science Foundation of China (Grant No. 61107086 and 61172010, 61471257).

Author Contributions

W.X., J.Y., X.Y. and J.S. conceived and designed the experiments; W.X. and X.Y. performed the experiments; J.Z. and C.Z. analyzed the data; W.X. wrote the paper.

Conflicts of Interest

The authors declare no conflict of interest. The founding sponsors had no role in the design of the study; in the collection, analyses, or interpretation of data; in the writing of the manuscript, and in the decision to publish the results.

References

  1. Knight, J.C. Photonic crystal fibres. Nature 2003, 424, 847–851. [Google Scholar] [CrossRef] [PubMed]
  2. Russell, P. Photonic crystal fibers. Science 2003, 299, 358–362. [Google Scholar] [CrossRef] [PubMed]
  3. Peng, Y.; Hou, J.; Zhang, Y.; Huang, Z.H.; Xiao, R.; Lu, Q.S. Temperature sensing using the bandgap-like effect in a selectively liquid-filled photonic crystal fiber. Opt. Lett. 2013, 38, 263–265. [Google Scholar] [CrossRef] [PubMed]
  4. Qiu, S.J.; Chen, Y.; Xu, F.; Lu, Y.Q. Temperature sensor based on an isopropanol-sealed photonic crystal fiber in-line interferometer with enhanced refractive index sensitivity. Opt. Lett. 2012, 37, 863–865. [Google Scholar] [CrossRef] [PubMed]
  5. Villatoro, J.; Finazzi, V.; Minkovich, V.P.; Pruneri, V.; Badenes, G. Temperature-insensitive photonic crystal fiber interferometer for absolute strain sensing. Appl. Phys. Lett. 2007, 91, 091109. [Google Scholar] [CrossRef]
  6. Villatoro, J.; Finazzi, V.; Pruneri, V. Functional photonic crystal fiber sensing devices. In Proceedings of the ACP Asia Communications and Photonics Conference and Exhibition, Shanghai, China, 13–16 November 2011; pp. 1–6.
  7. Zu, P.; Chan, C.C.; Jin, Y.X.; Gong, T.X.; Zhang, Y.F.; Chen, L.H.; Dong, X.Y. A Temperature-Insensitive Twist Sensor by Using Low-Birefringence Photonic-Crystal-Fiber-Based Sagnac Interferometer. Photonics Technol. Lett. 2011, 23, 920–922. [Google Scholar] [CrossRef]
  8. Liu, B.H.; Jiang, Y.X.; Zhu, X.S.; Tang, X.L.; Shi, Y.W. Hollow fiber surface plasmon resonance sensor for the detection of liquid with high refractive index. Opt. Express 2013, 21, 32349–32357. [Google Scholar] [CrossRef] [PubMed]
  9. Zhang, H.W.; Lu, Y.; Duan, L.C.; Zhao, Z.Q.; Shi, W.; Yao, J.Q. Intracavity absorption multiplexed sensor network based on dense wavelength division multiplexing filter. Opt. Express 2014, 22, 24545–24550. [Google Scholar] [CrossRef] [PubMed]
  10. Qiu, S.J.; Liu, Q.; Xu, F.; Lu, Y.Q. Ampere force based photonic crystal fiber magnetic field sensor. Sens. Actuators A Phys. 2014, 210, 95–98. [Google Scholar] [CrossRef]
  11. Lee, K.S.; Son, J.M.; Jeong, D.Y.; Lee, T.S.; Kim, W.M. Resolution enhancement in surface plasmon resonance sensor based on waveguide coupled mode by combining a bimetallic approach. Sensors 2010, 10, 11390–11399. [Google Scholar] [CrossRef] [PubMed]
  12. Lee, H.W.; Schmidt, M.A.; Tyagi, H.K.; Prill Sempere, L.; Russell, P.S.J. Polarization-dependent coupling to plasmon modes on submicron gold wire in photonic crystal fiber. Appl. Phys. Lett. 2008, 93, 111102. [Google Scholar] [CrossRef]
  13. Csaki, A.; Jahn, F.; Latka, I.; Henkel, T.; Malsch, D.; Schneider, T.; Schröder, K.; Schuster, K.; Schwuchow, A.; Spittel, R.; et al. Nanoparticle layer deposition for plasmonic tuning of microstructured optical fibers. Small 2010, 6, 2584–2589. [Google Scholar] [CrossRef] [PubMed]
  14. Luan, N.N.; Wang, R.; Lv, W.H.; Lu, Y.; Yao, J.Q. Surface plasmon resonance temperature sensor based on photonic crystal fibers randomly filled with silver nanowires. Sensors 2014, 14, 16035–16045. [Google Scholar] [CrossRef] [PubMed]
  15. Sui, K.R.; Shi, Y.W.; Tang, X.L.; Zhu, X.S.; Katsumasa, I.; Mitsunobu, M. Optical properties of AgI/Ag infrared hollow fiber in the visible wavelength region. Opt. Lett. 2008, 33, 318–320. [Google Scholar] [CrossRef] [PubMed]
  16. Choi, S.H.; Kim, Y.L.; Byun, K.M. Graphene-on-silver substrates for sensitive surface plasmon resonance imaging biosensors. Opt. Express 2011, 19, 458–466. [Google Scholar] [CrossRef] [PubMed]
  17. Dash, J.N.; Jha, R. Graphene-Based Birefringent Photonic Crystal Fiber Sensor Using Surface Plasmon Resonance. Photonics Technol. Lett. 2014, 26, 1092–1095. [Google Scholar] [CrossRef]
  18. Yang, X.C.; Lu, Y.; Liu, B.L.; Yao, J.Q. Analysis of Graphene-Based Photonic Crystal Fiber Sensor Using Birefringence and Surface Plasmon Resonance. Plasmonics 2016. [Google Scholar] [CrossRef]
  19. Wang, Y.P.; Tan, X.L.; Jin, W.; Ying, D.Q.; Hoo, Y.L.; Liu, S.J. Temperature-controlled transformation in fiber types of fluid-filled photonic crystal fibers and applications. Opt. Lett. 2010, 35, 88–90. [Google Scholar] [CrossRef] [PubMed]
  20. Lynch, D.W.; Hunter, W.R. Comments on the Optical Constants of Metals and on Introduction to the Data for Several Metals. In Handbook of Optical Constants of Solids; Edward, D.P., Ed.; Academic Press: Boston, MA, USA, 1985; pp. 350–357. [Google Scholar]
  21. Sharma, A.K.; Gupta, B.D. Fibre-optic sensor based on surface plasmon resonance with Ag-Au alloy nanoparticle films. Nanotechnology 2005, 17, 124. [Google Scholar] [CrossRef]
  22. Lu, Y.; Hao, C.J.; Wu, B.Q.; Huang, X.H.; Wen, W.Q.; Fu, X.Y.; Yao, J.Q. Grapefruit fiber filled with silver nanowires surface plasmon resonance sensor in aqueous environments. Sensors 2012, 12, 12016–12025. [Google Scholar] [CrossRef] [PubMed]
Figure 1. Cross section of the designed temperature sensor.
Sensors 16 01656 g001
Figure 2. (Left) Dispersion relations of the core guided modes and the plasmon modes at temperature T = 22 C. (Insets) Electric field distributions of (a) core guided mode of x-pol at λ = 1.4 μ m; (b) core guided mode of y-pol at λ = 1.4 μ m; (c) core guided mode of x-pol at λ = 1.757 μ m (resonance wavelength); (d) core guided mode of y-pol at λ = 2.068 μ m (resonance wavelength); (e) plasmon mode of x-pol at λ = 1.75 μ m; (f) plasmon mode of y-pol at λ = 2.06 μ m.
Sensors 16 01656 g002
Figure 3. Loss spectra of x- and y-pol when T changes from 22 C to 47 C with steps of 5 C.
Sensors 16 01656 g003
Figure 4. Amplitude sensitivities of x- and y-pol peaks when T changes form 22 C to 27 C.
Sensors 16 01656 g004
Figure 5. Relationships between resonance peaks and temperature.
Sensors 16 01656 g005

