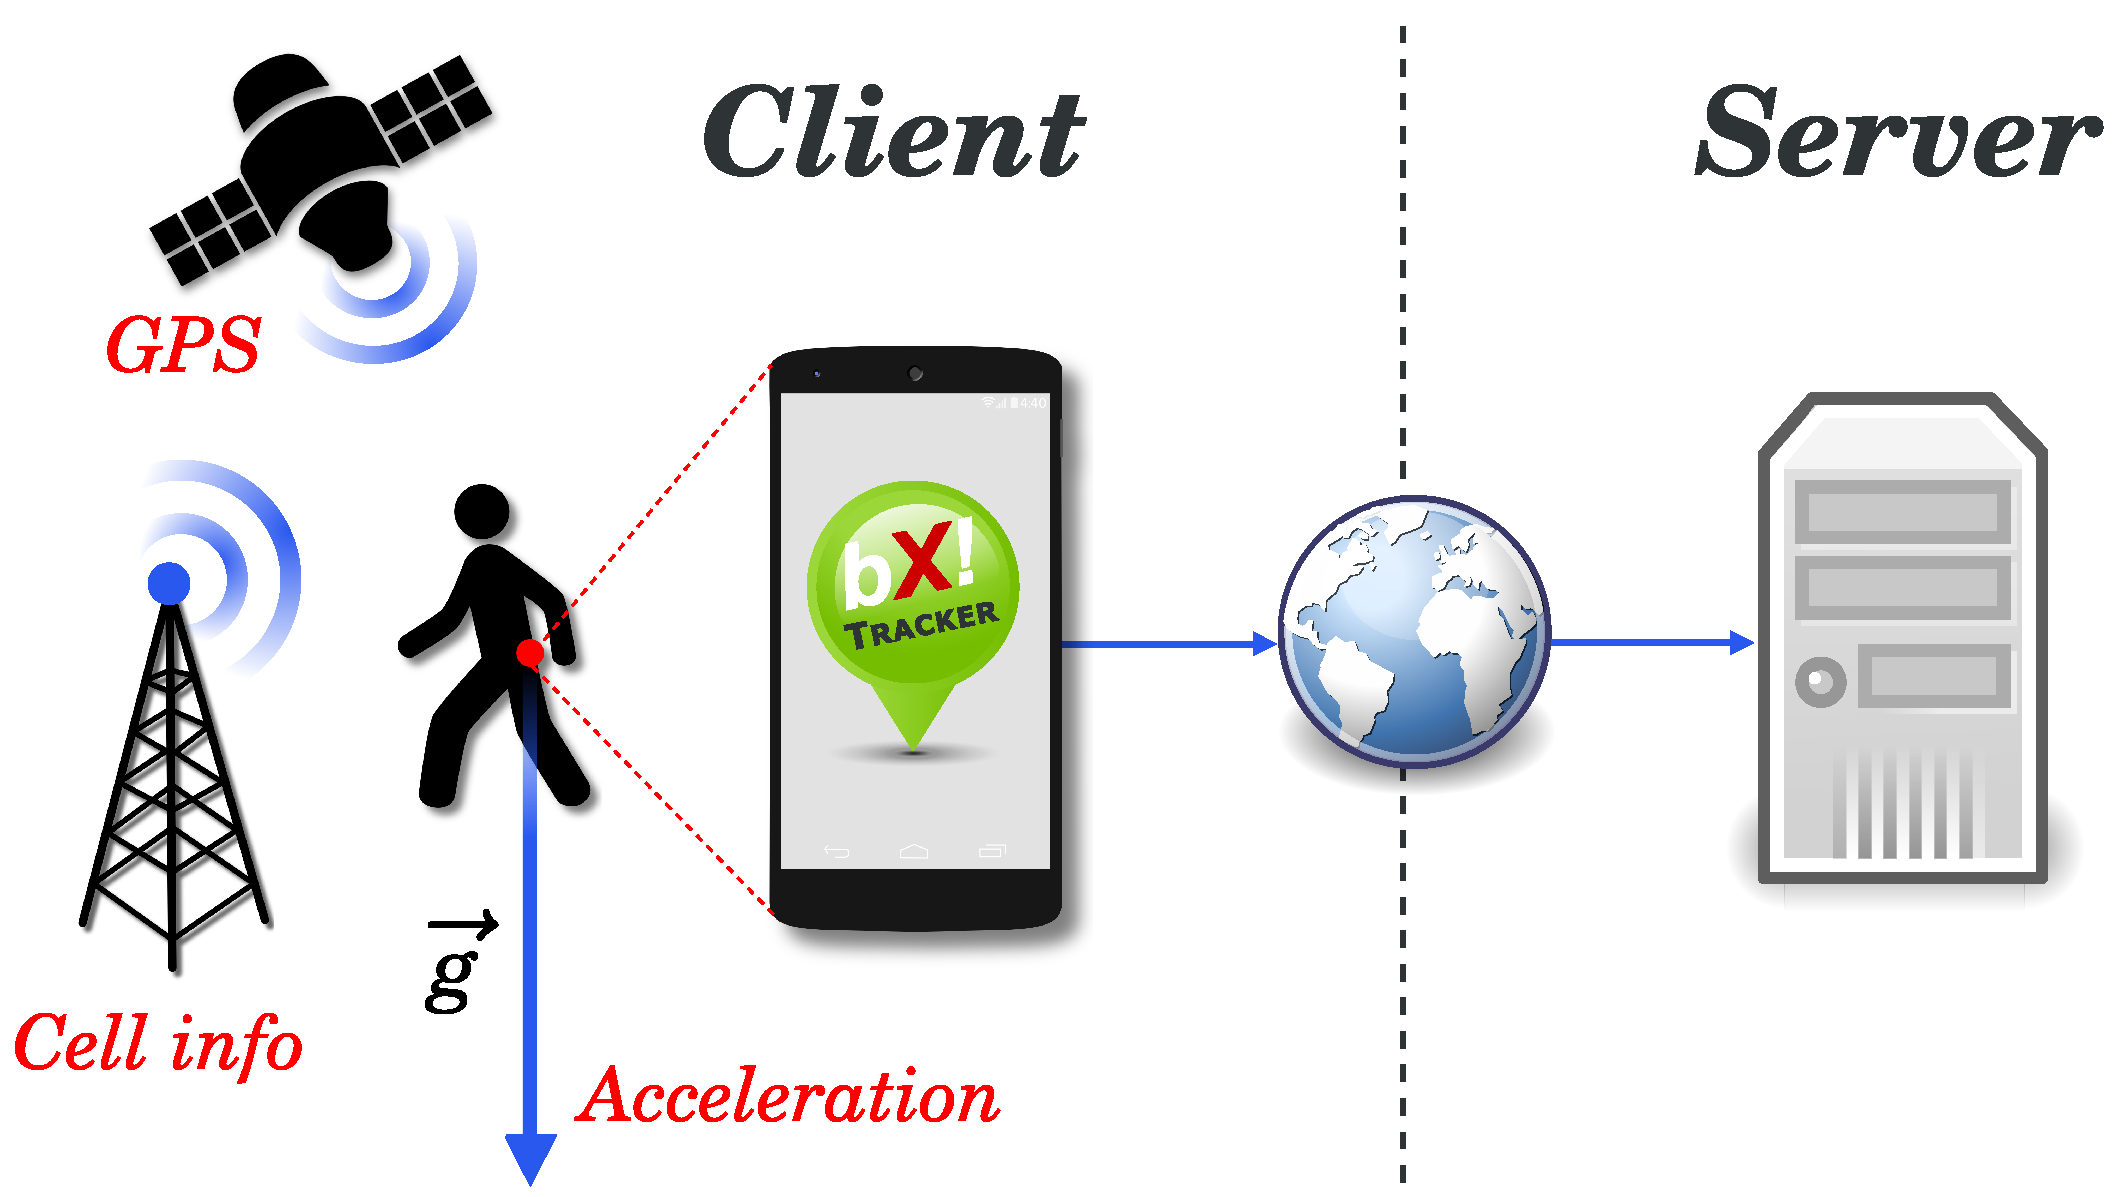
In this section, we show how to combine the GPS with the accelerometer to implement energy-efficient location tracking on mobile devices. We give a general idea using BX Tracker, which was designed for Android platforms, as an example.
5.1. Motivation and Idea
The original motivation for perpetual location tracking is human mobility modeling and location prediction, an important topic for cellular networks. Such research on human movements requires long-range, accurate and continuous location data of many individuals, which is a scarce resource. Some data are available in the CRAWDAD (Community Resource for Archiving Wireless Data At Dartmouth) database (for example [
44,
45,
46]) and through the OpenStreeMap project [
47], but none of the published datasets were suitable for our model presented in [
34]. Moreover, we considered collecting the required data using off-the-shelf GPS trackers as inadequate. Apart from the costs, such an approach imposes additional duties on the volunteers and scales poorly. Thus, we decided to collect the data using mobile crowdsensing, which seems the natural choice nowadays [
48].
Almost all new smartphones support location using various techniques. Apart from the traditional GPS location, smartphones offer network-based location, which employs wireless base stations as reference points. However, as already pointed out, such a technique is unreliable: in some regions, its accuracy can be as low as a few kilometers. On the other hand, popular GPS tracking applications are designed for short-term usage and, thus, require a manual start-stop procedure. As shown in
Section 3, crowdsourcing volunteers expect minimal battery impact and no additional tasks to do. Hence, we propose a location tracking algorithm optimized for crowdsourcing data for modeling cellular networks.
The location can be tracked by having the GPS constantly on, but this could reduce the battery lifetime from 284 h down to 12 h [
21]. On the other hand, people on average spend only an hour a day traveling [
49]. Thus, our basic idea is to switch off the GPS chip whenever possible. In order to do that, we monitor the phone accelerometer for various activities, observe the signal strengths of GPS satellites, dynamically adjust the fix interval and track the user speed history.
In [
50], Galeana-Zapién
et al. proposed to solve the energy saving problem with a middleware architecture and a runtime environment that directly interfaces with application programming interfaces and device sensors, to manage the duty cycle process based on energy and context aspect. In comparison to that work, our solution optimizes energy usage and generates mobility and signal strength data in a single Android application. Moreover, we use the accelerometer to manage the GPS and granularity of measurements, and we monitor the signal strengths of GPS satellites to switch GPS off inside buildings. These techniques assure an energy-efficient usage of location sensors without third party optimizers.
5.2. Implementation
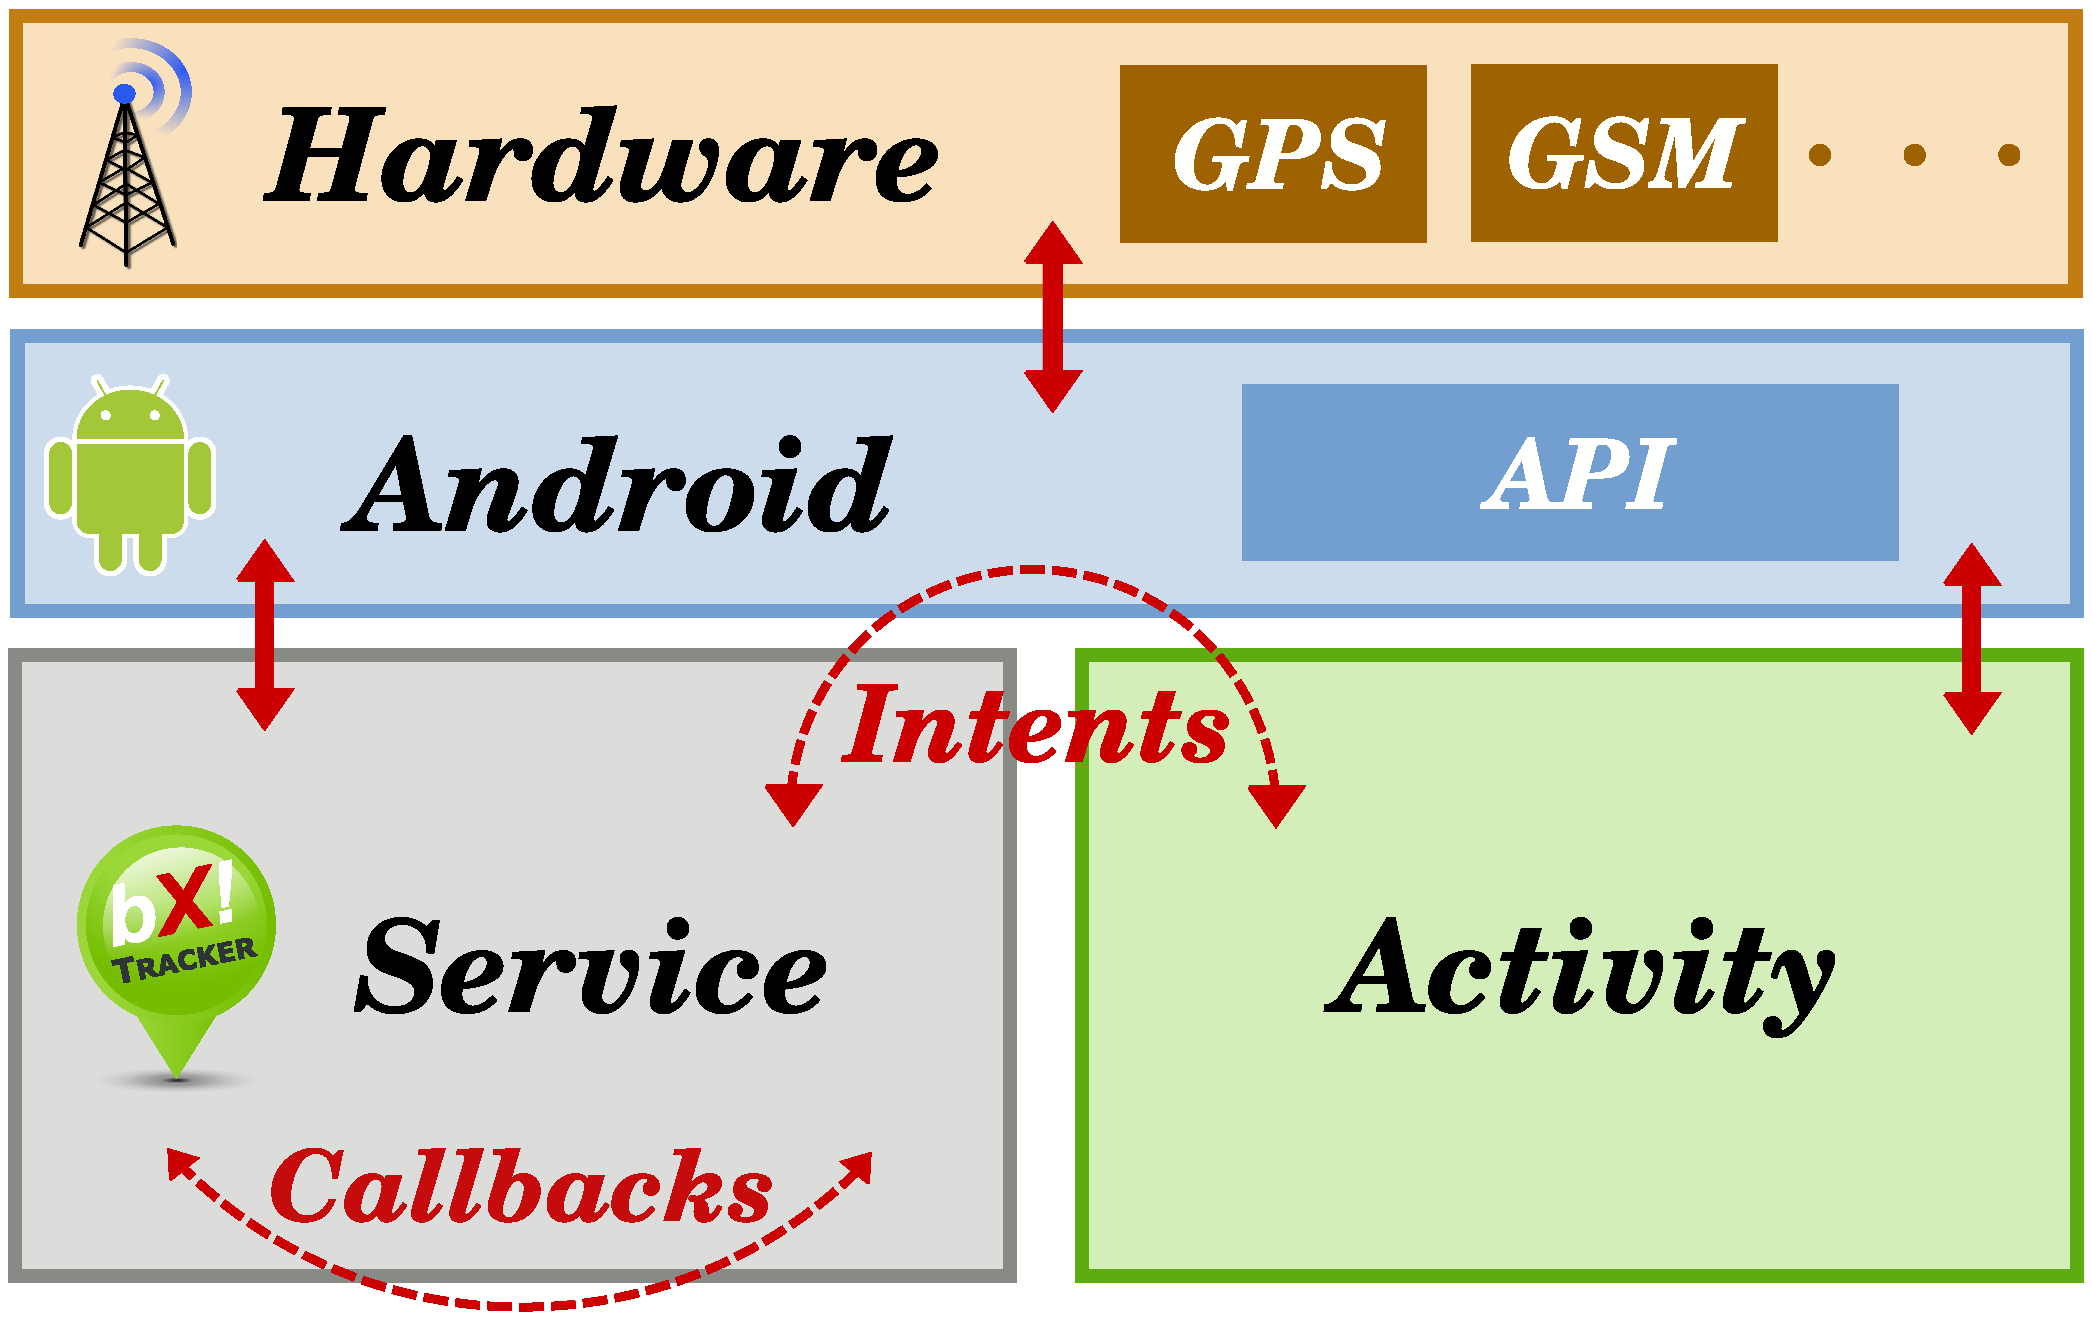
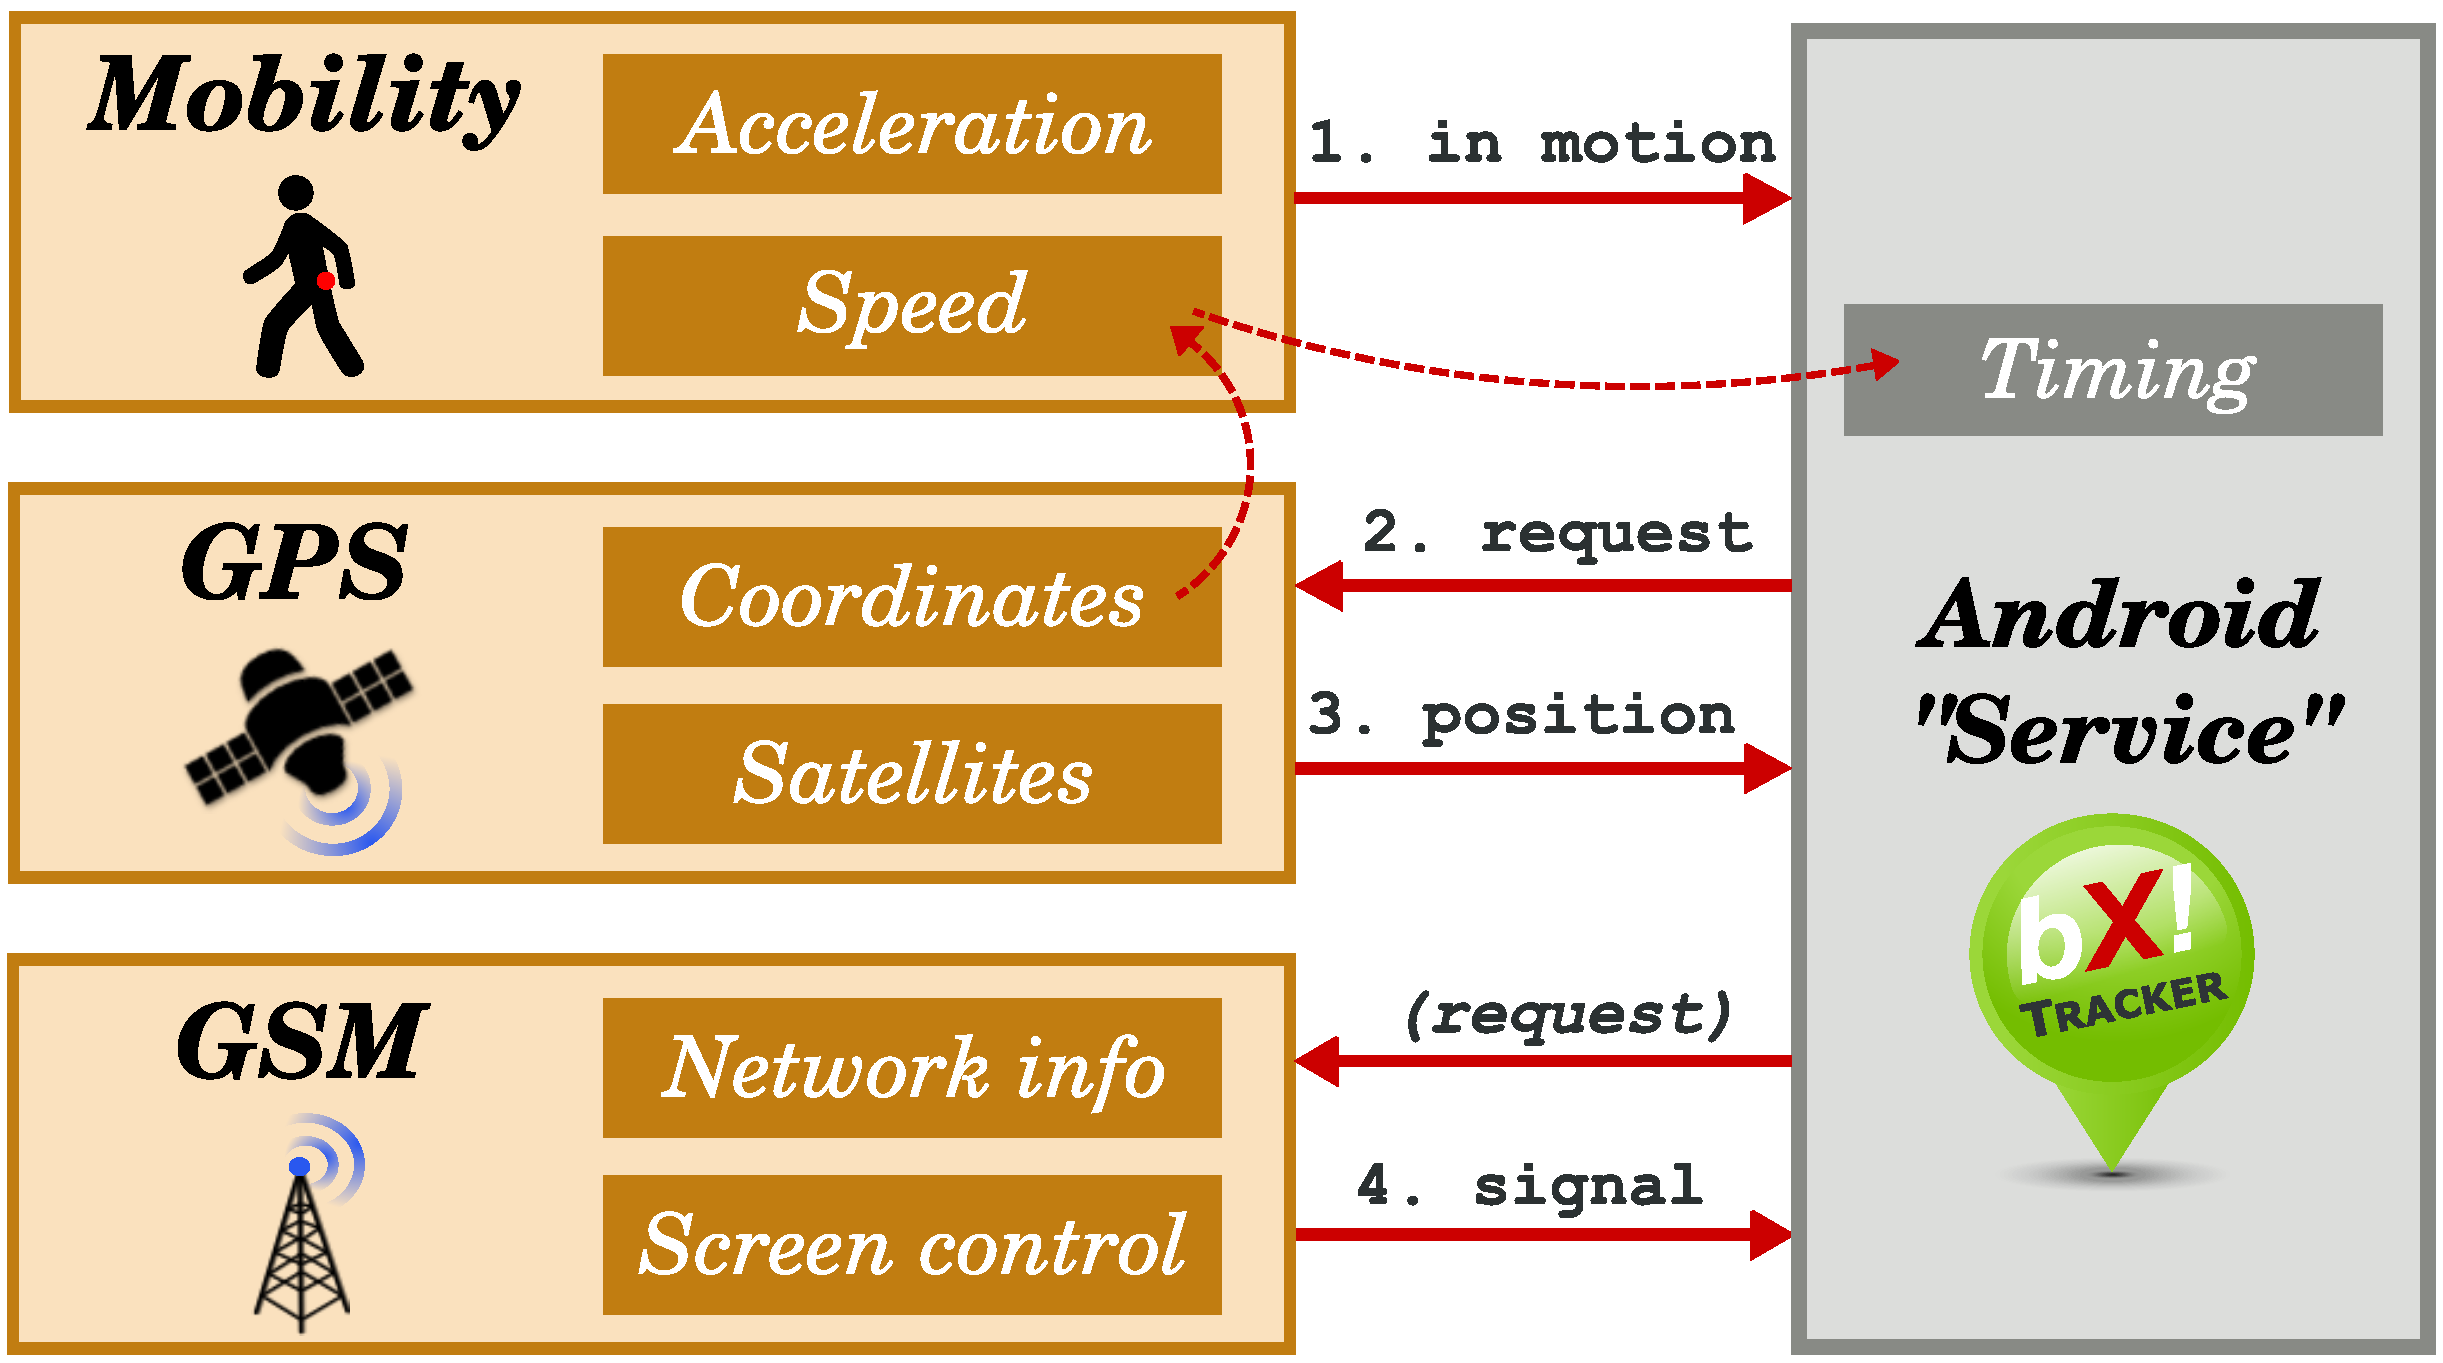
A more detailed architecture of BX Tracker is presented in
Figure 6. The system is divided into subsystems responsible for tracking various phenomena (visible on the left-hand side), and the Android S
ervice part that controls these subsystems and receives callbacks (right-hand side; see
Section 4.2). Note that the GSM subsystem, which collects signal quality data, is optional with respect to the overall system architecture. It can be replaced with another data collection subsystem, as explained in
Section 4.3, or omitted. In
Section 6, we show practical applications for the additional data. Below, we describe the crucial processes implemented in our location tracking method.
Figure 6.
Implementation of the BX Tracker application.
Figure 6.
Implementation of the BX Tracker application.
(1) Mobility tracking: Let us start with an observation that people have long periods of time during the day in which they do not change their location, for example: sleeping, staying at home, working at the office [
48]. It is unnecessary to periodically check for the GPS position when no significant movement is recorded by the smartphone sensors. Another observation is that once people start moving, we can monitor the maximum speed attained in the last few minutes to ensure that they are still mobile. Thus, it is unnecessary to check the sensors until people stop moving for some time. We used these two simple observations as the motivation to build the M
obility subsystem (see
Figure 6): it aims at detecting whether the user is currently more likely to be in motion or to be stationary. When the user is in motion, we request a new GPS fix. However, we also obey a minimum time pause between successive requests, as will be explained later.
The physical activity of a smartphone user can easily be detected using an accelerometer. This is a well-known research topic [
51,
52,
53,
54,
55,
56], so we adopted an off-the-shelf solution available in the Google Play Services software library, v. 6.1: Google Activity Recognition [
42]. Once enabled, it will periodically send notifications about the detected activity [
57] “in vehicle”, “on bicycle”, “on foot”, “running”, “walking”, “tilting” and “still”. The expected period between the updates can be configured, and each notification contains a confidence level. In BX Tracker, we set the interval to 10 s, and we skip the updates with the confidence level below 54%, which was verified experimentally to give the best results. Finally, when we receive a certain activity update of “tilting” or “still”, we consider the user to be stationary. We map the other classes to simple representations: see
activity in
Table 1.
The mobility tracking subsystem also passively listens to GPS location updates. Whenever the user moves more than 35 m in less than 2 min (about 1 km/h), the instantaneous speed and the distance between the two consecutive updates are recorded in a circular buffer with a timestamp value. The buffer is later used to retrieve the maximum speed and the maximum distance in the last 2 min, relative to the query time. If the speed is above 4.5 km/h or the distance is larger than 200 m, the user is considered to be in motion. Note that if no new GPS positions are received, the speed and distance data will be invalidated with time.
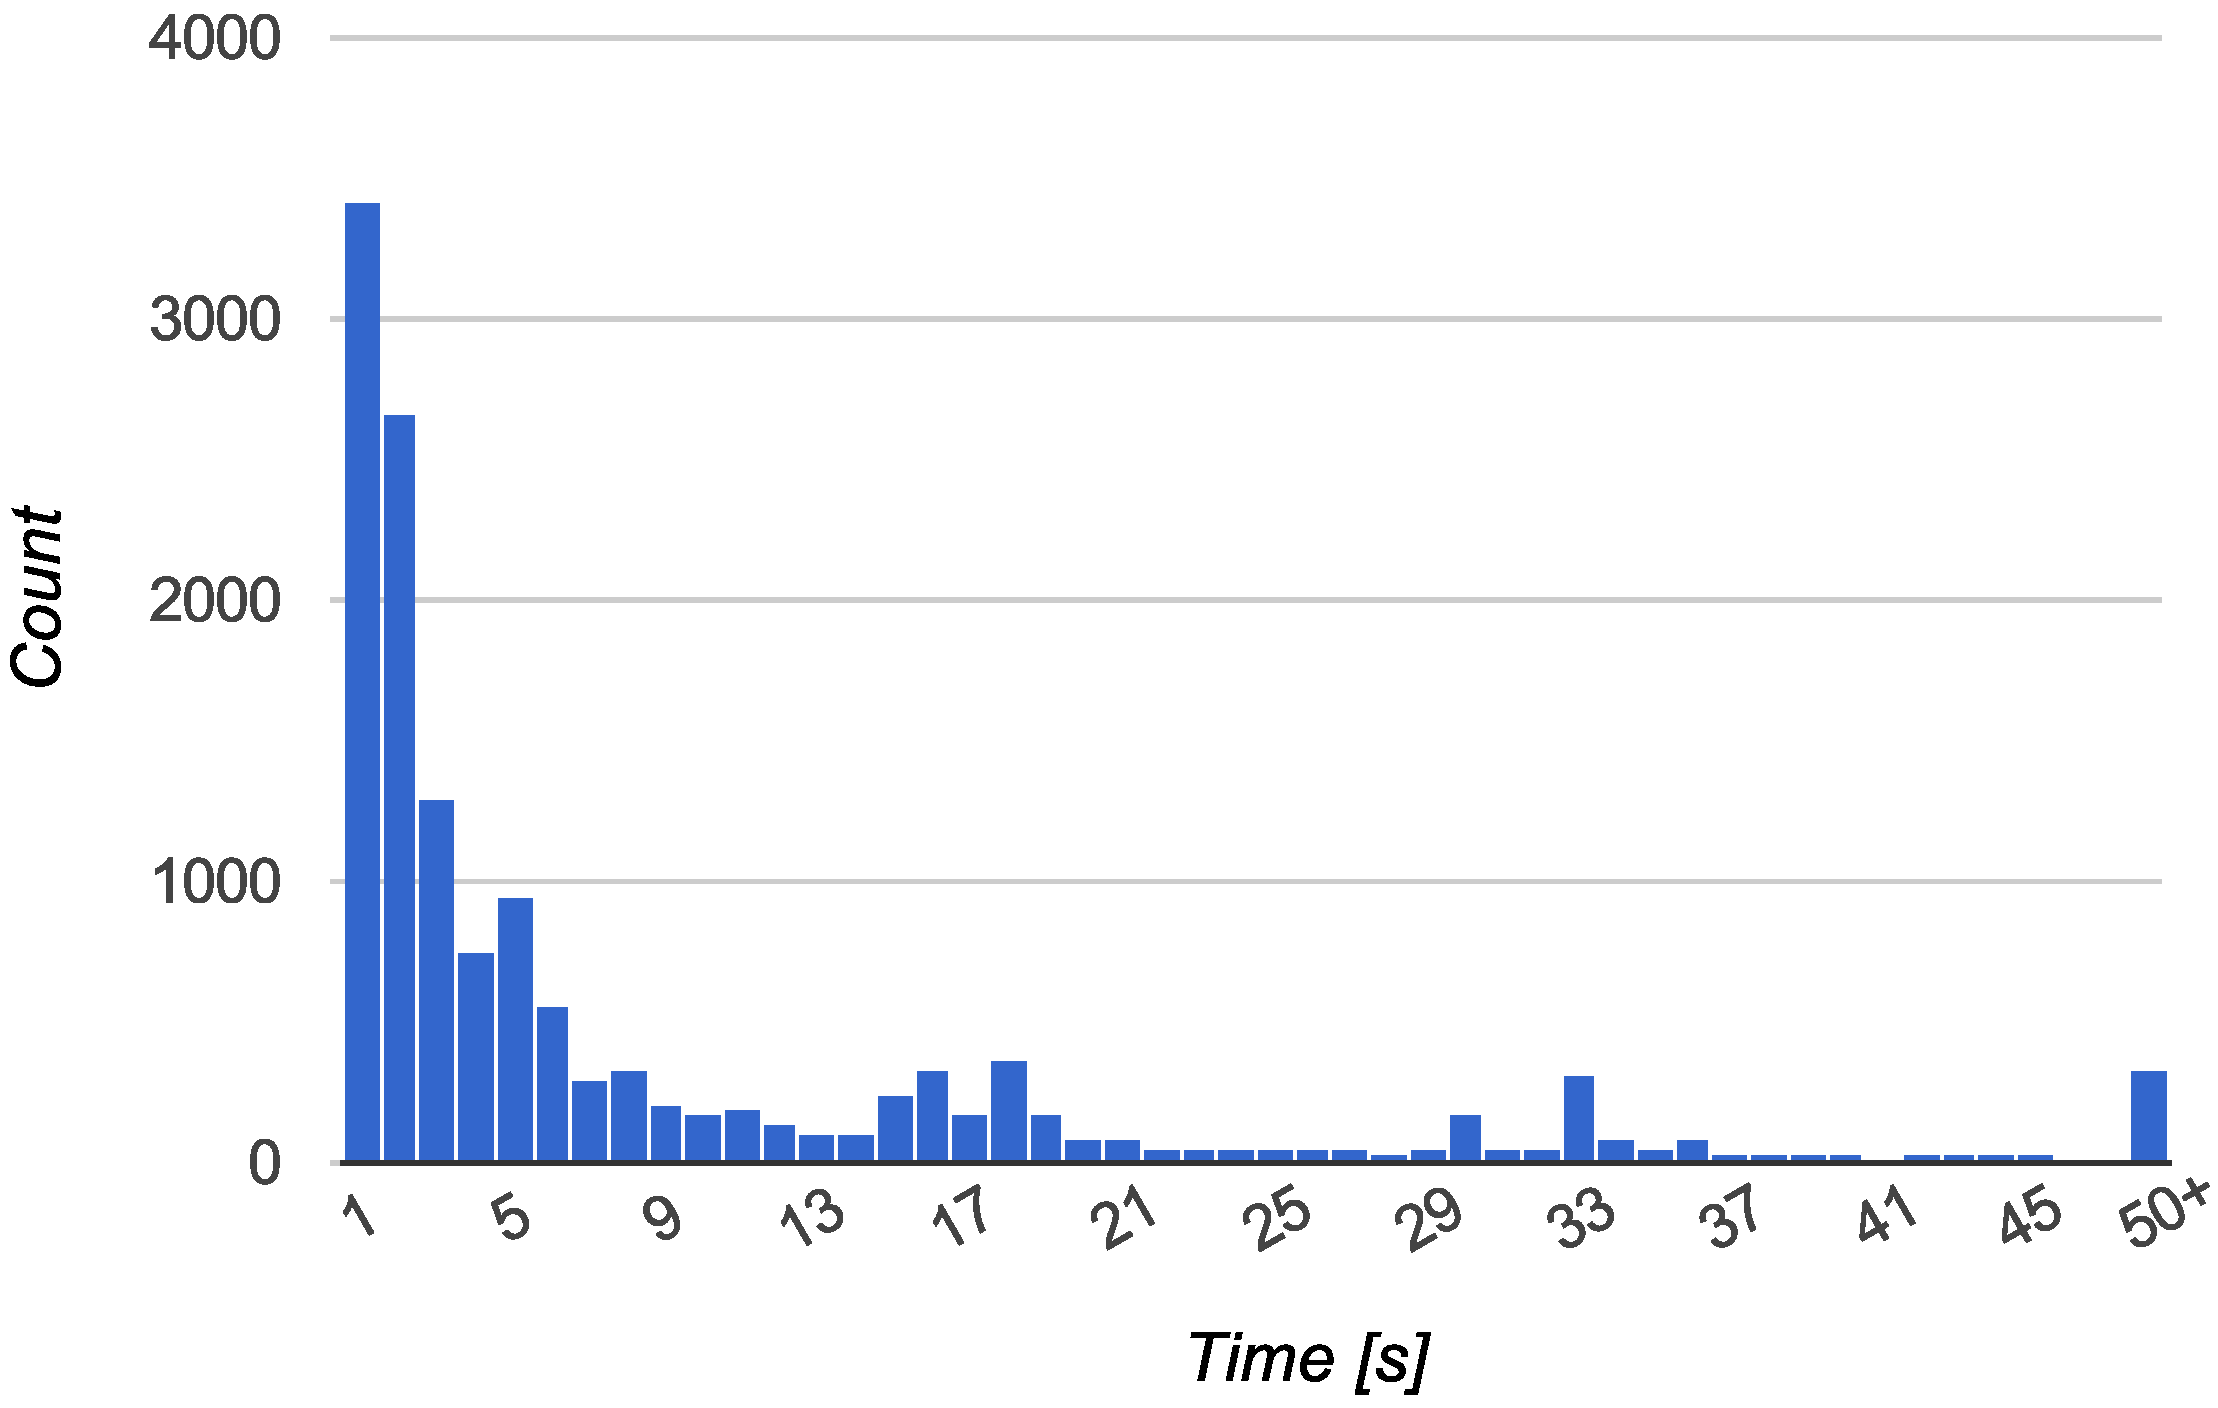
(2) GPS control: The task of the GPS subsystem is to handle requests for a GPS fix in an battery-efficient manner. We observed that it is often unnecessary to leave the GPS active for periods longer than 30 s. Such an amount of time is long enough to discern between a meaningful position search that is going to succeed (e.g., good GPS signal, outside of a building) and a process that is finally going to fail (e.g., GPS started inside an office room). Data collected from users confirmed this: in
Section 5.3 pt 2, we analyze the time our algorithm needed to stop the GPS. The reason could be either obtaining a valid fix or observing a poor signal. For the vast majority of examined cases, the GPS was stopped in less than 20 s, with almost all fix attempts finishing in less than 1 min.
Based on the observations above, we implemented a GPS status monitor. Whenever we request a GPS position fix from the Android OS, we also register for updates on the GPS satellite signal strengths, which should be available each second. For each signal strength report, we calculate a “GPS score”:
S, a metric that quantitatively estimates the quality of the GPS signal at the current location:
where
are the signal-to-noise ratios of the GPS satellites [
58]. We experimentally obtained a threshold value for
S: if the maximum
S value for the last 15 s was below
, the fix is likely to fail, and thus, the GPS chip can safely be shut down to conserve the battery power. On the contrary, if this value is above the threshold after 30 s since the GPS start, we let the process continue, and we recheck it every 15 s. Finally, the GPS is unconditionally stopped after 5 min, which was verified experimentally to work well. As a work-around for Android-specific issues with the satellite signal reporting, we restart the GPS fix and the GPS reporting processes every minute, with no impact on the presented procedure.
We also implemented simple filtering and processing of GPS results. On a new GPS fix, if the last successful fix was more than 5 min ago, we ignore the first two results and let the GPS run. This was verified experimentally to reduce the noise in GPS paths on several smartphones. For the same reason, we also ignore the results with an accuracy worse than 100 m, with at most 10 tries to obtain a higher-quality result. If the result passes the presented filtering procedure, we stop the GPS and store the new location. We also calculate the instantaneous speed and the traveled distance, as mentioned in the previous point.
(3) Proper timing: Let us make another observation that different types of mobility require different time pauses between successive requests for a GPS fix. For example, if our requirement is 100-m accuracy and the user walks, the pause can be around 30 s, because it is unlikely that the user will be able to walk more than 100 m in such an amount of time. On the other hand, if the user drives a car in a city center, the pause time should be around 10 s or less, assuming an average speed of 36 km/h. Finally, if the user drives a car on a highway, we can increase the pause time, as highways are designed to avoid sharp road curves. The GPS track on a highway can be approximated with a straight line connecting two distant positions.
The S
ervice part of the system presented in
Figure 6 is responsible for imposing a pause regime on the GPS subsystem, using the information on user activity and speed. When the M
obility subsystem reports that the user is mobile, a GPS fix request will be generated only if a sufficient amount of time,
d, has passed since the last successful fix. See
Table 3 for the pause times used in BX Tracker, which were derived experimentally.
Table 3.
Dependence of GPS pause time on user activity and speed.
Table 3.
Dependence of GPS pause time on user activity and speed.
| Activity | d (s) |
|---|
| in-vehicle | 15 |
| 10 |
| on-bicycle | 20 |
| on-foot | 30 |
| Otherwise | 60 |
| 10 |
|
(4) Collecting additional data: If possible, the event of a new GPS location should trigger collecting additional data; in the case of BX Tracker, the data about the mobile signal strength and network information. In such a case, an error in the geographical position is minimized, and the geospatial features of the measured phenomena are accurate. However, as previously noted, the power saving functionality of smartphones can disable some of the phone features when the device screen is off, which can be a common situation when the user is in motion. Hence, the subsystem responsible for recording additional data can either turn on the screen for a short period of time or fall back on opportunistic data collection, in which the data are stored only if the screen was on at the time of measurement. In BX Tracker, the user can manually choose between active and passive mobile data collection methods. In active mode, the S
ervice subsystem will request turning on the screen and measure the signal data each time the user moves to a new location, plus an additional measurement will be made each minute disregarding user mobility. Collecting the mobile network signal is one of the additional BX Tracker features that is meaningful for both practical and scientific use. This mechanism for sampling the network signal is used in the BX Network application [
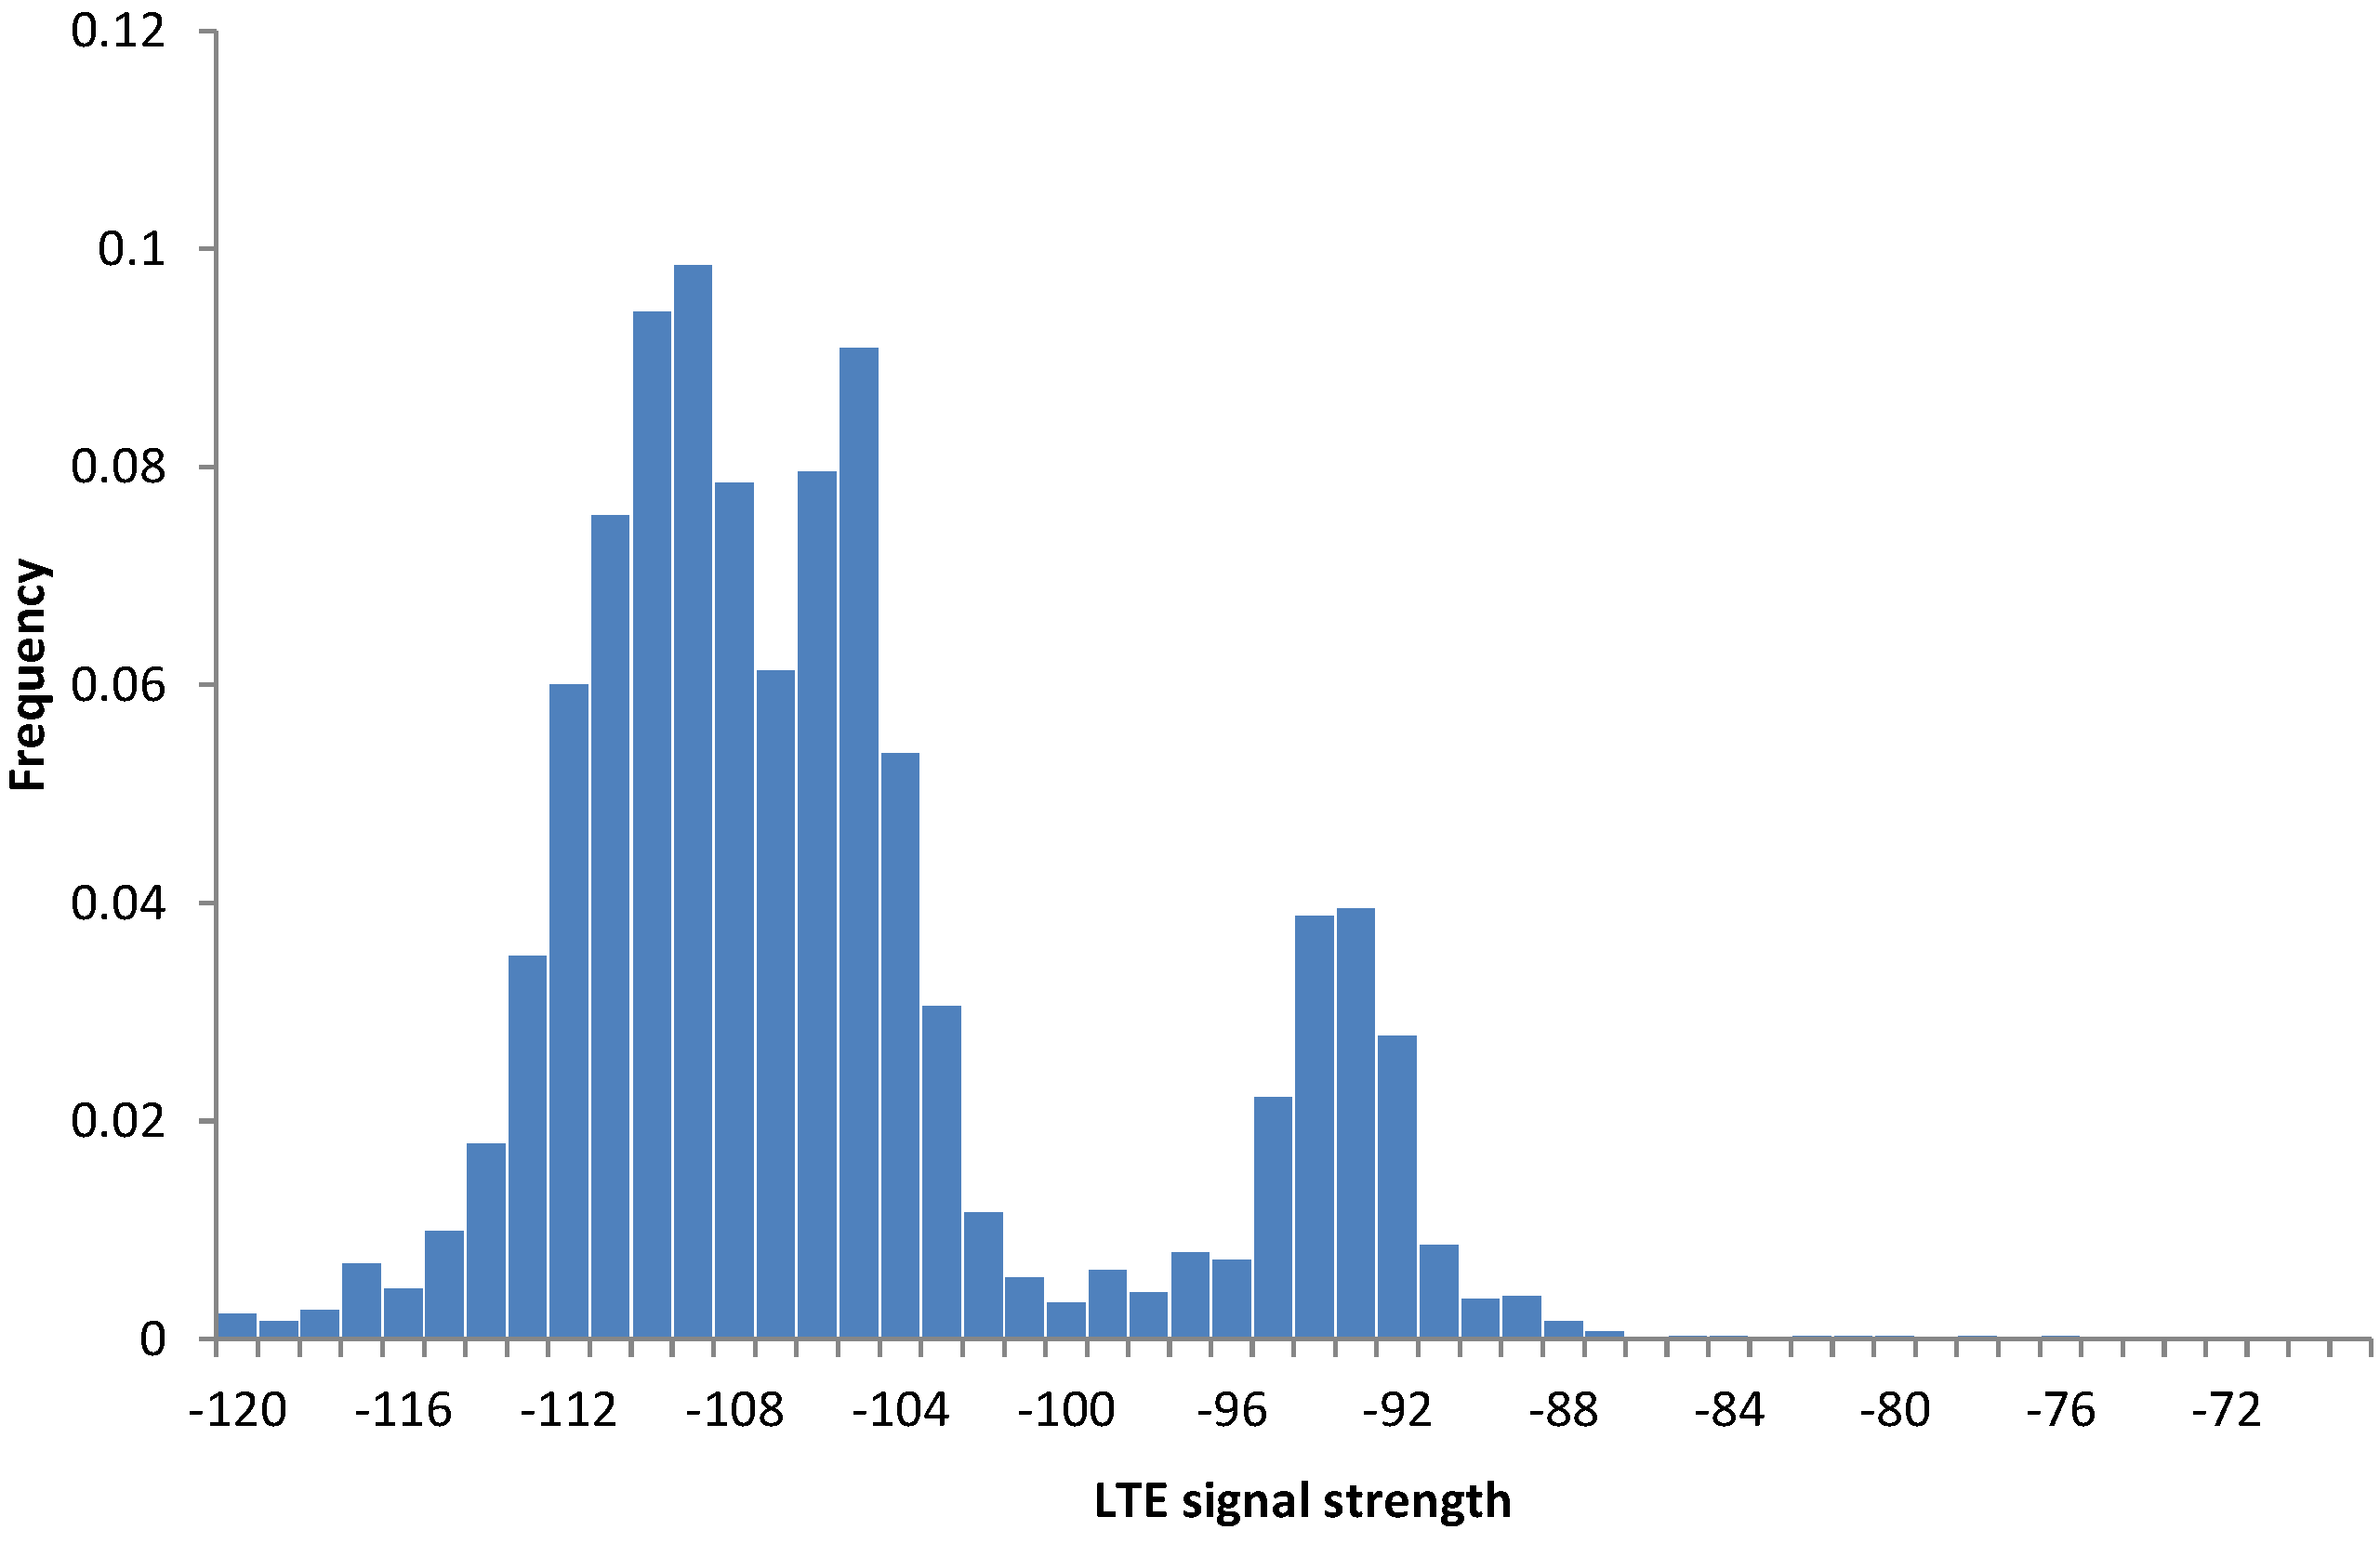
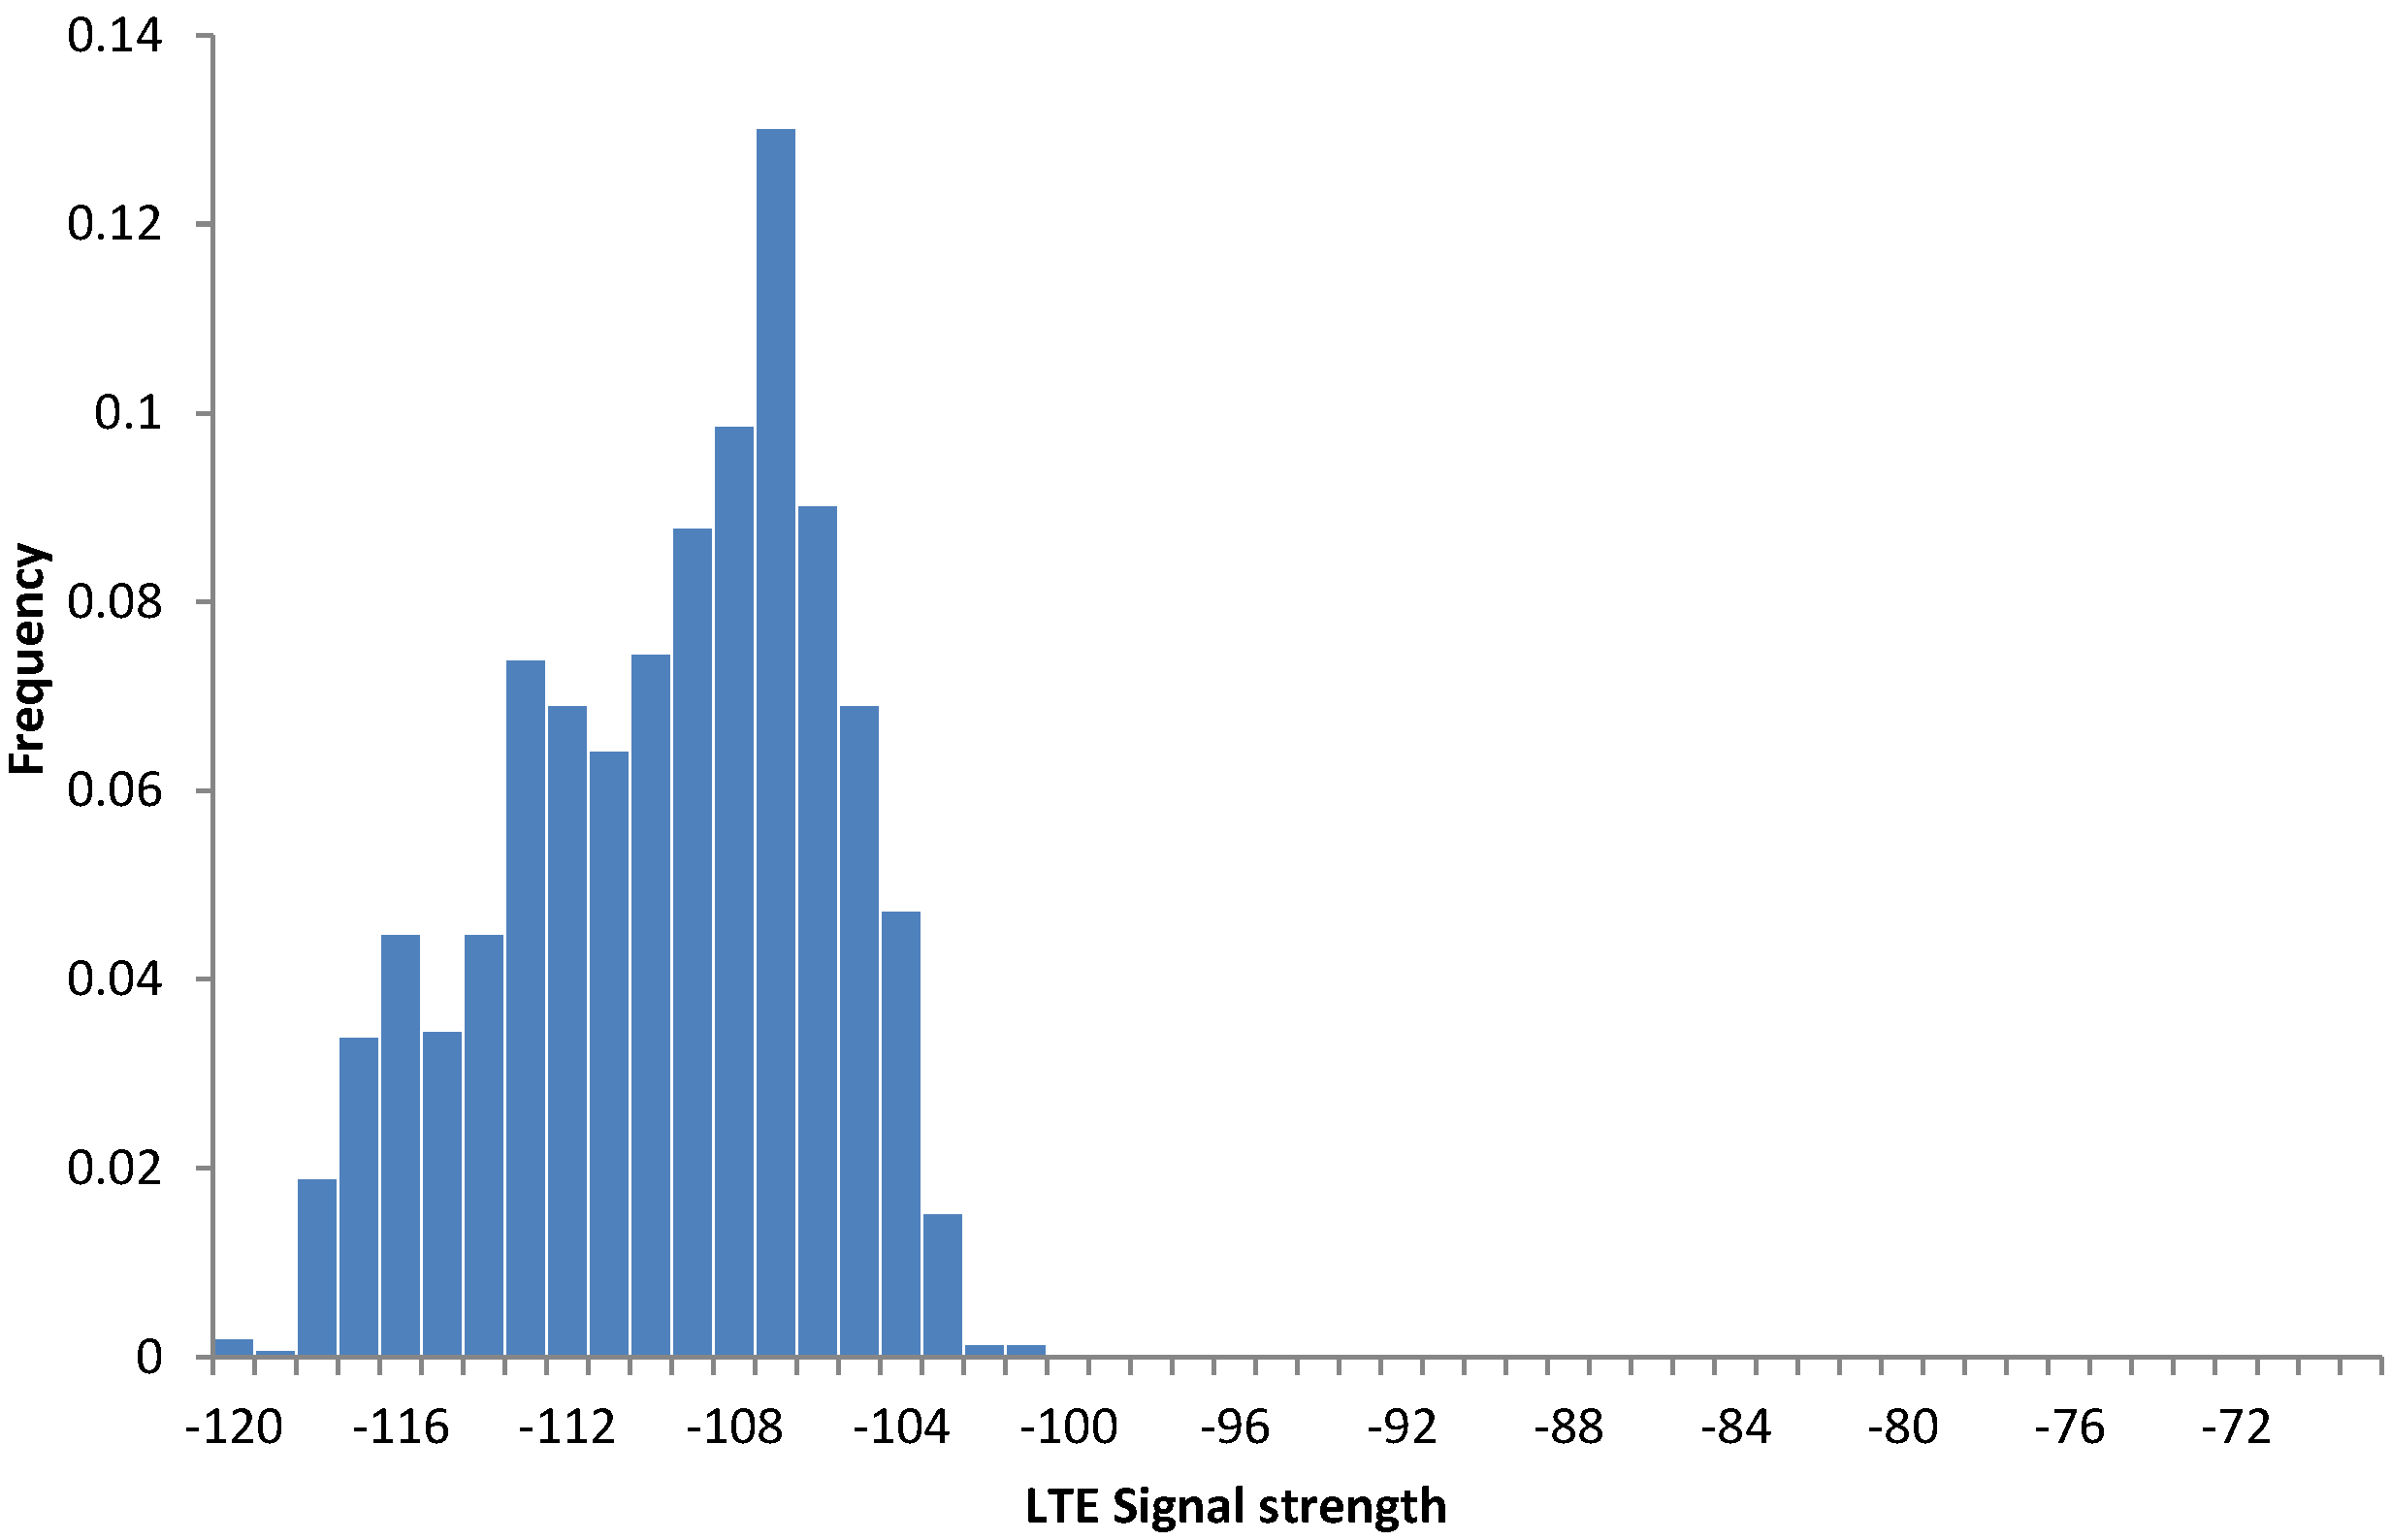
59]. This application automatically samples both the Wi-Fi network (if accessible) and the mobile network and switches them according to network efficiency. The data collected from BX Tracker was used in [
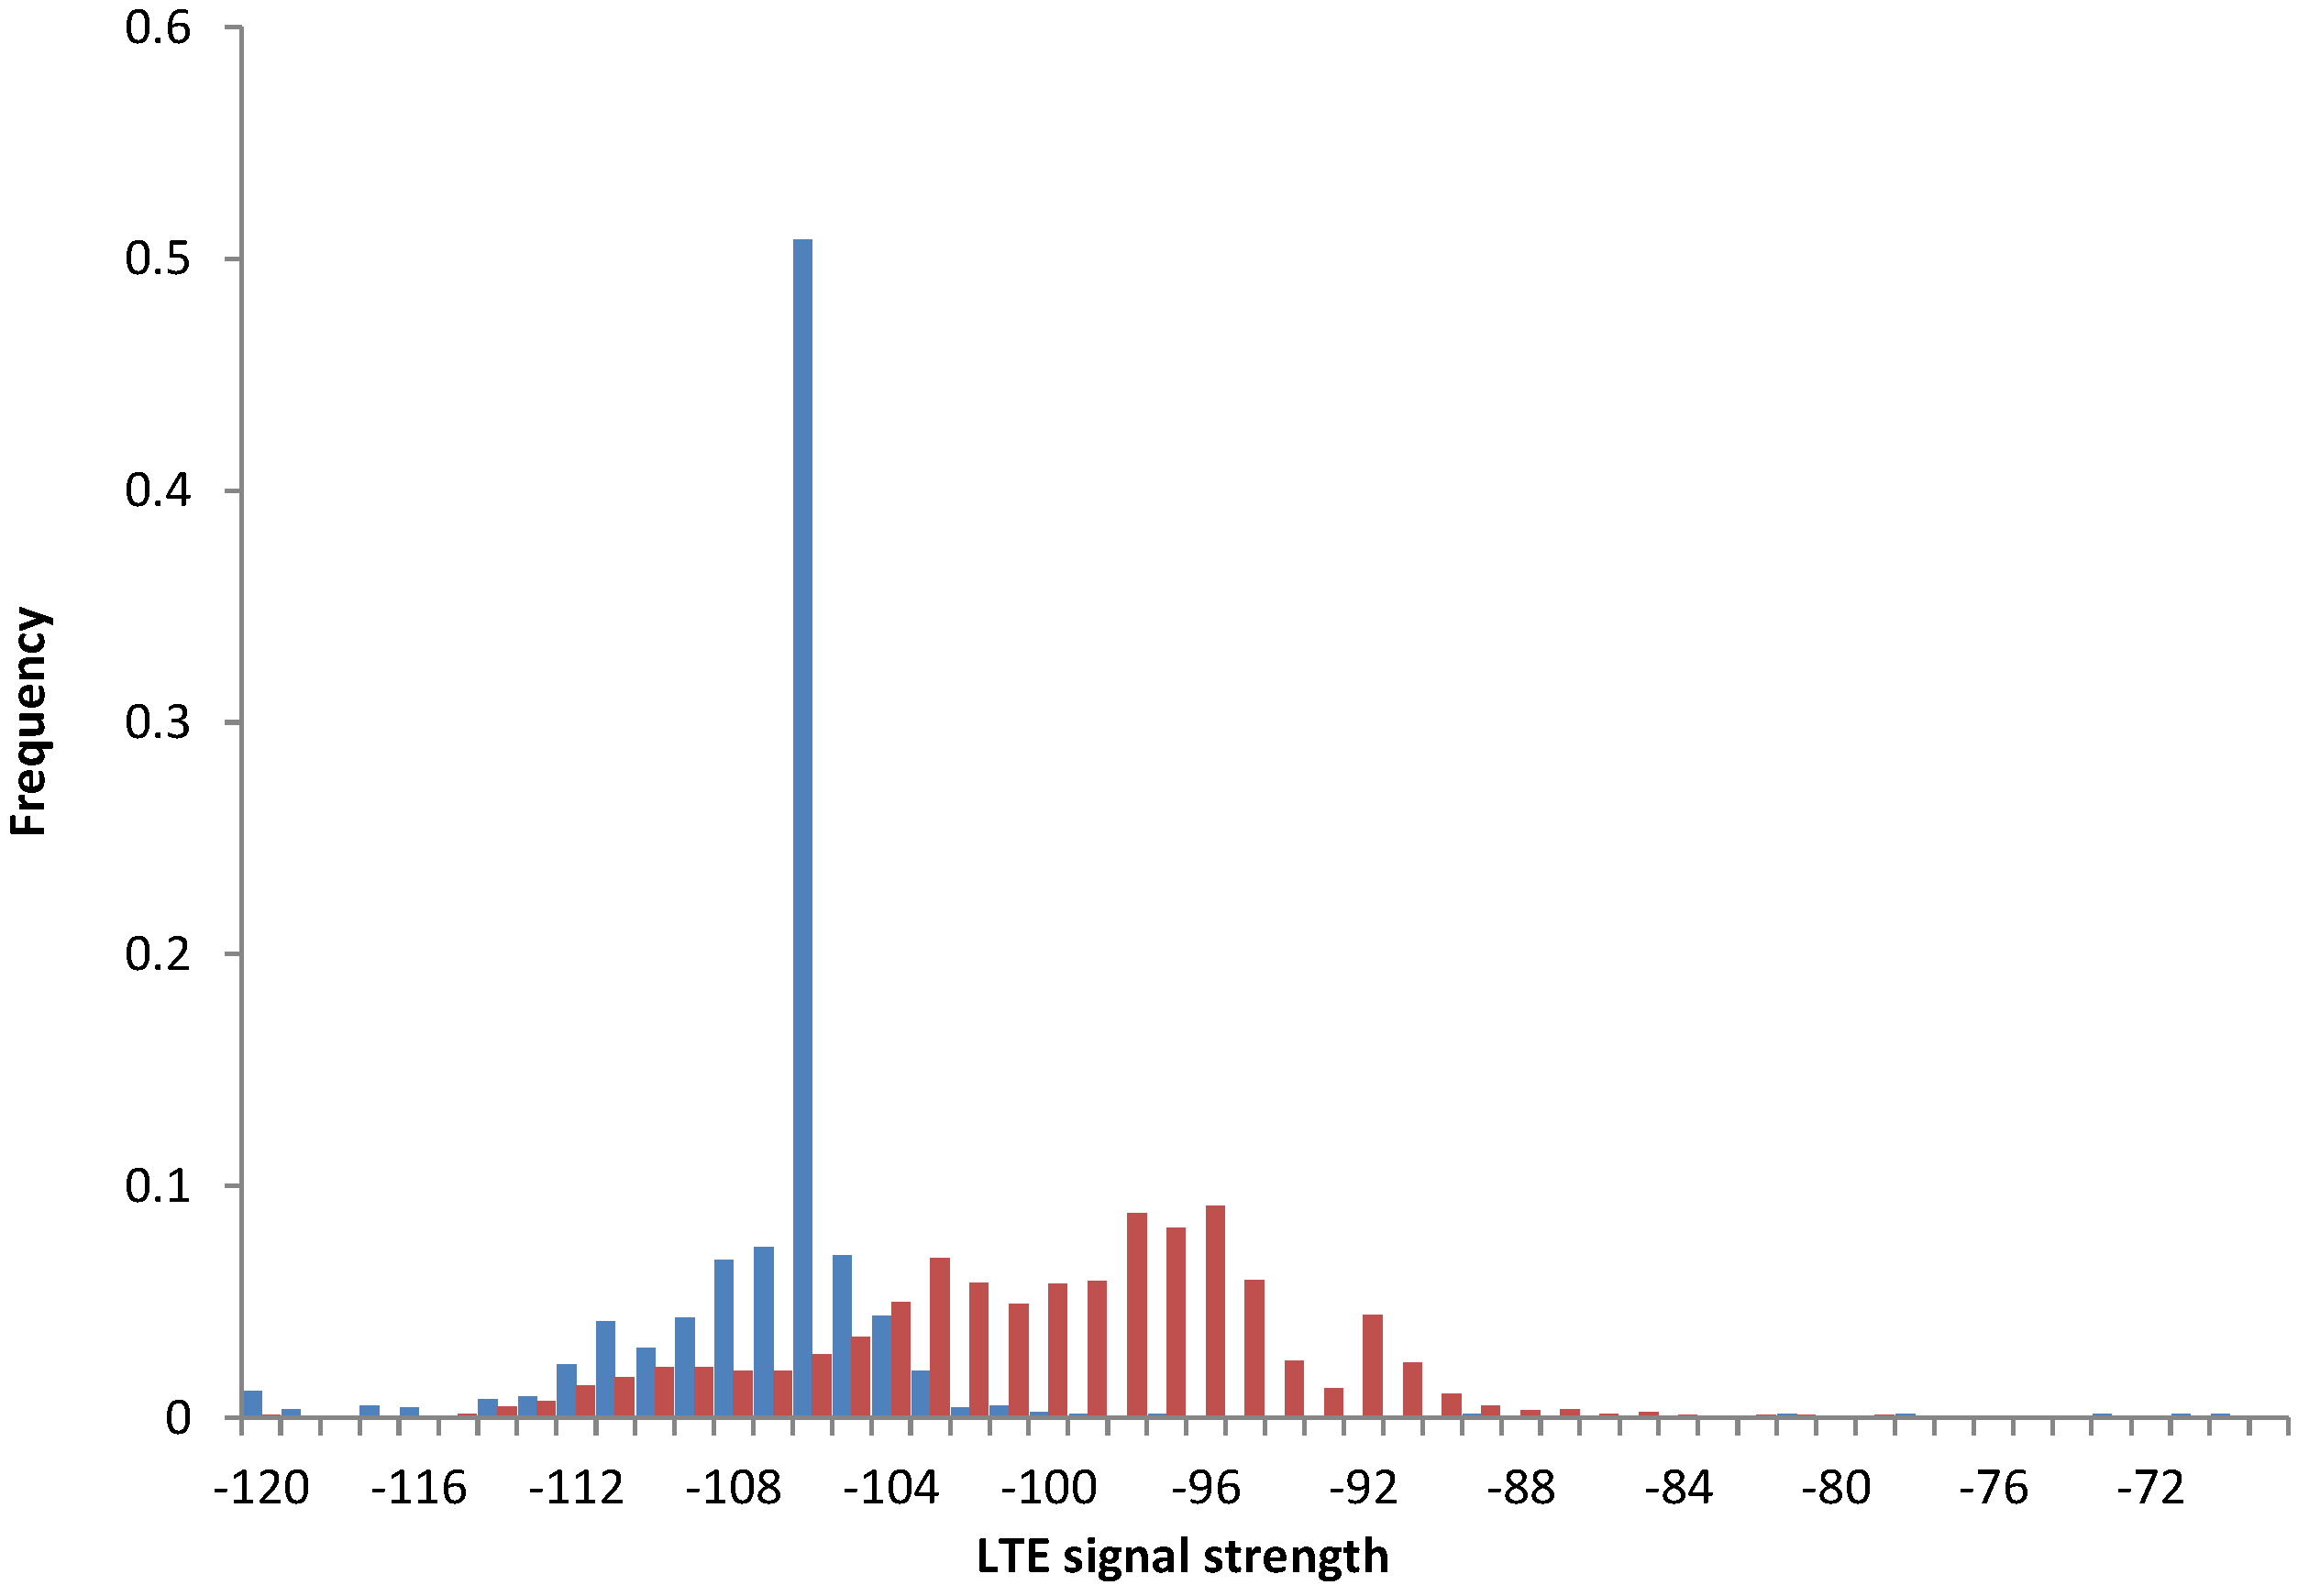
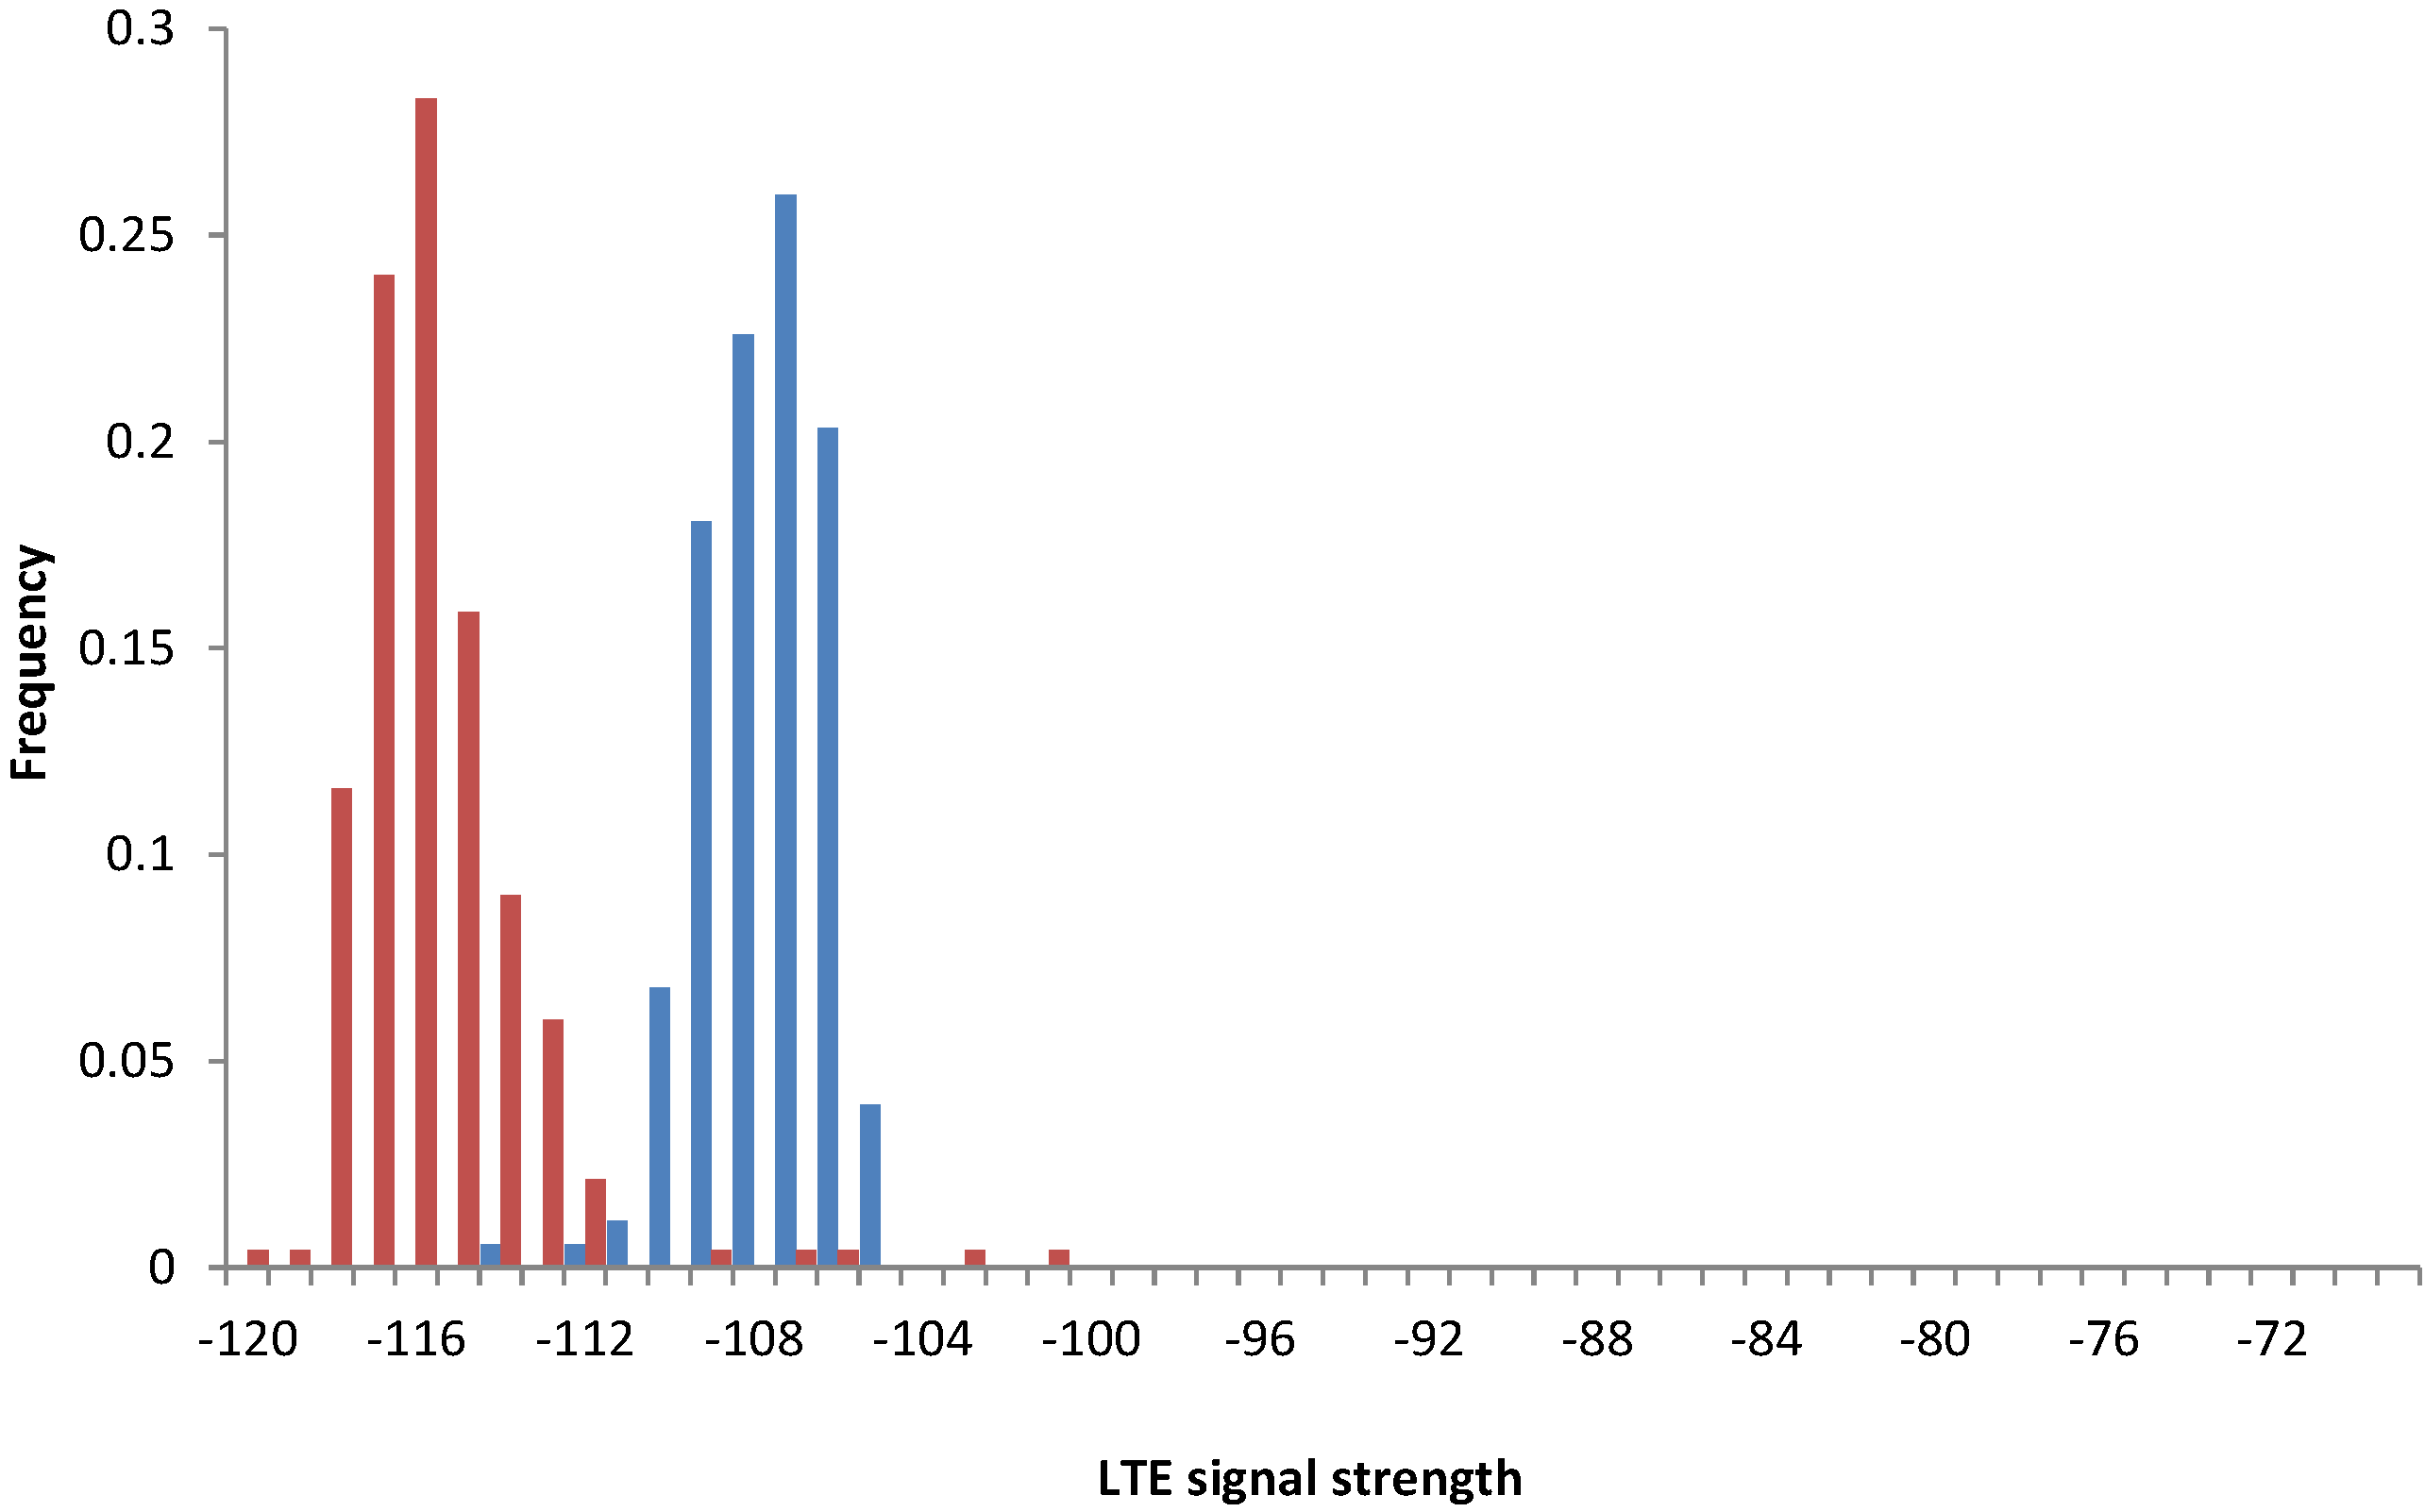
60,
61], where the authors research the characteristics of signal strength changes in buildings and the possibilities of simulating this phenomena.
5.3. Battery Impact
In order to verify the effectiveness of our battery saving method, we evaluated BX Tracker on real mobile devices. Our goal was to learn how the perpetual location tracking affects the battery life and how it aligns with user expectations. We ran an experiment with a group of volunteers, and we analyzed the real data stored in our BX Tracker platform.
(1) Two-week experiment: First, we measured battery usage on 12 real devices carried everyday by a group of 10 people. We asked them to install a battery monitoring application and to use their devices in a typical way for one week, without BX Tracker. Then, we asked our volunteers to install and run BX Tracker for one more week, while still monitoring the battery usage. We also asked the group not to change their phone usage habits during the whole experiment. Of course, we acknowledge that we could not fully control all of the factors that impact the battery usage and that our sample group was small. Hence, the obtained results only approximate the real battery impact of BX Tracker, averaged for different mobile devices.
In order to monitor the battery usage, we provided the experiment group with a custom application. Whenever a phone charger was connected to the device, the application logged information about the percentage of the battery that was used, relative to the most recent event of the phone charger being disconnected. In other words, we monitored the amount of energy that was used after each time the battery was re-charged. We also logged the date and time of measurement, the time since the last re-charging and the information if the BX Tracker service process was running. We filtered the data by ignoring the measurements for which: (i) the user re-connected the charger quicker than after 2.5 h; (ii) the user re-charged the battery in the morning after
h, that is after sleep; and (iii) the battery level decreased by less than 5%. After two weeks, we collected the information and analyzed the change in battery usage for each device separately. For four devices, the logged data did not indicate that the BX Tracker process was running or we received very few measurements (1–2), so we skipped them. For the rest of the eight devices, please see
Table 4 for the obtained results.
Table 4.
Impact of BX Tracker on battery consumption, as measured on various mobile devices. BD: average battery drain per hour; BL: estimated battery lifetime on a full charge; E: estimated energy usage.
Table 4.
Impact of BX Tracker on battery consumption, as measured on various mobile devices. BD: average battery drain per hour; BL: estimated battery lifetime on a full charge; E: estimated energy usage.
| Device | Battery (mAh) | No Tracking | Tracking | Difference |
|---|
| BD (%/h) | BL (h) | BD (%/h) | BL (h) | BD (%/h) | BL (h) | E (mWh) |
|---|
| Galaxy S2 Lite | 1500 | 2.4 | 42 | 3.9 | 26 | +1.5 | −38% | +83 |
| Galaxy S3 | 2100 | 4.2 | 24 | 5.0 | 20 | +0.8 | −16% | +62 |
| Galaxy S4 | 2600 | 3.5 | 29 | 5.3 | 19 | +1.8 | −34% | +170 |
| Xperia Z1 C | 2300 | 1.9 | 53 | 2.4 | 42 | +0.5 | −21% | +43 |
| Xperia Z2 | 3200 | 1.4 | 71 | 1.5 | 67 | +0.1 | −7% | +12 |
| Nexus 5 | 2300 | 3.2 | 31 | 3.7 | 27 | +0.5 | −14% | +43 |
| ME302KL No. 1 | 6760 | 0.6 | 167 | 0.7 | 140 | +0.1 | −16% | +28 |
| ME302KL No. 2 | 6760 | 0.7 | 152 | 0.8 | 130 | +0.1 | −15% | +30 |
| Average: | +0.7 | −20% | +59 |
The first six devices are the popular smartphones made by Samsung, Sony and LG, whereas the last two devices are Asus tablet devices, with a much larger battery capacity. We consulted manufacturer data to obtain the declared battery capacity and assumed that a 100% battery level corresponds to the declared values. The BD metric presented in the table measures the average battery drain per hour, and the BL metric estimates the battery lifetime on a full charge, given the BD value: . The E metric roughly estimates the real energy usage, assuming the average battery voltage of 3.7 V, which is common: , where C is battery capacity.
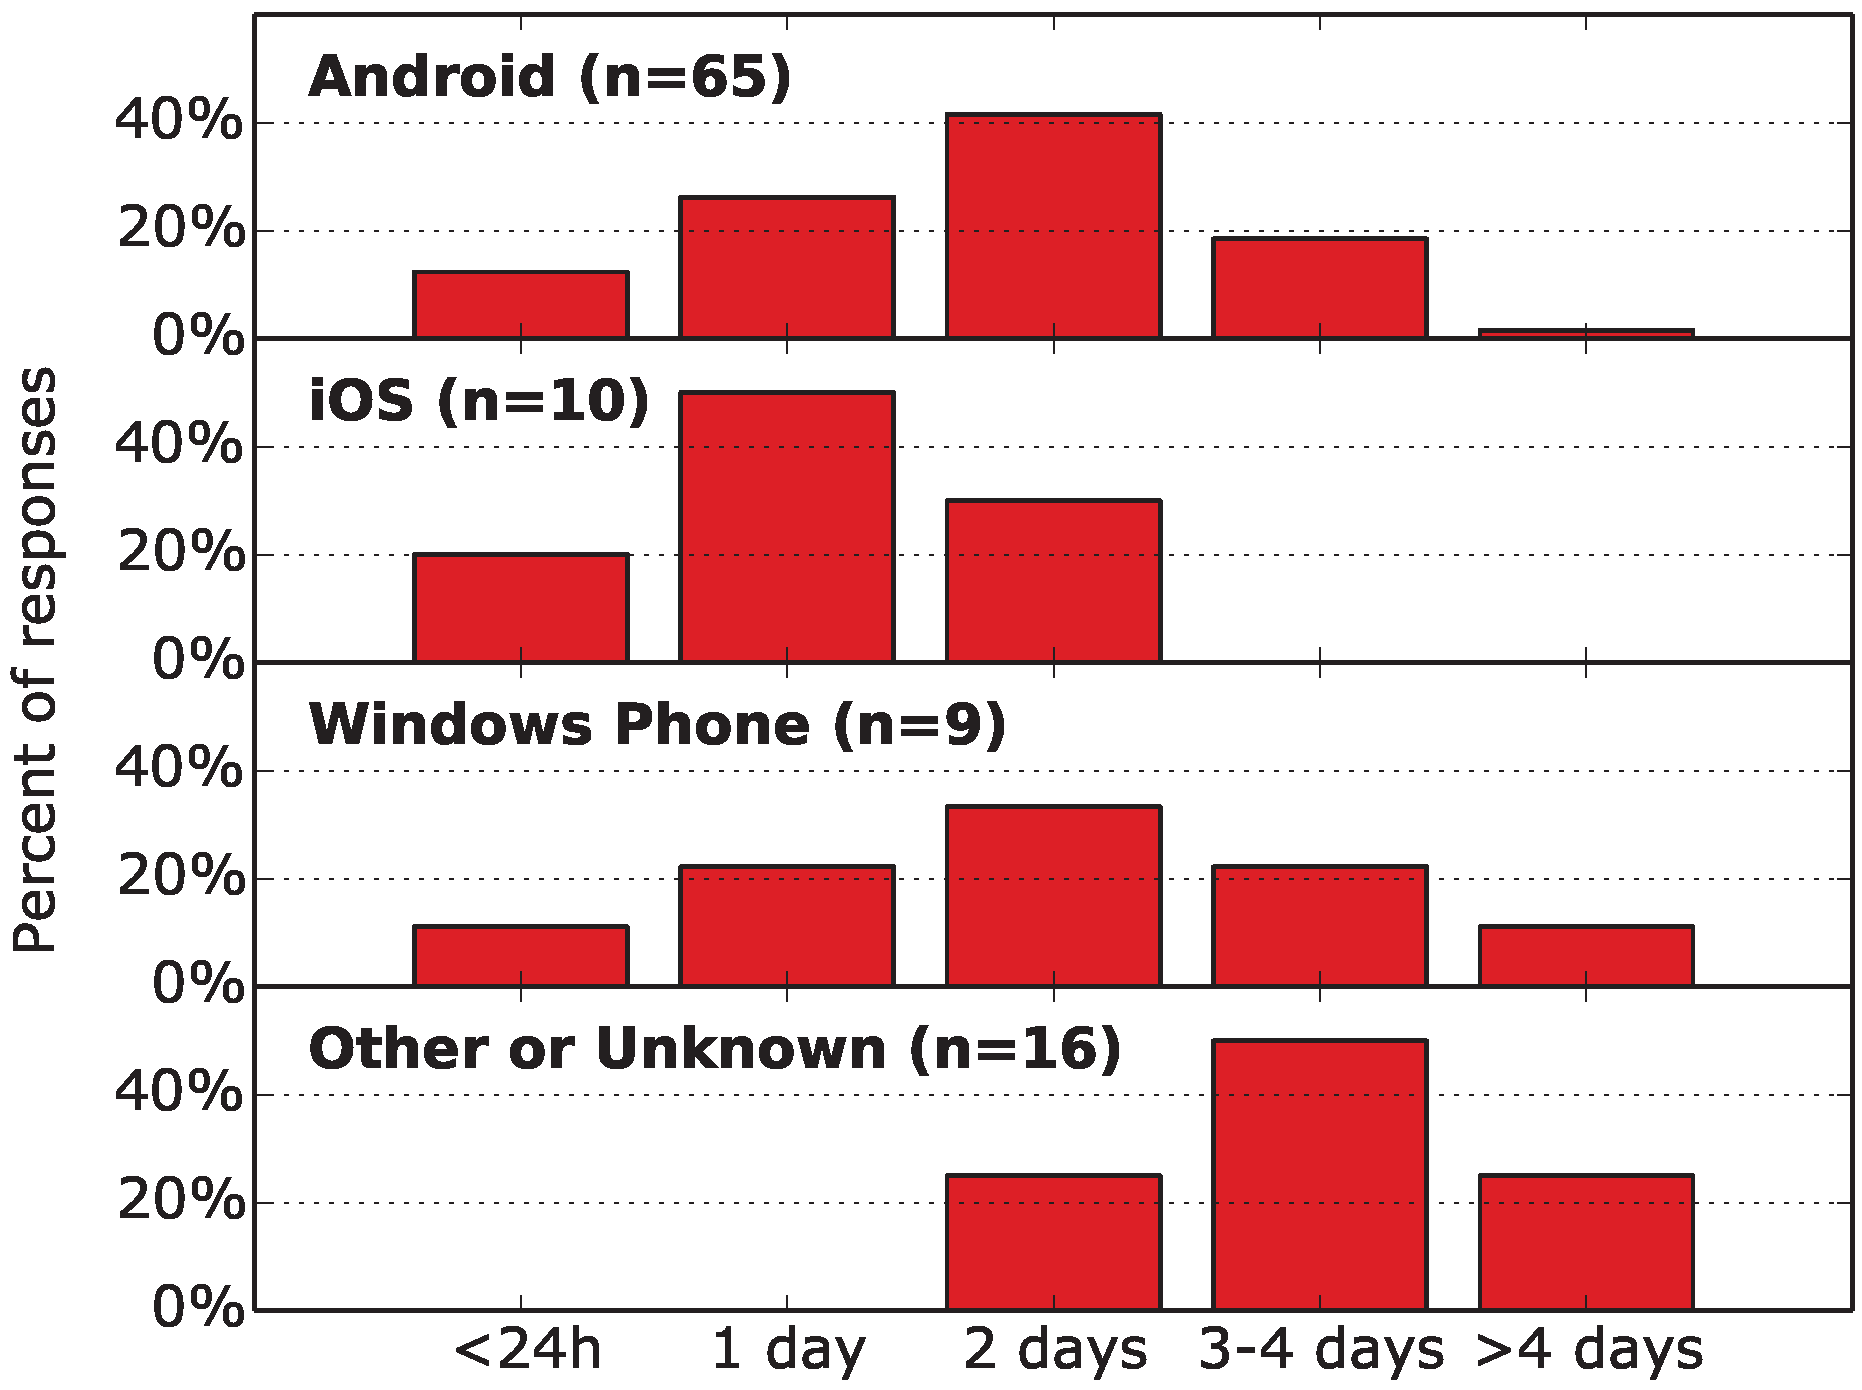
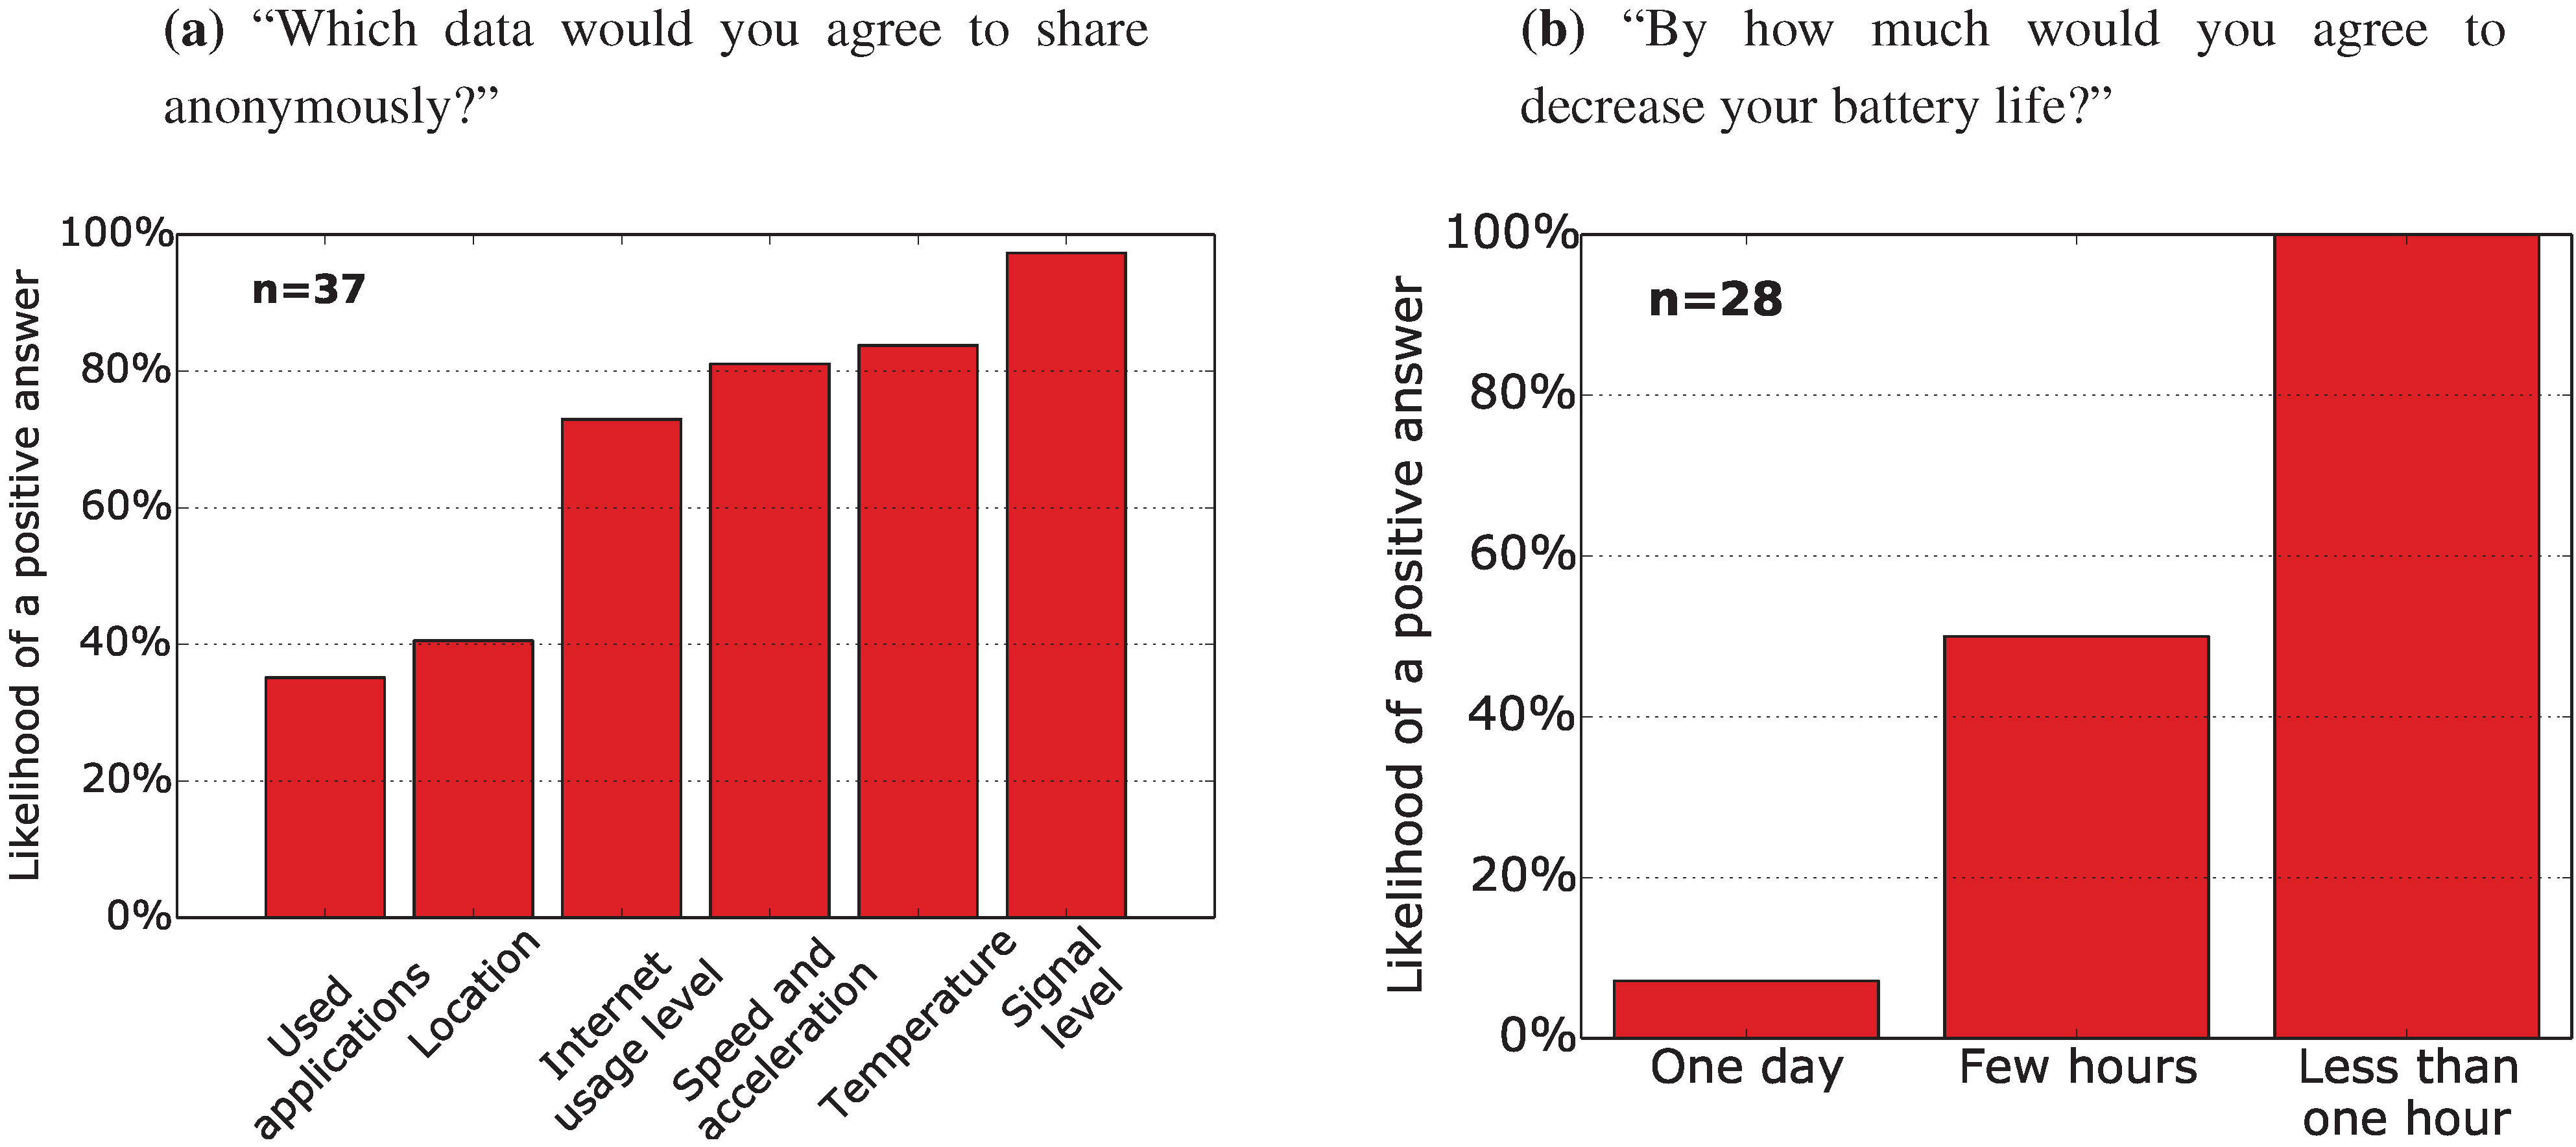
As shown in the table, BX Tracker on average decreased the battery lifetime by 20%. For the most popular battery lifetime in our survey, two days, this corresponds to decreasing the lifetime from 48 h down to 38 h. This still could be enough to give the user an acceptable phone experience, but in our survey, the respondents expected a decrease in battery lifetime by less than one hour or less than a few hours (see
Figure 2b). However, our results show that even with aggressive energy optimizations, it is difficult to completely meet user expectations. From the technical point of view, the results show that it is possible to perpetually track the GPS position on an Android smartphone without draining the battery in a dozen of hours. We also estimated the real energy usage to enable comparison between smartphones and tablets, which differ in the battery capacity and, thus, have a different battery drain per hour. BX Tracker on average used 59 mWh, with a possible outlier (the Galaxy S4), which was probably caused by some other applications being activated on the phone in the second week of our experiment.
Figure 7.
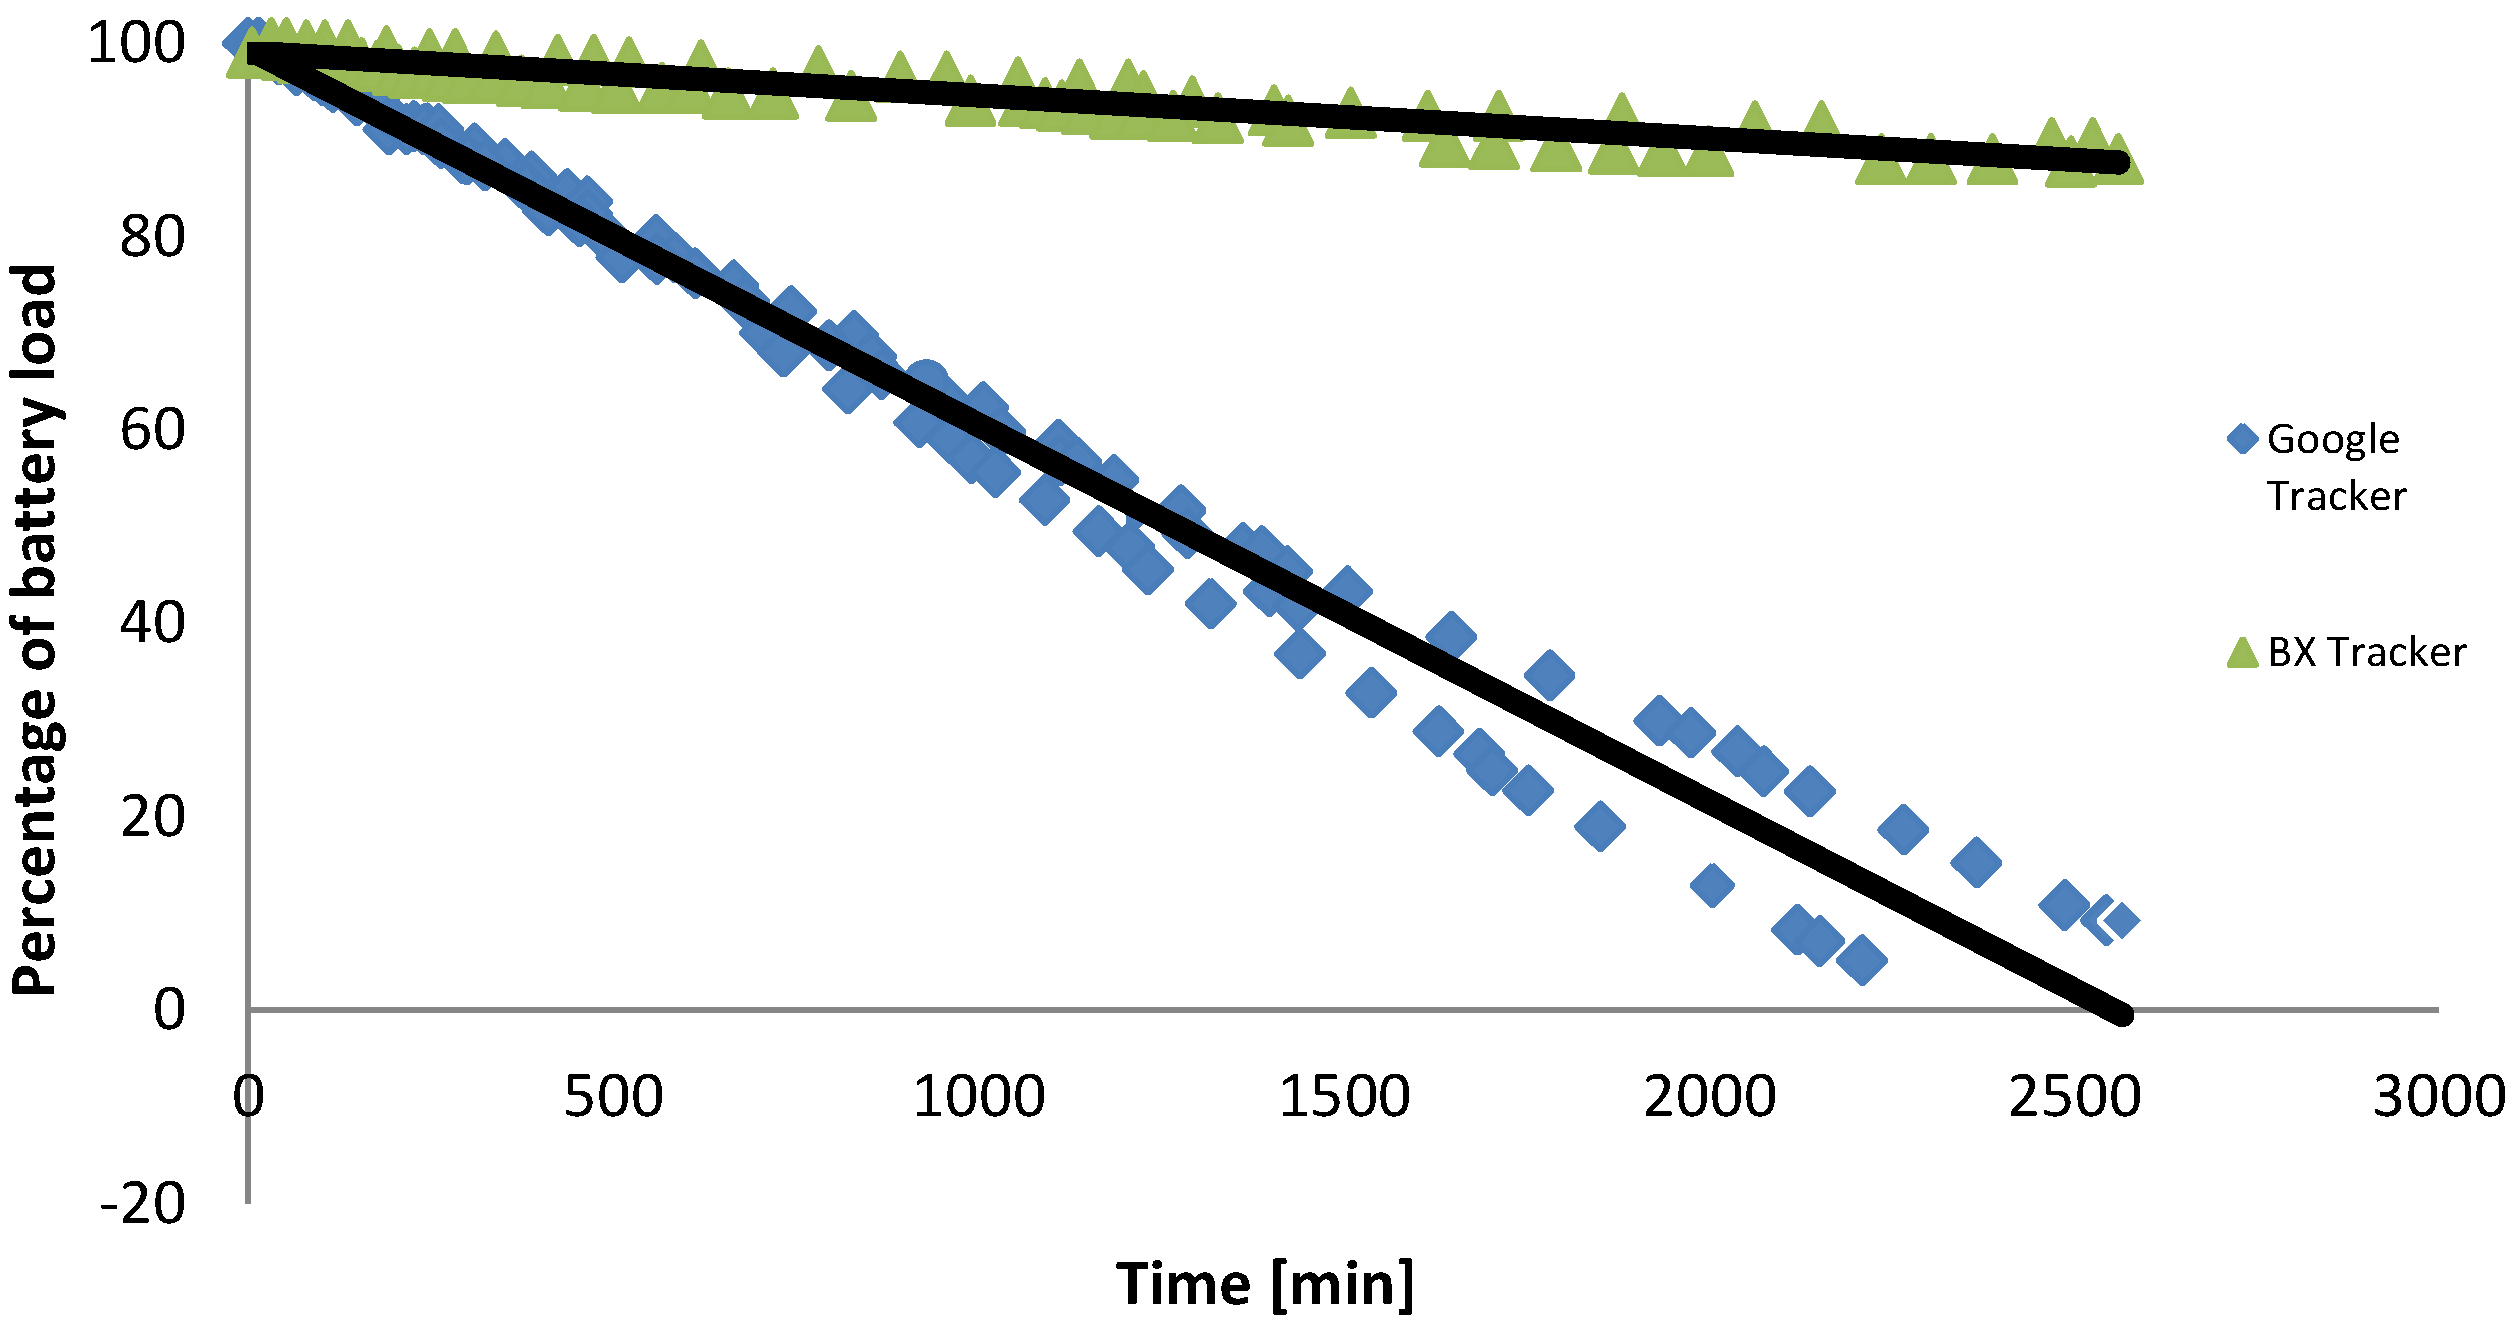
Comparison of battery use for BX Tracker and Google Tracker.
Figure 7.
Comparison of battery use for BX Tracker and Google Tracker.
The next experiment compared the energy utilization of the proposed BX Tracker application to a popular location tracking application: Google Tracker. The tests were performed on two identical Asus ME302KL tablets, both with the same software, not connected to the Internet and not running any additional applications in the background (the difference in their discharge characteristics without tracking application was lower than 1%. Google Tracker was installed on one device and BX Tracker on the other device. The devices were turned on only during travel and keeping them always on with active trackers. The cumulative results of the test repeated twice are shown on
Figure 7. After 2500 min of tests, the BX Power used less than 20% of the battery capacity, while the device running Google Tracker has been completely discharged.
(2) Collected data: We also analyzed the real data stored in the BX Tracker database, collected for one year by 44 different user identifiers. The data corresponds to over 272,000 events of searching for a GPS fix. We analyzed two factors for the tracked devices: the daily duty cycle of the GPS chip, presented in
Figure 8, and the time between starting and stopping the GPS fix procedure, presented in
Figure 9.
Figure 8.
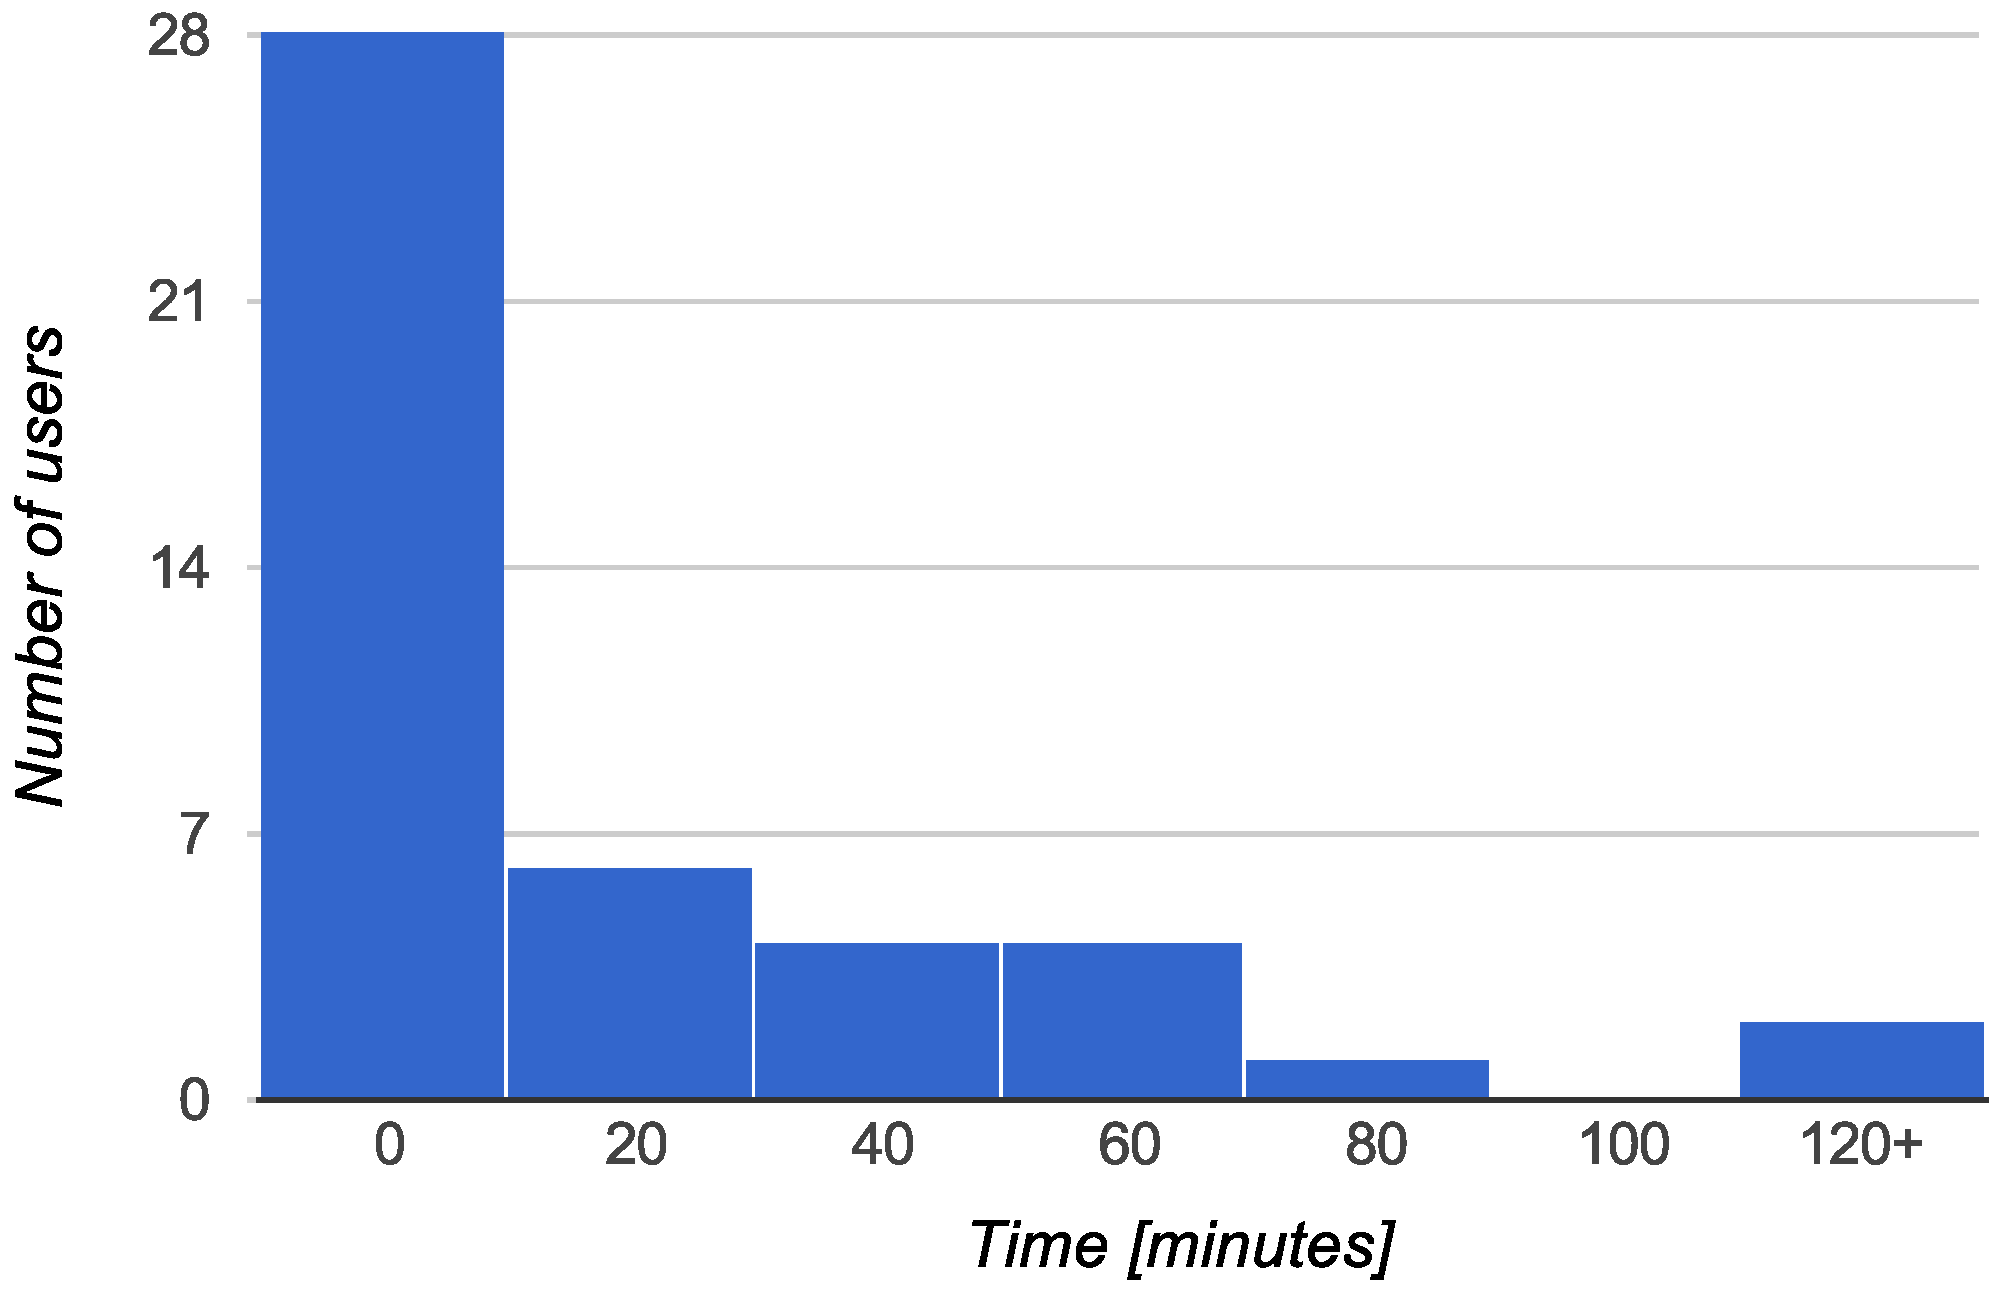
Total time of GPS activity per day. Measurements on 44 unique user identifiers.
Figure 8.
Total time of GPS activity per day. Measurements on 44 unique user identifiers.
Figure 9.
Time of GPS activity before providing a position fix or being disabled due to poor signal. Random 5% sample from 272,000 measurements on 44 unique user identifiers.
Figure 9.
Time of GPS activity before providing a position fix or being disabled due to poor signal. Random 5% sample from 272,000 measurements on 44 unique user identifiers.
For the data presented in
Figure 8, the majority of users experienced the total time of the GPS chip being on for less than 20 min in 24 h, which corresponds to a 1.4% duty cycle. Moreover, 84% of users experienced a duty cycle of 4.2% (60 min) or less, and 95% of users experienced a duty cycle of 8.3% (2 h) or less. The average total daily activity of the GPS was 29 min (2.0% duty cycle).
For the data presented in
Figure 9, in 89% of the cases, the GPS was stopped in less than 20 s. For 92% of the samples, the process ended in less than 30 s, and for 97% of the samples, the process ended in less than 45 s. Only 1.7% of the GPS queries were finalized in more than 1 min.
These experimental data show the vast potential for optimizing GPS usage, comparing to a situation in which it is constantly enabled and searches for a position fix as long as possible. The data confirm our algorithm design presented in the previous subsection. As a more general conclusion, people spend the vast majority of their time stationary, as shown in [
49], and briefly demonstrated by our Experiment 1 in the next section.


