
Design and Implementation of Real-Time Vehicular Camera for Driver Assistance and Traffic Congestion Estimation

Abstract
:1. Introduction
2. Smart Vehicular Camera
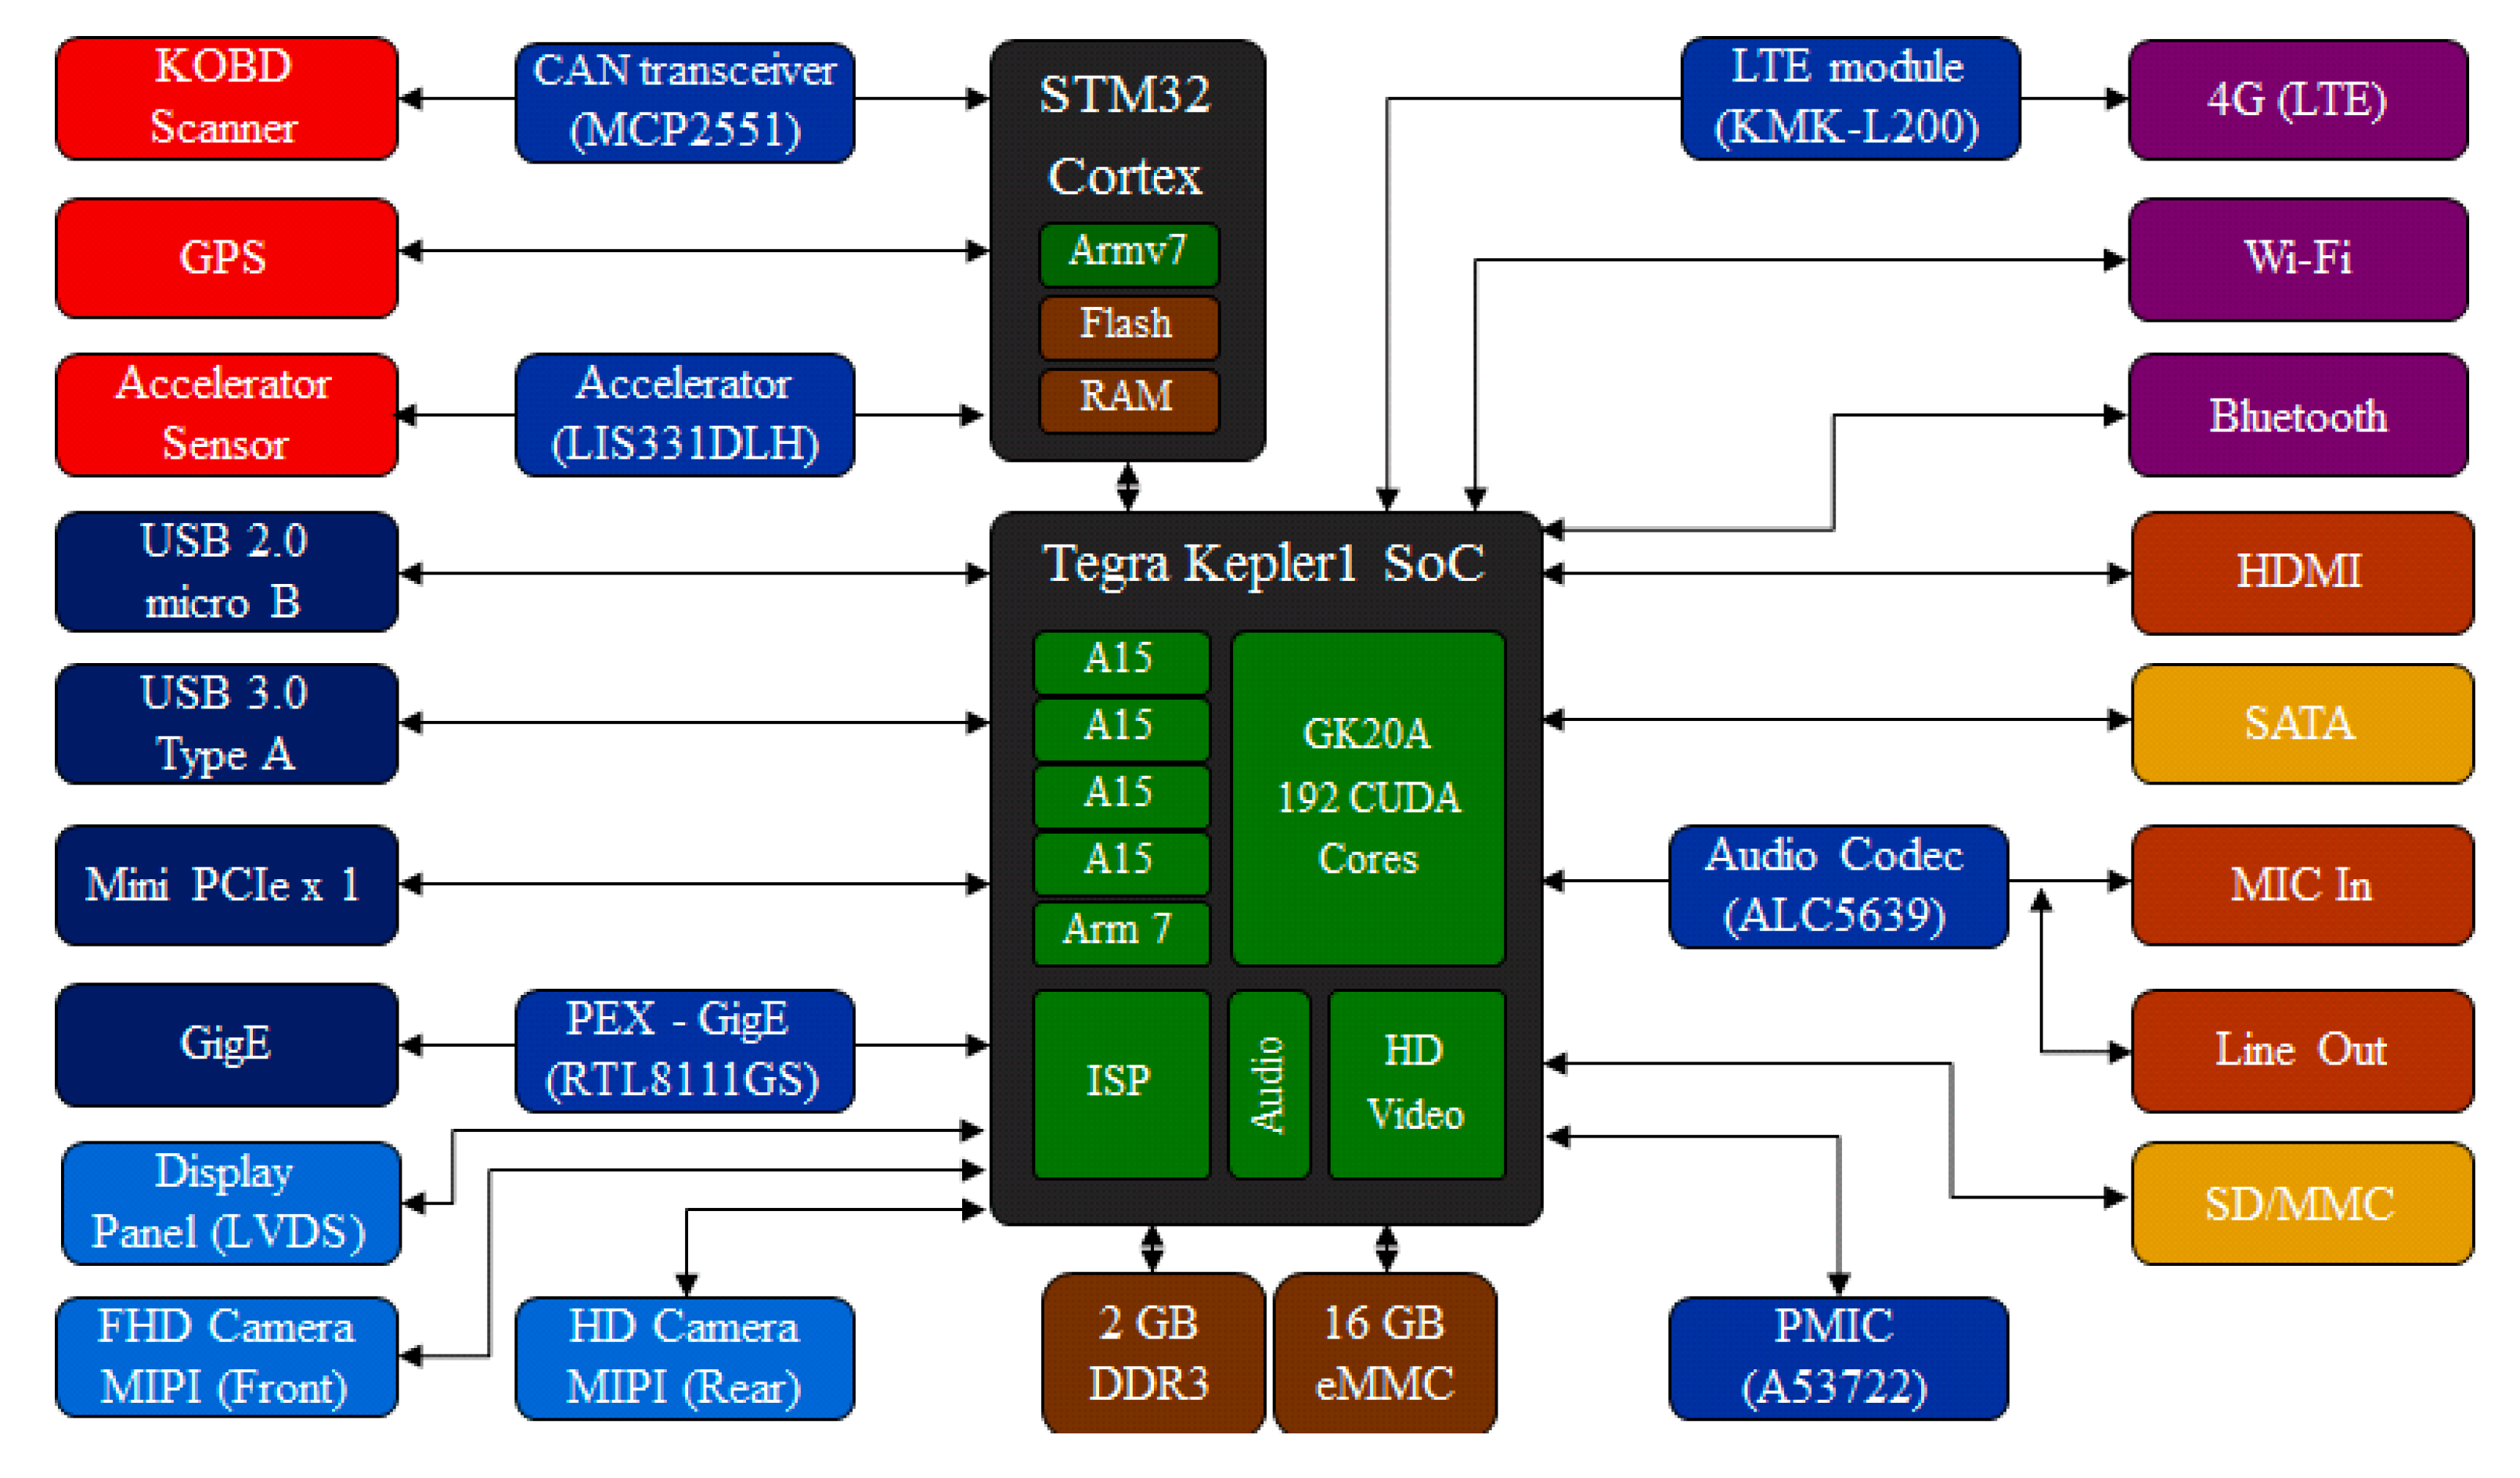
2.1. Hardware Design

| Arndale Exynos 5 | ODROID-X2 | ODROID-XU | JETSON | |
|---|---|---|---|---|
| CPU | Exynos 5420 Octa Cortex™-A15 1.7 GHz quad, Cortex™-A7 quad | Exynos 4412 Quad Cortex™-A9 1.7 GHz quad | Exynos 5410 Octa Cortex™-A15 1.6 GHz quad, Cortex™-A7 quad | Tegra Kepler1 4-plus-1 Cortex™-A15 2.3 GHz |
| GPU | Mali-T628 | Mali-400 MP40 | PowerVR SGX544MP3 | Kepler GPU with 192 CUDA |
| RAM | 1 GB LPDDR3 | 2 GB LPDDR2 | 2 GB LPDDR3 | 2 GB LPDDR3 |
| Storage | SDMMC4 | SDMMC4 | SDMMC4 | 16 GB fast eMMC4 |
| Power | 5 V/4 A DC | 5 V/2 A DC | 5 V/4 A DC | 12 V/5 A DC |
| Parameter | Value |
|---|---|
| Library (algorithm) | OpenCV 2.4.9 (HOG) |
| Input image size | WVGA (800 × 480) |
| Size of detection windows | 48 × 96 |
| Scale | 1.05 |
| Level | 13 |
| Hit threshold | 1.4 |
| Stride | 8 pixels |
| Development Board | Performance (FPS) |
|---|---|
| Arndale (Exynos 5420) | 1.89 |
| Odroid-X2 (Exynos 4412) | 2.21 |
| Odroid-XU (Exynos 5410) | 3.25 |
| JETSON (NVIDIA TK1, CPU only) | 3.82 |
| JETSON (NVIDIA TK1 CPU, GPU) | 15.86 |
| PC (Intel i5) | 13.82 |
| PC (Intel i5, NVIDIA GeForce 750) | 44.12 |
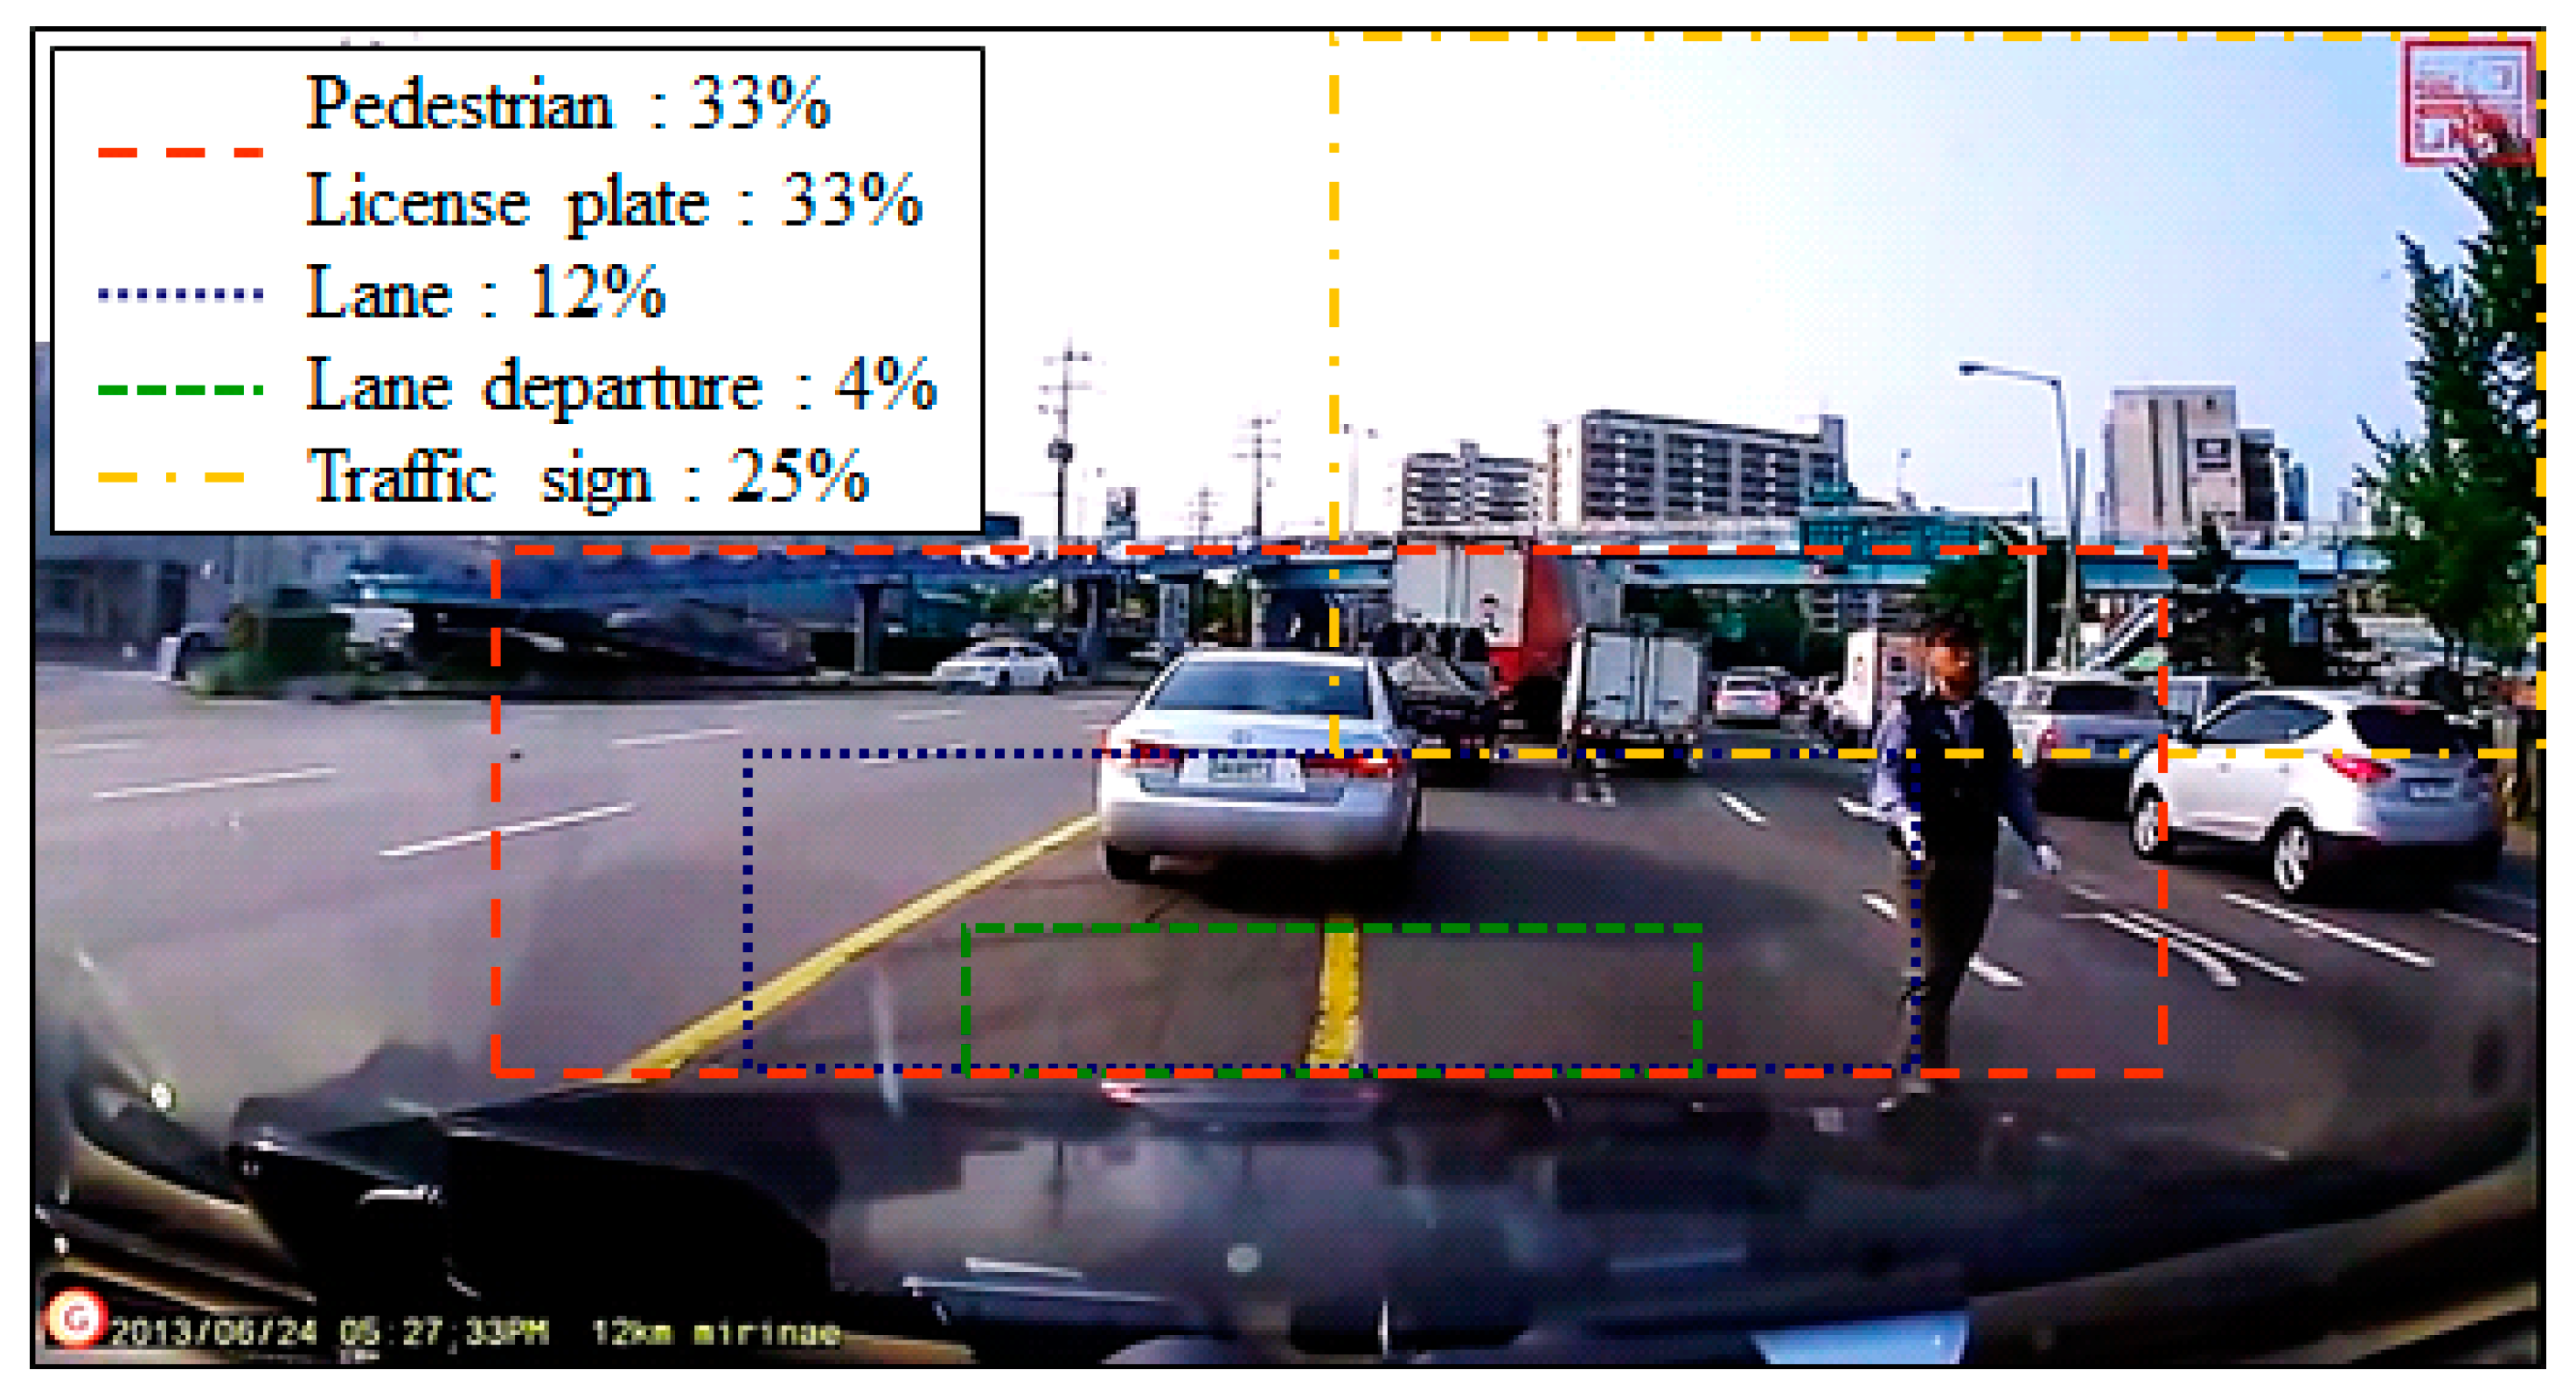
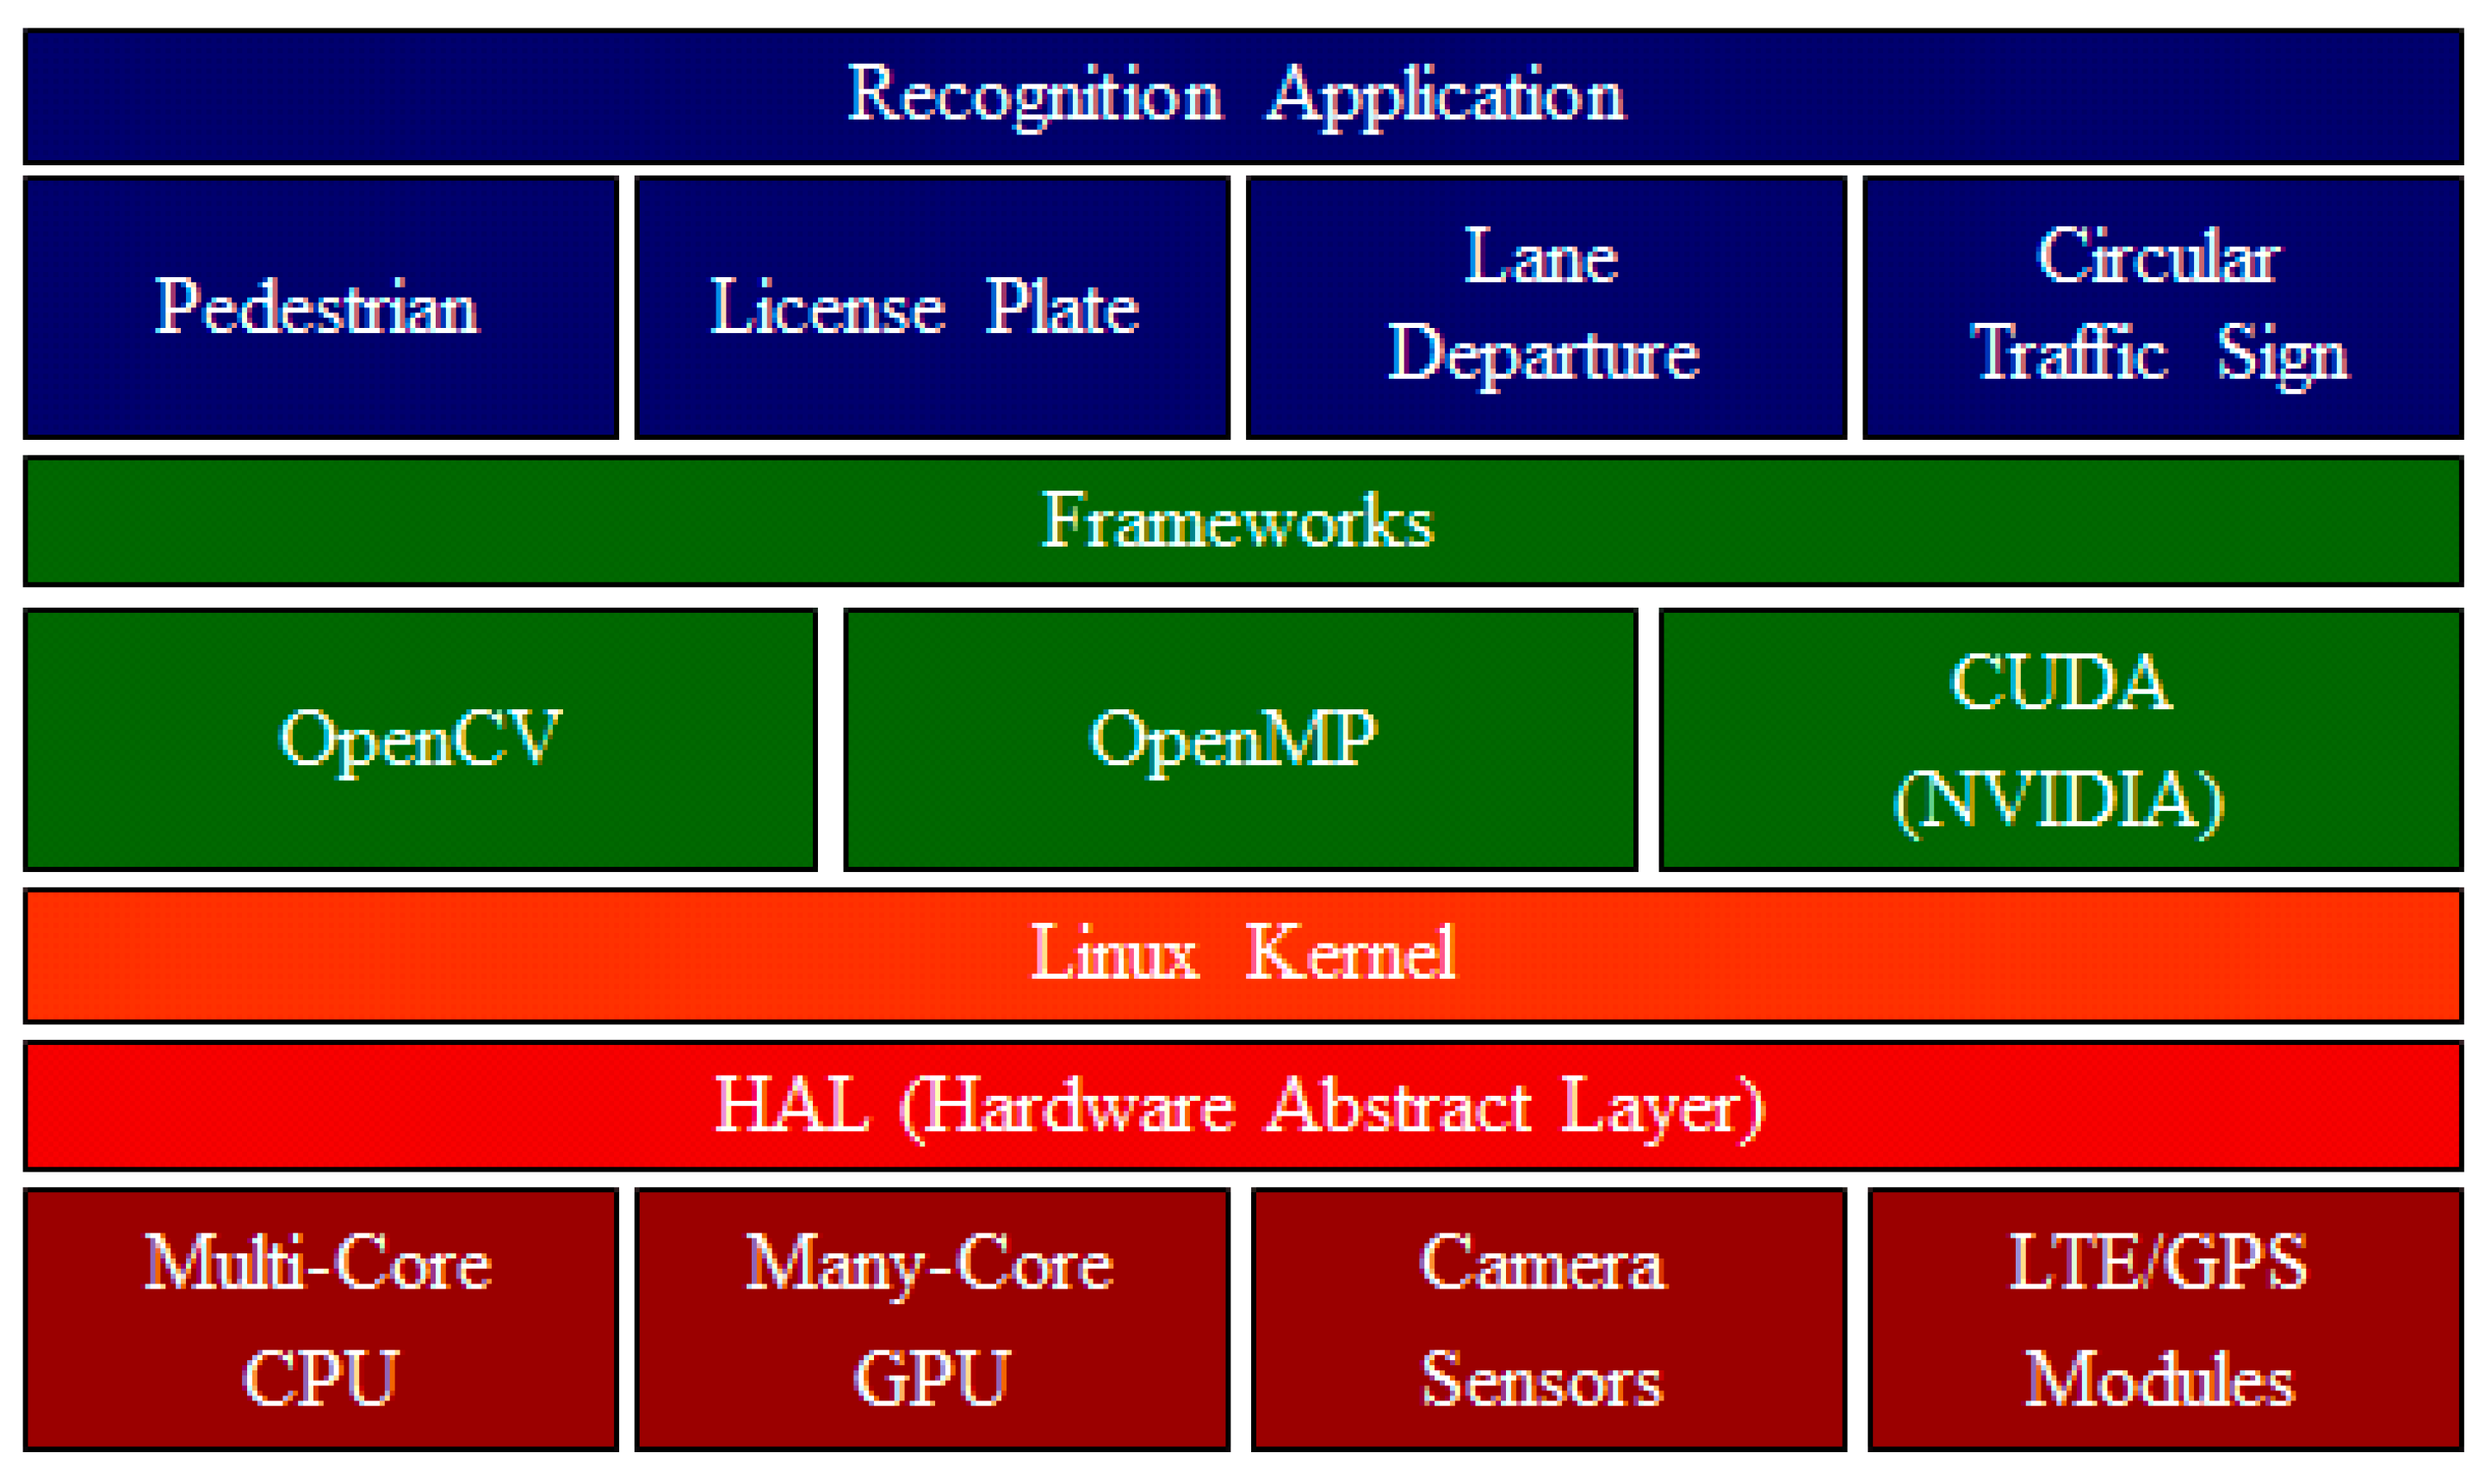
2.2. Software Design
3. Methods of Minimizing Computing Load
3.1. D-ROI Method

3.2. DFS Method
| Algorithm 1. Pseudocode of D-ROI and DFS methods for minimizing computing load. |
| frame ← the frames from camera device s ← vehicular speed value ΔA ← vehicular acceleration value Initialised ROI = S-ROI, frame_count = 0, D-ROI_count = 0, target_searching = false for all frame do frame _count = (frame _count + 1) % FRinp FRskip% = min [α × standardisation(s) × standardisation (ΔA), FRinp] if FRskip % frame_count = 0 then if ROI ≠ S-ROI then D-ROI_ count += 1 end if else then target_searching, CR = recognition_algorithm (ROI) If target_searching = false or D-ROI_ count > D-ROI_ threshold then ROI = S-ROI D-ROI_ count = 0 else then D-ROI = CR + MR ROI = D-ROI D-ROI_ count += 1 end if end if end for |
4. Real-Time Traffic Information System
5. Performance Evaluation
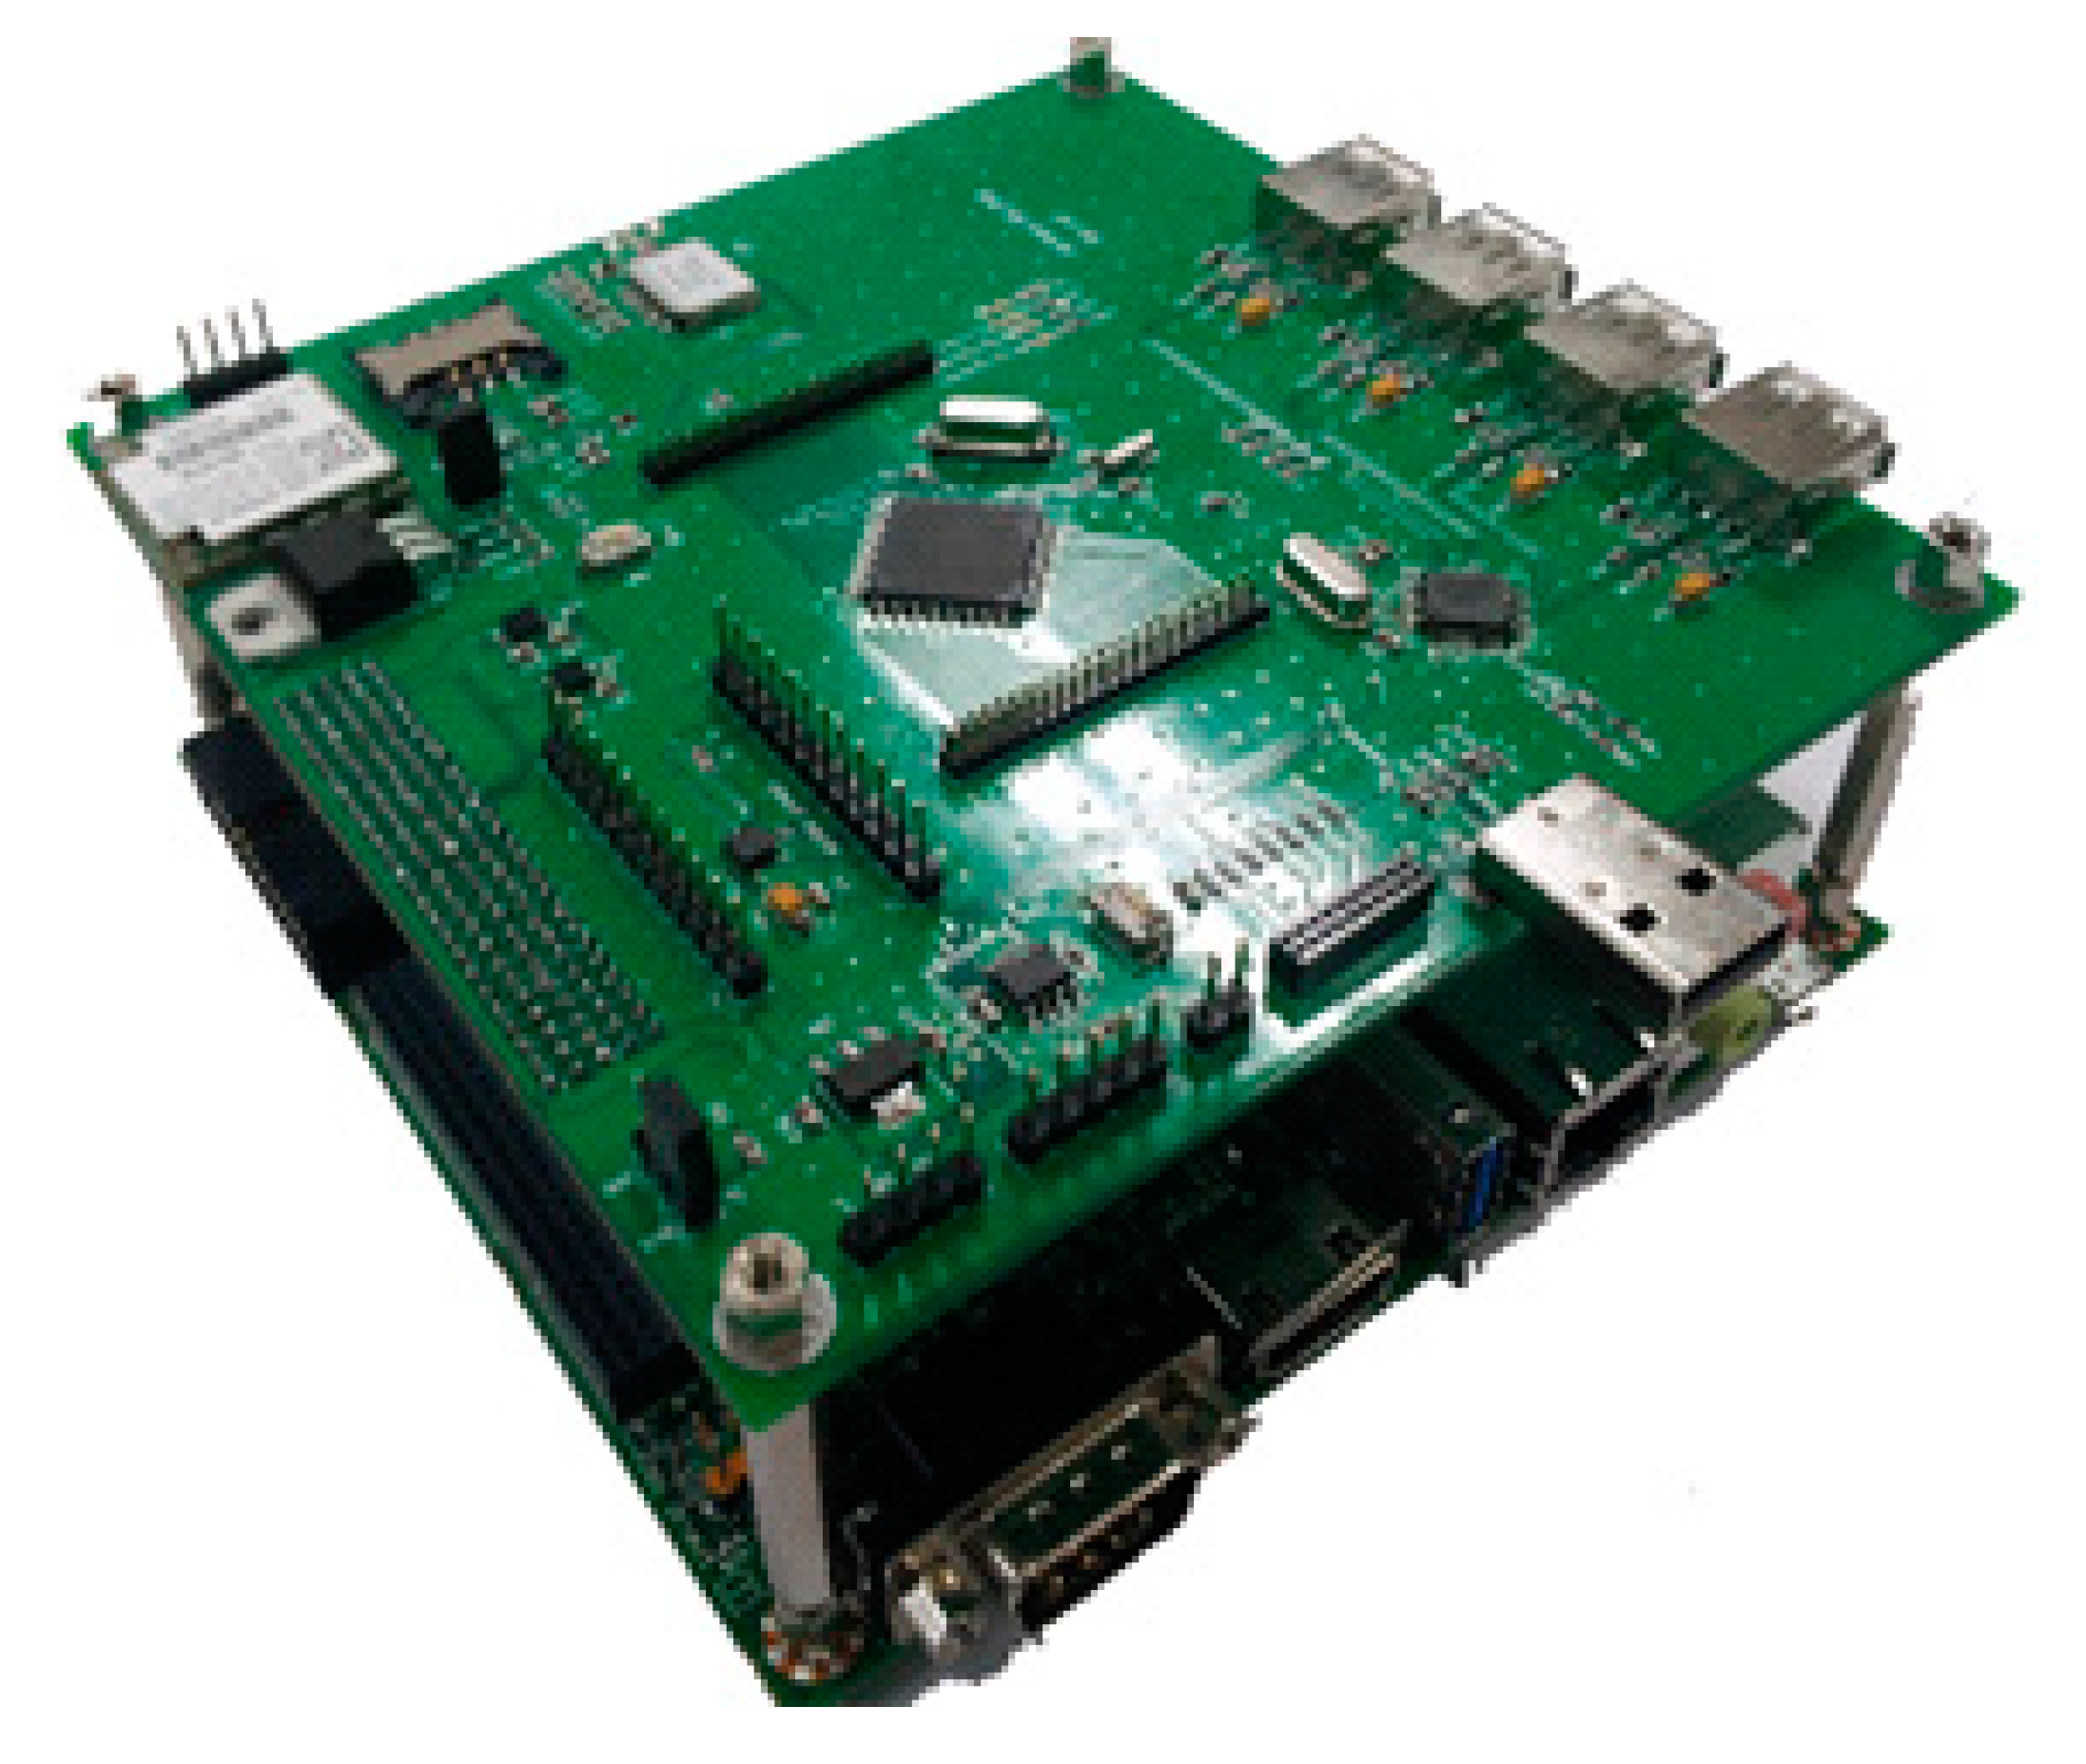
5.1. Implementation for Performance Evaluation

| Mainboard | NVIDIA Jetson Tegra Kepler1 |
| Microprocessor | STM32F105 |
| LTE module | KMK-L200 |
| GPS module | GMMU1 |
| Accelerator sensor | LIS331DLH |
| CAN transceiver | MCP2551 |
| USB hub controller | TUSB2046 |
| Board size | 127 mm × 127 mm × 35 mm |
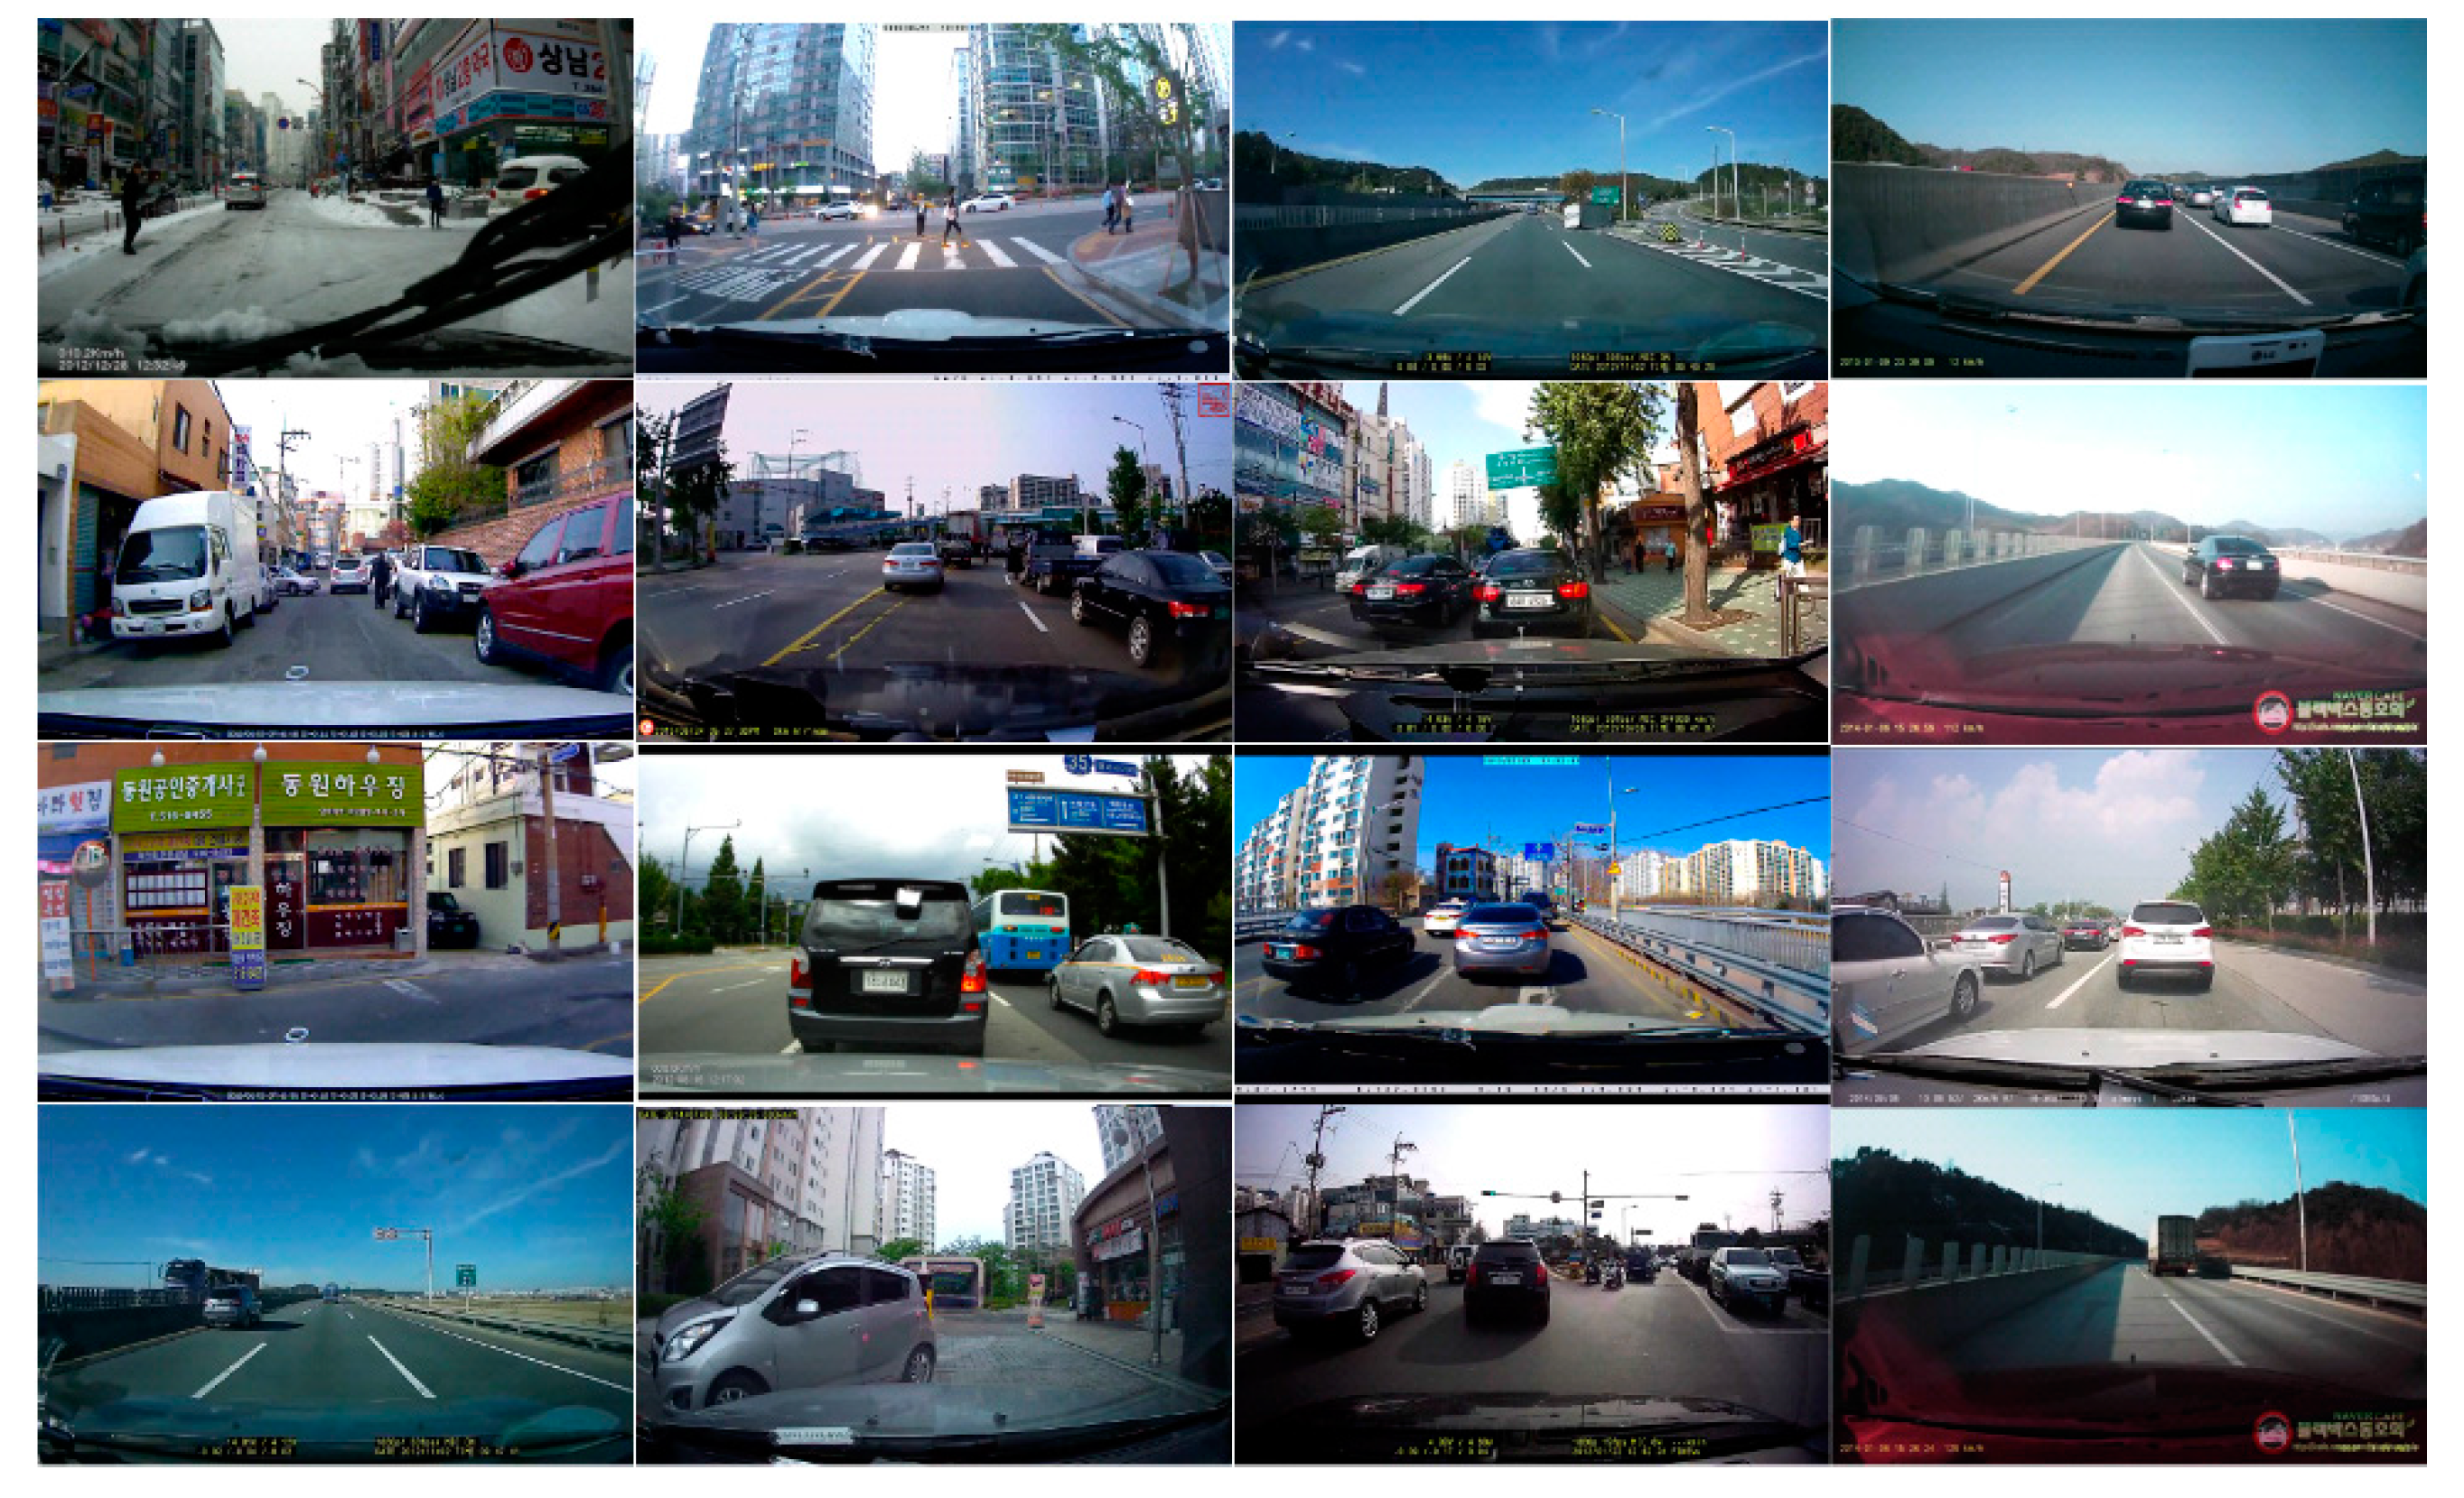
5.2. Image Processing in the Vehicle Environment


| n | Pedestrian Recognition | License Plate Recognition | ||||||||
|---|---|---|---|---|---|---|---|---|---|---|
| image#1 | image#2 | image#3 | image#4 | image#5 | image#6 | image#7 | image#8 | image#9 | image#10 | |
| 0 | 95.28% | 31.52% | 95.00% | 54.55% | 43.66% | 99.25% | 77.08% | 11.62% | 59.49% | 98.67% |
| 1 | 87.74% | 29.35% | 81.67% | 45.45% | 39.44% | 99.25% | 77.08% | 11.62% | 59.49% | 98.67% |
| 2 | 87.74% | 27.17% | 86.67% | 50.00% | 40.85% | 99.63% | 76.67% | 11.62% | 59.49% | 98.67% |
| 3 | 79.25% | 27.17% | 76.67% | 36.36% | 45.07% | 99.25% | 77.08% | 11.62% | 59.24% | 98.67% |
| 4 | 83.96% | 26.09% | 81.67% | 45.45% | 39.44% | 99.63% | 77.08% | 11.62% | 59.24% | 98.67% |
| 5 | 85.85% | 26.09% | 80.00% | 47.73% | 40.85% | 99.63% | 77.08% | 11.62% | 59.24% | 98.67% |
| 6 | 85.85% | 28.26% | 75.00% | 40.91% | 42.25% | 99.63% | 77.08% | 11.62% | 59.24% | 98.67% |
| 7 | 81.13% | 26.09% | 81.67% | 45.45% | 43.66% | 99.63% | 77.08% | 11.62% | 59.24% | 98.67% |
| 8 | 81.13% | 26.09% | 81.67% | 36.36% | 40.85% | 99.63% | 77.08% | 11.62% | 59.24% | 98.67% |
| 9 | 87.74% | 29.35% | 88.33% | 40.91% | 43.66% | 99.63% | 77.08% | 11.62% | 59.24% | 98.67% |
| 10 | 83.02% | 25.00% | 80.00% | 43.18% | 42.25% | 99.63% | 77.08% | 11.62% | 59.24% | 98.67% |

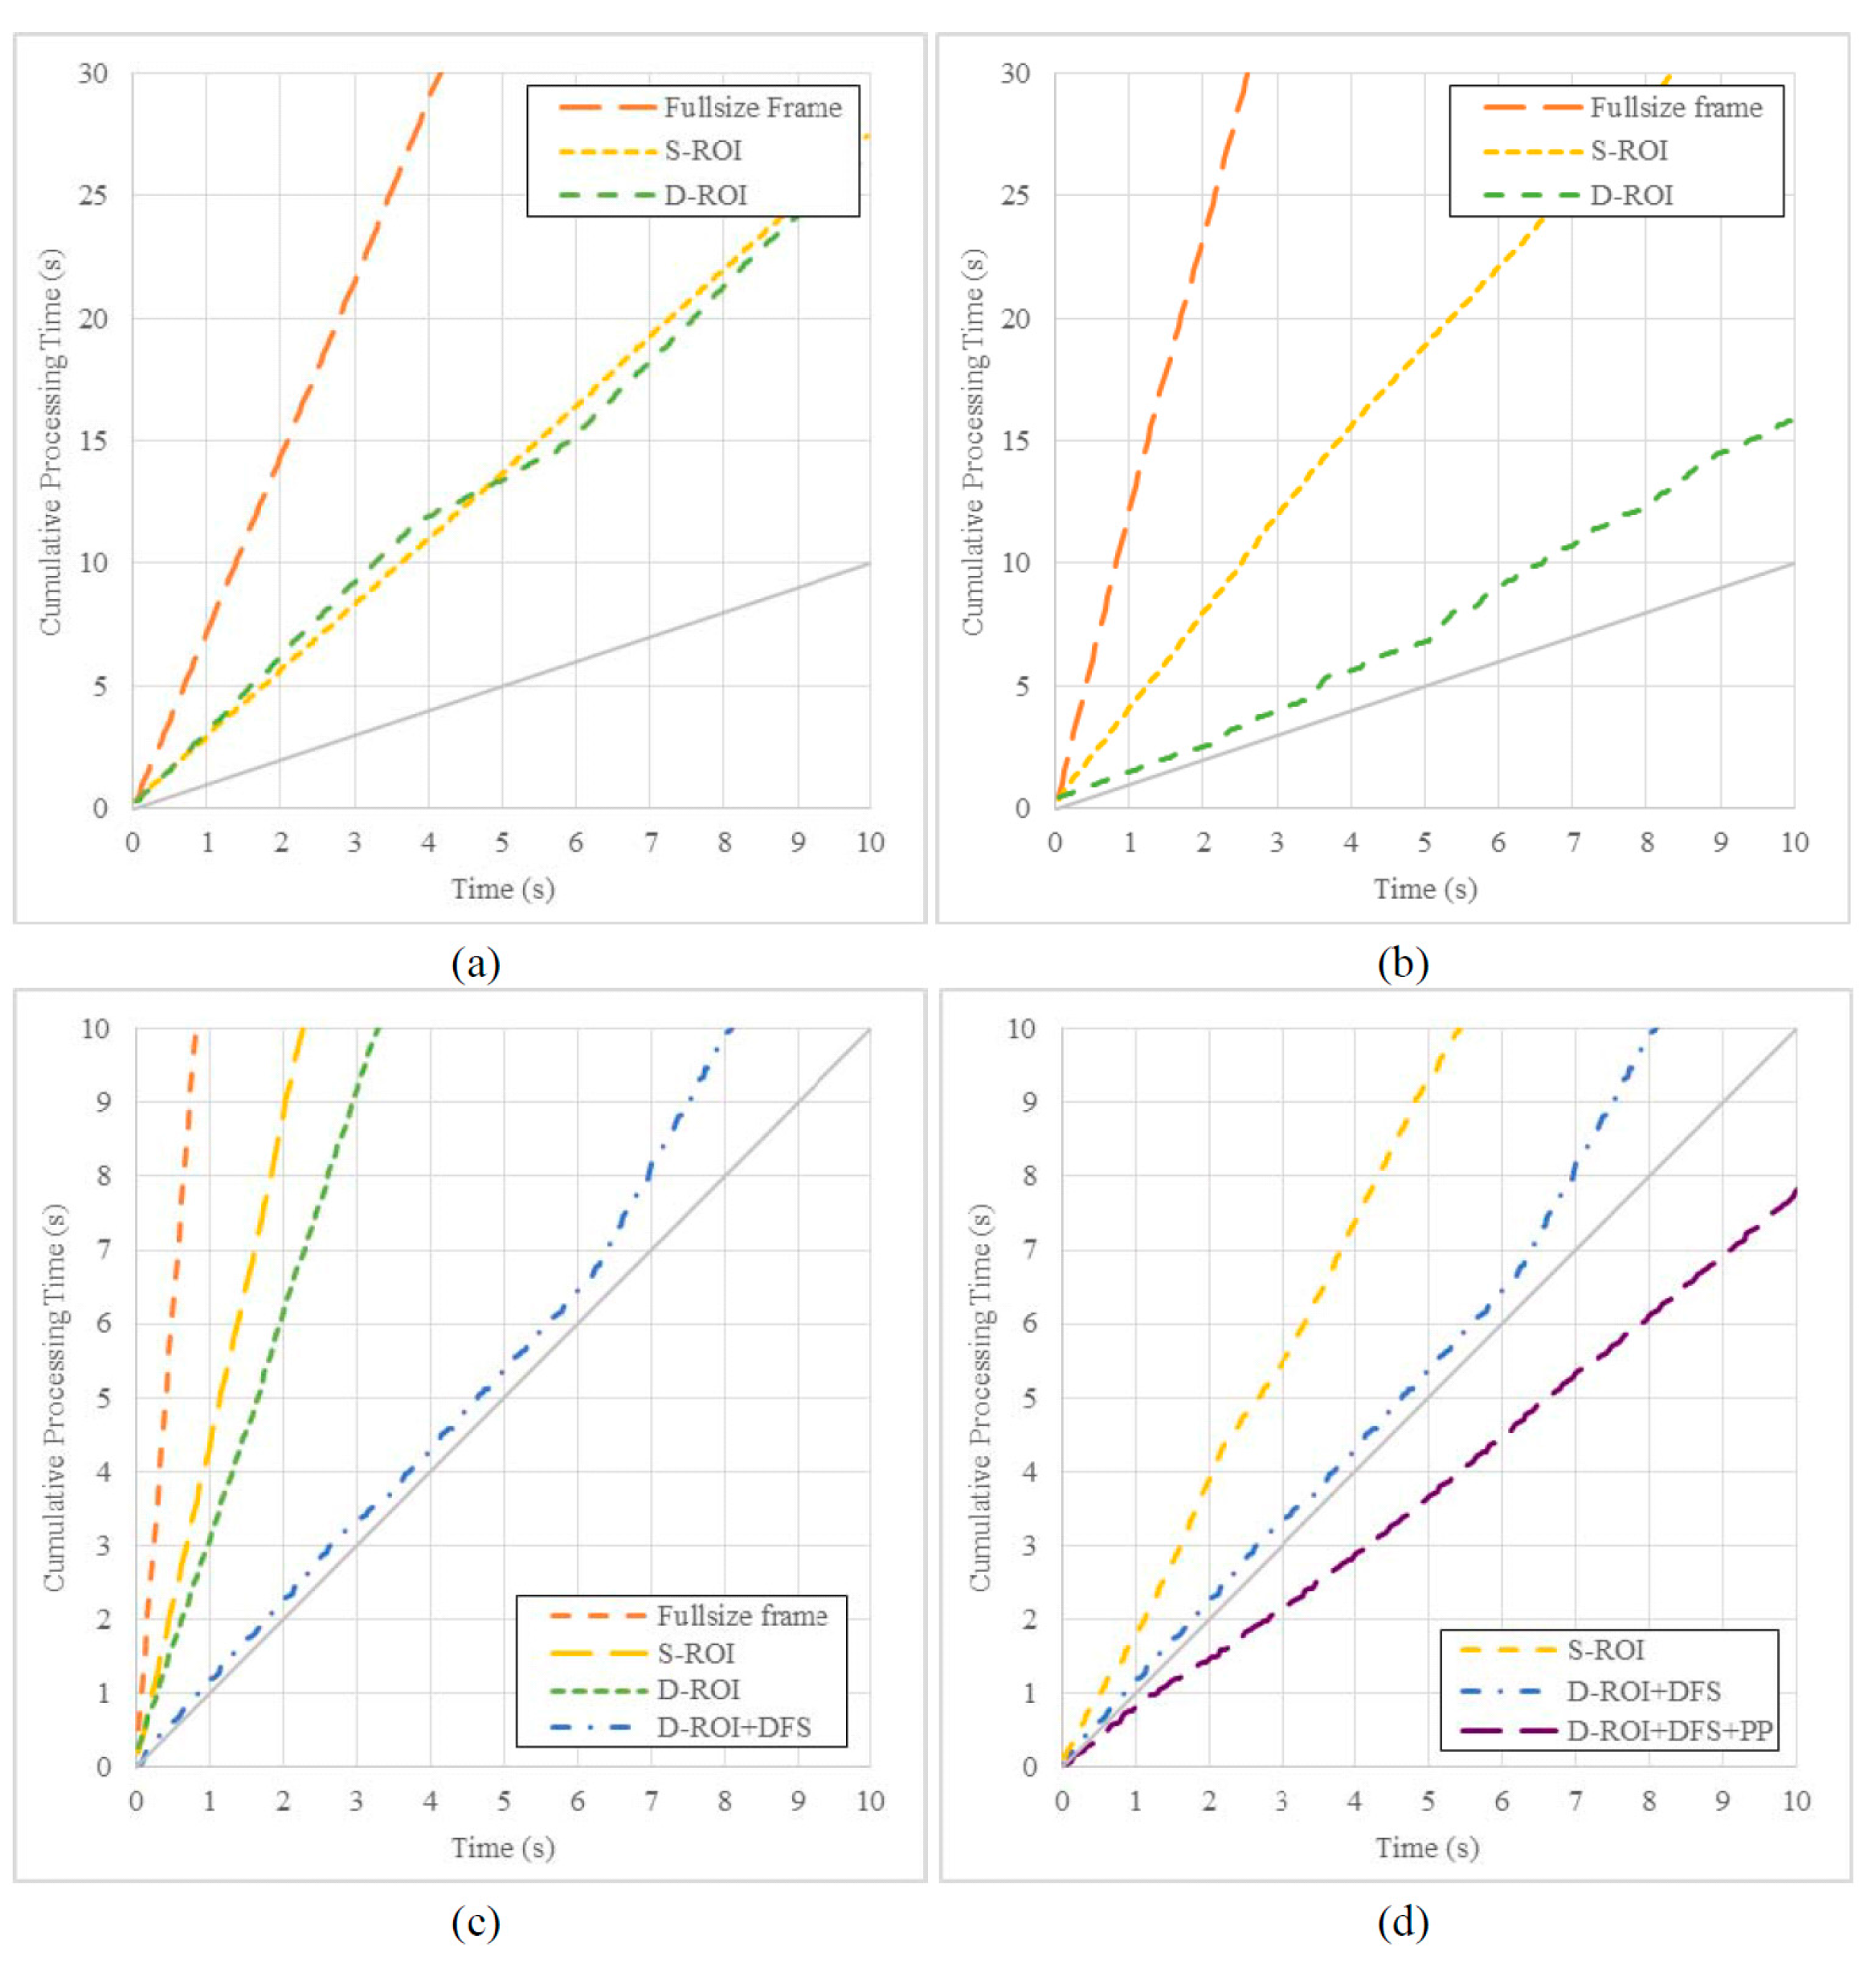
| Combination of Methods | Processing Time | FPS |
|---|---|---|
| D-ROI + DFS + PP | 7.81 | 30.73 |
| D-ROI + DFS | 13.43 | 17.87 |
| D-ROI + PP | 20.62 | 11.64 |
| D-ROI + PP (GPU only) | 21.29 | 11.27 |
| D-ROI + PP (CPU only) | 22.84 | 10.51 |
| S-ROI + PP (GPU only) | 36.69 | 6.54 |
| D-ROI | 27.04 | 8.88 |
| S-ROI | 42.88 | 5.60 |
| Full + PP (GPU only) | 93.27 | 2.57 |
| Full | 120.63 | 1.99 |
| Full-Size Frame | S-ROI | D-ROI | D-ROI + DFS | |||||||||
|---|---|---|---|---|---|---|---|---|---|---|---|---|
| ACC | Recall | Precision | ACC | Recall | Precision | ACC | Recall | Precision | ACC | Recall | Precision | |
| Image #1 | 0.71 | 0.53 | 1.00 | 0.71 | 0.53 | 1.00 | 0.72 | 0.43 | 1.00 | 0.77 | 0.58 | 1.00 |
| Image #2 | 0.51 | 0.73 | 0.93 | 0.50 | 0.71 | 0.91 | 0.58 | 1.00 | 1.00 | 0.56 | 0.21 | 1.00 |
| Image #3 | 0.97 | 0.43 | 0.97 | 0.96 | 0.43 | 0.97 | 0.96 | 0.44 | 1.00 | 0.97 | 0.45 | 1.00 |
| Image #4 | 0.92 | 0.57 | 0.81 | 0.91 | 0.57 | 0.81 | 0.94 | 0.23 | 1.00 | 0.93 | 0.38 | 1.00 |
| Image #5 | 0.74 | 0.05 | 0.83 | 0.74 | 0.04 | 0.83 | 0.77 | 0.16 | 0.81 | 0.78 | 0.20 | 0.81 |
| Average | 0.77 | 0.46 | 0.91 | 0.76 | 0.46 | 0.90 | 0.79 | 0.45 | 0.96 | 0.80 | 0.36 | 0.96 |
| Full-size Frame | S-ROI | D-ROI | D-ROI + DFS | |||||||||
|---|---|---|---|---|---|---|---|---|---|---|---|---|
| ACC | Recall | Precision | ACC | Recall | Precision | ACC | Recall | Precision | ACC | Recall | Precision | |
| Image #6 | 0.63 | 0.63 | 1.00 | 0.63 | 0.63 | 1.00 | 0.46 | 0.50 | 1.00 | 1.00 | 1.00 | 1.00 |
| Image #7 | 0.76 | 0.73 | 1.00 | 0.76 | 0.73 | 1.00 | 0.76 | 0.75 | 1.00 | 0.76 | 0.75 | 1.00 |
| Image #8 | 0.09 | 0.09 | 1.00 | 0.09 | 0.09 | 1.00 | 0.07 | 0.09 | 1.00 | 0.14 | 0.17 | 1.00 |
| Image #9 | 0.92 | 0.92 | 1.00 | 0.92 | 0.92 | 1.00 | 0.92 | 0.92 | 1.00 | 0.91 | 0.90 | 1.00 |
| Image #10 | 0.90 | 0.86 | 1.00 | 0.90 | 0.86 | 1.00 | 0.90 | 0.86 | 1.00 | 0.90 | 0.82 | 1.00 |
| Average | 0.66 | 0.64 | 1.00 | 0.66 | 0.64 | 1.00 | 0.62 | 0.62 | 1.00 | 0.74 | 0.72 | 1.00 |
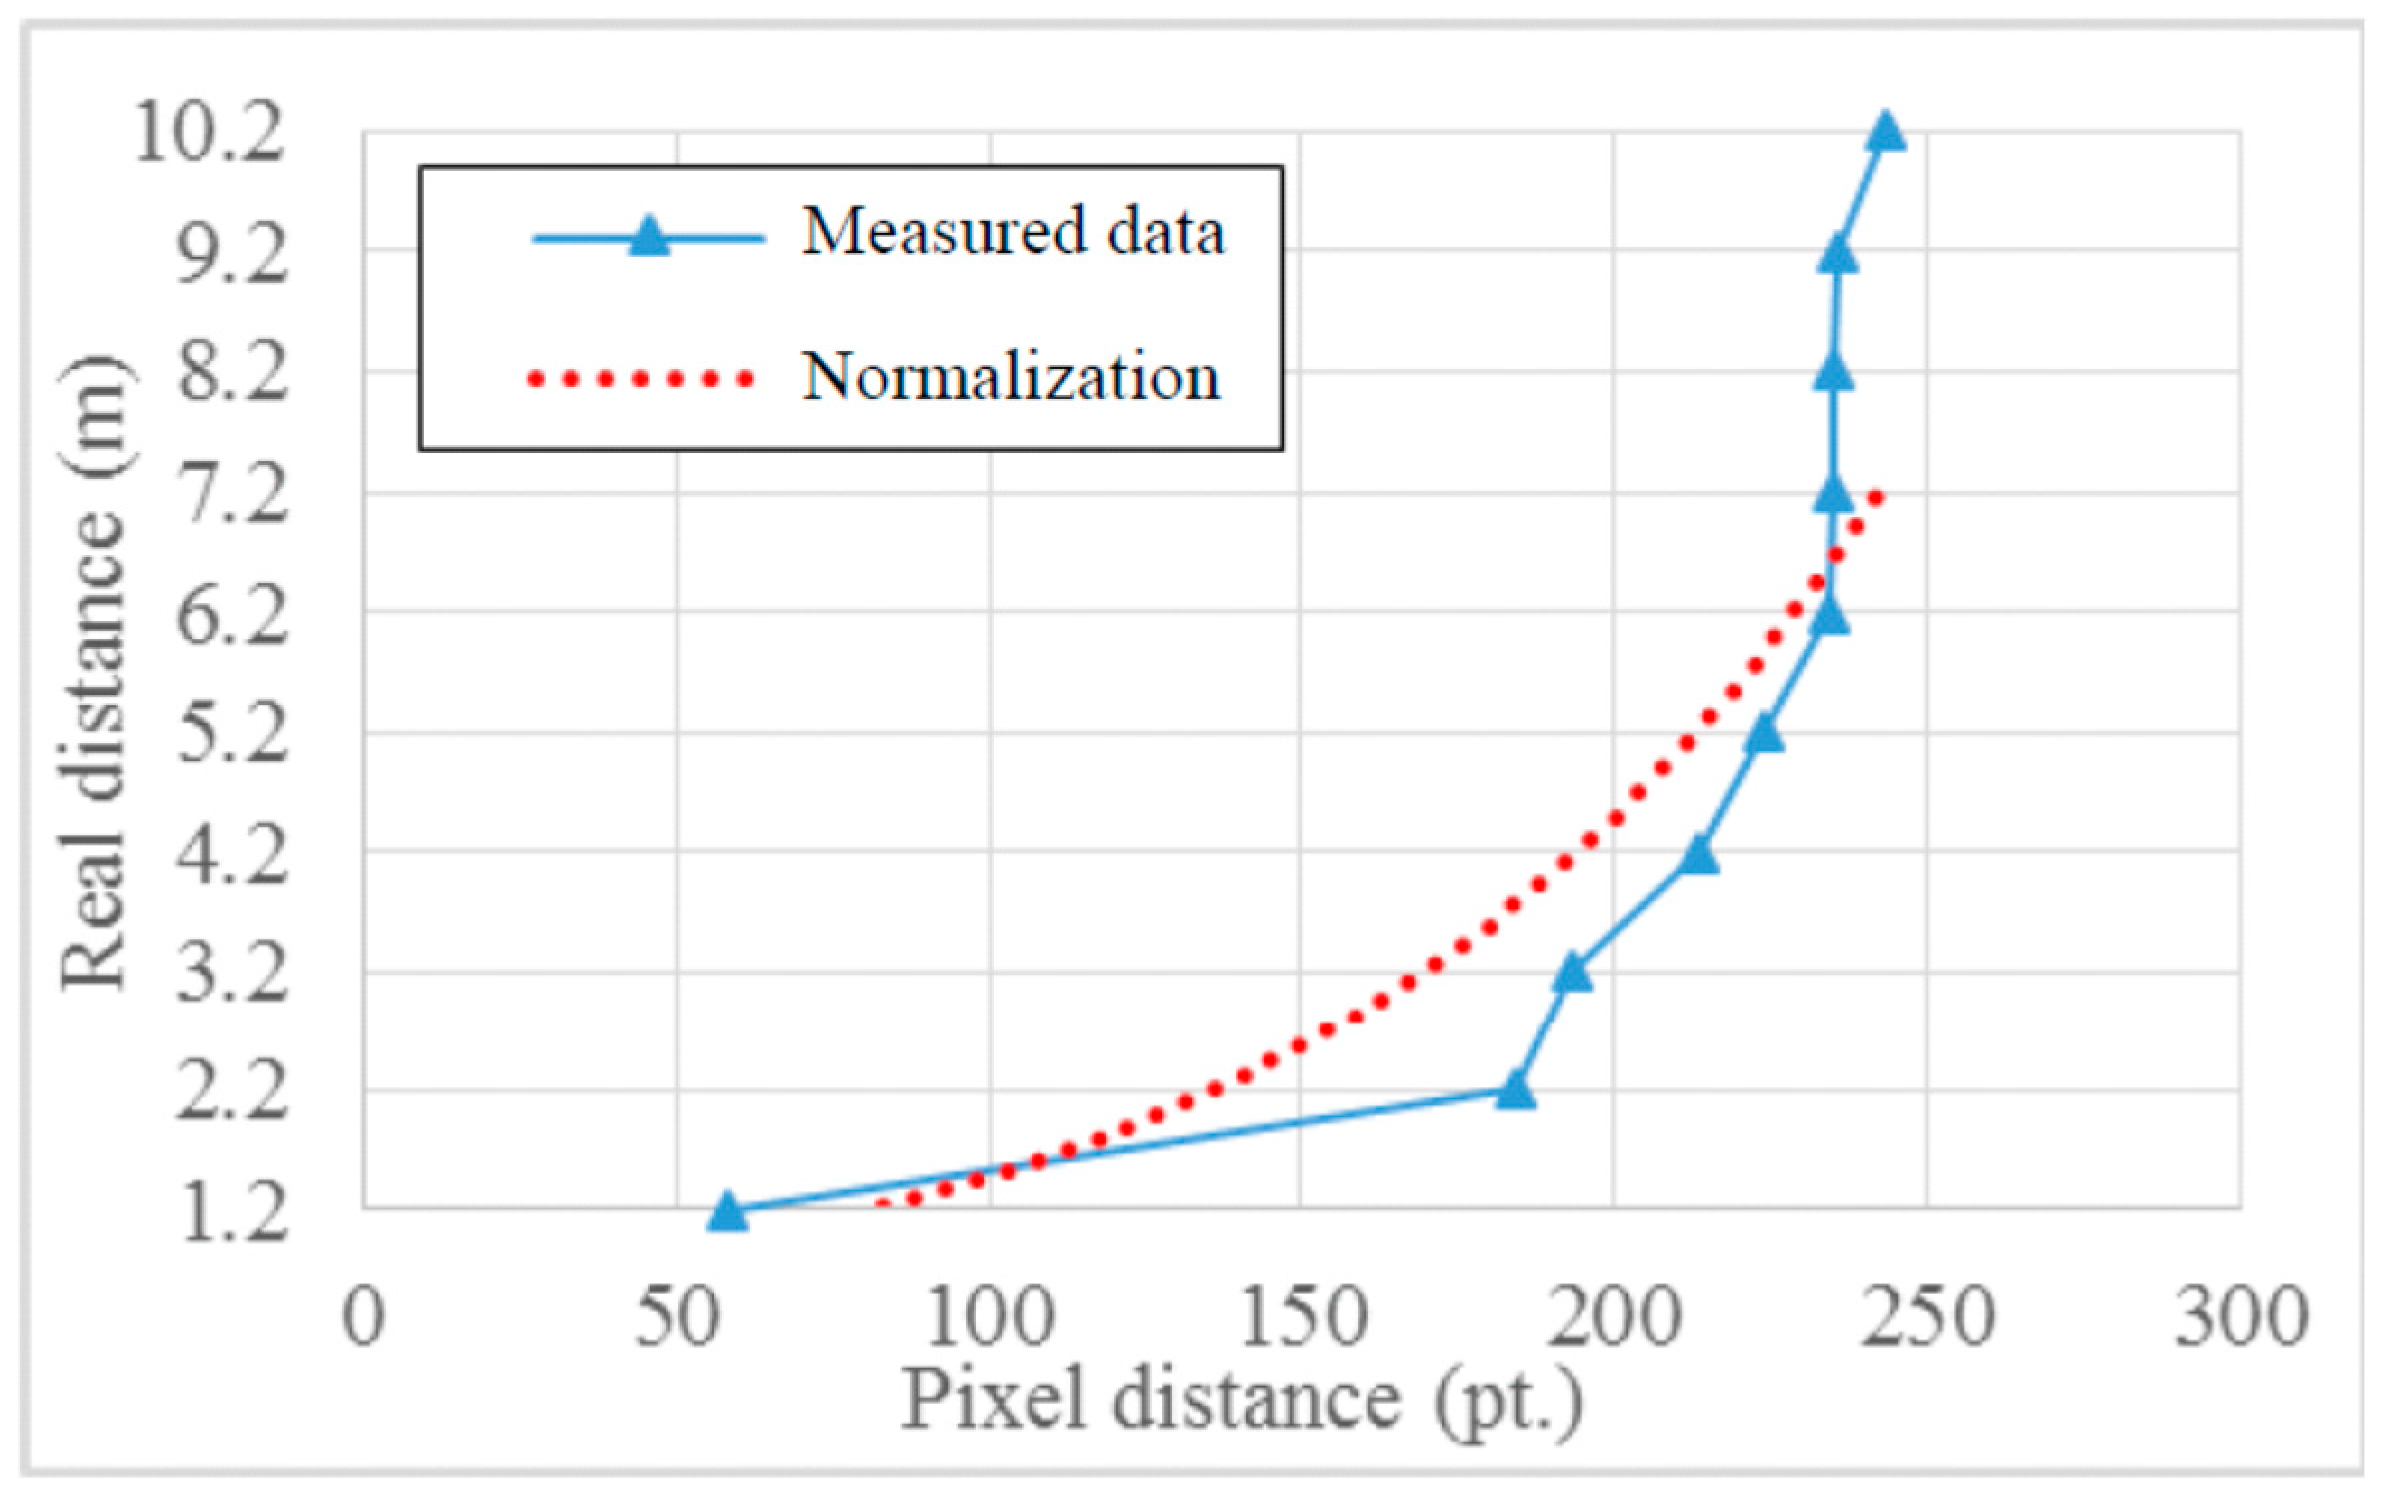
5.3. Estimating Traffic Congestion
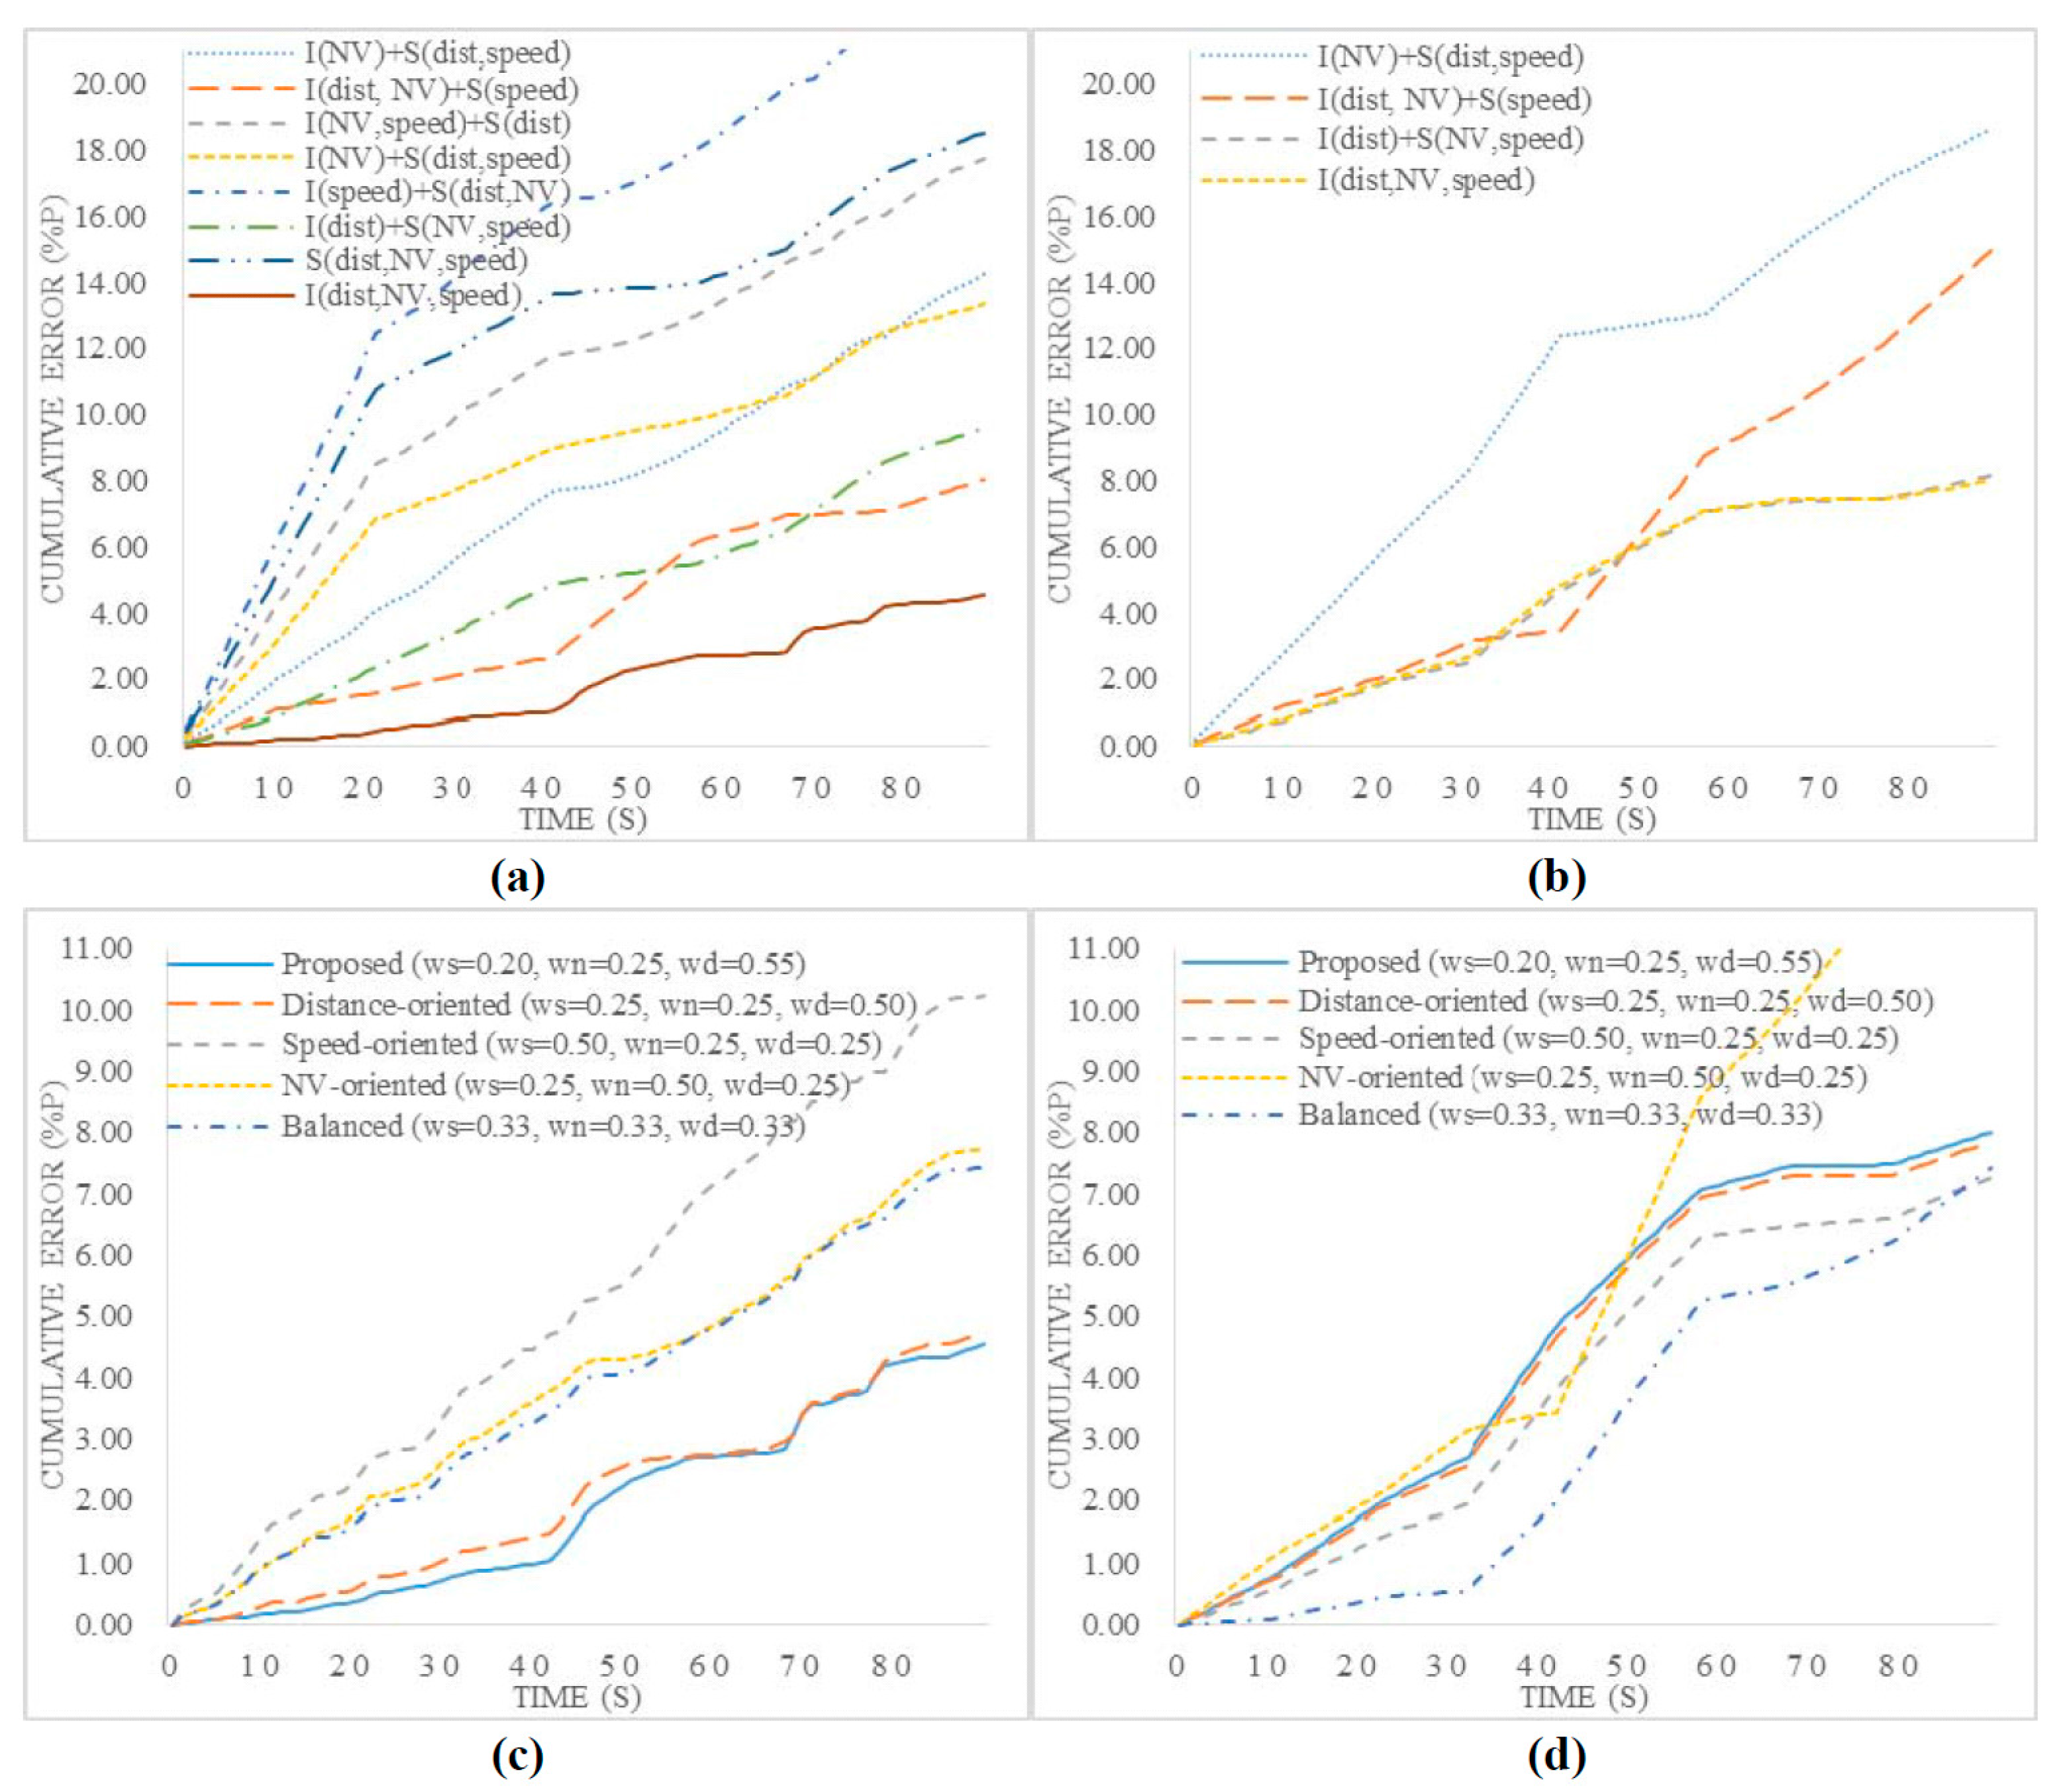
| Combination of Scoring Functions | Congestion | Light Traffic | ||
|---|---|---|---|---|
| Ave. | Std. | Ave. | Std. | |
| I(NV) + S(dist, speed) | 0.158 | 0.056 | 0.207 | 0.105 |
| I(dist, NV) + S(speed) | 0.090 | 0.066 | 0.166 | 0.097 |
| I(NV, speed) + S(dist) | 0.197 | 0.119 | 0.173 | 0.105 |
| I(NV) + S(dist, speed) | 0.148 | 0.100 | 0.086 | 0.065 |
| I(speed) + S(dist, NV) | 0.262 | 0.184 | 0.207 | 0.105 |
| I(dist) + S(NV, speed) | 0.107 | 0.045 | 0.090 | 0.061 |
| S(dist, NV, speed) | 0.206 | 0.172 | 0.090 | 0.061 |
| I(dist, NV, speed) | 0.051 | 0.061 | 0.089 | 0.061 |
| Combination of Weight Values | Congestion | Light Traffic | ||
|---|---|---|---|---|
| Ave. | Std. | Ave. | Std. | |
| Balanced | 0.083 | 0.050 | 0.083 | 0.072 |
| Distance-oriented | 0.053 | 0.057 | 0.087 | 0.061 |
| Speed-oriented | 0.114 | 0.069 | 0.081 | 0.059 |
| NV-oriented | 0.086 | 0.045 | 0.162 | 0.093 |
| Proposed | 0.051 | 0.061 | 0.089 | 0.061 |
6. Related Works
6.1. Advanced Driver Assistance Systems
6.2. Pedestrian Recognition
| HOG | MULTIFTR | HOGLBP | FPDW | FTRMINE | FEATSYNTH | POSEINV | ||
|---|---|---|---|---|---|---|---|---|
| Features | gradient histogram | √ | √ | √ | √ | √ | √ | √ |
| gradients | √ | √ | ||||||
| grayscale | √ | √ | √ | |||||
| color | √ | √ | ||||||
| texture | √ | √ | ||||||
| Learning | classifier | Linear SVM | AdaBoost | Linear SVM | AdaBoost | AdaBoost | LinearSVM | AdaBoost |
| Recognition Details | window height | 96 | 96 | 96 | 100 | 100 | 96 | 96 |
| scales | ~14 | ~14 | 14 | 10 | 4 | - | ~18 | |
| fps | 0.239 | 0.072 | 0.062 | 6.492 | 0.080 | - | 0.474 | |
| miss rate | 68% | 68% | 68% | 57% | 74% | 60% | 86% | |
| Implement | training data | INRIA | ||||||
6.3. License Plate Recognition
| Processing Method | Minimum Plate Size | Recognition Success Rate | ||
|---|---|---|---|---|
| Hongliang et al. | Binary | Edge statistics | 65 × 20 | 99.6% |
| Kim et al. | Binary | Sobel operation | 65 × 20 | 96.5% |
| Comelli et al. | Gray-level | Global Image Processing | 100 × 25 | 84.2% |
| Draghici et al. | Gray-level | Global Image Processing | 100 × 25 | 98.5% |
| Anagnostopoulos et al. | Gray-level | Region segmentation | 61 × 20 | 87.8% |
| Cao et al. | Color | Model transformation | 41 × 13 | 100% |
| Zimic et al. | Color | Fuzzy set theory | 120 × 35 | 97.0% |
| Chang et al. | Color | Fuzzy set theory | 80 × 45 | 97.6% |
6.4. Intelligent Transportation Systems
7. Discussion
7.1. Computer Vision-Based Pedestrian and License Plate Recognition
7.2. Recognition Accuracy Based on Weather Conditions
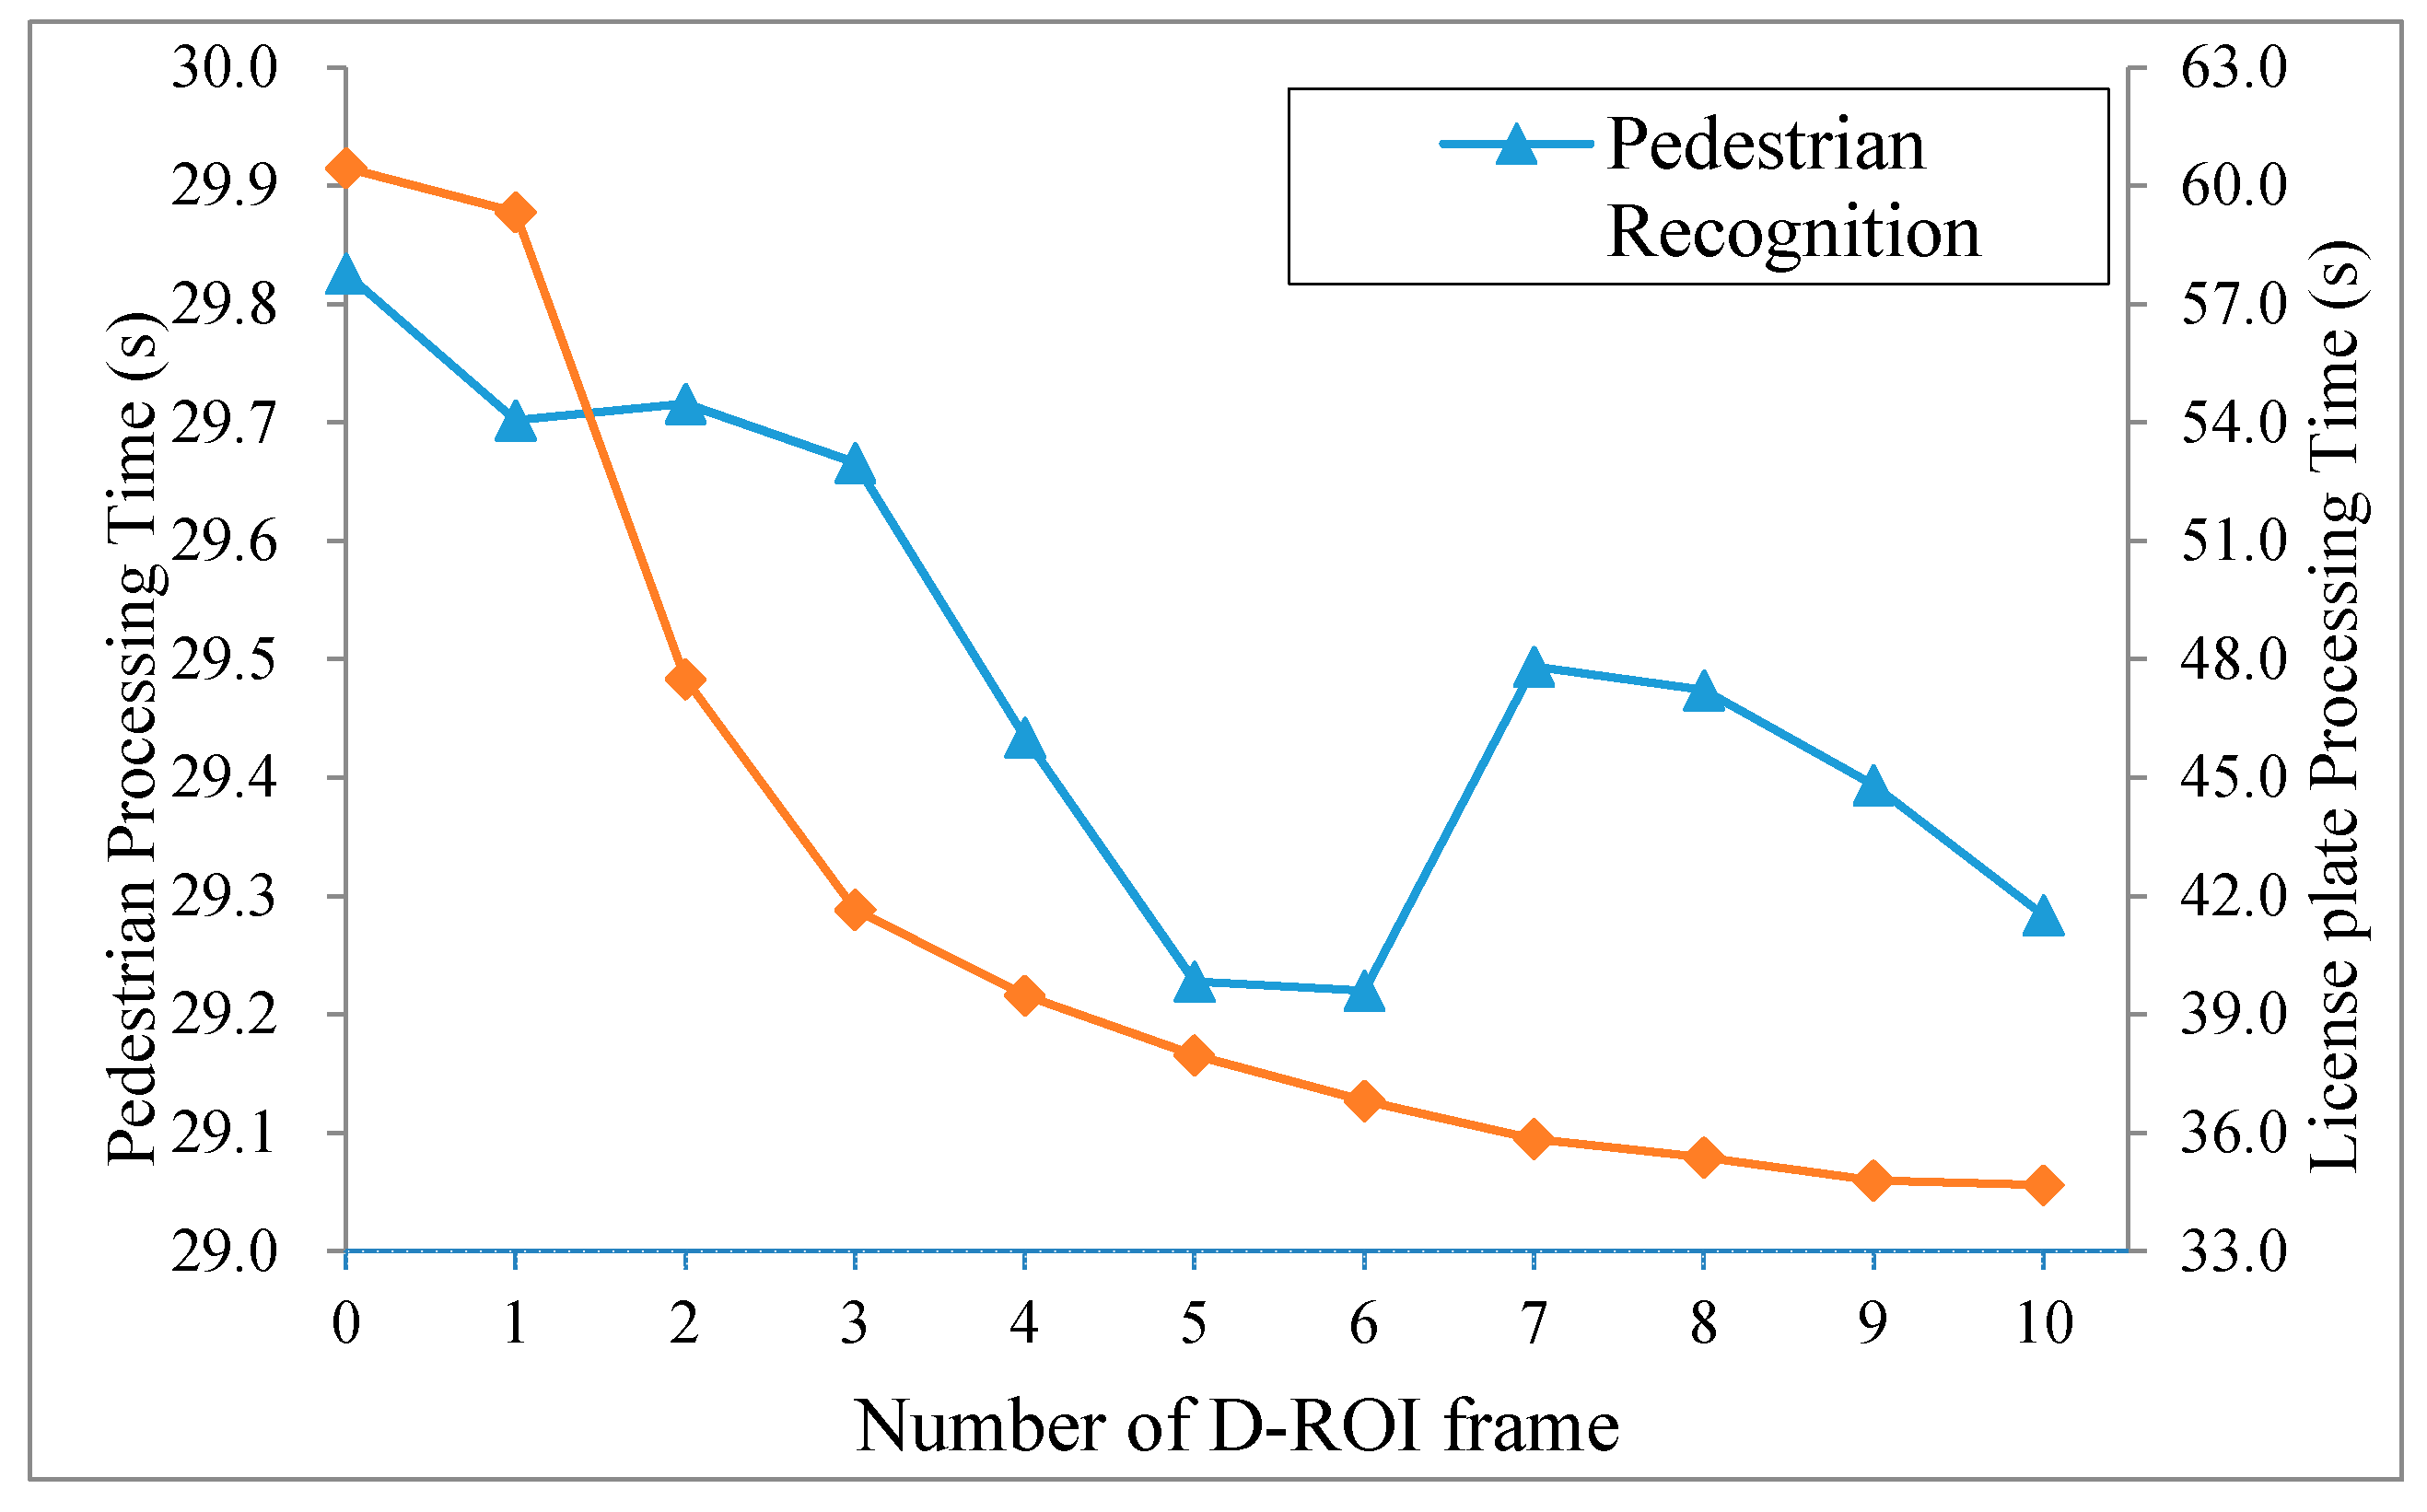
7.3. Optimal Value of N Frames for D-ROI Method
7.4. Precision of Traffic Congestion Estimation
8. Conclusions
Acknowledgments
Author Contributions
Conflicts of Interest
References
- Corona, D.; de Schutter, B. Adaptive Cruise Control for a SMART Car: A Comparison Benchmark for MPC-PWA Control Methods. Trans. Control Syst. Technol. 2008, 16, 365–372. [Google Scholar] [CrossRef]
- Klauer, S.G.; Dingus, T.A.; Neale, V.L.; Sudweks, J.D.; Ramsey, D.J. The Impact of Driver Inattention on Near-Crash/Crash Risk: An Analysis using the 10-Car Naturalistic Driving Study Data; Technical Report for National Technical Information: Alexandria, VA, USA, April 2006. [Google Scholar]
- Borhade, S.; Jadhav, P.; Rajurkar, D.; Bhor, A. Advanced Driver Assistance System. In Proceedings of the International Conference on Sensing Technology, Kolkata, India, 18–21 December 2012; pp. 718–722.
- Burns, L.D. A Vision of our Transport Future. Nature 2013, 497, 181–182. [Google Scholar] [CrossRef] [PubMed]
- Mobileye Home Page. Available online: http://www.mobileye.com/ (accessed on 5 June 2015).
- Wu, S.L.; Tseng, Y.C. Wireless Ad Hoc Networking; Auerbach Publications: Florida, FL, USA, 2007. [Google Scholar]
- Information Technology—Telecommunications and Information Exchange between Systems—Local and Metropolitan Area Networks—Specific Requirements, IEEE Standard 802.11p; IEEE: New York, NY, USA, 2010.
- Wireless Access in Vehicular Environments (WAVE)-Networking Services, IEEE Standard 1609.3; IEEE: New York, NY, USA, 2010.
- Family of Standards for Wireless Access in Vehicular Environments (WAVE), IEEE Standard 1609; IEEE: New York, NY, USA, April 2013.
- Traveller Information Services Association (TISA). TPEG—What is It All about? TISA Guideline; TISA: Brussels, Belgium, January 2014.
- OpenCV Home Page. Available online: http://opencv.org/ (accessed on 5 June 2015).
- Khronos Group’s OpenCL Information. Available online: https://www.khronos.org/opencl/ (accessed on 5 June 2015).
- NVIDIA’s CUDA Information. Available online: http://www.nvidia.com/object/cuda_home_new.html (accessed on 5 June 2015).
- Wang, G.; Xiong, Y.; Yun, J.; Cavallaro, J.R. Accelerating Computer Vision Algorithms Using OpenCL Framework on the Mobile GPI—A Case Study. In Proceedings of IEEE International Conference on Acoustics, Speech and Signal Processing, Vancouver, BC, Canada, 26–31 May 2013; pp. 2629–2633.
- Du, P.; Weber, R.; Luszczek, P.; Tomov, S.; Peterson, G.; Dongarra, J. From CUDA to OpenCL: Towards a Performance-Portable Solution for Multi-platform GPU Programming. Parallel Comput. J. 2012, 38, 391–407. [Google Scholar] [CrossRef]
- Diagnostic Connector Equivalent to ISO/DIS 15031, SAE J1962. Available online: http://standards.sae.org/j1962_201207/ (accessed on 5 June 2015).
- Road Vehicles—Diagnostic Communication over Controller Area Network (DoCAN)—Part 2: Transport Protocol and Network Layer Services, ISO 15765-2; ISO: Geneva, Switzerland, November 2011.
- SAE J1979: E/E Diagnostic Test Modes. Available online: http://standards.sae.org/ j1979_201202/ (accessed on 5 June 2015).
- NVIDIA Jetson TK1 Development Kit Information. Available online: https://developer.nvidia.com/jetson-tk1 (accessed on 5 June 2015).
- ST Microelectronics Home Page. Available online: http://www.st.com (accessed on 5 June 2015).
- Pulli, K.; Baksheev, A.; Kornyakov, K.; Eruhimov, V. Real-Time Computer Vision with OpenCV. Commun. ACM 2012, 55, 61–69. [Google Scholar] [CrossRef]
- Singhal, N.; Park, I.K.; Cho, S. Implementation and Optimization of Image Processing Algorithms on Handheld GPU. In Proceedings of IEEE International Conference on Image Processing, Orlando, FL, USA, 30 September–3 October 2012; pp. 4481–4484.
- Owens, J.D.; Houston, M.; Luebke, D.; Green, S.; Stone, J.E.; Phillips, J.C. GPU Computing. IEEE Proc. 2008, 96, 879–899. [Google Scholar] [CrossRef]
- OpenMP Home Page. Available online: http://openmp.org/ (accessed on 5 June 2015).
- Dalal, N.; Triggs, B. Histograms of Oriented Gradients for Human Detection. In Proceedings of IEEE Computer Society Conference on Computer Vision and Pattern Recognition, San Diego, CA, USA, 20–26 June 2005; pp. 886–893.
- Canny, J. A Computational Approach to Edge Detection. Trans. Pattern Anal. Mach. Intell. 1986, 8, 679–698. [Google Scholar] [CrossRef]
- Yim, Y.U.; Oh, S.Y. Three-Feature Based Automatic Lane Detection Algorithm (TFALDA) for Autonomous Driving. Trans. Intell. Transp. Syst. 2003, 4, 219–225. [Google Scholar]
- Geronimo, D.; Lopez, A.M.; Sappa, A.D.; Graf, T. Survey of Pedestrian Detection for Advanced Driver Assistance Systems. Trans. Pattern Anal. Mach. Intell. 2010, 32, 1239–1258. [Google Scholar] [CrossRef] [PubMed]
- Research and Markets: Global Advanced Driver Assistance Systems Market 2012–2016. Available online: http://www.researchandmarkets.com/research/m7kld9/global_advanced/ (accessed on 5 June 2015).
- Kim, K.; Lee, D.; Essa, I. Detecting Regions of Interest in Dynamic Scenes with Camera Motions. In Proceedings of IEEE Computer Society Conference on Computer Vision and Pattern Recognition (CVPR), Providence, RI, USA, 16–21 June 2012; pp. 1258–1265.
- Prioletti, A.; Møgelmose, A.; Grisleri, P.; Trivedi, M.M.; Broggi, A.; Moeslund, T.B. Part-based Pedestrian Detection and Feature-based Tracking for Driver Assistance: Real-Time, Robust Algorithms, and Evaluation. Trans. Intell. Transp. Syst. 2013, 14, 1346–1359. [Google Scholar] [CrossRef]
- Viola, P.; Jones, M.J. Rapid Object Detection Using a Boosted Cascade of Simple Features. In Proceedings of IEEE Computer Society Conference on Computer Vision and Pattern Recognition, Kauai, HI, USA, 8–14 December 2001.
- Wojek, C.; Schiele, B. A Performance Evaluation of Single and Multi-feature People Detection. In Pattern Recognition; Springer Berlin Heidelberg: Munich, Germany, 2008; pp. 82–91. [Google Scholar]
- Wang, X.; Han, T.X.; Yan, S. An HOG-LBP Human Detector with Partial Occlusion Handling. In Proceedings of the 2009 IEEE 12th International Conference on Computer Vision, Kyoto, Japan, 29 September–2 October 2009; pp. 32–39.
- Dollár, P.; Belongie, S.; Perona, P. The Fastest Pedestrian Detector in the West. In Proceedings of the British Machine Vision Conference, Aberystwyth, Wales, UK, 31 August–3 September 2010.
- Dollár, P.; Tu, Z.; Tao, H.; Belongie, S. Feature Mining for Image Classification. In Proceedings of the IEEE Conference on Computer Vision and Pattern Recognition, Minneapolis, MN, USA, 17–22 June 2007; pp. 1–8.
- Bar-Hillel, A.; Levi, D.; Krupka, E.; Goldberg, C. Part-based Feature Synthesis for Human Detection. In Computer Vision–ECCV 2010; Springer Berlin Heidelberg: Heraklion, Greece, 2010; pp. 127–142. [Google Scholar]
- Lin, Z.; Davis, L.S. A Pose-invariant Descriptor for Human Detection and Segmentation. In Computer Vision–ECCV 2008; Springer Berlin Heidelberg: Marseille, France, 2008; pp. 423–436. [Google Scholar]
- Dollar, P.; Wojek, C.; Schiele, B.; Perona, P. Pedestrian Detection: An Evaluation of the State of the Art. Trans. Pattern Anal. Mach. Intell. 2012, 34, 743–761. [Google Scholar] [CrossRef] [PubMed]
- Raphael, E.; Kiefer, R.; Reisman, P.; Hayon, G. Development of a Camera-based Forward Collision Alert System. SAE Int. J. Passeng. Cars Mech. Syst. 2011, 4, 467–478. [Google Scholar] [CrossRef]
- Guo, C.; Meguro, J.; Kojima, Y.; Naito, T. CADAS: A Multimodal Advanced Driver Assistance System for Normal Urban Streets Based on Road Context Understanding. In Proceedings of the IEEE Intelligent Vehicles Symposium, Gold Coast City, Australia, 23–26 June 2013; pp. 228–235.
- Bai, H.L.; Liu, C.P. A Hybrid License Plate Extraction Method Based on Edge Statistics and Morphology. In Proceedings of the 17th International Conference on Pattern Recognition, Cambridge, UK, 23–26 August 2004; pp. 831–834.
- Kim, S.; Kim, D.; Ryu, Y.; Kim, G. A Robust License-plate Extraction Method under Complex Image Conditions. In Proceedings of the 16th International Conference on Pattern Recognition, Quebec, QC, Canada, 11–15 August 2002; pp. 216–219.
- Comelli, P.; Ferragina, P.; Granieri, M.N.; Stabile, F. Optical Recognition of Motor Vehicle License Plates. Trans. Veh. Technol. 1995, 44, 790–799. [Google Scholar] [CrossRef]
- Draghici, S. A Neural Network Based Artificial Vision System for License Plate Recognition. Int. J. Neural Syst. 1997, 8, 113–126. [Google Scholar] [CrossRef] [PubMed]
- Anagnostopoulos, C.N.E.; Anagnostopoulos, I.E.; Loumos, V.; Kayafas, E. A License Plate-recognition Algorithm for Intelligent Transportation System Applications. Trans. Intell. Transp. Syst. 2006, 7, 377–392. [Google Scholar] [CrossRef]
- Cao, G.; Chen, J.; Jiang, J. Adaptive Approach to Vehicle License Plate Localization. In Proceedings of the 29th Annual Conference on the IEEE Industrial Electronics Society, Roanoke, VA, USA, 2–6 November 2003; pp. 1786–1791.
- Zimic, N.; Ficzko, J.; Mraz, M.; Virant, J. The Fuzzy Logic Approach to the Car Number Plate Locating Problem. In Proceedings of the Intelligent Information Systems, Grand Bahama Island, Commonwealth of The Bahamas, 8–10 December 1997; pp. 227–230.
- Chang, S.L.; Chen, L.S.; Chung, Y.C.; Chen, S.W. Automatic License Plate Recognition. Trans. Intell. Transp. Syst. 2004, 5, 42–53. [Google Scholar] [CrossRef]
- Sirithinaphong, T.; Chamnongthai, K. The Recognition of Car License Plate for Automatic Parking System. In Proceedings of 5th International Symposium on Signal Processing and Its Applications; 2009; pp. 455–457. [Google Scholar]
- US Department of Transportation, Intelligent Transportation Systems Joint Program Office Information. Available online: http://www.its.dot.gov (accessed on 5 June 2015).
© 2015 by the authors; licensee MDPI, Basel, Switzerland. This article is an open access article distributed under the terms and conditions of the Creative Commons Attribution license (http://creativecommons.org/licenses/by/4.0/).
Share and Cite
Son, S.; Baek, Y. Design and Implementation of Real-Time Vehicular Camera for Driver Assistance and Traffic Congestion Estimation. Sensors 2015, 15, 20204-20231. https://doi.org/10.3390/s150820204
Son S, Baek Y. Design and Implementation of Real-Time Vehicular Camera for Driver Assistance and Traffic Congestion Estimation. Sensors. 2015; 15(8):20204-20231. https://doi.org/10.3390/s150820204
Chicago/Turabian StyleSon, Sanghyun, and Yunju Baek. 2015. "Design and Implementation of Real-Time Vehicular Camera for Driver Assistance and Traffic Congestion Estimation" Sensors 15, no. 8: 20204-20231. https://doi.org/10.3390/s150820204