
Using a Smart City IoT to Incentivise and Target Shifts in Mobility Behaviour—Is It a Piece of Pie?


Abstract
:1. Introduction
2. Related Work about Travel Incentives
2.1. Scope and Focus
2.2. Real-Time Travel Information
2.3. Feedback and Self-Monitoring
2.4. Social Networks
2.5. Rewards and Points
2.6. Discussion
3. Method
3.1. Requirements and Development Methodology
- -
- Analyse the scenarios expressed in natural language.
- -
- Analyse the scenarios for functional versus non-functional requirements.
- -
- Analyse the scenario description in order to derive user requirements.
- -
- Review that the parts of the complete scenario are all high priority to be developed for the Living labs (LL) trials (see Section 4).
- -
- Review if all major system components requirements are used in the scenarios via analysing that that are then mapped to the system requirements. This confirms how the system supports the user requirements.

| Scenario ID | User Requirements | System Component & Requirements | Priority |
|---|---|---|---|
| US2 | Social Network Reuse | RIM.1 (identify and authenticate user), RIM.3 (link Social Network user ID to tripzoom user ID), RIM.5 (import social network links into tripzoom) | High |
| US4 | Improved Mobility Pattern Analysis | MPD.1 (create mobility patterns for persons, places & vehicles), MPD.4 (provide overviews of mobility choices of users & consequences of choices, e.g., time, money, emissions, delay), PMS.2 (pre-filter sensor data), INM.4 (Get mapping of location trace to a list of infrastructure segments); INM.5 (reverse geo-coding and mobility-related Point of interest lookup). | High |
| US8 | Planned Real-time Trip Info & Recommender | MPD.3 (classify context-aware mobility patterns where context can be weather condition, or user-event driven, e.g., shopping) | High |
| US9 | Real-time Trip Info. | MPD.1 (as above) | Medium |
| US13 | Trip Change Incentives | PMS.8 (pre-filtered sensor data exchange), IMP.4 (offer context-aware, incentives e.g., in space and time, to targeted users) | High |
| US14 | Ad hoc Location-specific Mobility Offers | IMP.4 (as above) | Medium |
| Component | IMP (Incentive Market-Place) | |||
|---|---|---|---|---|
| Responsible | Named Consortium Members | |||
| Number | Description | Source | Rationale | Priority |
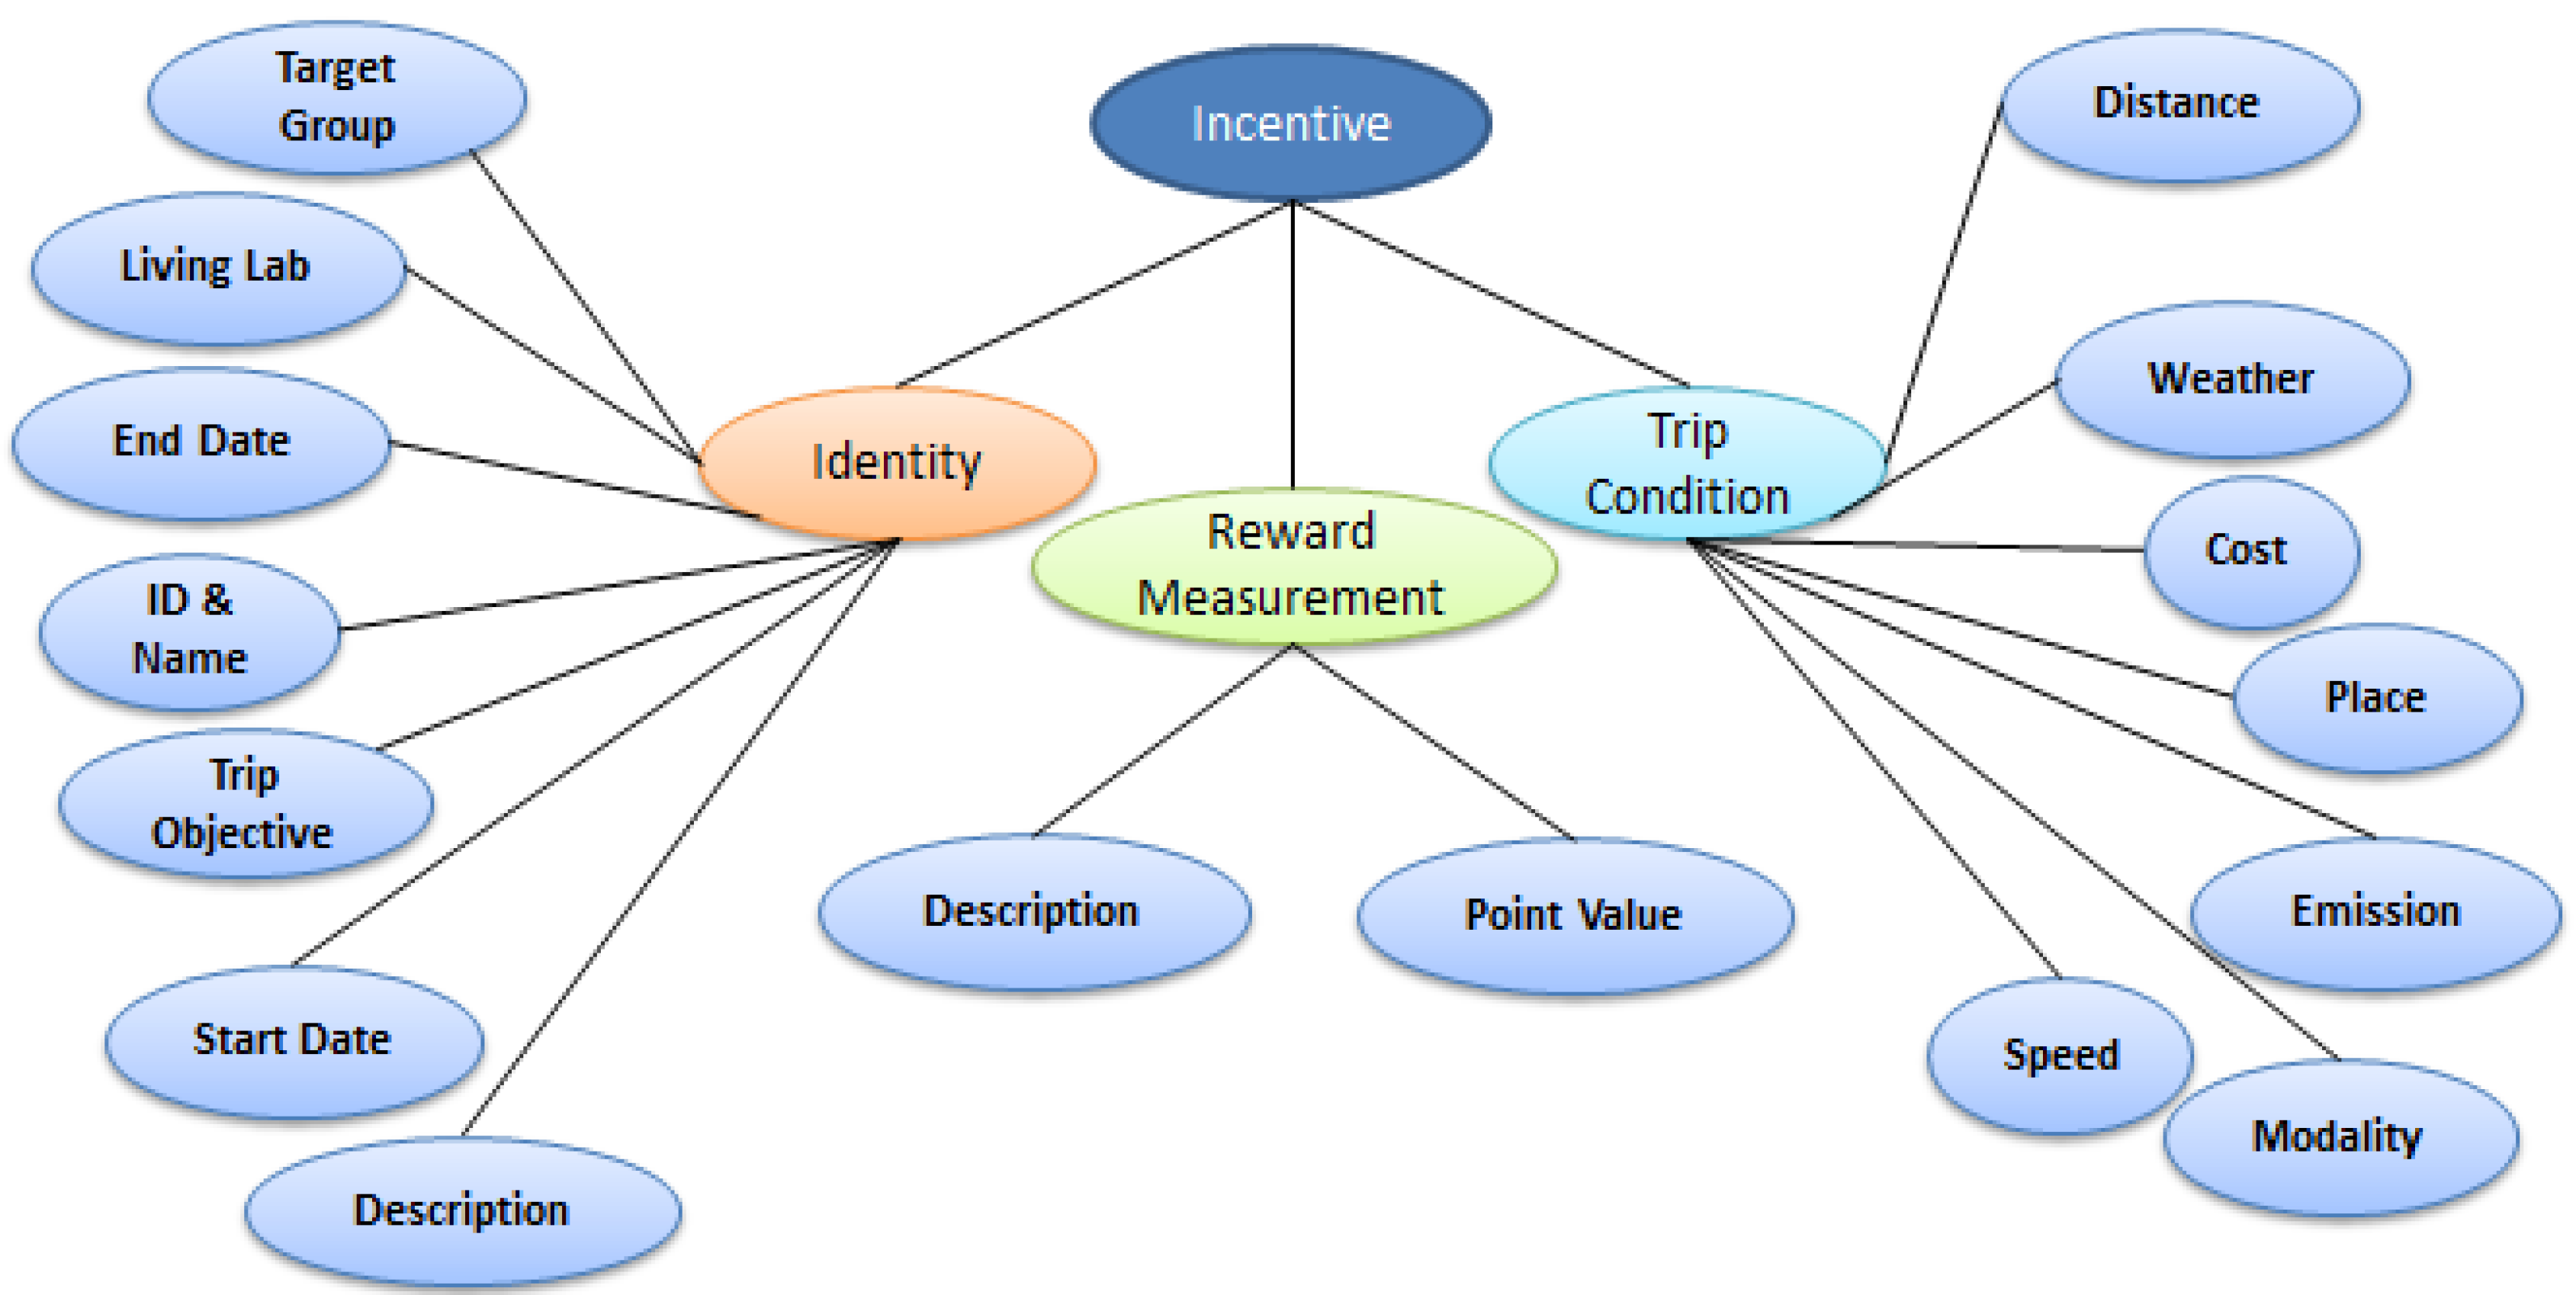
| IMP.1 | Provide system’s definition of an incentive in terms of “Who, When, Where and How” so as to allow providers to publish/update/remove incentives accordingly. | Technical | System’s definition on incentives. | High |
| IMP.2 | Provide a bonus point based reward system in which users can subscribe to. | SS3 | Platform where incentives are managed; this decouples issuing incentives from issuing rewards. | High |
| IMP.3 | Manage the different types of users of the system: incentive providers and system users. | Technical | This is required for general operation. | High |
| IMP.4 | Offer incentives to users by taking into consideration their mobility patterns, identified potential behavioural changes, preferences, circumstances and history of incentive scheme participation so as to achieve system’s and individual’s goals. Incentives are context-based, e.g., depend on time and place. | US13, US14 | Offer incentives with reference to individuals’ travel patterns. | Medium |
- Release R1: focussed on users’ access to the tripzoom system services;
- Release R2: focussed on user-oriented (privacy) access control to services and to richer core travel information services;
- Release R3: added the first support for incentives and for experience sampling;
- Release R4: improved the travel information services, use of incentives and the use of social network services;
- Release R5: focussed on: improving the use of incentives, user control of privacy preferences and on richer information views and on transport authorities or city moderators being able to first sample users to evaluate experiences.
- Release R6: focussed on better supporting city authorities to be able to issue experience sampling, to compare mobility patterns of user groups and to get overviews of grouped trips.
- Release R7: focussed on improvements in the service design of R1 to R6 and to offer more support for information management with respect to more finely-grained groups of travellers.
- Often users assume but do not explicitly state some core non-functional system functions (implemented as services) such as privacy, help and language localisation to support international users’ use of different languages and country contexts. An S-O system also captures and models these implied ‘support’ user services.
- Systems tend not to be designed and implemented in terms of high-level user requirement driven sub-systems but in terms of more technical, reusable, lower level (atomic and composite) service components. Hence, in the second year of the project, the development of the system focussed on the S-O view rather than on the user-requirements per se.
- During the iterative development, it became clearer which user requirements could feasibly be realised using system services in an operational system.
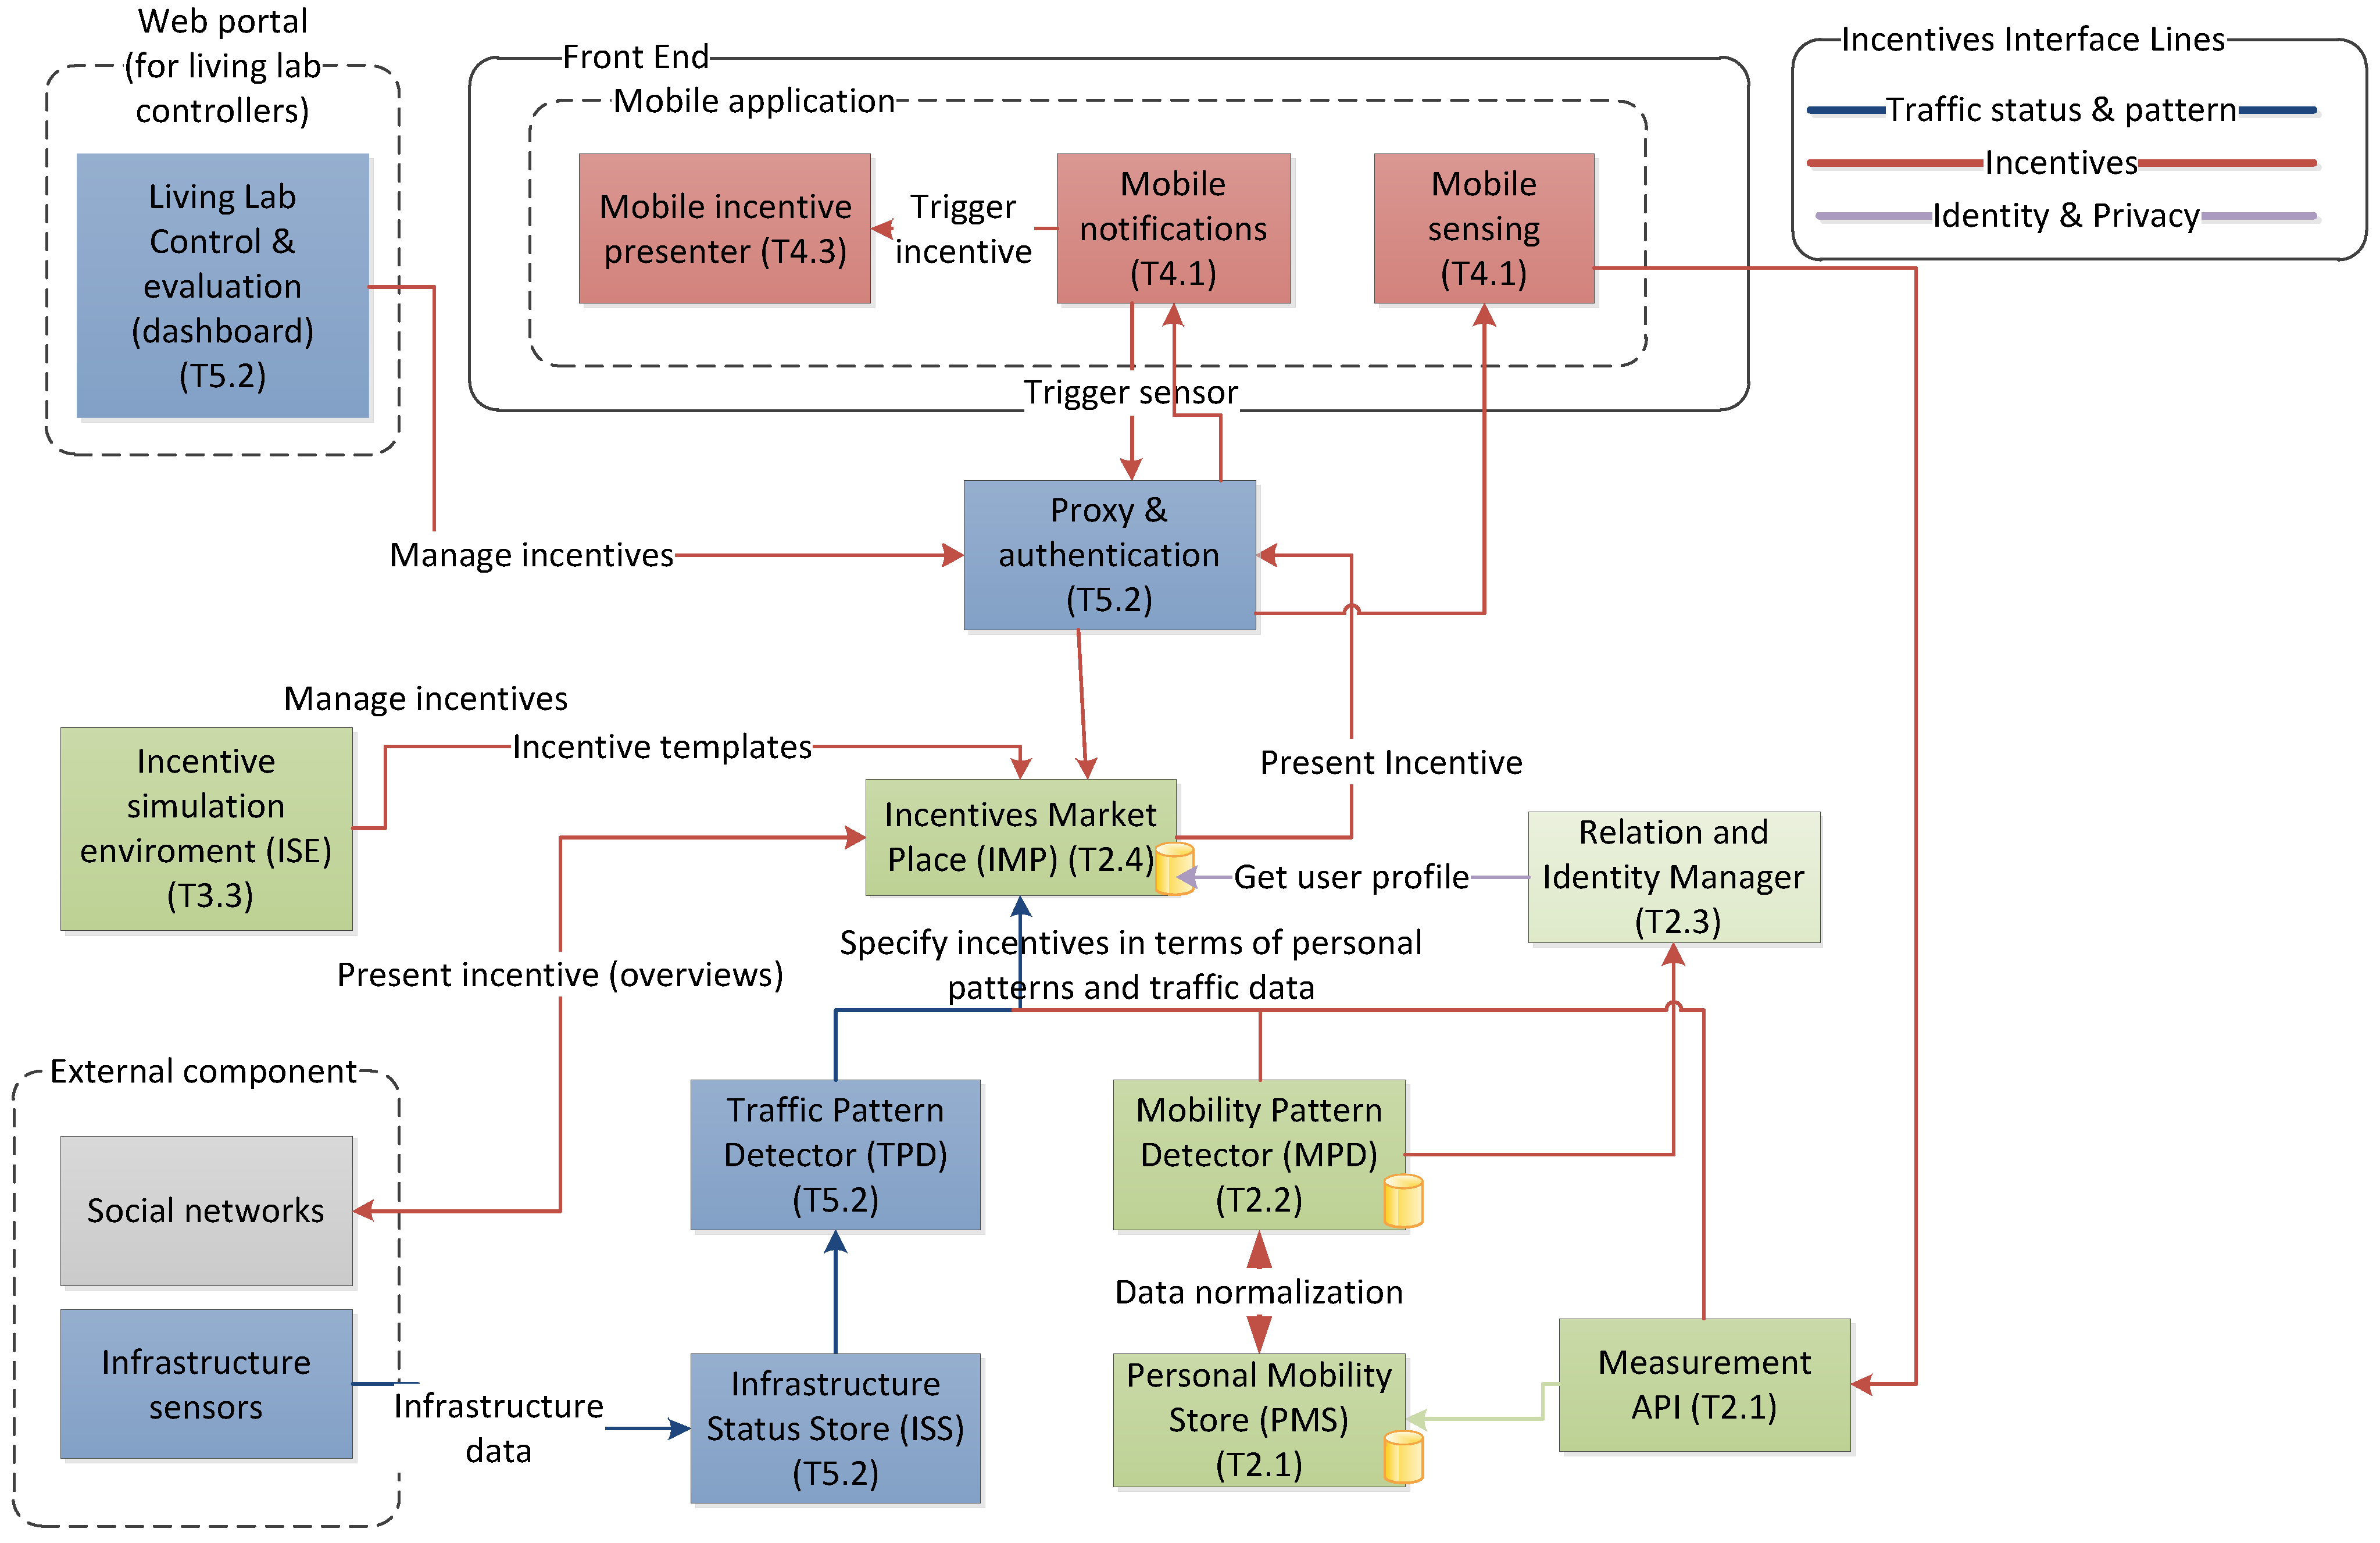
3.2. System Overview
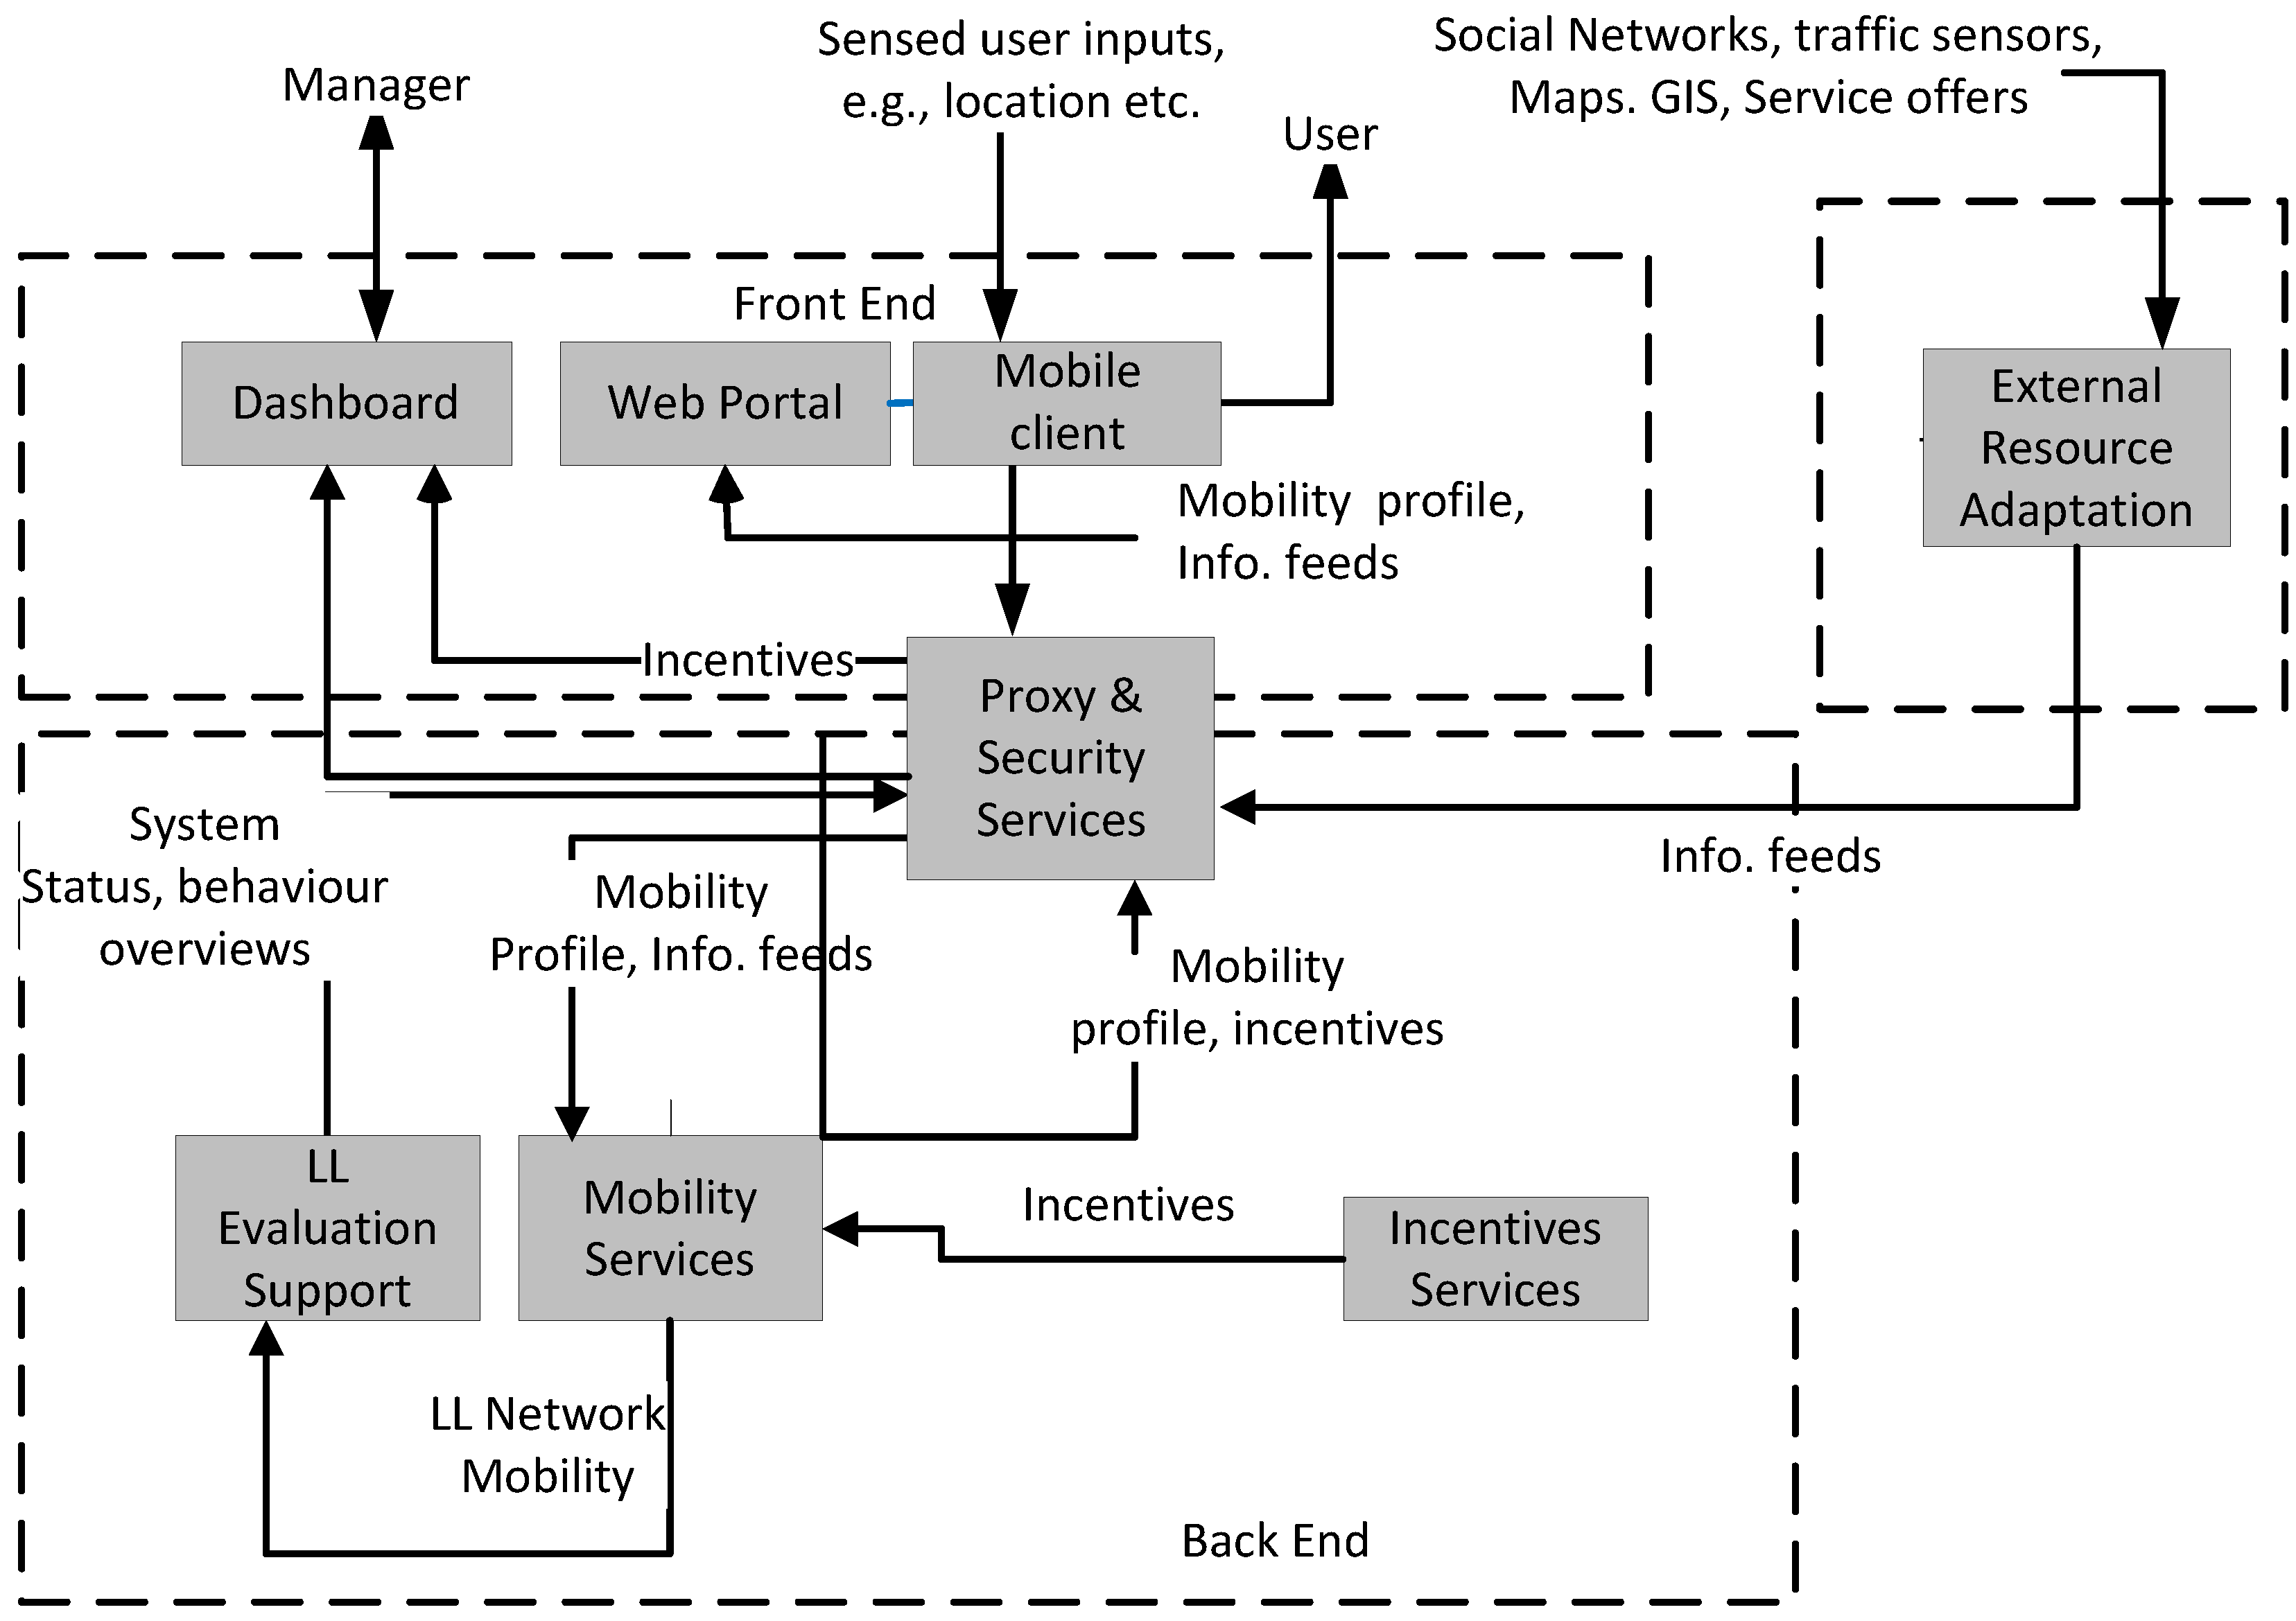
| Sunset Sub-Systems | System Components |
|---|---|
| Mobile Client | Mobile Experience Sampler, Mobile Incentive Presenter, Mobile Mobility Profile Visualisation, Mobile Buddy List, Mobile Notifications
Mobile Authentication, Mobile Sensing |
| Web Portal (User) | User & Application Management, Portal Profile Visualisation |
| Dashboard (Manager Web Portal) | Living Lab Control & Evaluation |
| Proxy & Security Services | Privacy Manager, Relation and Identity Manager, Proxy & Authentication |
| Mobility Services | Personal Mobility Store (PMS), Mobility Pattern Detector
Mobility Pattern Visualizer, Traffic Pattern Detector |
| LL Evaluation Support | Experience Sampling Store, Evaluation Support |
| Incentive Services | Incentives Market Place (IMP), Incentive Simulation Environment |
| External Resource Adapters | Social Network Adapter, Infrastructure Network Manager, Infrastructure Status Store, Weather Information Adapter |
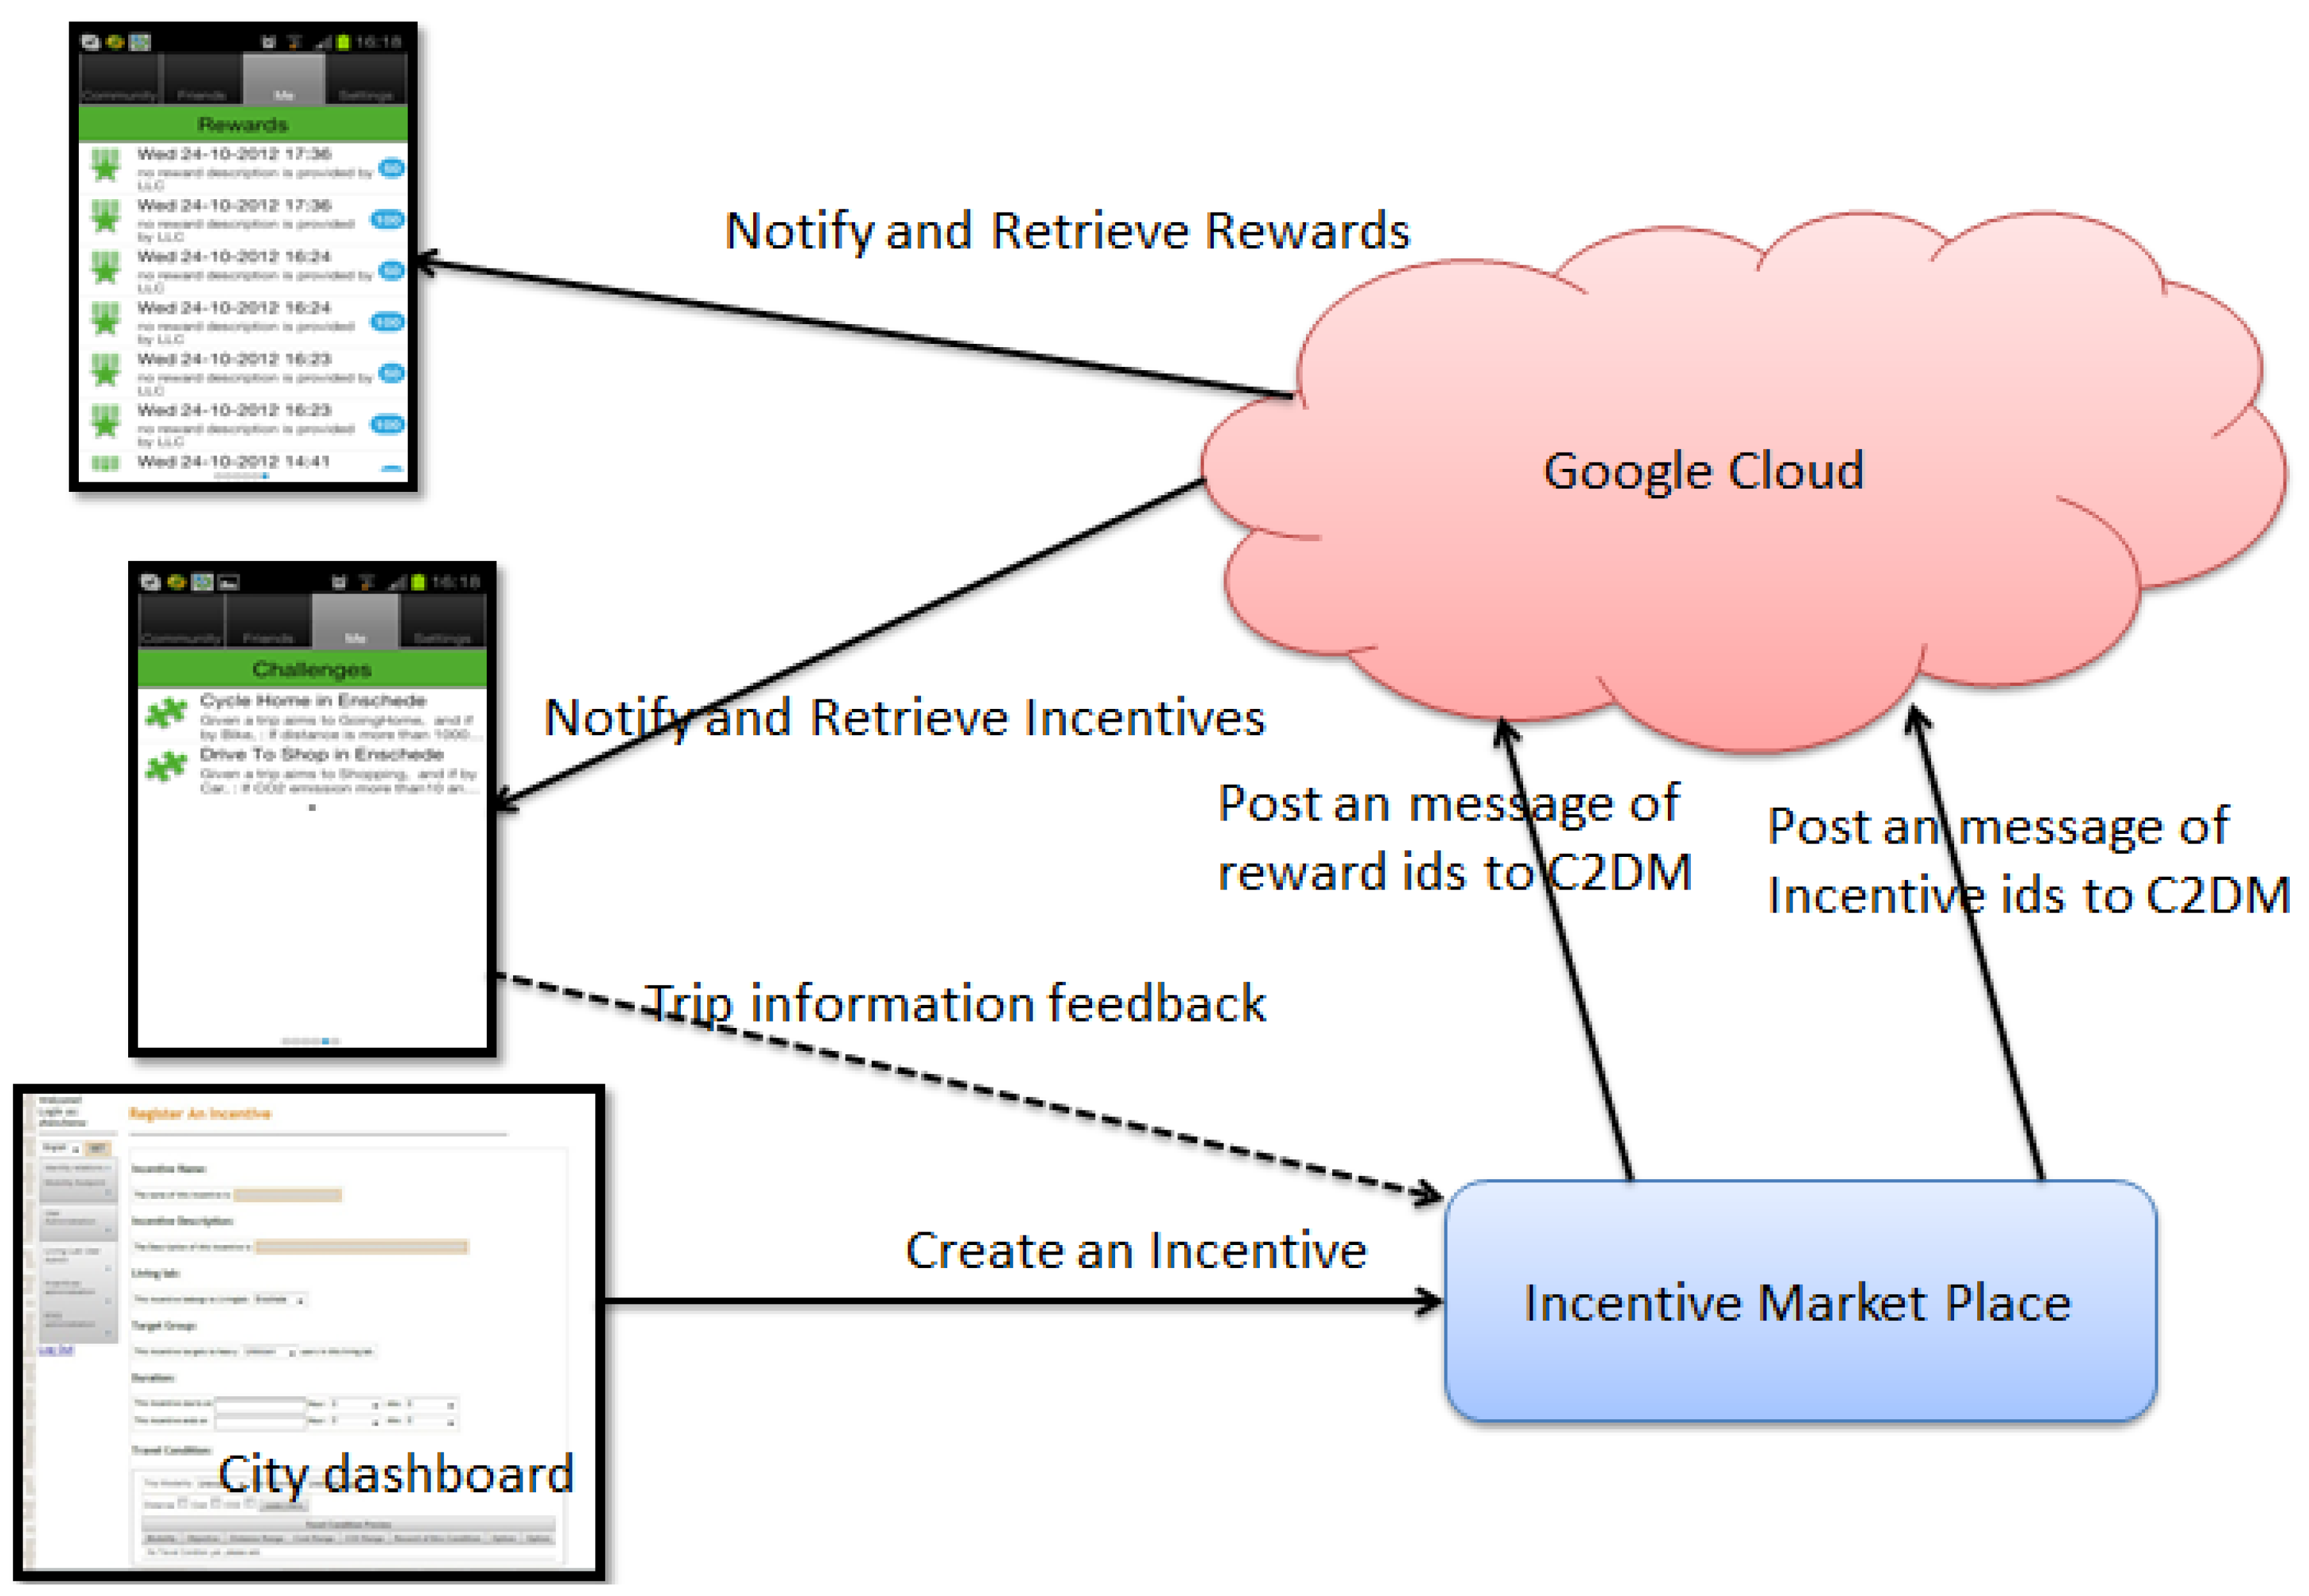
3.3. Incentive Market Place (IMP)
- (1)
- Incentive management
- -
- To release and notify mobile users new incentives
- (2)
- Monitoring travellers
- -
- To release and notify mobile users new incentives
- -
- To monitor historical trips status including travelling cost, CO2 emission, distance travelled and transport modality
- -
- To examine travellers’ incentive execution status
- -
- To assess travellers’ reward status
- (3)
- Issuing rewards to travellers
- -
- To compare traveller’s behaviour with reward criteria
- -
- To send reward notifications to users

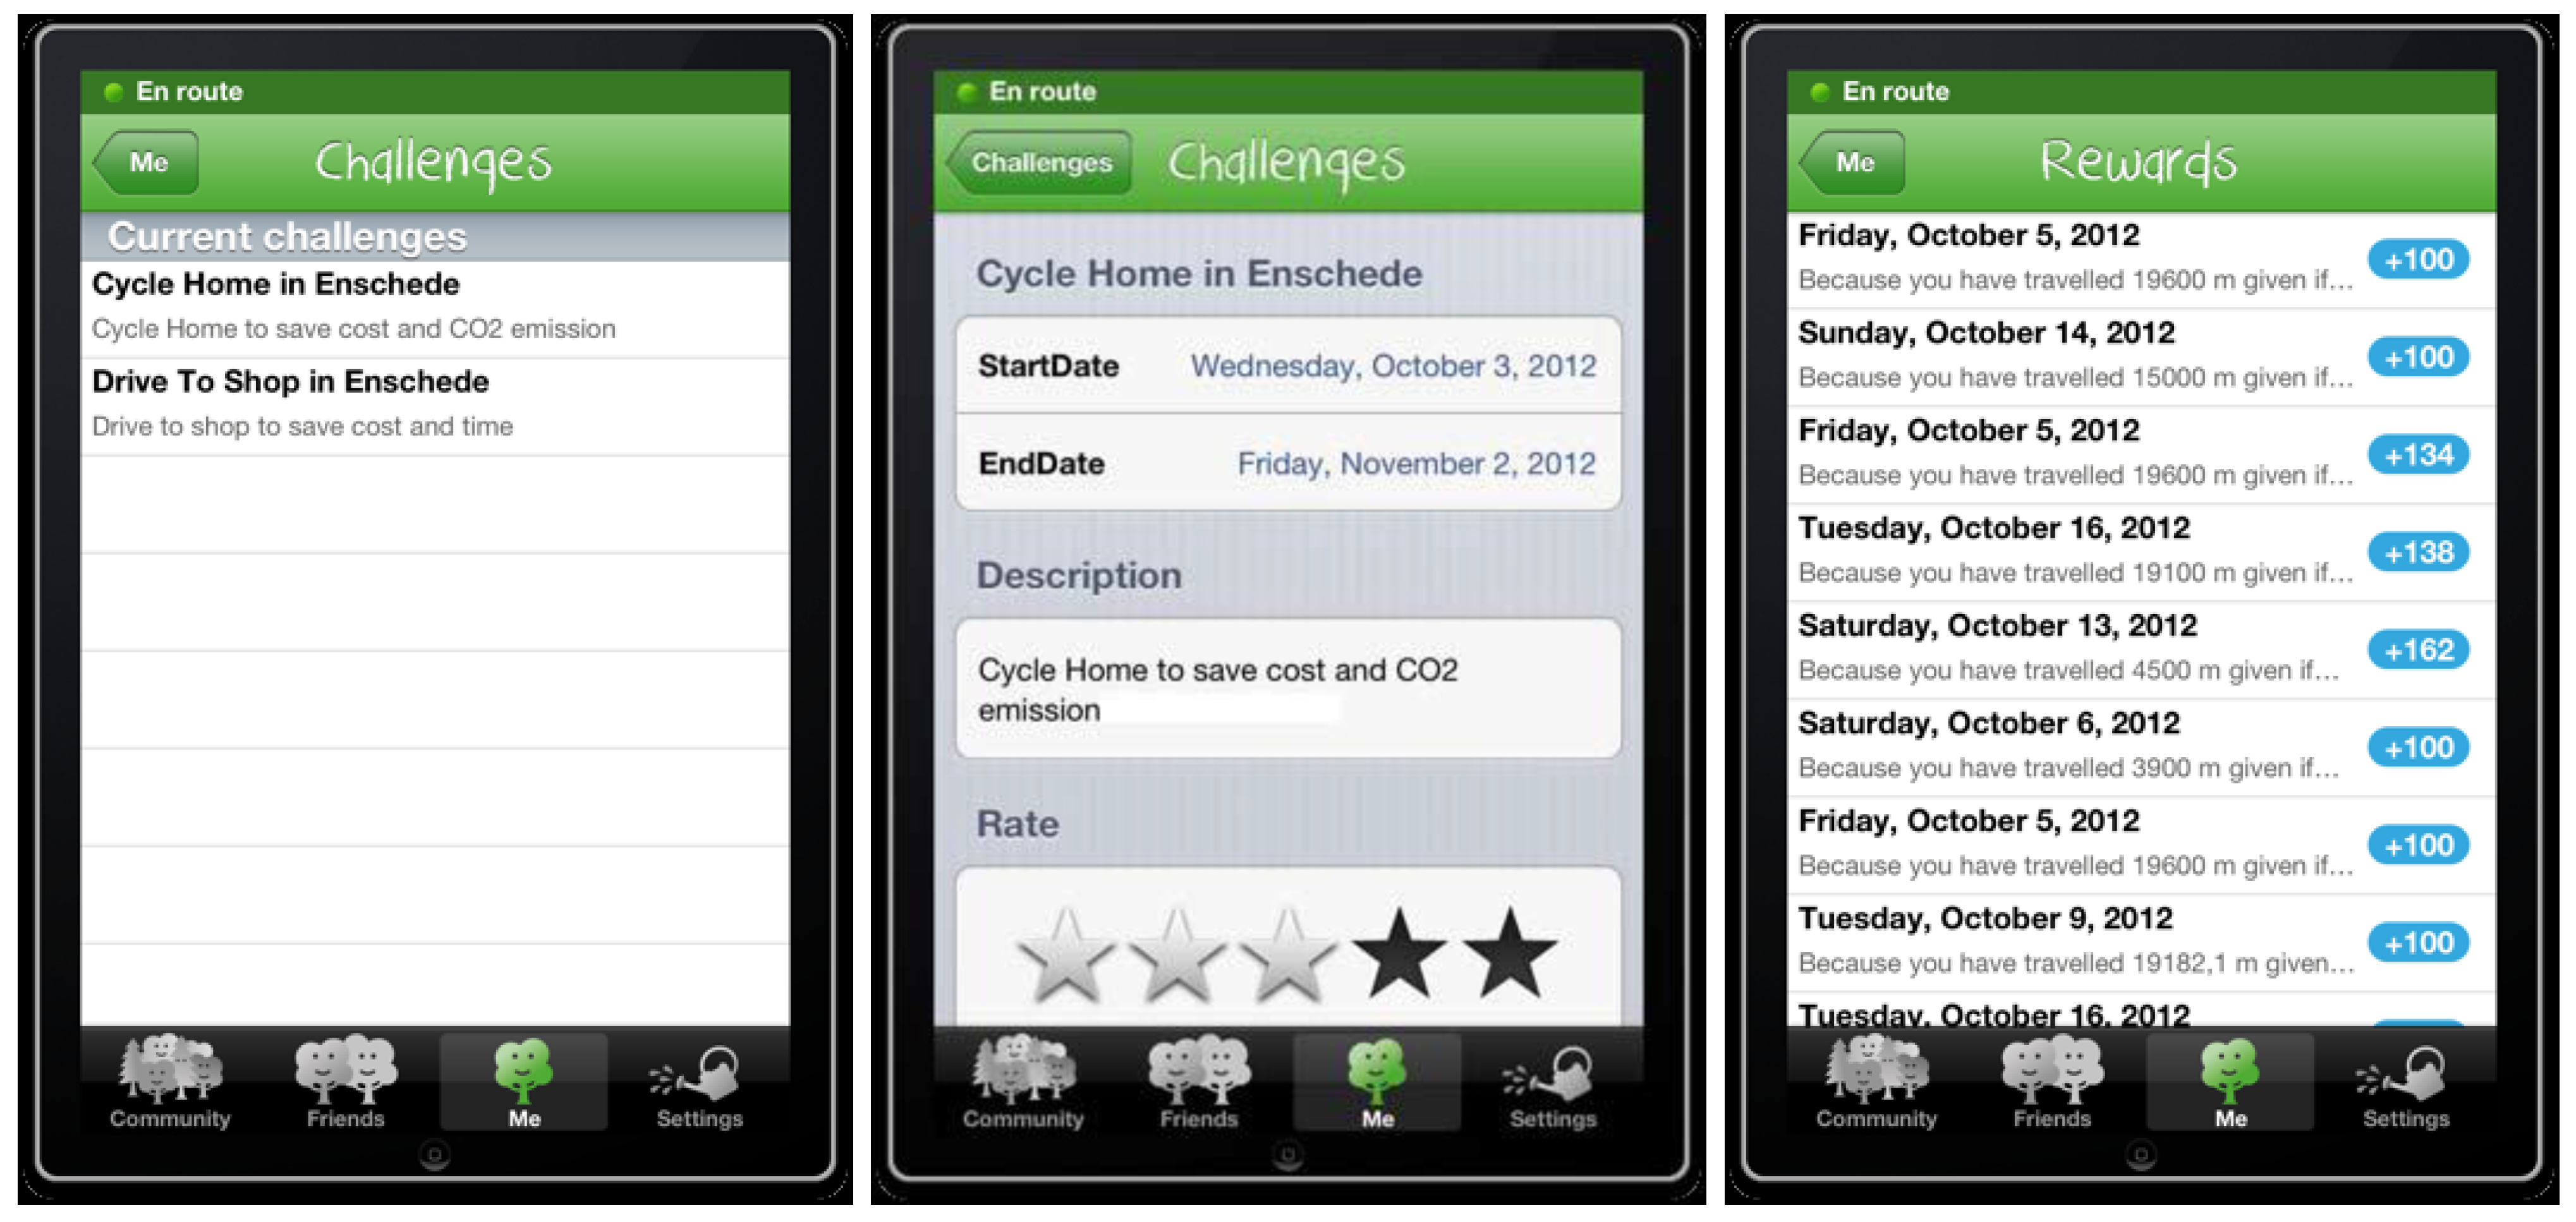
- Notification of a new challenge.
- Notification of a reward upon completion of a challenge.
- A list of current challenges applicable to an individual user.
- Trip information of an individual user
- A request to find out all the current challenges applicable to an individual.
- Target/challenge validity check. This is to check whether a specific target/challenge is active; expired targets and challenges will not be considered further.
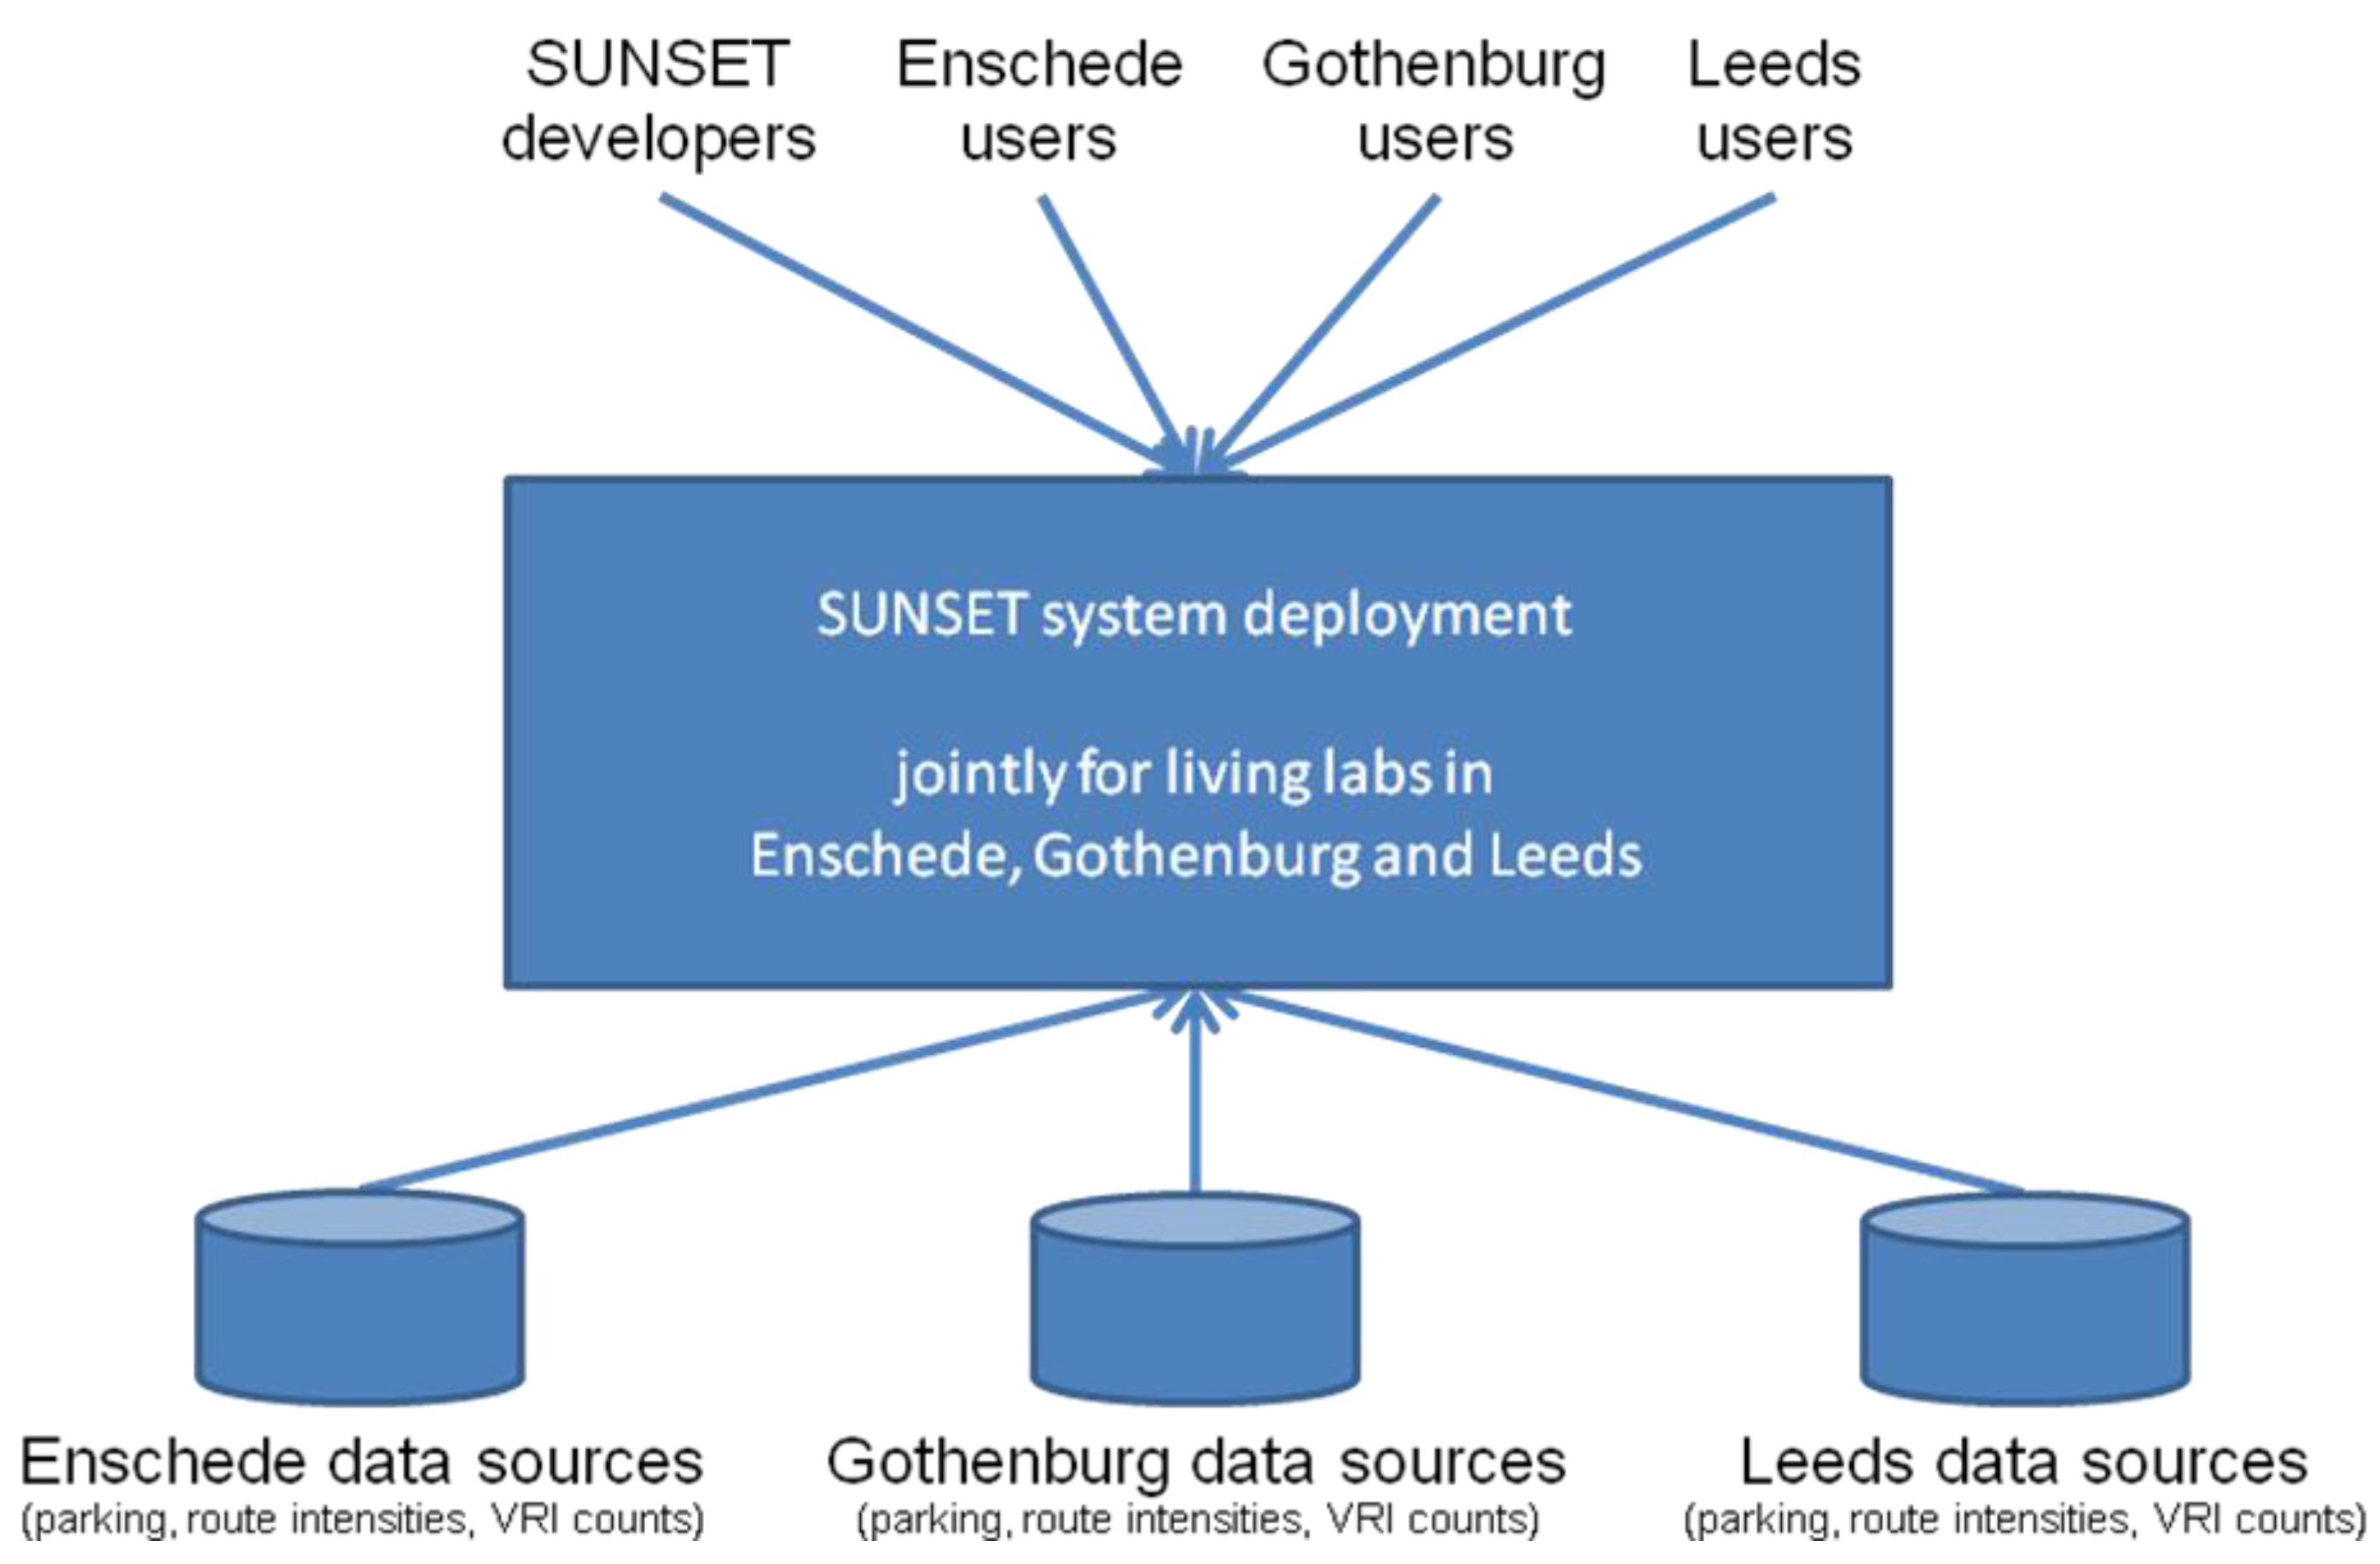
- Living lab identification. Subdivide Tripzoom users by allocating them to the corresponding living labs: Enschede, Gothenburg and Leeds.
- Target group identification. User can be further divided into subgroups by referring to a range of available demographic properties including gender, age, home city and household status.
- Trip modality matching. A target and challenge is often designed to change a user’s mode of transport based upon modality information of a user obtained from the PMS and will use the modality requirements set for a specific target and challenge. A reward will be issued if the matching result shows that the user has fulfilled the given target and challenge.

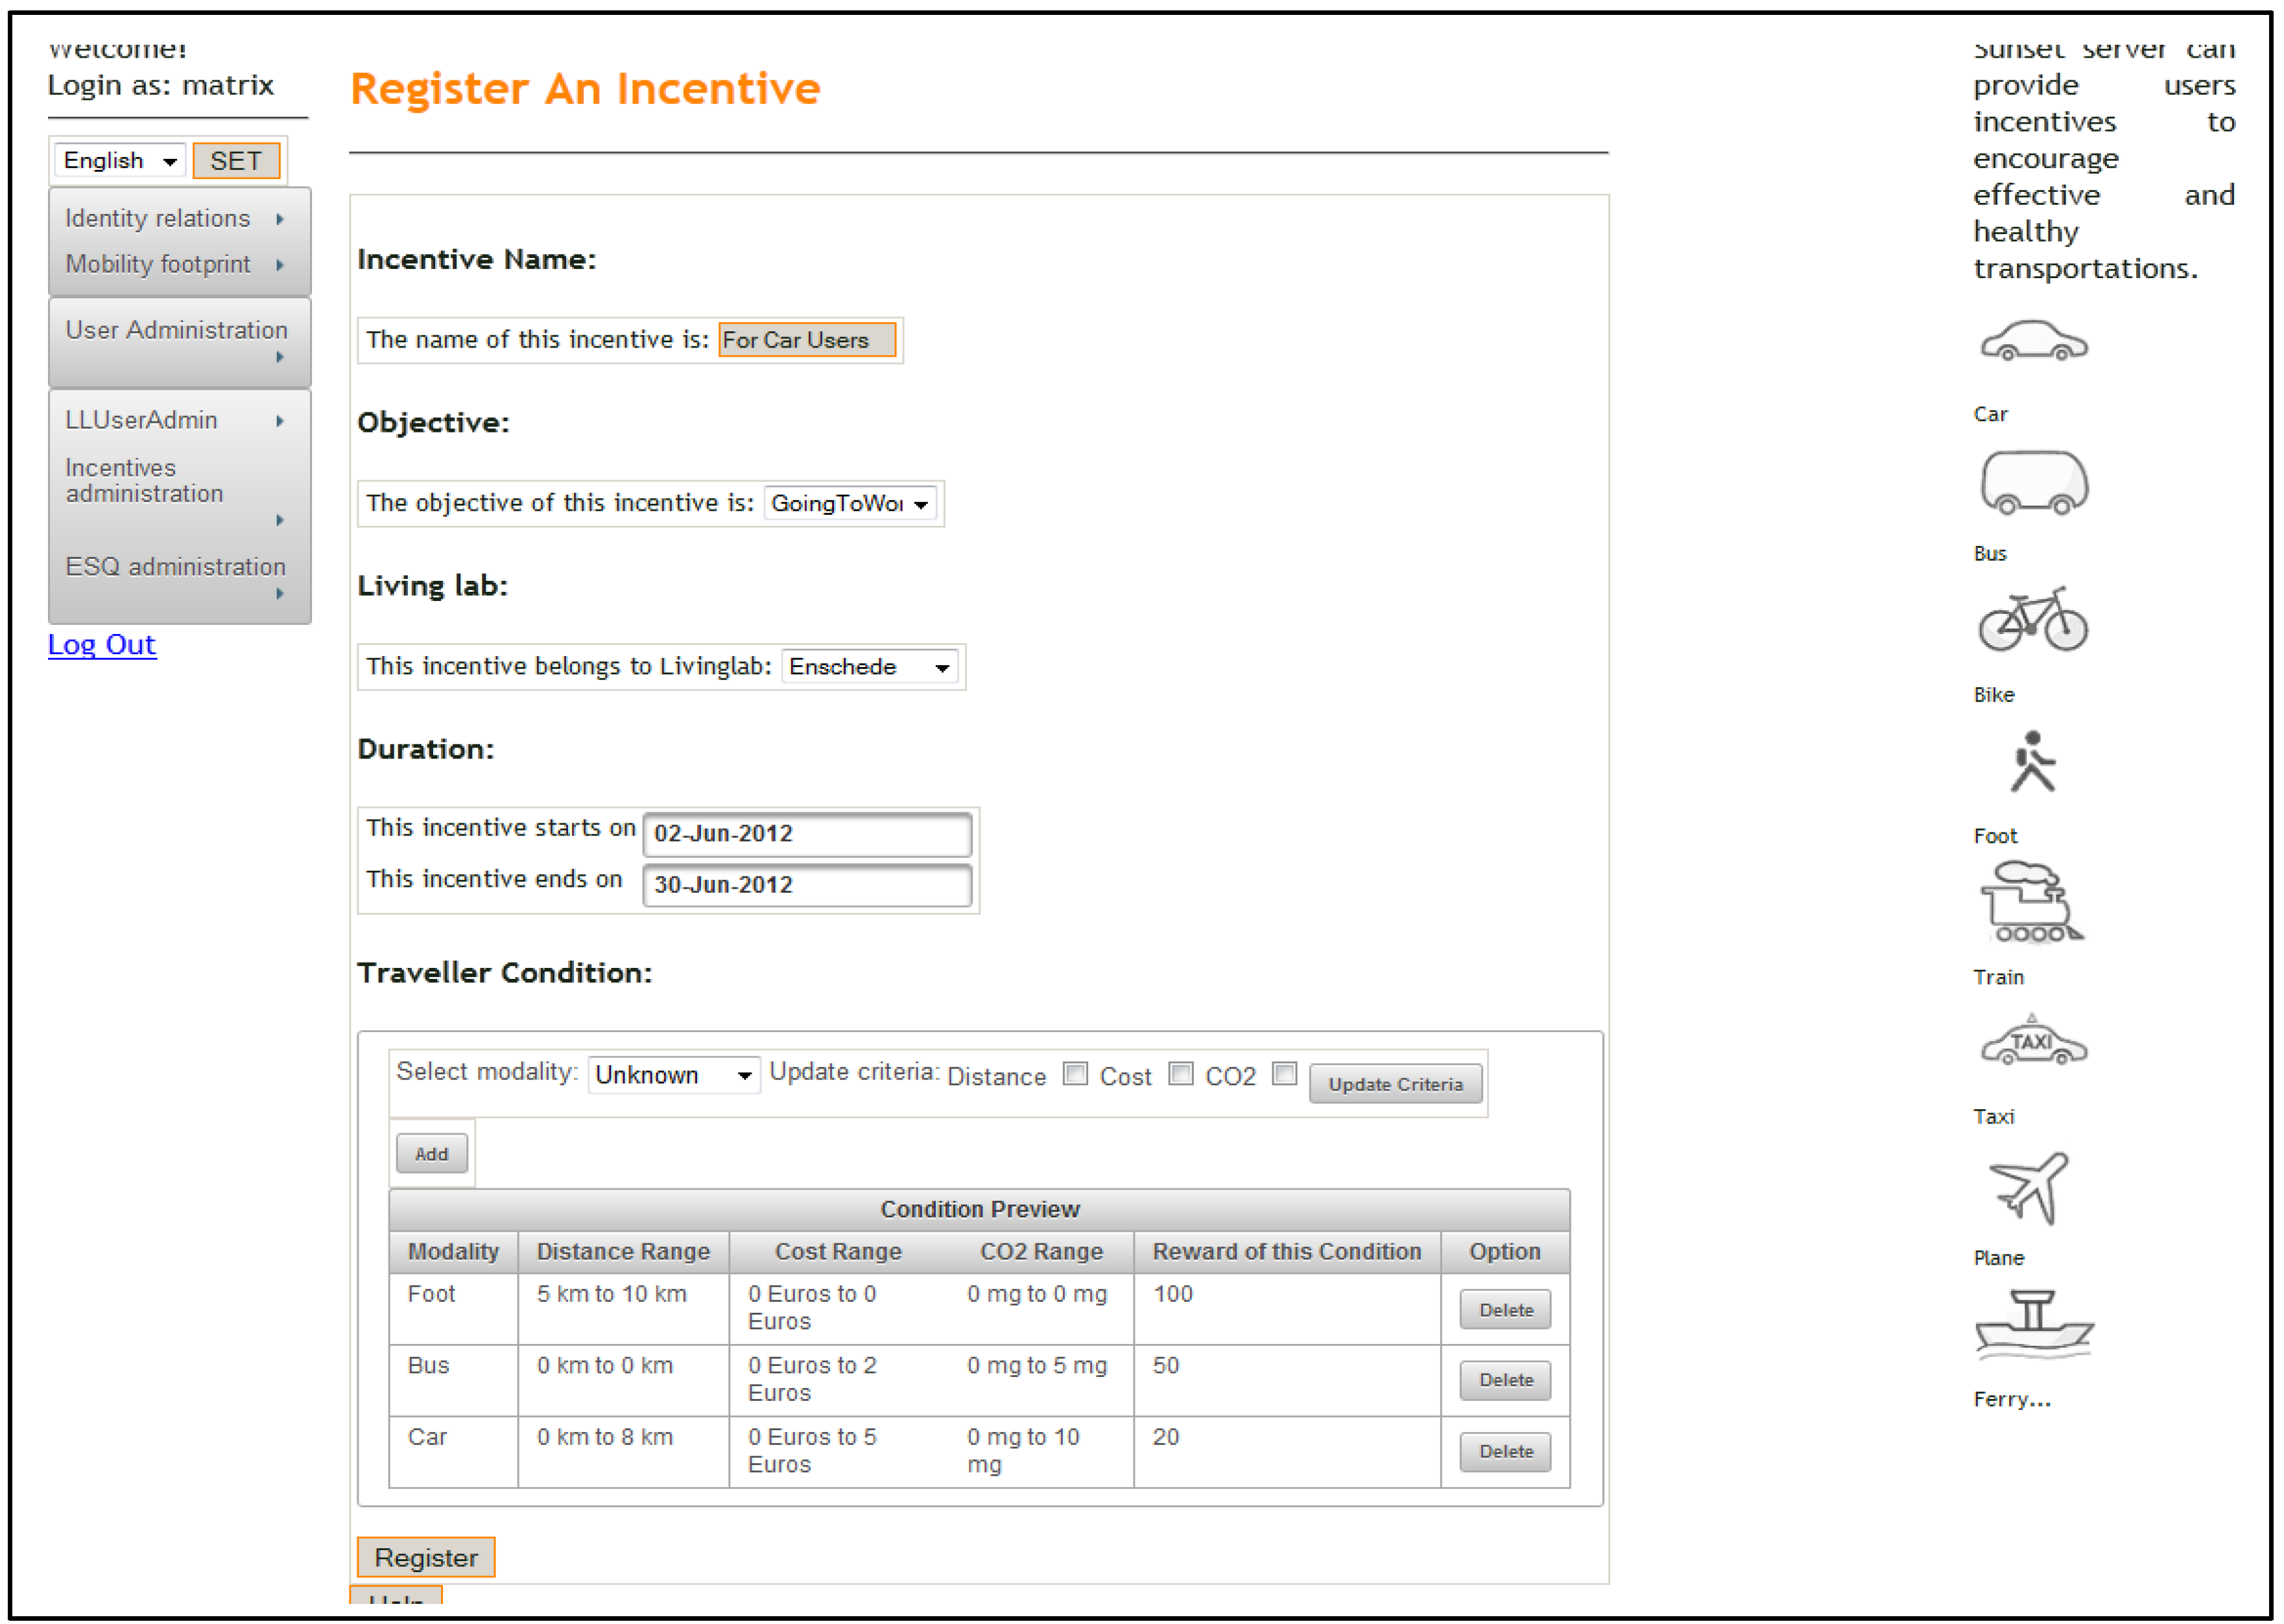
- If you go by foot and travel more than 5 km, you will receive 100 points as a reward;
- If you take a bus and it costs less than 2 Euros and emits CO2 less than 5 mg, you will receive 50 points as a reward;
- If you take a car and travel less than 8 km and it costs less than 5 Euros and emits CO2 less than 10 mg, you will receive 20 points as a reward.
- A title and a description, providing details about how to achieve the task set by the challenge;
- A time period in which the challenge is open;
- Rating of 0–5 stars showing the average rating that this challenge was given by the community as each user who received the challenge can rate it.
- The date and time it was received;
- An explanation as to why it has been received.
- A value representing the number of points the user has been awarded with this reward.

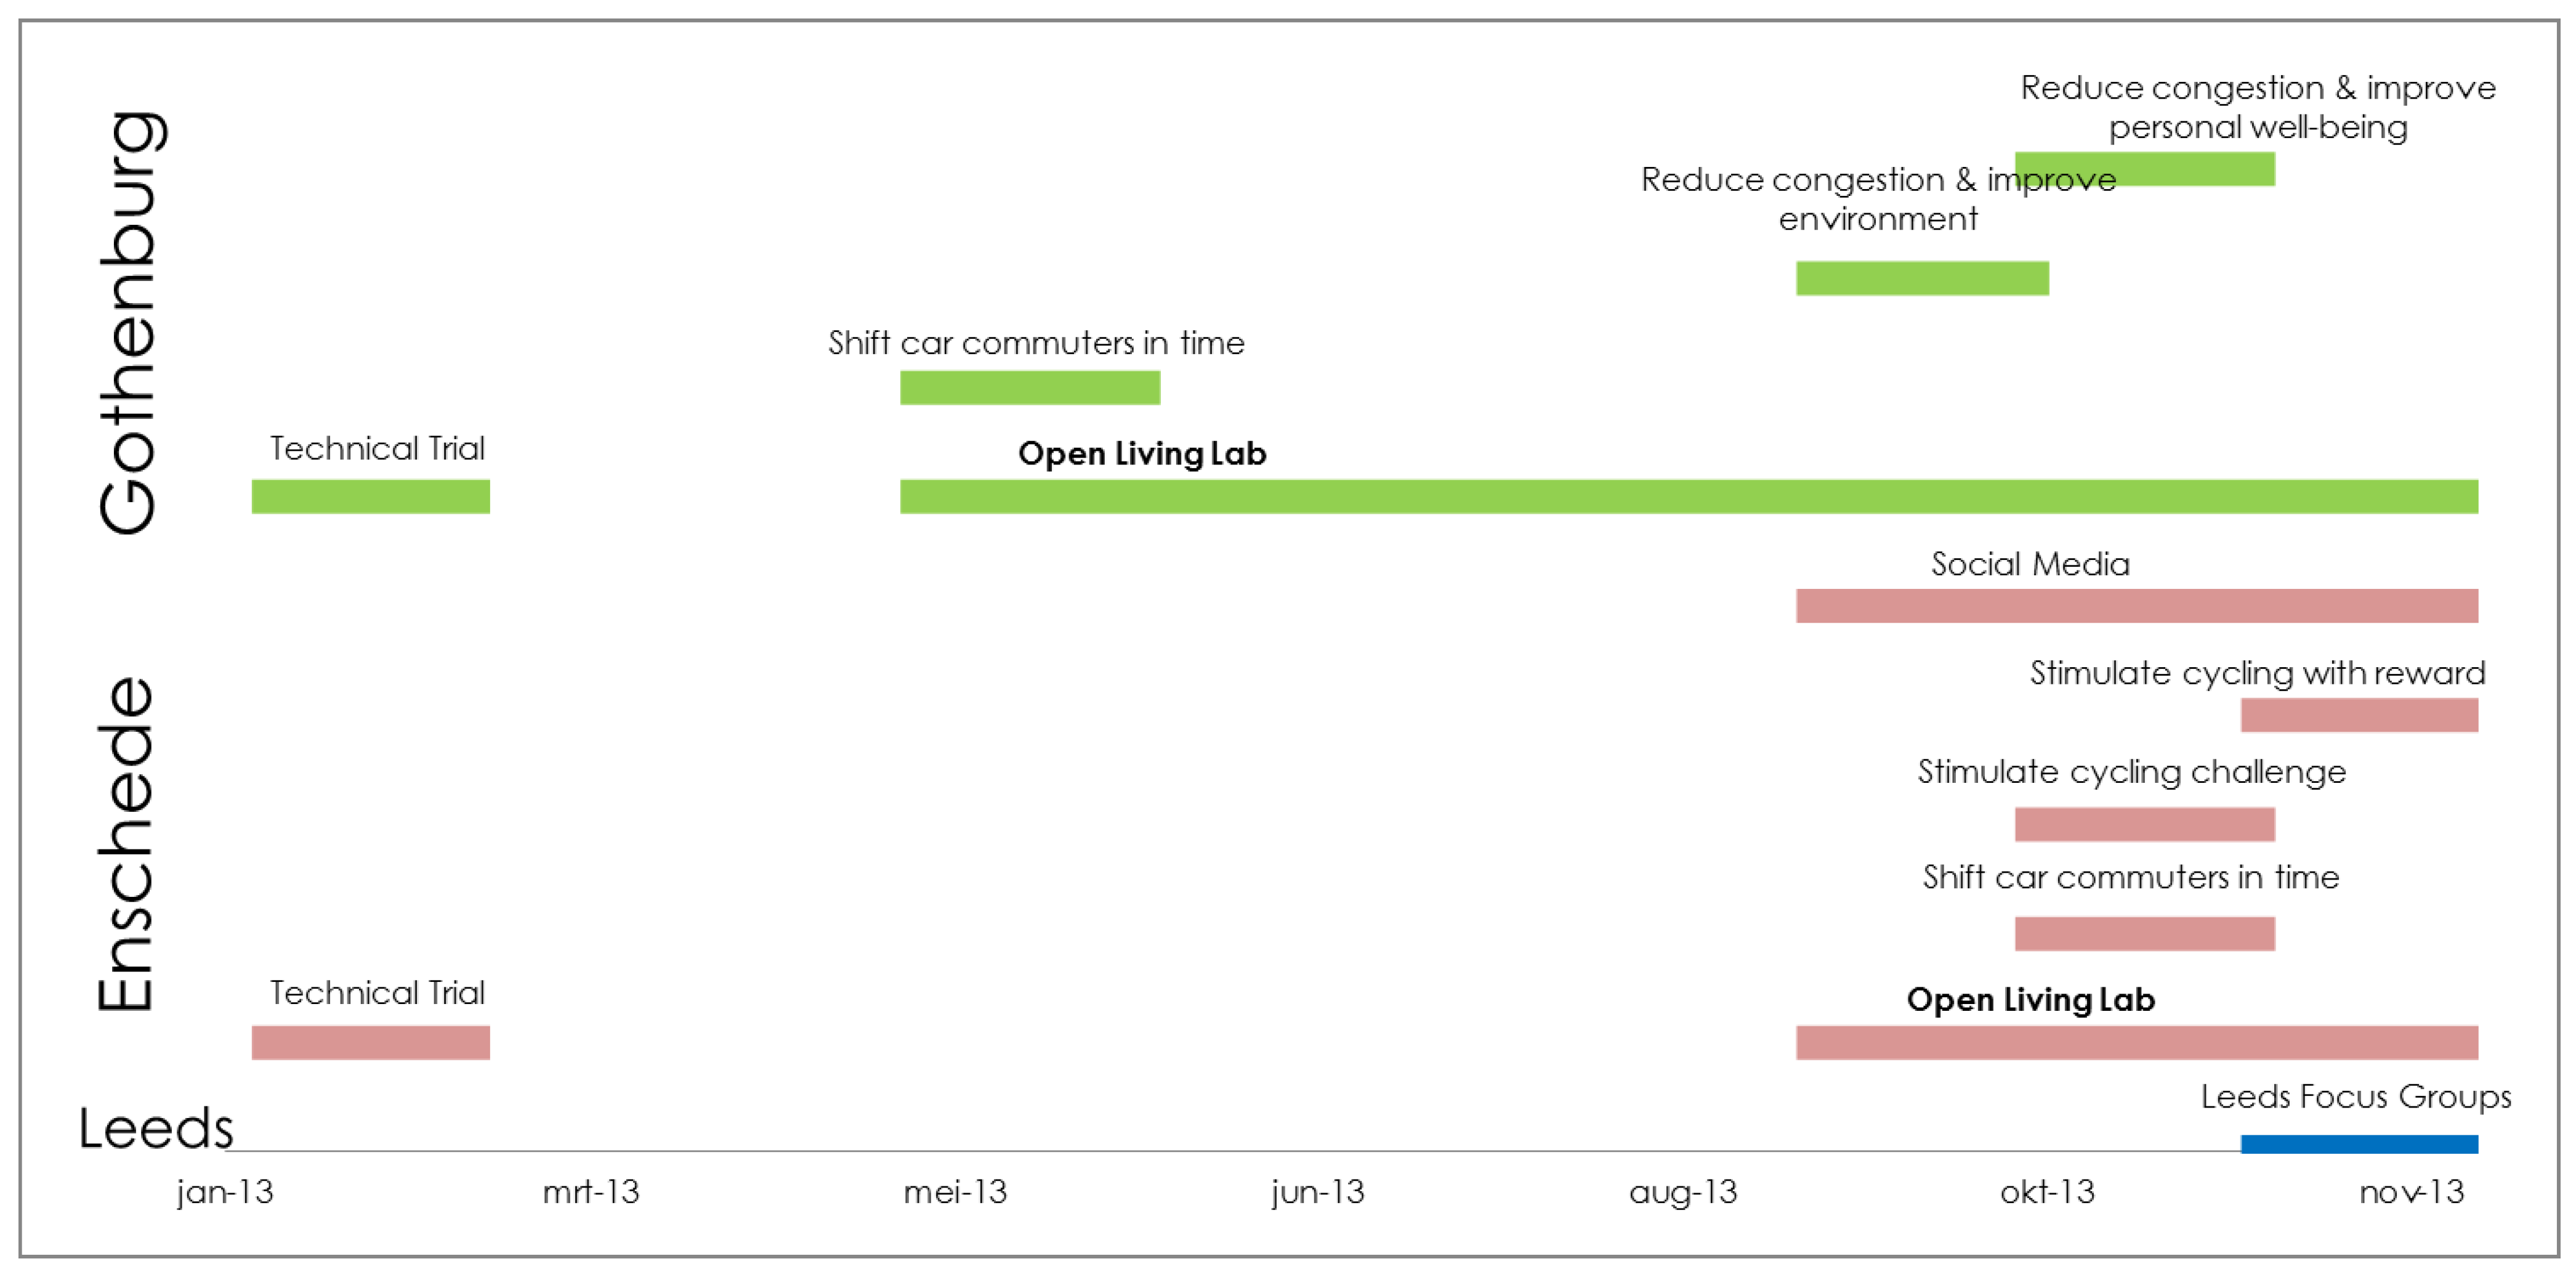
3.4. Deployment Outline
4. Evaluation
4.1. Technical Trials
4.2. User Experiments
| LL City Location | Enschede, NL | Leeds, UK | Gothenburg, SE |
|---|---|---|---|
| No. Participants | 268 | 112 | 138 |
| No. tripzoom users | 108 | 6 | 95 |
| No. of recorded trips | 28104 | 2157 | 19,746 |
| No. KM traveled in trips | 355874 | 19673 | 337698 |
| Incentive | LL Enschede | LL Gothenburg | LL Leeds |
|---|---|---|---|
| (1) Real-time travel information provided by the system | Was not incorporated in the system | ||
| (2) Social networks for peer-to-peer travel info. | Included in LL setting | Included in LL setting | |
| (3) Feedback based on self-monitoring of own travel behaviour | Included in LL setting | Included in LL setting | Included in LL setting |
| (4) Feedback based on setting targets | Was not incorporated in the system | ||
| (5) Challenges (using points without an exchange value) | Included in experiment setting: Changing departure time; Stimulating cycling | Included in experiment setting: Changing departure time; Changing travel modes | |
| (6) Challenges (using points with an exchange value) | Included in experiment setting: Stimulating cycling | ||
| (7) Social networks for sharing location | Included in LL setting | Included in Focus group evaluation | |
| (8) Social networks for finding a buddy | Included in LL setting | Included in LL setting | Included in Focus group evaluation |
| (9) Social networks for treasure hunt | Included in Focus group evaluation | ||

| Incentive | Living Lab | SUNSET Objective | Reward | Users |
|---|---|---|---|---|
| DepTimeCar | Enschede | Congestion | 100 points | 15(3) |
| DepTimeCar | Gothenburg | Congestion | 500 points | 25(7) |
| DepTimePT | Gothenburg | Congestion | 1000–1500 points | 10(4) |
| BusBike | Gothenburg | Environment | 500–750 points | 15(7) |
| ModeDepTime | Gothenburg | Congestion + Environment | 500–1000 points | 10(2) |
| Bicycle | Gothenburg | Environment + Well-being | 500–1000 points | 10(6) |
| Bicycle | Enschede | Environment + Well-being | 100 points | 22(11) |
| BicyclePie | Enschede | Environment + Well-being | Pie | 50 |
4.3. Results
5. Conclusions and Outlook
5.1. Conclusions about the Experience of Using Incentives to Shift Travel Behaviour
5.2. Conclusions about the Experience of Technology Support for the Use of Non-Tangible Incentives to Shift Travel Behaviour
5.3. Outlook
Acknowledgments
Conflicts of Interest
References
- Hernández, L.; Baladrón, C.; Aguiar, J.M.; Calavia, L.; Carro, B.; Sánchez-Esguevillas, A.; Cook, D.J.; Chinarro, D.; Gómez, J. Study of the relationship between weather variables and electric power demand inside a smart grid/smart world framework. Sensors 2012, 12, 11571–11591. [Google Scholar] [CrossRef]
- Liang, Z.; Poslad, S.; Meng, D. Adaptive Sharable Personalized Spatial-Aware Map Services for Mobile Users. Available online: http://www.gi-tage.de/archive/2008/downloads/acceptedPapers/Papers/Liang,Poslad,Meng.pdf (accessed on 3 June 2015).
- Meng, D.; Poslad, S. A Reflective Context-Aware System for Spatial Routing Applications. In Mobile Wireless Middleware, Operating Systems, and Applications-Workshops; Springer: Berlin/Heidelberg, Germany, 2009; pp. 105–110. [Google Scholar]
- Giacobbe, M.; Puliafito, A.; Villari, M. A service oriented system for fleet management and traffic monitoring. In Proceedings of the 2010 IEEE Symposium on Computers and Communications (ISCC), Riccione, Italy, 22–25 June 2010; pp. 784–786.
- Chatzigiannakis, V.; Grammatikou, M.; Papavassiliou, S. Extending Driver’s Horizon Through Comprehensive Incident Detection in Vehicular Networks. IEEE Trans. Veh. Technol. 2007, 56, 3256–3265. [Google Scholar] [CrossRef]
- Parrado, N.; Donoso, Y. Congestion Based Mechanism for Route Discovery in a V2I-V2V System Applying Smart Devices and IoT. Sensors 2015, 15, 7768–7806. [Google Scholar] [CrossRef] [PubMed]
- Pérez, J.; Seco, F.; Milanés, V.; Jiménez, A.; Díaz, J.C.; De Pedro, T. An RFID-Based Intelligent Vehicle Speed Controller Using Active Traffic Signals. Sensors 2010, 10, 5872–5887. [Google Scholar] [CrossRef] [PubMed]
- Matsuzaki, R.; Todoroki, A. Wireless Monitoring of Automobile Tires for Intelligent Tires. Sensors 2008, 8, 8123–8138. [Google Scholar] [CrossRef]
- Ji, Z.; Ganchev, I.; O’Droma, M.; Zhao, L.; Zhang, X. A Cloud-Based Car Parking Middleware for IoT-Based Smart Cities: Design and Implementation. Sensors 2014, 14, 22372–22393. [Google Scholar] [CrossRef] [PubMed]
- Sahayadhas, A.; Sundaraj, K.; Murugappan, M. Detecting Driver Drowsiness Based on Sensors: A Review. Sensors 2012, 12, 16937–16953. [Google Scholar] [CrossRef] [PubMed]
- Jang, J.A.; Kim, H.S.; Cho, H.B. Smart Roadside System for Driver Assistance and Safety Warnings: Framework and Applications. Sensors 2011, 11, 7420–7436. [Google Scholar] [CrossRef] [PubMed]
- Steg, L. Can public transport compete with the private car? IATSS Res. 2003, 2, 27–35. [Google Scholar] [CrossRef]
- Locke, E.A.; Latham, G.P.; Smith, K.J. A Theory of Goal Setting & Task Performance; Prentice Hall College Div.: New York, NY, USA, 1990. [Google Scholar]
- Litman, T. The Online TDM Encyclopedia: mobility management information gateway. Transp. Policy 2003, 10, 245–249. [Google Scholar] [CrossRef]
- Accent. Consultation on the Future of the Western Extension—Report on the Attitudinal Survey of Londoners. TFL project no.: 08024. Available online: http://www.tfl.gov.uk/assets/downloads/annex-2-report-on-the-attitudinal-survey-of-Londoners.pdf (accessed 4 June 2015).
- Department for Transport, UK. Smarter Choices–Changing the way we travel: main document. 2005. Available online: http://www.dft.gov.uk/publications/smarter-choices-changing-the-way-we-travel-main-document/ (accessed on 15 January 2015). [Google Scholar]
- Victoria Transport Institute. Online TDM Encyclopedia, updated May 2014. 2014. Available online: http://www.vtpi.org/tdm/index.php#incentives (accessed on 4 June 2015).
- Kramers, A. Designing multimodal traveler information systems to support sustainability-oriented decisions. Environ. Model. Softw. 2014, 56, 83–93. [Google Scholar] [CrossRef]
- Hancke, G.P.; de Carvalho, B.; Silva, E.; Hancke, G.P., Jr. The Role of Advanced Sensing in Smart Cities. Sensors 2013, 13, 393–425. [Google Scholar] [CrossRef] [PubMed]
- Khan, W.Z.; Xiang, Y.; Aalsalem, M.Y.; Arshad, Q. Mobile Phone Sensing Systems: A Survey. IEEE Commun. Surv. Tutor. 2013, 15, 402–427. [Google Scholar] [CrossRef]
- Froehlich, J.; Dillahunt, T.; Klasnja, P.; Mankoff, J.; Consolvo, S.; Harrison, B.L. UbiGreen: investigating a mobile tool for tracking and supporting green transportation habits. In Proceedings of the SIGCHI Conference on Human Factors in Computing Systems, Boston, MA, USA, 4–9 April, 2009; pp. 1043–1052.
- Fujii, S.; Taniguchi, A. Determinants of the effectiveness of travel feedback programs—A review of communicative mobility management measures for changing travel behaviour in Japan. Transp. Policy 2006, 13, 339–348. [Google Scholar] [CrossRef]
- Rose, G.; Ampt, E. Travel blending: an Australian travel awareness initiative. Transportation Res. Part D Transp. Environ. 2001, 6, 95–110. [Google Scholar] [CrossRef]
- Tertoolen, G.; van Kreveld, D.; Verstraten, B. Psychological resistance against attempts to reduce private car use. Transp. Res. Part A Policy Pract. 1998, 32, 171–181. [Google Scholar] [CrossRef]
- Thøgersen, J. Social marketing of alternative transportation modes. In Threats from Car Traffic to the Quality of Urban Life: Problems, Causes, Solutions; Elsevier Science: Amsterdam, The Netherlands, 2007; pp. 367–381. [Google Scholar]
- Cho, E.; Myers, S.A.; Leskovec, J. Friendship and mobility: user movement in location-based social networks. In Proceedings of the 17th International Conference on Knowledge discovery and data mining, San Diego, CA, USA, 21–24 August 2011; pp. 1082–1090.
- Batterbury, S. Environmental Activism and Social Networks: Campaigning for Bicycles and AlternativeTransport in West London. ANNALS Am. Acad. Polit. Soc. Sci. 2003, 590, 150–169. [Google Scholar] [CrossRef]
- Binsted, A.; Hutchins, R. The Role of Social Networking Sites in Changing Travel Behaviours, UK. 2012. Available online: http://www.trl.co.uk/online_store/reports_publications/trl_reports/cat_traffic_and_the_environment/report_the_role_of_social_networking_sites_in_changing_travel_behaviours.htm (accessed on 15 January 2015).
- Bonneau, J.; Preibusch, S. The privacy jungle: On the market for data protection in social networks. In Economics of Information Security and Privacy; Springer-US: New York, NY, USA, 2010; pp. 121–167. [Google Scholar]
- Fogg, B.J.; Hreha, J. Behavior Wizard: A Method for Matching Target Behaviors with Solutions. In Persuasive Technology; Springer: Berlin/Heidelberg, Germany, 2010; pp. 117–131. [Google Scholar]
- Bliemer, M.; van Amelsfort, D. Rewarding instead of charging road users: A model case study investigating effects on traffic conditions. Eur. Transp. 2010, 44, 23–40. [Google Scholar]
- Ben-Elia, E.; Ettema, D. Carrots versus sticks: Rewarding commuters for avoiding the rush-hour—A study of willingness to participate. Transp. Policy 2009, 16, 68–76. [Google Scholar] [CrossRef]
- Cameron, J.; Pierce, W.D. The Debate about Rewards and Intrinsic Motivation: Protests and Accusations Do Not Alter the Results. Rev. Educ. Res. 1996, 66, 39–51. [Google Scholar] [CrossRef]
- Deci, EL. Effects of externally mediated rewards on intrinsic motivation. J. Personal. Soc. Psychol. 1971, 18, 105–115. [Google Scholar] [CrossRef]
- Harackiewlcz, J.M. The Effects of Reward Contingency and Performance Feedback on Intrinsic Motivation. J. Personal. Soc. Psychol. 1979, 37, 1352–63. [Google Scholar] [CrossRef]
- Bie, J.; Bijlsma, M.; Broll, G.; Cao, H.; Hjalmarsson, A.; Hodgson, F.; Holleis, P.; van Houten, Y.; Koolwaaij, J.; Kusumastuti, D.; et al. Move better with tripzoom. Int. J. Adv. Life Sci. 2012, 4, 125–135. [Google Scholar]
- Oshin, T.; Ma, A.; Poslad, S. Improving the Energy-Efficiency of GPS based Location Sensing Smartphone Applications. In Proceedings of the 11th International Conference on Trust, Security and Privacy in Computing and Communications (TrustCom), Liverpool, UK, 25–27 June 2012; pp. 1698–1705.
- Oshin, T.O.; Poslad, S.; Zhang, Z. Energy-Efficient Real-Time Human Mobility State Classification Using Smartphones. IEEE Trans. Comput. 2015, 64, 1680–1693. [Google Scholar] [CrossRef]
- Meng, D.; Poslad, S. A Reflective Goal-based System for Context-aware Adaptation. In Mobile Wireless Middleware, Operating Systems, and Applications-Workshop; Springer: Berlin, Germany, 2009; pp. 105–110. [Google Scholar]
- Mei, H.; Ma, A.; Poslad, S.; Oshin, T. Short Term Traffic Volume Prediction for Sustainable Transportation in Urban Area. J. Comput. Civ. Eng. 2015, 29, 04014036. [Google Scholar] [CrossRef]
© 2015 by the authors; licensee MDPI, Basel, Switzerland. This article is an open access article distributed under the terms and conditions of the Creative Commons Attribution license (http://creativecommons.org/licenses/by/4.0/).
Share and Cite
Poslad, S.; Ma, A.; Wang, Z.; Mei, H. Using a Smart City IoT to Incentivise and Target Shifts in Mobility Behaviour—Is It a Piece of Pie? Sensors 2015, 15, 13069-13096. https://doi.org/10.3390/s150613069
Poslad S, Ma A, Wang Z, Mei H. Using a Smart City IoT to Incentivise and Target Shifts in Mobility Behaviour—Is It a Piece of Pie? Sensors. 2015; 15(6):13069-13096. https://doi.org/10.3390/s150613069
Chicago/Turabian StylePoslad, Stefan, Athen Ma, Zhenchen Wang, and Haibo Mei. 2015. "Using a Smart City IoT to Incentivise and Target Shifts in Mobility Behaviour—Is It a Piece of Pie?" Sensors 15, no. 6: 13069-13096. https://doi.org/10.3390/s150613069
APA StylePoslad, S., Ma, A., Wang, Z., & Mei, H. (2015). Using a Smart City IoT to Incentivise and Target Shifts in Mobility Behaviour—Is It a Piece of Pie? Sensors, 15(6), 13069-13096. https://doi.org/10.3390/s150613069