A mathematical model based on Equation (3) has been set up to complete the uncertainty estimation of the measurement results. In this model, four uncertainty sources: the balance added mass
m, the acceleration of gravity
g, the increase of the PSD output signal
U, and the optical lever sensitivity
S were considered. There are only product and divide forms in the input parameters, so the combined relative standard uncertainty of the normal spring constant can be described by Equation (4):
where
urel(
m),
urel(
g),
urel(
U) and
urel(
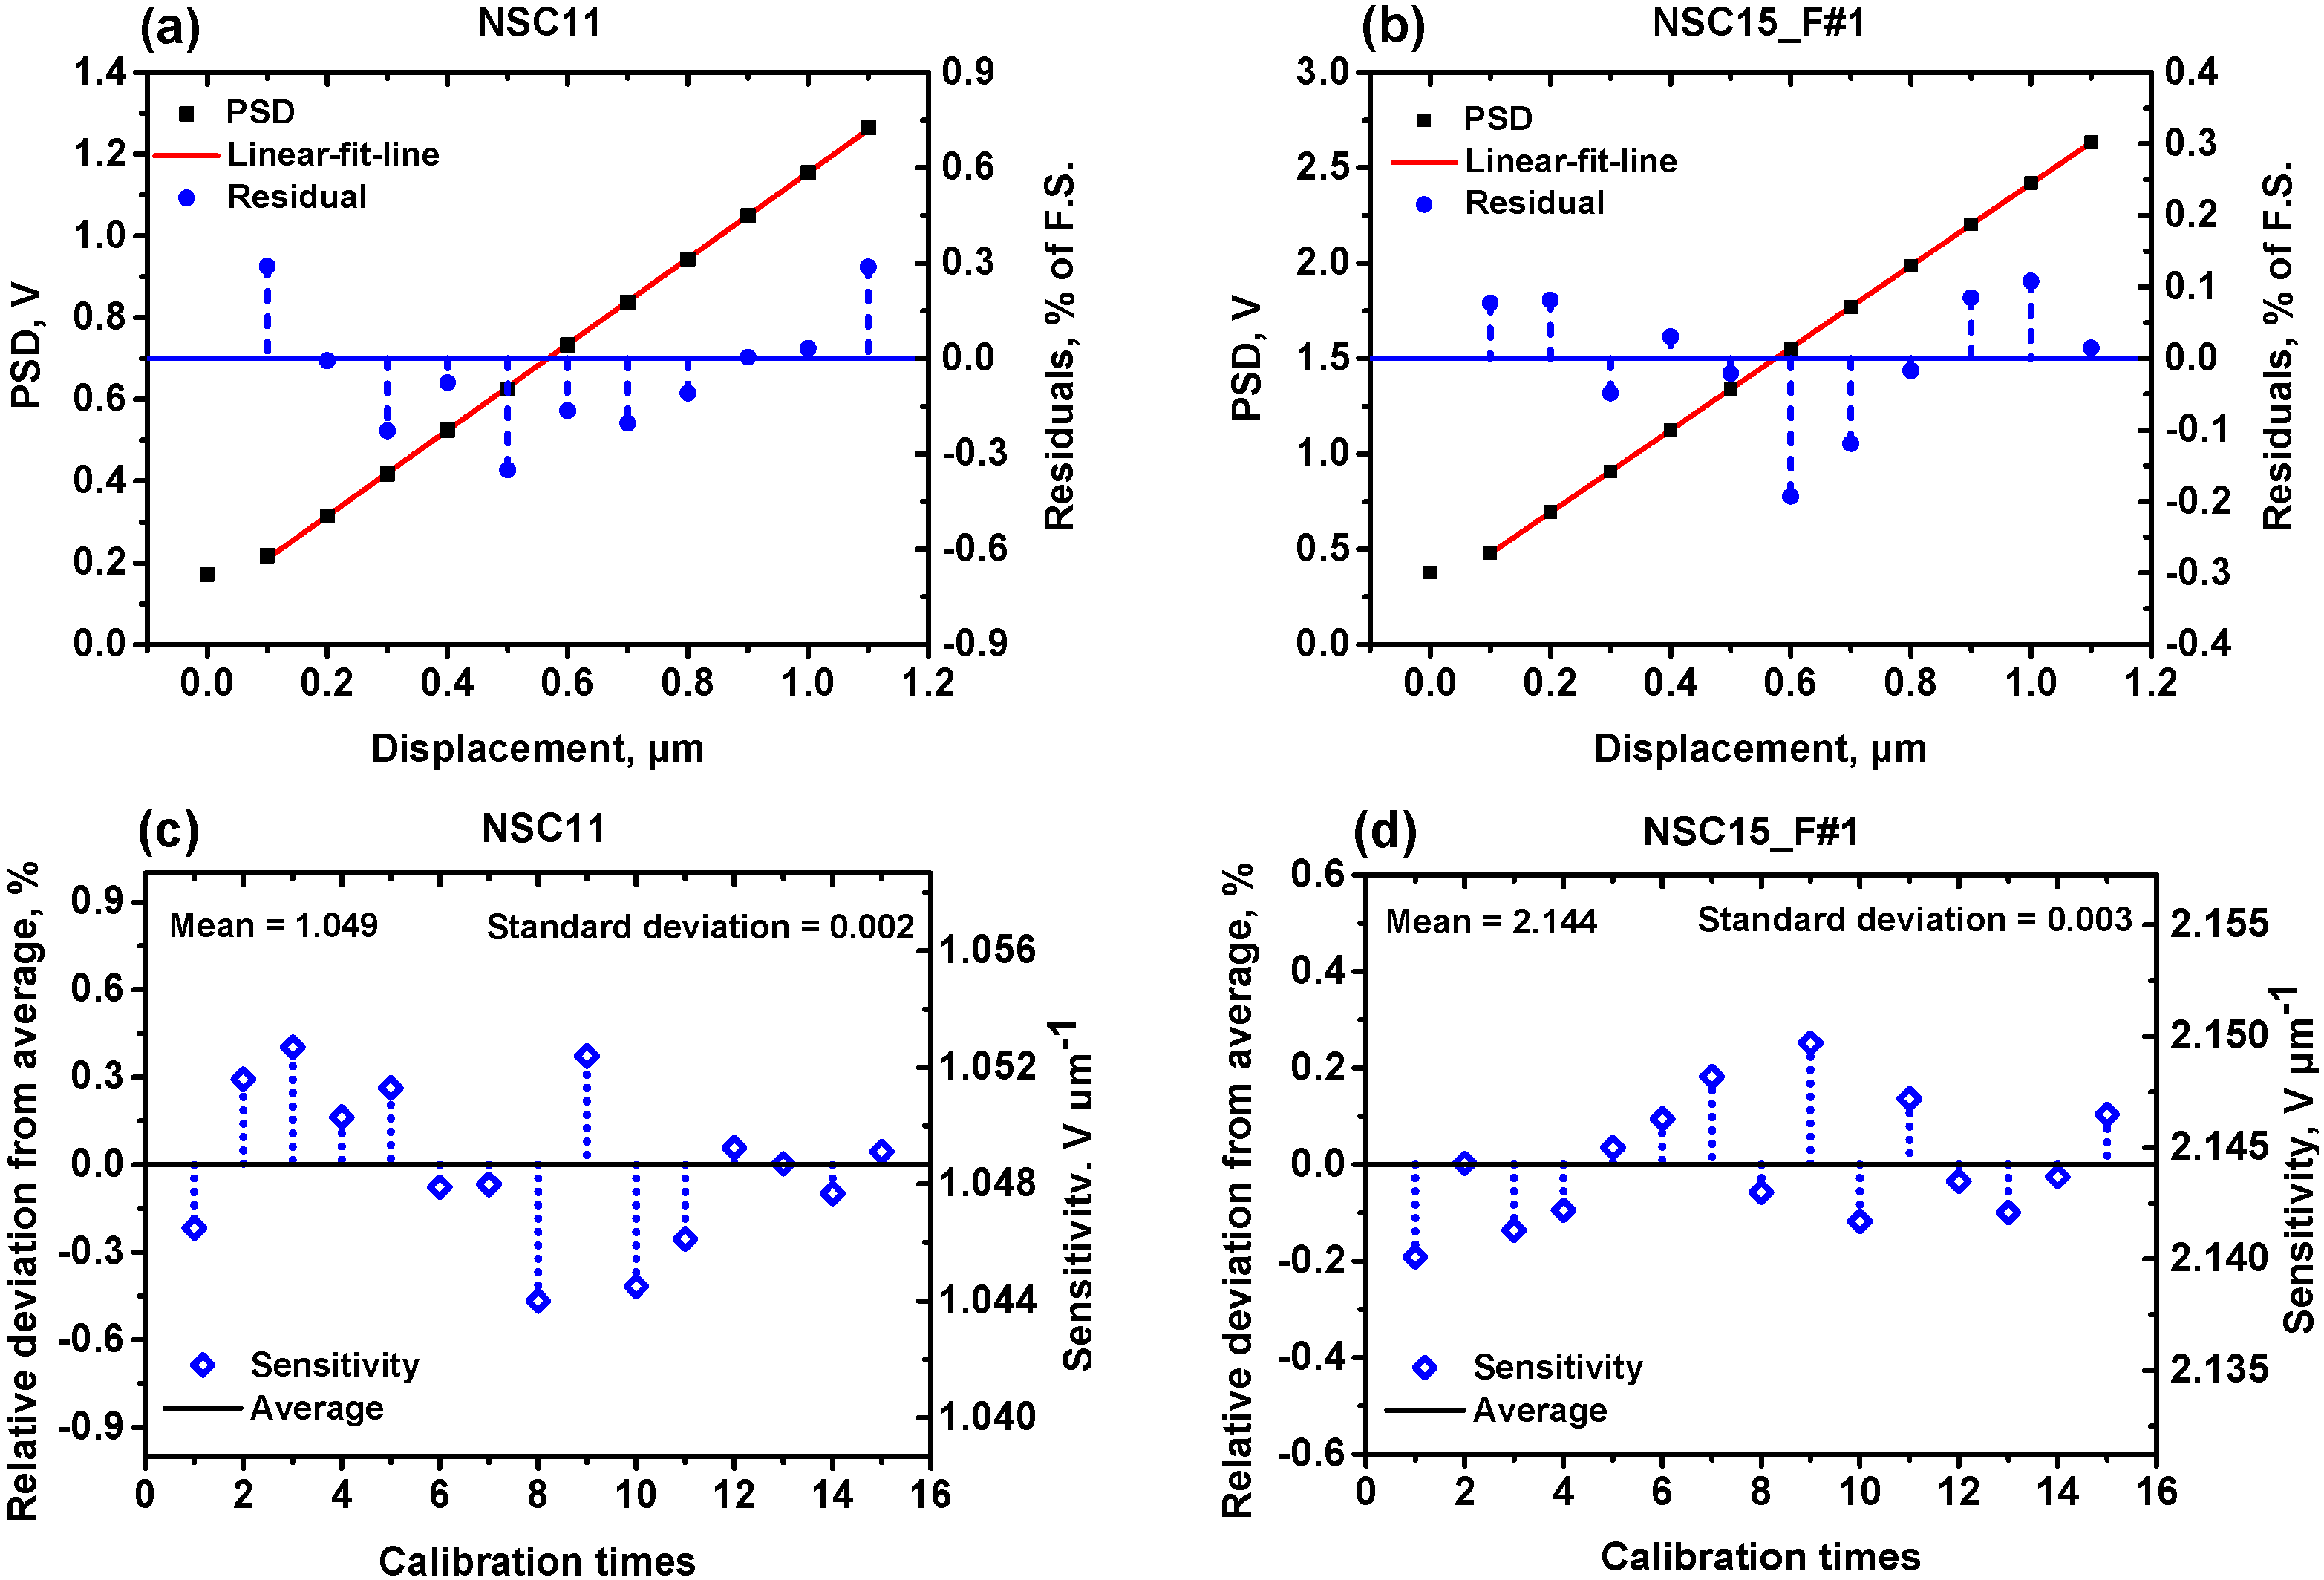
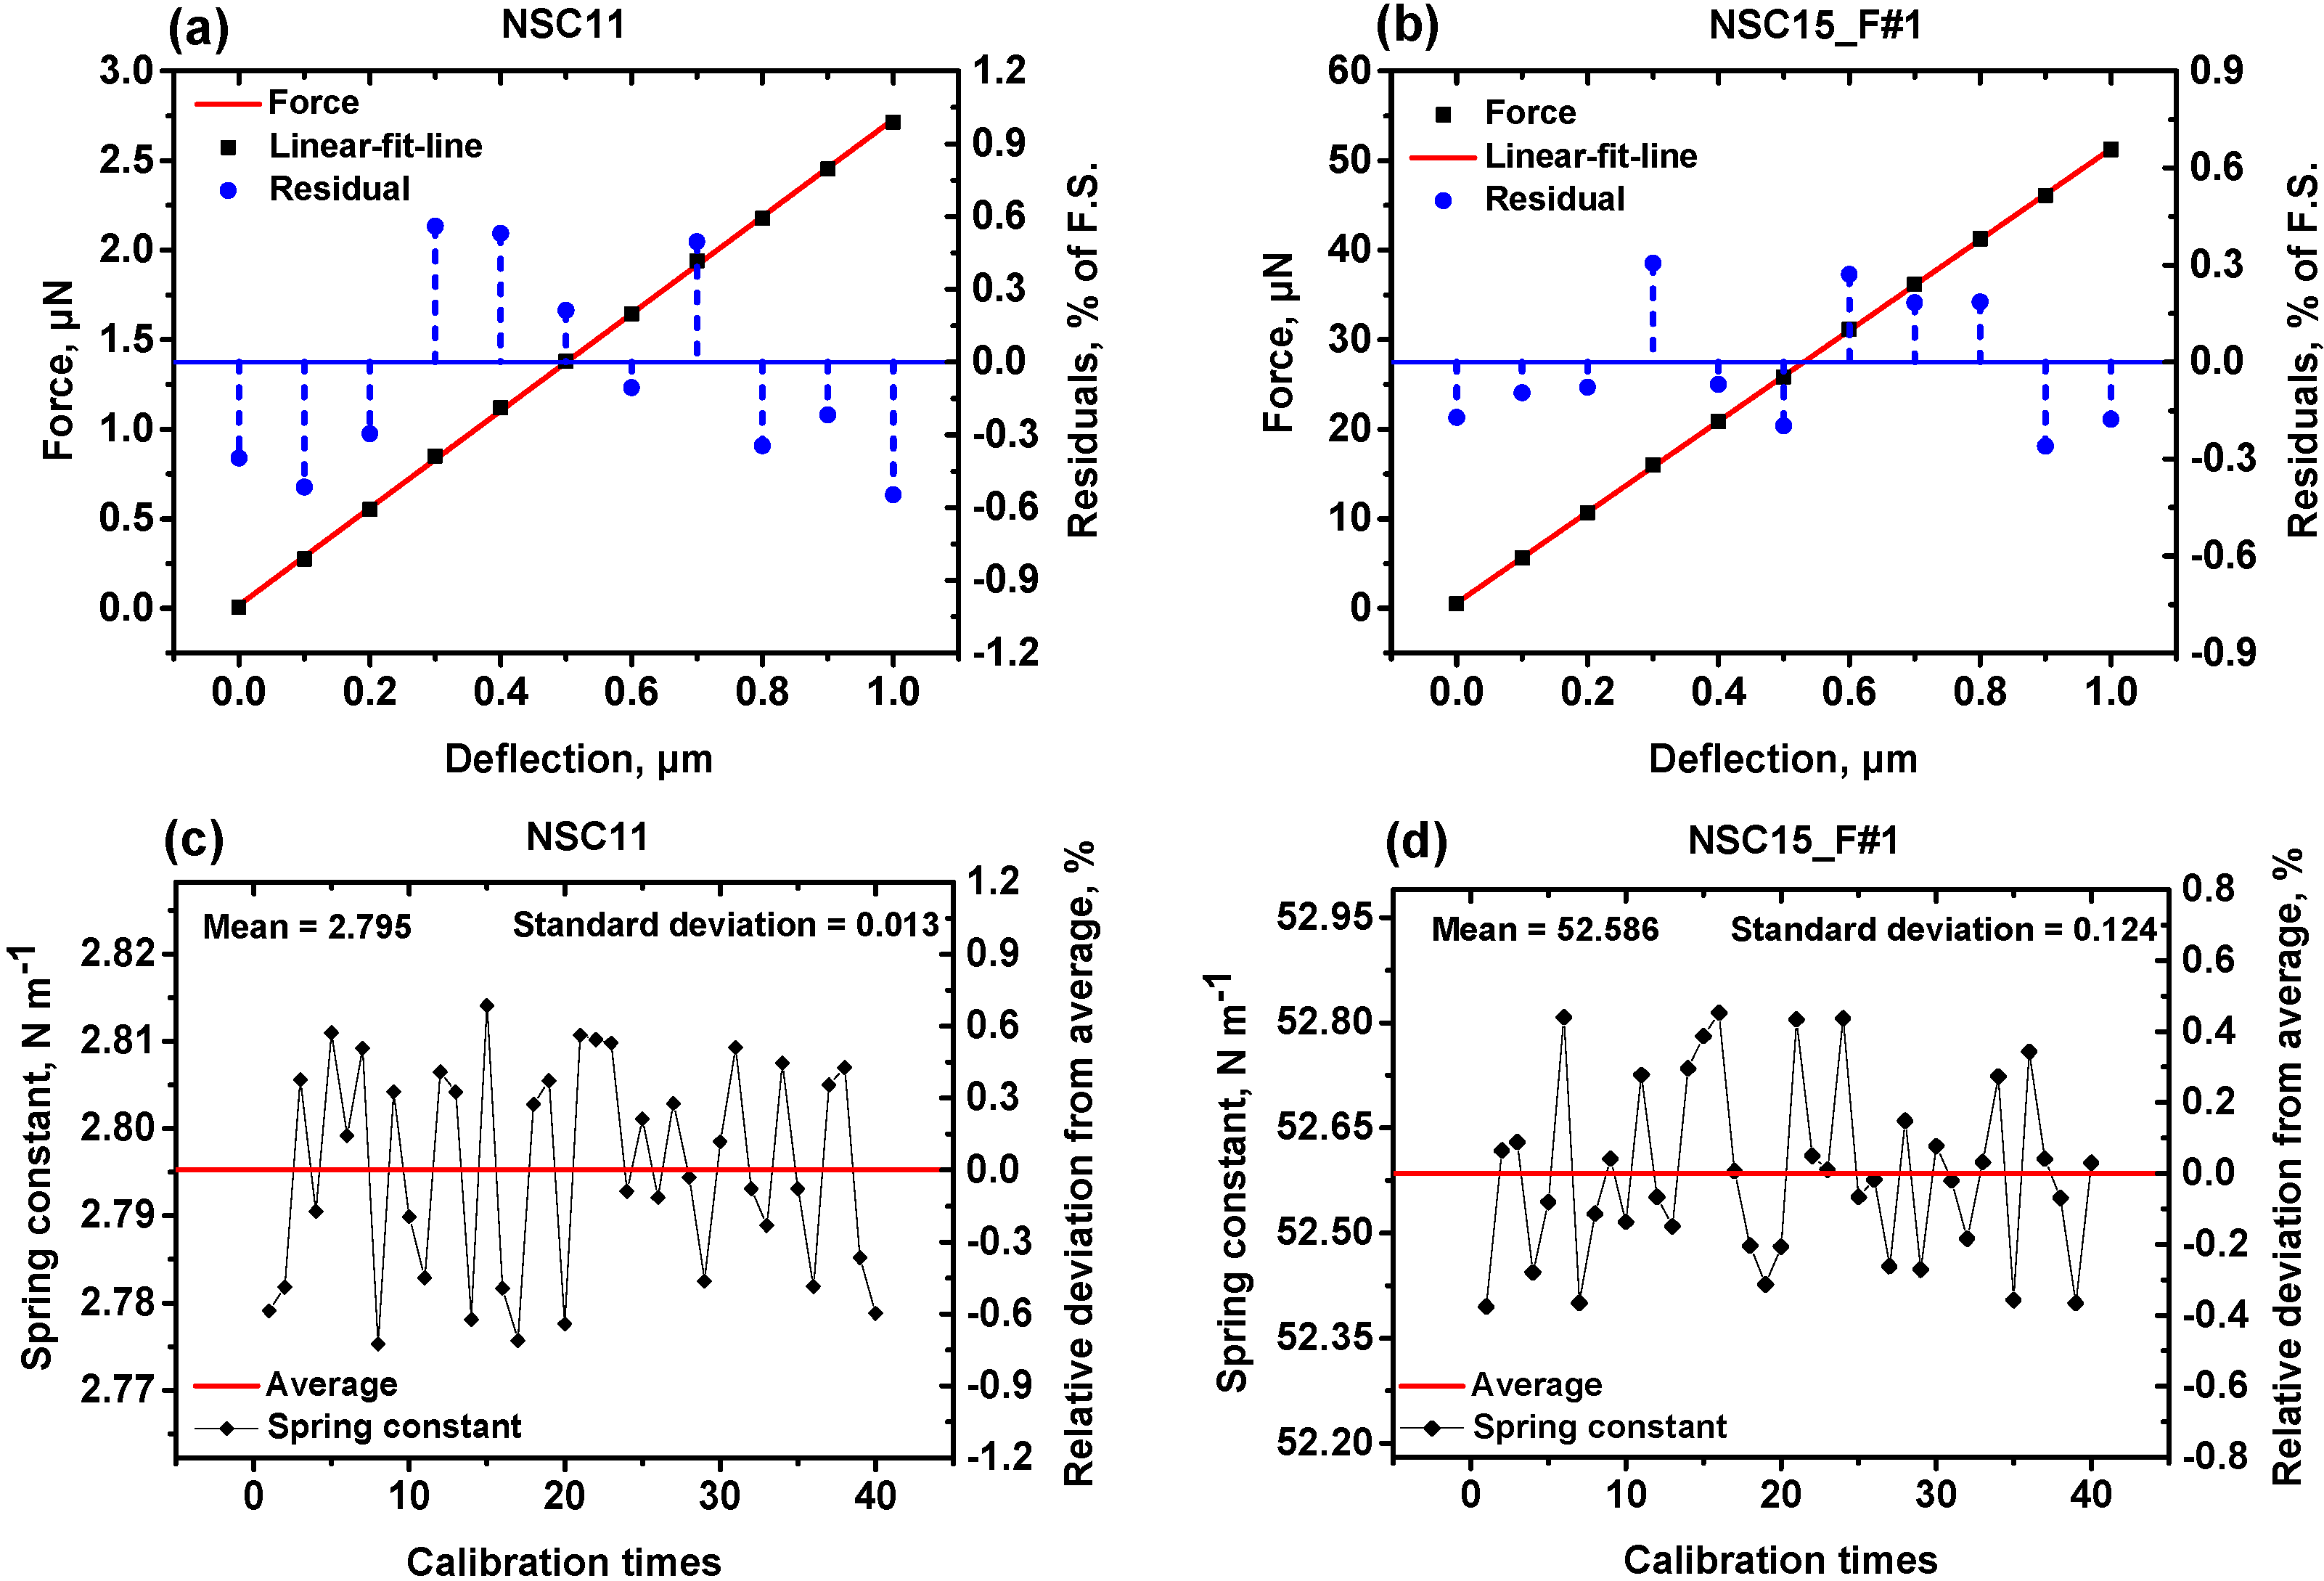
S) are the components of the relative standard uncertainty of the measured spring constant. The NSC15_F#1 cantilever mentioned above is chosen to discuss the uncertainty estimation in detail.
4.1. Uncertainty of the Added Mass, urel(m)
The uncertainty of the balance added mass was combined with the uncertainties of the resolution, the reproducibility of the balance, and the measurement repeatability of added mass. According to the handbook and the calibration certification provided by the manufacturer, the resolution and the reproducibility of the precision balance are 0.1 μg and 0.25 μg, respectively. Assumed as uniform distribution, the uncertainty contributed by the resolution and the reproducibility of the balance could be estimated as
,
. The degrees of freedom (DOF) of the two components were:
In the force calibration, the experiment was repeated
n = 40 times. The average and experimental standard deviation of the added mass were
and:
The experimental standard deviation of the average value of 40 times measurement is calculated as:
So the uncertainty of the measurement repeatability of added mass was expressed as .The corresponding DOF was given by v3(m) = n − 1 = 39.
The standard uncertainty of added mass was determined by the uncertainty of three components:
The relative standard uncertainty and the degrees of freedom of the added mass were given by:
4.4. Uncertainty of the Optical Lever Sensitivity, urel(S)
Equation (1) is the principal formula for the optical lever sensitivity
S. It is the transparent-box model part of the mathematical model for uncertainty estimation. The laser spot shift on the cantilever
P is also an uncertainty source for the optical lever sensitivity
S, and should be introduced into Equation (1) as a correction factor (the black-box model part) to complete the mathematical model. The full mathematical model for the uncertainty estimation of the optical lever sensitivity
S can be described by Equation (11):
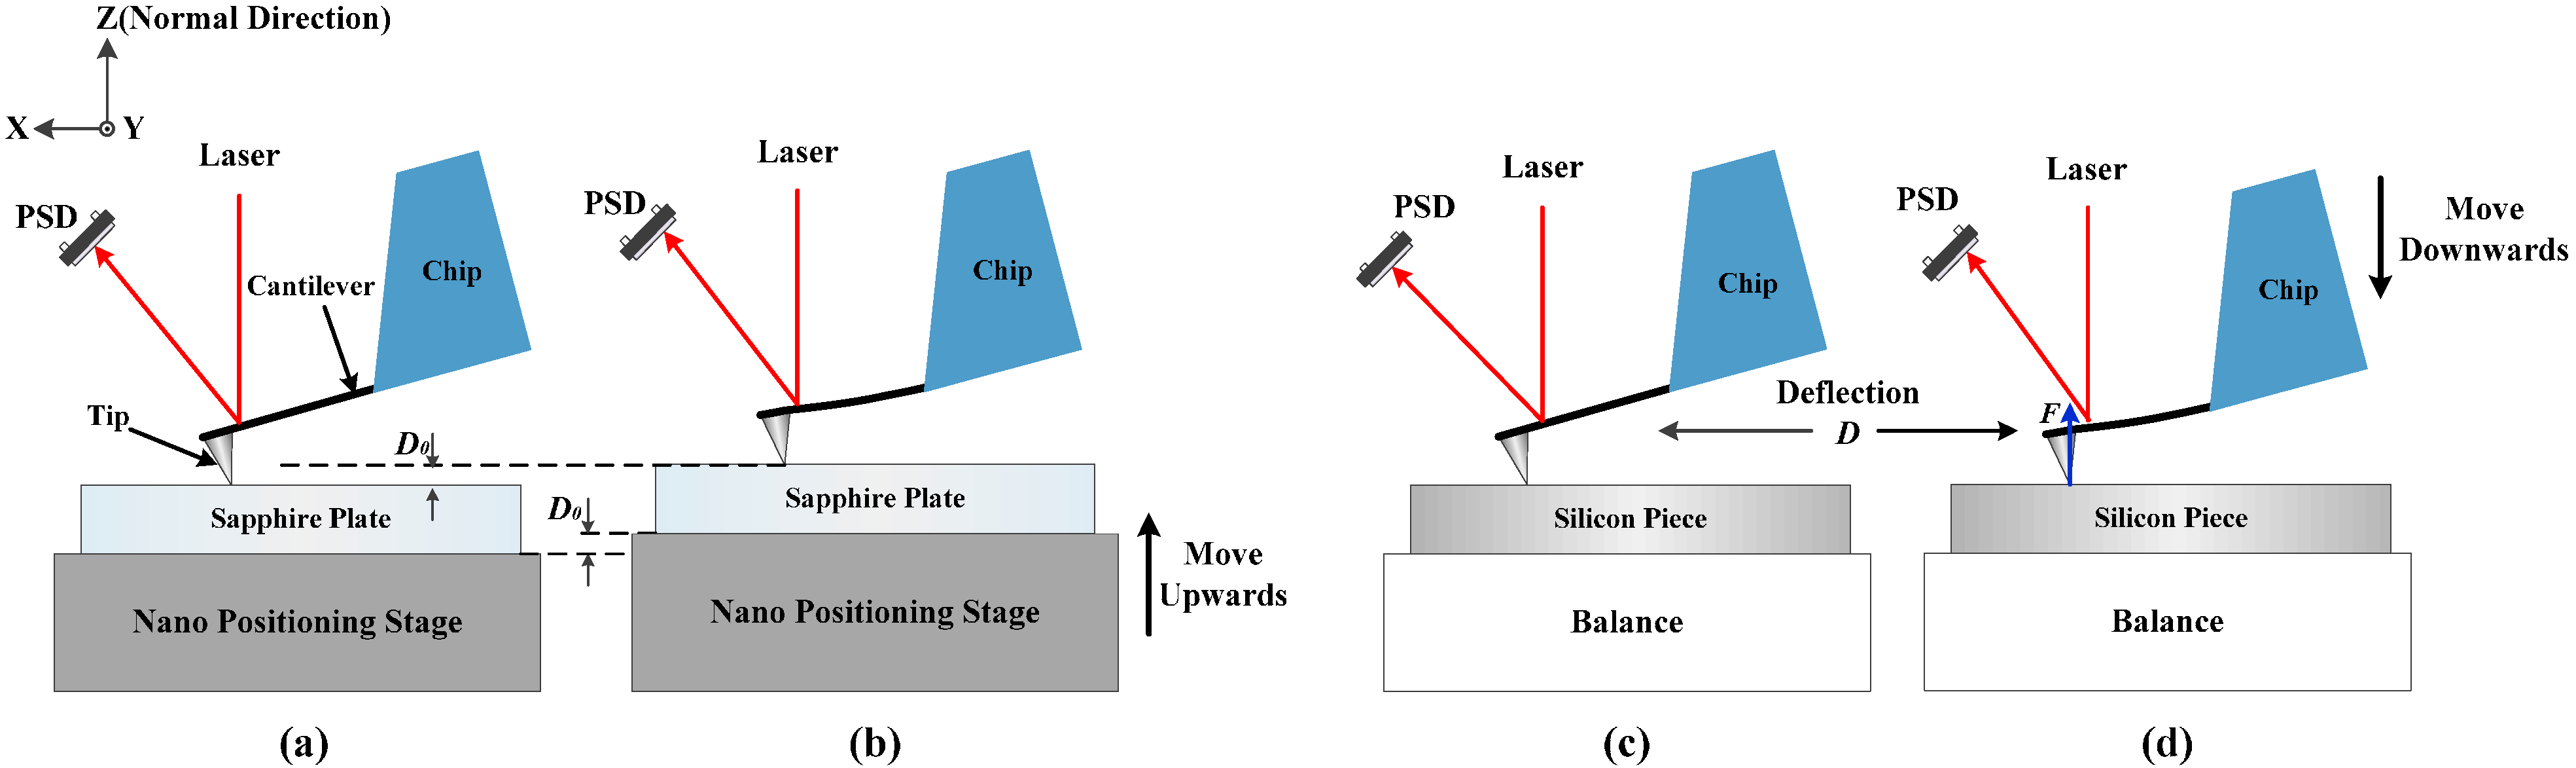
According to Equation (11), the uncertainty of three components, the shift of the PSD output signal U0, the vertical displacement of the nanopositioning stage D0, and the laser spot shift on the cantilever P should be evaluated, respectively.
In the calibration of the optical lever sensitivity, U0 was measured n = 15 times with the same cantilever deflection. The expectation of U0 and its experimental standard deviation were and . The experimental standard deviation of the average value of 15 times measurement can be described as .
The standard uncertainty of the measurement repeatability of
U0 was expressed as:
. So the relative standard uncertainty caused by
U0 can be described as:
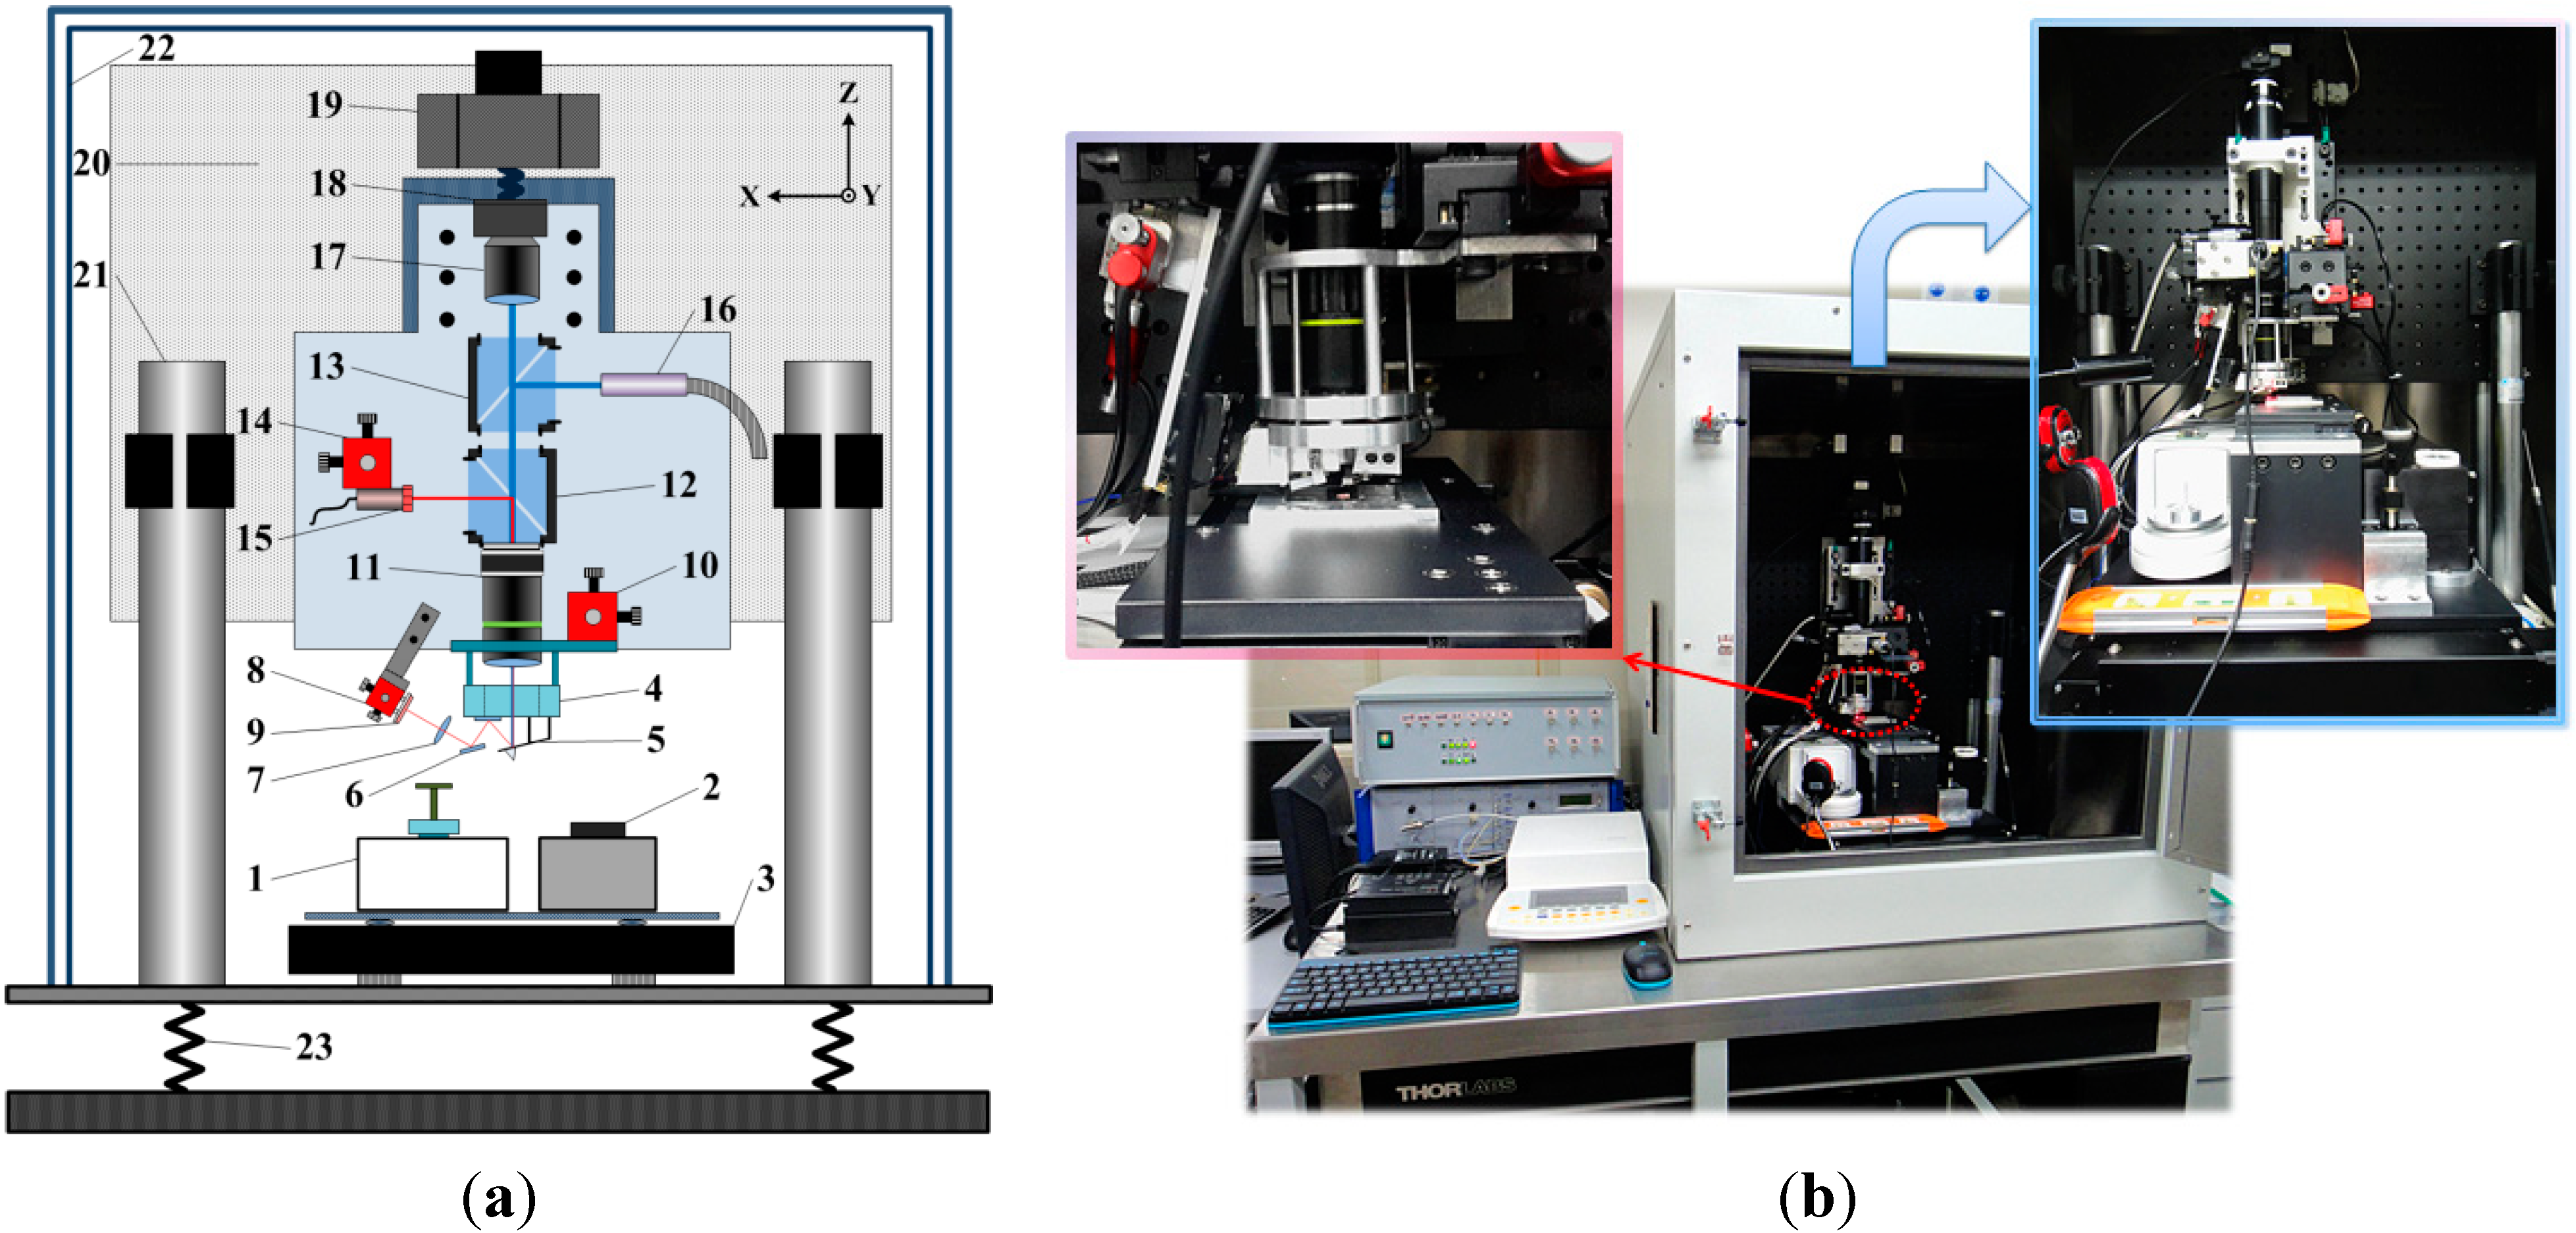
The closed-loop nanopositioning stage (P-733.3CL) was used in the calibration of the optical lever sensitivity to generate a deflection of the cantilever. According to the performance test protocol provided by the manufacturer, the nanopositioning stage was calibrated by a laser interferometer (SP 120D, SIOS GmbH., Ilmenau, Germany). It is able to position 10 μm with 0.2 nm closed loop resolution in the Z direction. The nonlinearity and full range reproducibility of the stage were reported to be 2 nm and 1 nm.
The standard uncertainty component caused by instrument resolution, typical nonlinearity, and full range reproducibility of the stage were:
The combined standard uncertainty of the components above was:
As the maximum displacement in the sensitivity calibration was
, the relative standard uncertainty and DOF of the displacement
D0 were given by:
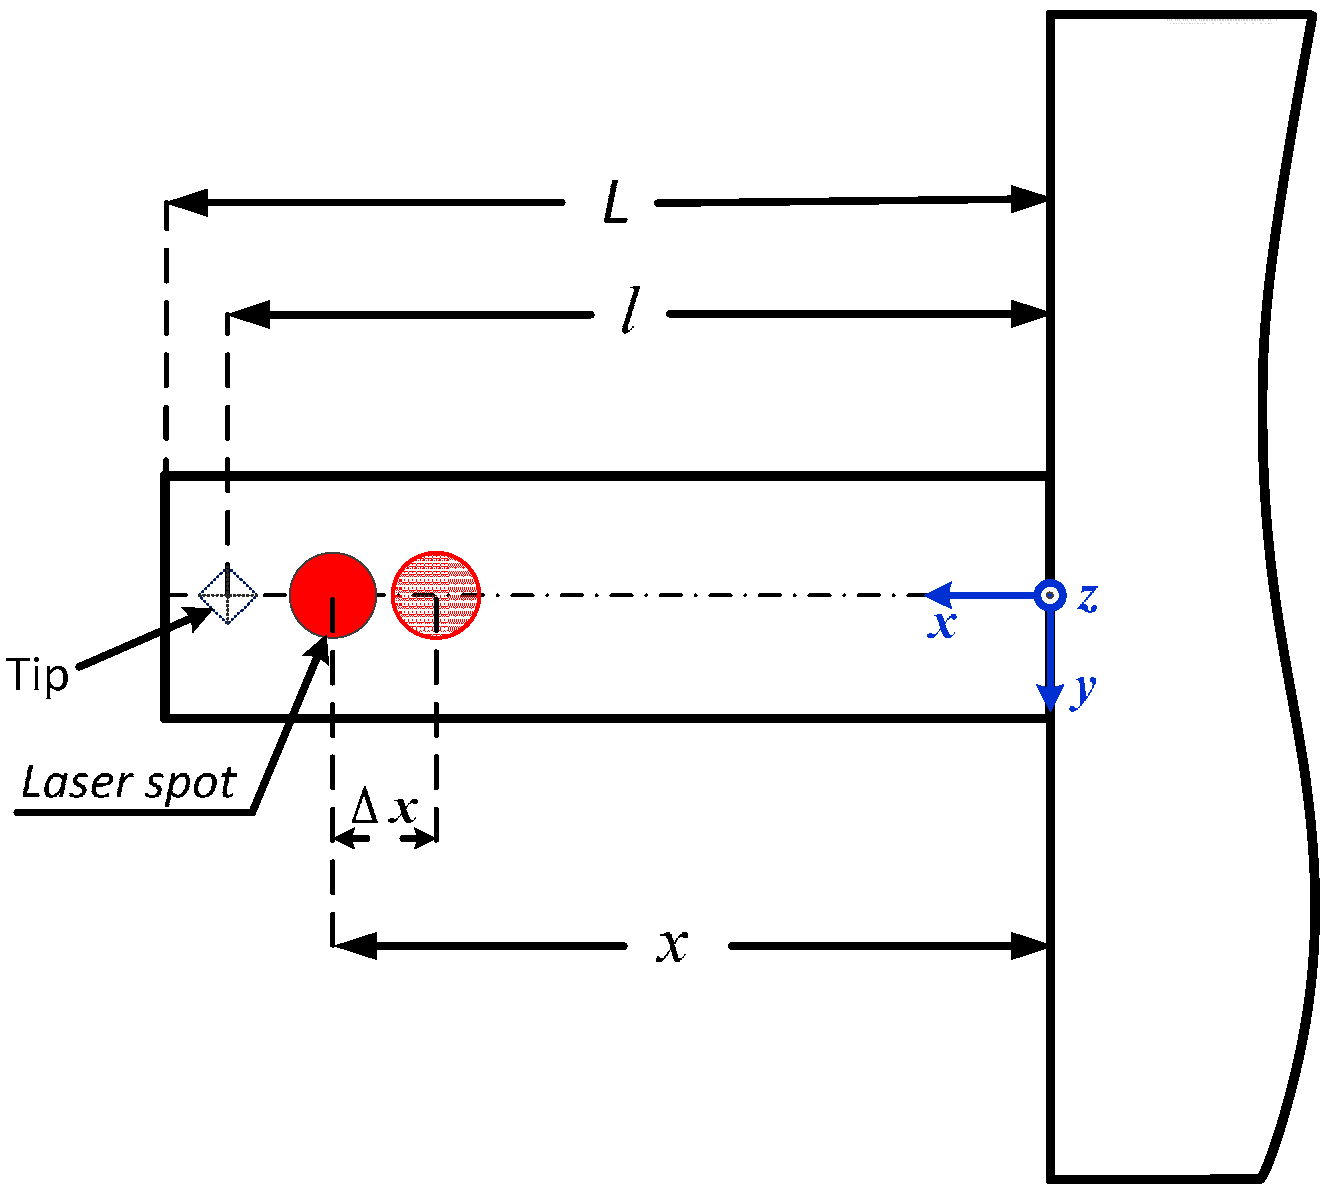
During the calibration, the laser spot should focus on a particular position of the cantilever. Any tiny movement of the focused laser spot will change the reflection angle and the optical lever sensitivity, so the laser spot shift on the cantilever
P is an uncertainty component of the optical lever sensitivity
S.
P is defined as the ratio of the actual sensitivity
S2 to the prior calibrated one
S1,
P =
S2/
S1. As the expectation of
P is
P0 = 1, the relative deviation of
P is expressed in Equation (16). The detailed derivation will be discussed in the
Appendix:
In Equation (16),
x is the distance from the laser spot position to the fixed end of the cantilever;
l is the distance from the tip to the fixed end of the cantilever; Δ
x is the shift of the laser spot in longitudinal direction of the cantilever. Equation (16) decreases monotonically as
x increases from 0 to
l. According to our experimental experiences, the laser spot position ranges from
x = 2
l/3 to
x =
l. If we take the limit position
x = 2
l/3 to Equation (16), the maximum result of the equation could be expressed as:
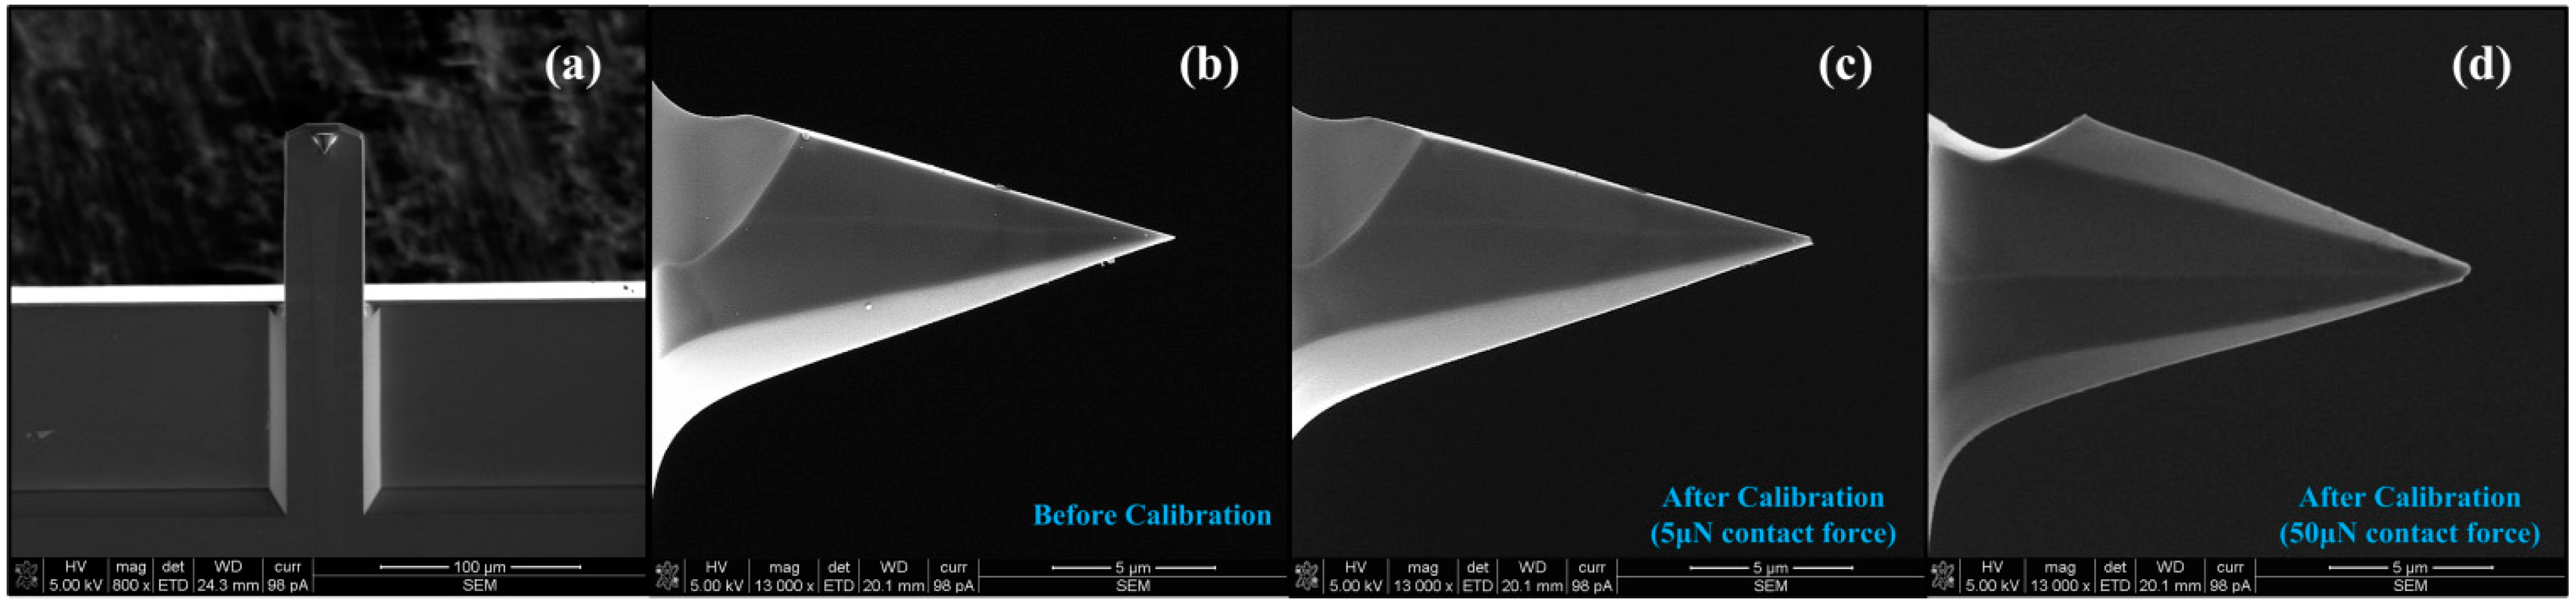
For the rectangular cantilever (NSC15_F#1) discussed in this section,
l was measured from the SEM images. The positioning error Δ
x is smaller than 1 μm in our calibration system. If Δ
x is assumed to be 1 μm, the maximum value of Equation (17) could be:
Based on a uniform distribution, the relative standard uncertainty component caused by laser spot shift on the cantilever was:
The combined relative standard uncertainty of the optical lever sensitivity
S was contributed by the three uncertainty components mentioned above:
The effective DOF of
S can be calculated by:
4.5. Combined Uncertainty, ucrel(k)
With the uncertainty components discussed above, the combined relative standard uncertainty of the calibrated spring constant can be described as:
The calibration result and its standard uncertainty were given by:
The effective DOF of the combined standard uncertainty was:
With the effective DOF, the coverage factor
k99 = 2.895 (confidence probability
p = 99%) was looked up from
t distribution table. So the expanded uncertainty was calculated by:
Summarized in
Table 3 are the uncertainty estimation results of the cantilever NSC15_F#1. We estimated the uncertainty of seven cantilevers calibrated with our method and summarized the estimation results in
Table 4.
Table 3.
Uncertainty estimation results of NSC15_F#1 cantilever.
Table 3.
Uncertainty estimation results of NSC15_F#1 cantilever.
| Inputs | Expectation | Standard Uncertainty | Distribution | Relative Standard Uncertainty | DOF |
|---|
| S | 2144.32 mV·μm−1 | 8.65 mV·nm−1 | Normal | 0.403% | 16.9 |
| U0 | 2144.32 mV | 0.72 mV | Normal | 0.033% | 14 |
| D0 | 1 μm | 0.00153 μm | Normal | 0.153% | 50 |
| P | 1 | ---- | Uniform | 0.373% | 12.5 |
| m | 5.0042 mg | 1.90 μg | Normal | 0.038% | 40.7 |
| Resolution | 0 | 0.03 μg | Uniform | ---- | 50 |
| Reproducibility | 0 | 0.25 μg | Uniform | ---- | 50 |
| Repeated measure | 5.004 mg | 1.88 μg | Normal | ---- | 39 |
| g | 9.8011 m·s−2 | 0.0010 m·s−2 | Uniform | 0.010% | 50 |
| U | 2000 mV | ---- | ---- | ---- | ---- |
| Output (k) | 52.586 N·m−1 | 0.213 N·m−1 | Normal | 0.405% | 17.3 |
Table 4.
Uncertainty sources and the contribution to the combined uncertainty for seven cantilevers.
Table 4.
Uncertainty sources and the contribution to the combined uncertainty for seven cantilevers.
| Uncertainty Source | Uncertainty Component | Relative Standard Uncertainty (%) |
|---|
| NSC11 | CSG01 | NSG01 | MESP | NSC15_F |
|---|
| #1 | #2 | #3 |
|---|
| Added mass | Urel(m) | 0.115 | 2.500 | 0.074 | 0.092 | 0.038 | 0.057 | 0.077 |
| Acceleration of gravity | Urel(g) | 0.010 | 0.010 | 0.010 | 0.010 | 0.010 | 0.010 | 0.010 |
| Optical lever sensitivity | Urel(S) | 0.286 | 0.144 | 0.382 | 0.232 | 0.403 | 0.386 | 0.365 |
| PSD output signal | U1rel(S) | 0.066 | 0.026 | 0.069 | 0.039 | 0.033 | 0.060 | 0.031 |
| Nano stage displacement | U2rel(S) | 0.153 | 0.051 | 0.153 | 0.102 | 0.153 | 0.153 | 0.153 |
| Laser spot position shift | U3rel(S) | 0.235 | 0.133 | 0.343 | 0.205 | 0.373 | 0.349 | 0.330 |
| Combined uncertainty | Ucrel(k) | 0.308 | 2.504 | 0.389 | 0.250 | 0.405 | 0.390 | 0.373 |
The combined relative standard uncertainties of most cantilevers, except CSG01, were better than 1%. The uncertainty of the CSG01 cantilever was mainly a result of the uncertainty component of added mass. It could be greatly reduced by increasing the deflection of the cantilever, which will produce a larger added mass on the balance. However, a larger contact force between the tip and the balance may cause more damage to the silicon tip. In our experiment, the maximum deflection was limited to be within 3 μm. For other cantilevers, the uncertainty of laser spot position shift on the cantilever contributed most to the combined uncertainty, so in this calibration method, we must pay attention to any sources which may shift the laser spot position, and keep it constant during the calibration.


