Microbial Biofilm as a Smart Material

Abstract
: Microbial biofilm colonies will in many cases form a smart material capable of responding to external threats dependent on their size and internal state. The microbial community accordingly switches between passive, protective, or attack modes of action. In order to decide which strategy to employ, it is essential for the biofilm community to be able to sense its own size. The sensor designed to perform this task is termed a quorum sensor, since it only permits collective behaviour once a sufficiently large assembly of microbes have been established. The generic quorum sensor construct involves two genes, one coding for the production of a diffusible signal molecule and one coding for a regulator protein dedicated to sensing the signal molecules. A positive feedback in the signal molecule production sets a well-defined condition for switching into the collective mode. The activation of the regulator involves a slow dimerization, which allows low-pass filtering of the activation of the collective mode. Here, we review and combine the model components that form the basic quorum sensor in a number of Gram-negative bacteria, e.g., Pseudomonas aeruginosa.1. Introduction
Bacteria are remarkable decision makers that are capable of responding to a multitude of environmental challenges through changes in gene expression [1]. Over the past twenty years, it has become increasingly evident that bacterial decision-making often exceeds the classical paradigm of individual, isolated cells [2–4]. Many Gram-negative bacteria form microbial communities denoted as biofilms, which confer tolerance to environmental stress and bactericides [5,6]. In addition to this passive benefit, the biofilm provides the bacteria with optimal conditions to employ a colony-size-dependent mode of gene regulation, which enables coordinated responses on a colony-wide scale. This regulatory system, denoted quorum sensing (QS), guides the bacteria to time the production of factors that are only favorable at high population densities [2,7].
The first observation of this collective sensing was made in the luminescent Vibrio fischeri, which populates the light organs of squids. QS ensures that visible light is only synthesized when a sufficient number of bacteria have amassed to meet the production requirement [2].
QS is also applied by pathogens to mount a successful infection. This is partially achieved by promoting biofilm formation, but also by arresting the production of immune-triggering virulence factors to evade the host defenses in a stealthy fashion until the bacterial colony has reached a size capable of withstanding the host response [8,9]. Furthermore, recent lines of evidence suggest that QS also confers immunomodulatory effects to limit the effectiveness of the host immune system [10].
A classical example is chronic infections by P. aeruginosa in the lungs of cystic fibrosis patients. Here, the interplay between the biofilm and QS regulation confer high drug tolerance and impairment of the immune system, rendering the infections almost impossible to eradicate within traditional treatment regimes [9].
In this paper, we review and combine the model components as we suggest they may look in the basic quorum sensors as observed in a number of Gram-negative bacteria, e.g., P. aeruginosa [11–14]. Our primary goal is to present a modeling perspective on the ingenious designs of the switches that are made possible using no more than two genetic components with a single positive feedback. We shall attempt to use as little mathematics as possible while still retaining the key features of the system.
2. The Reaction-Diffusion Equation
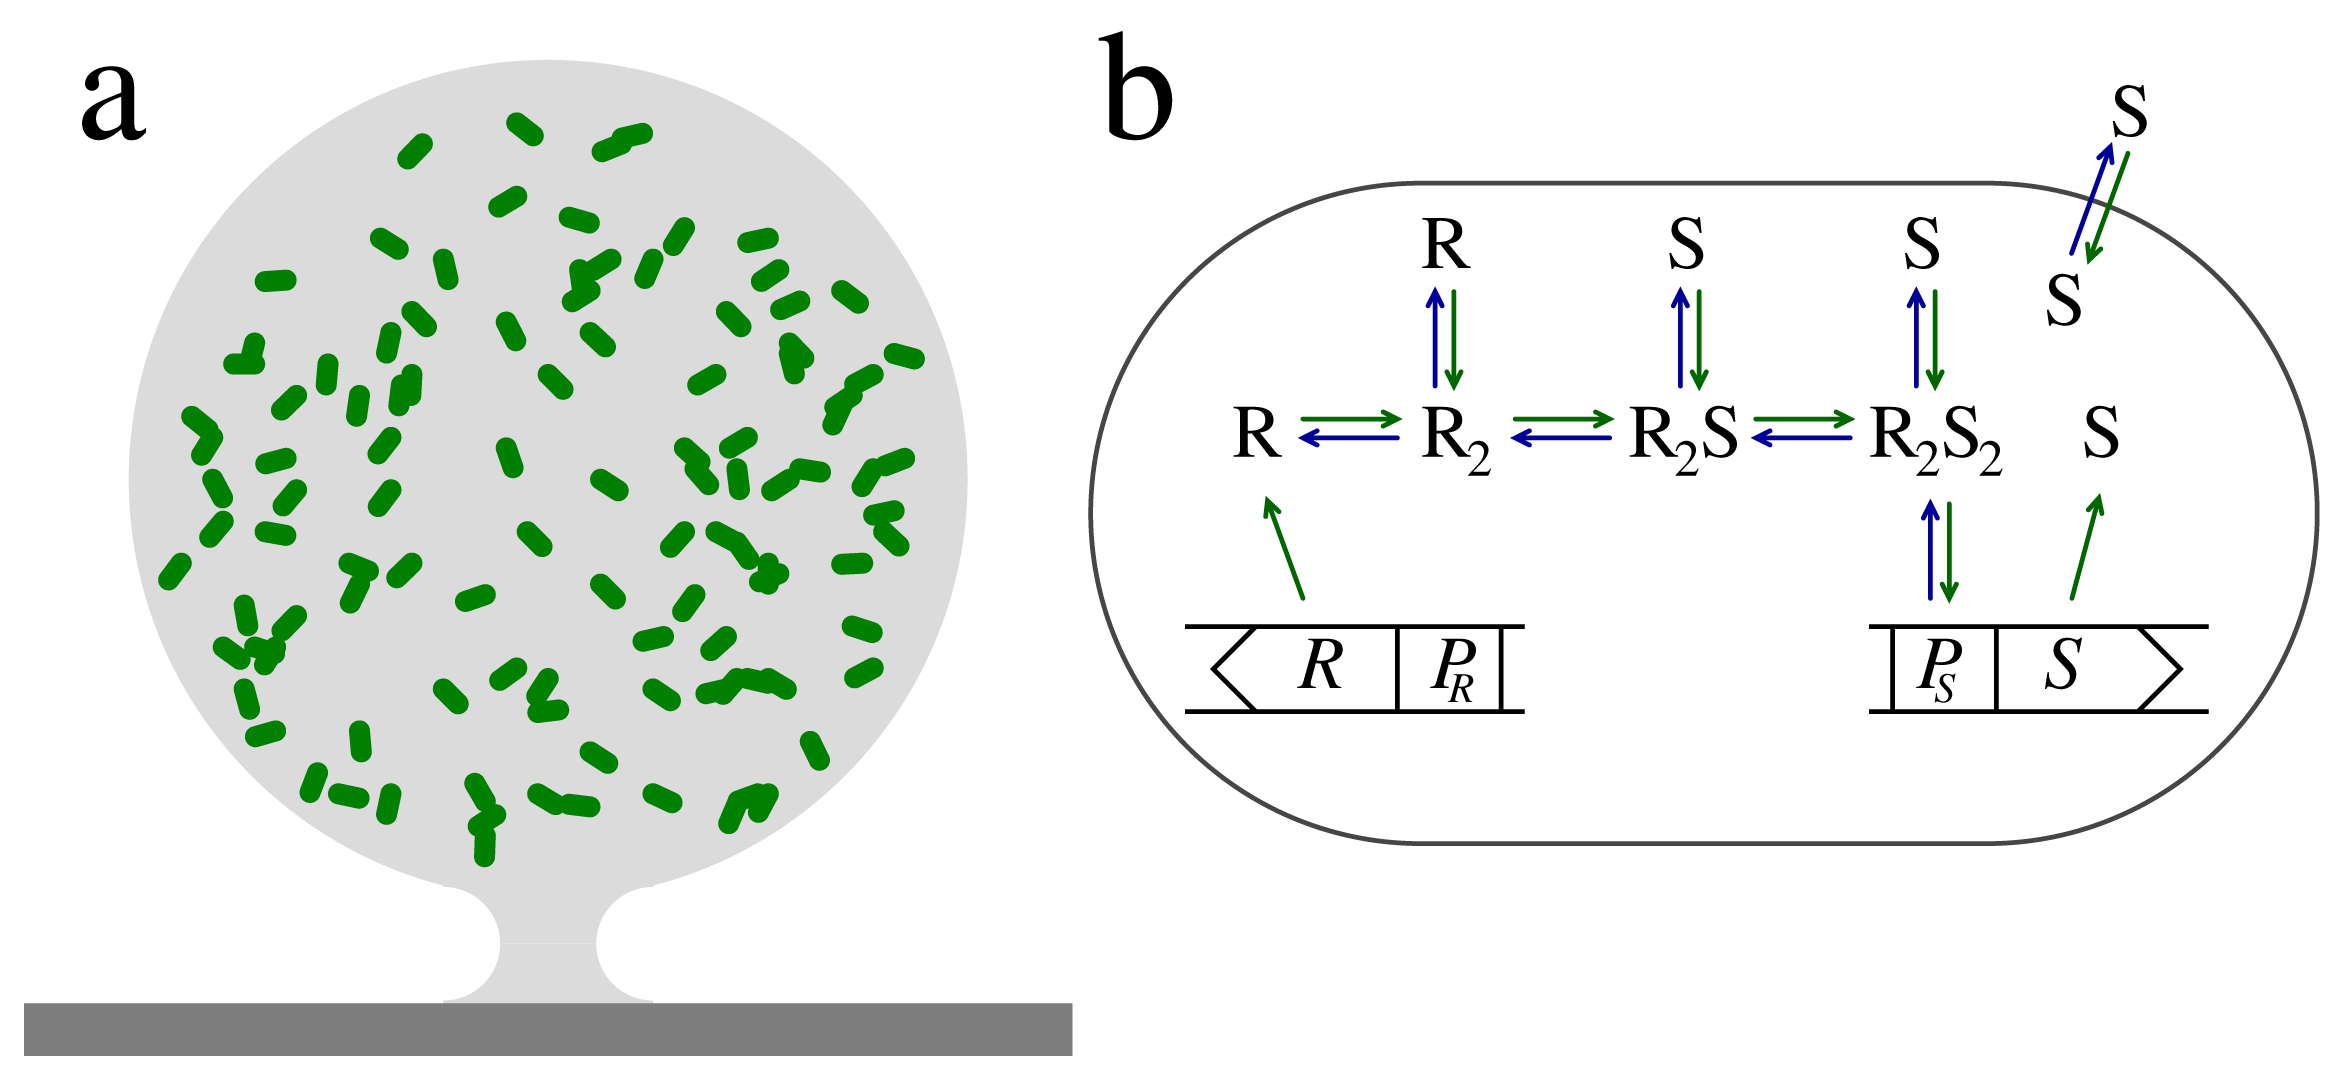
Consider a spherical micro-colony of bacteria in a biofilm matrix of radius
 as shown in Figure 1. The production and diffusion of signal molecules with concentration s = [S] are linked by the diffusion equation:
The first term is the diffusion term, i.e., D is the diffusion constant and Δ is the Laplacian operator. The second term is the production of signal molecules per volume written as the product of the intracellular production, κs, and the volume fraction occupied by cells, ρv. The signal molecules are assumed to diffuse freely through the cell membrane, and the diffusion constant in the biofilm matrix is similar to that in water.
3. Signal Molecule Sensor
A typical way for a cell to sense the presence of a molecular species, S, involves binding to a regulator protein, R, to form an activated RS-complex. In LuxRI homologues, which are frequently found in Gram-negative bacteria, the common motif appears to be that regulators dimerize and subsequently bind signal molecules [7,12,15–19]. Also, the PqsRI quorum sensor in P. aeruginosa produces a regulator that appears to be dimeric in its active form [14].
The concentration of the RS-complex is the intrinsic measure of the quorate level. The RS-complex can subsequently target specific promoter sites on the DNA to produce the desired response. In the quasistatic limit, the concentration of the activated regulator may be expressed as:
We note that, when there is negative feedback from the activated regulator to the regulator production, it can be hard to distinguish the behavior of the dimeric system from a monomer. This could account for the monomeric behavior for the ligand binding reported in Aeromonas hydrophila [13].
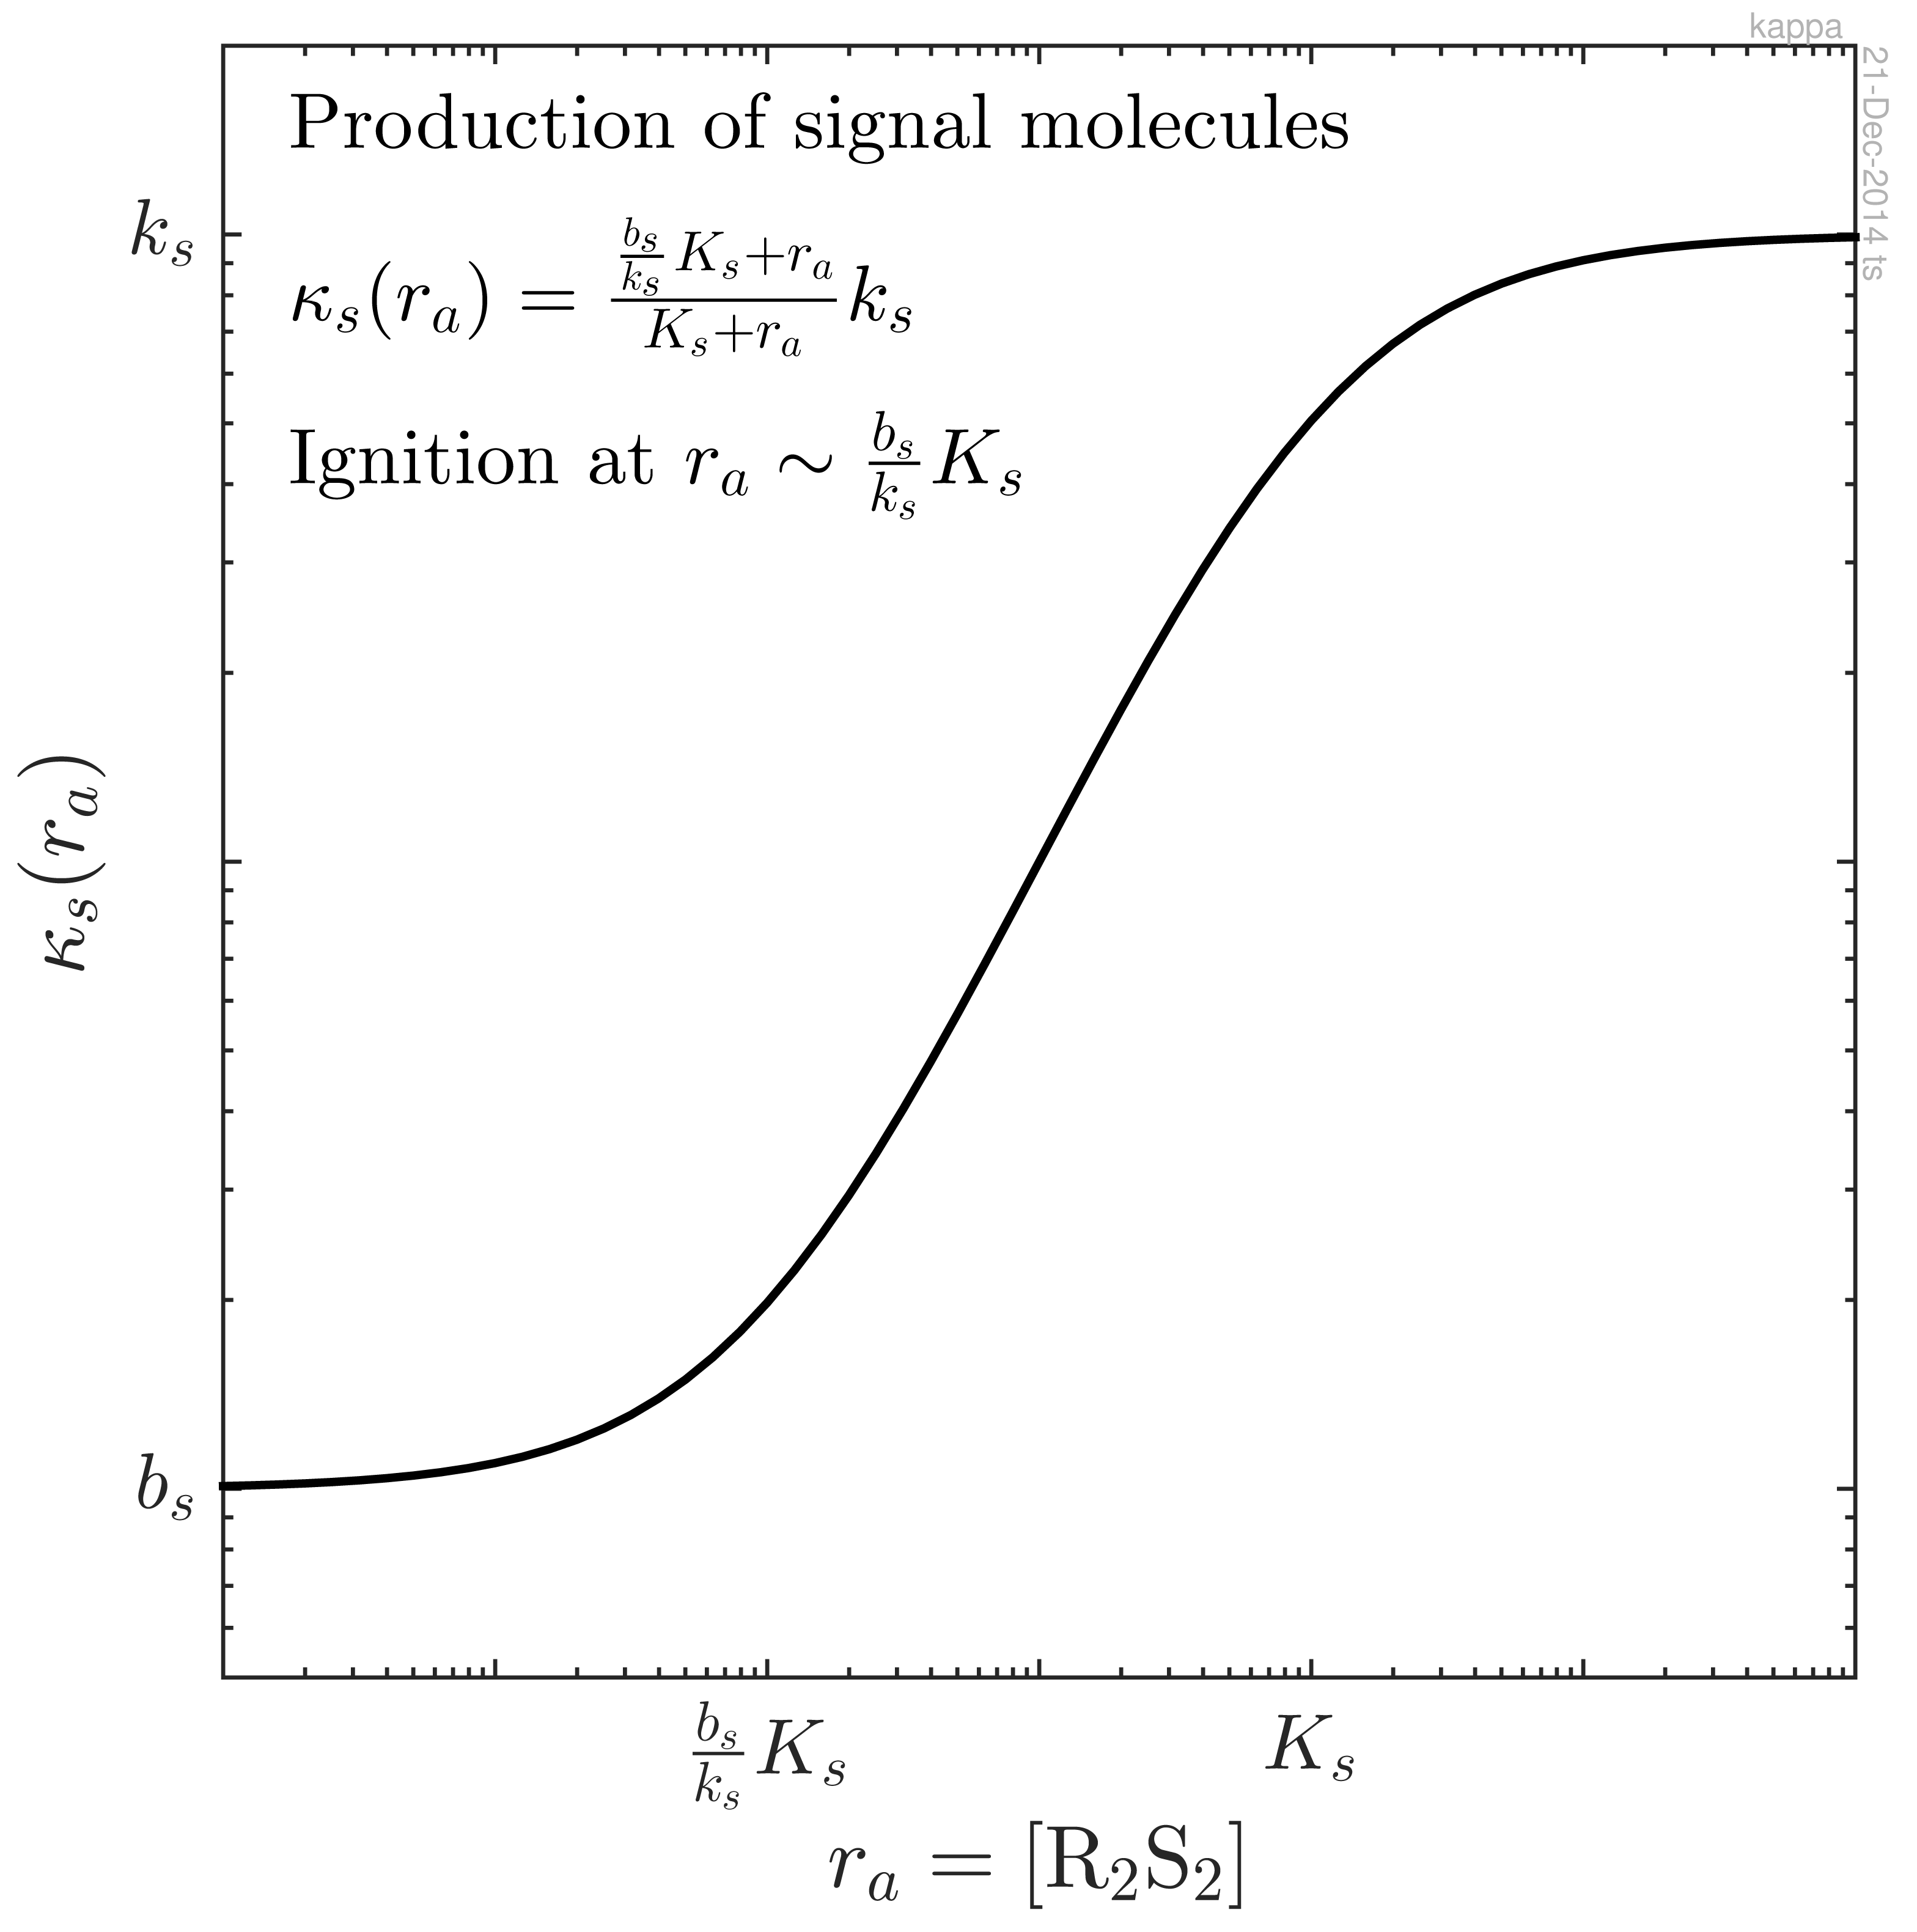
4. Signal Molecule Production and Feedback Ignition Point
At a low concentration of activated regulator, ra = r4 = [R2S2], the production of signal molecules proceeds at a low baseline level, bs. At a higher concentration, the activated regulator is able to bind to the promoter site for the signal molecule with dissociation constant Ks. The signal molecule production may therefore be expressed as:
5. The Size Measure
In the quasistatic limit of the reaction-diffusion equation, a simple dimensional analysis allows us to connect Equations (1), (2) and (4). Since the radius of the colony is the only size appearing in the problem, the Laplacian may be replaced by 1/
2. The signal molecule concentration is eliminated by inverting Equation (2) and inserting into Equation (1). Altogether, we arrive at:
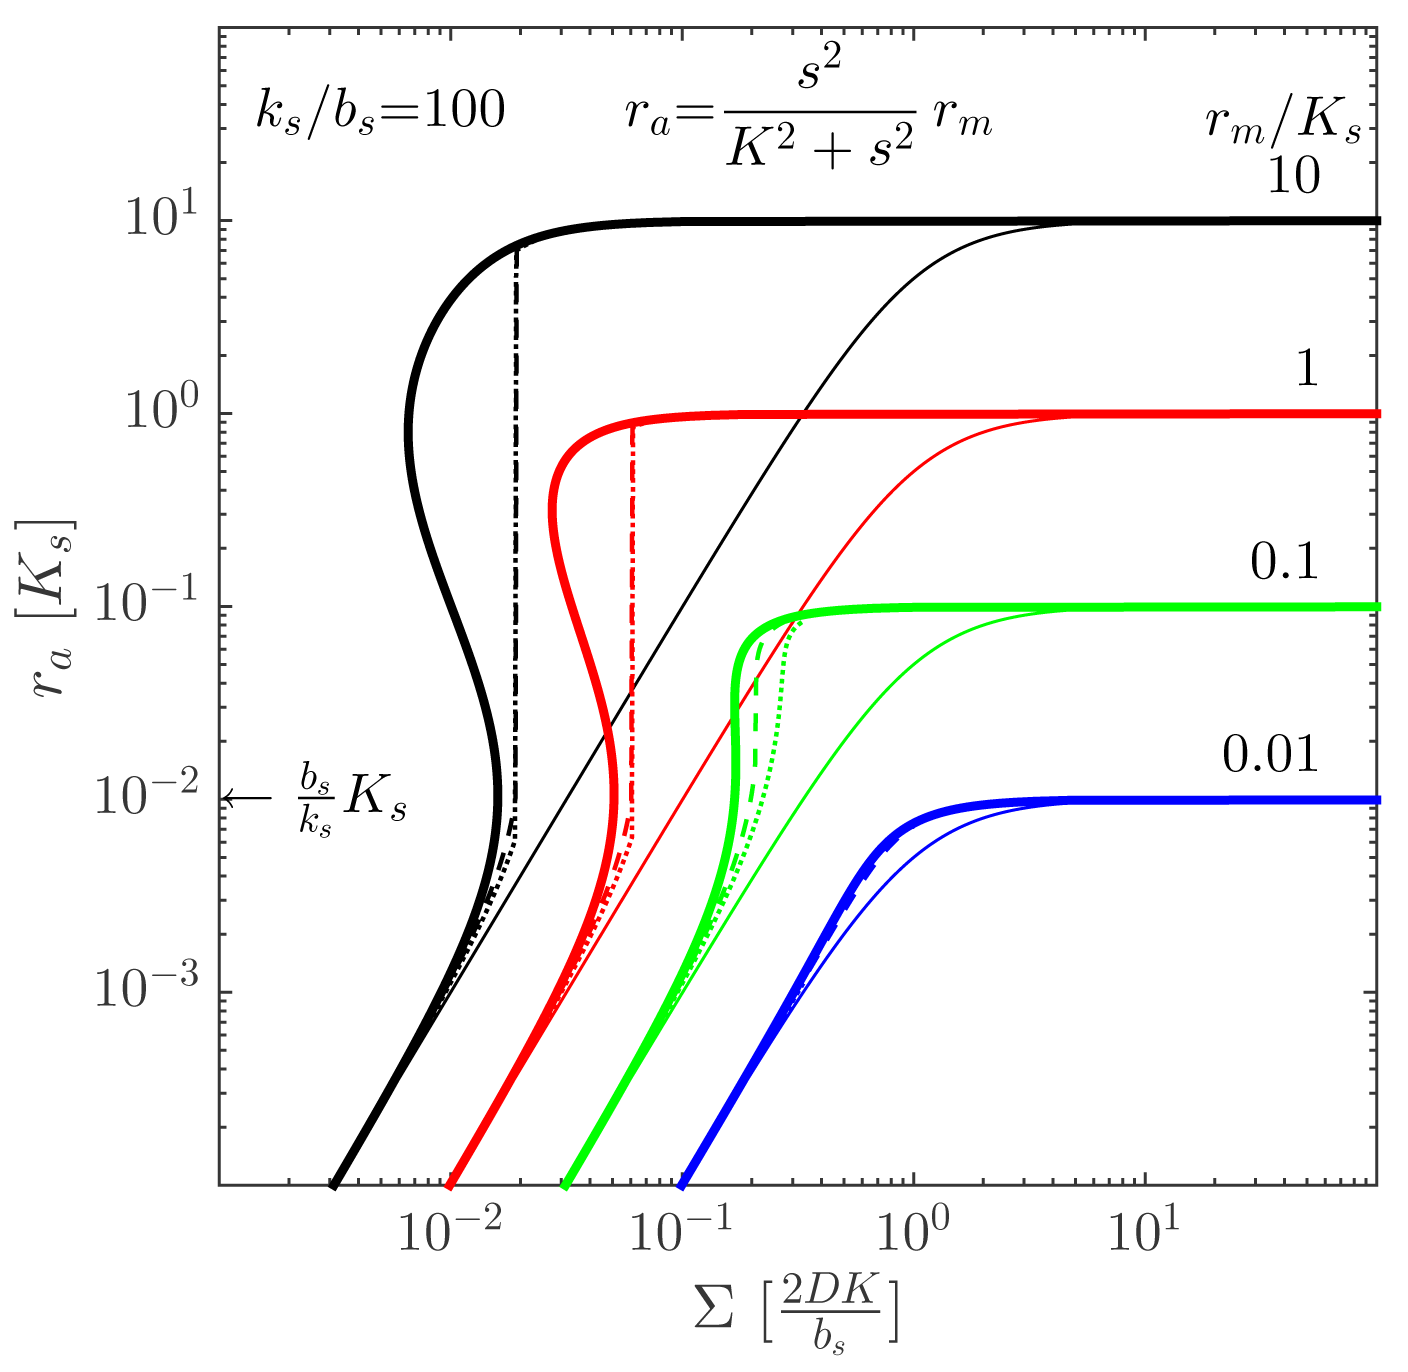
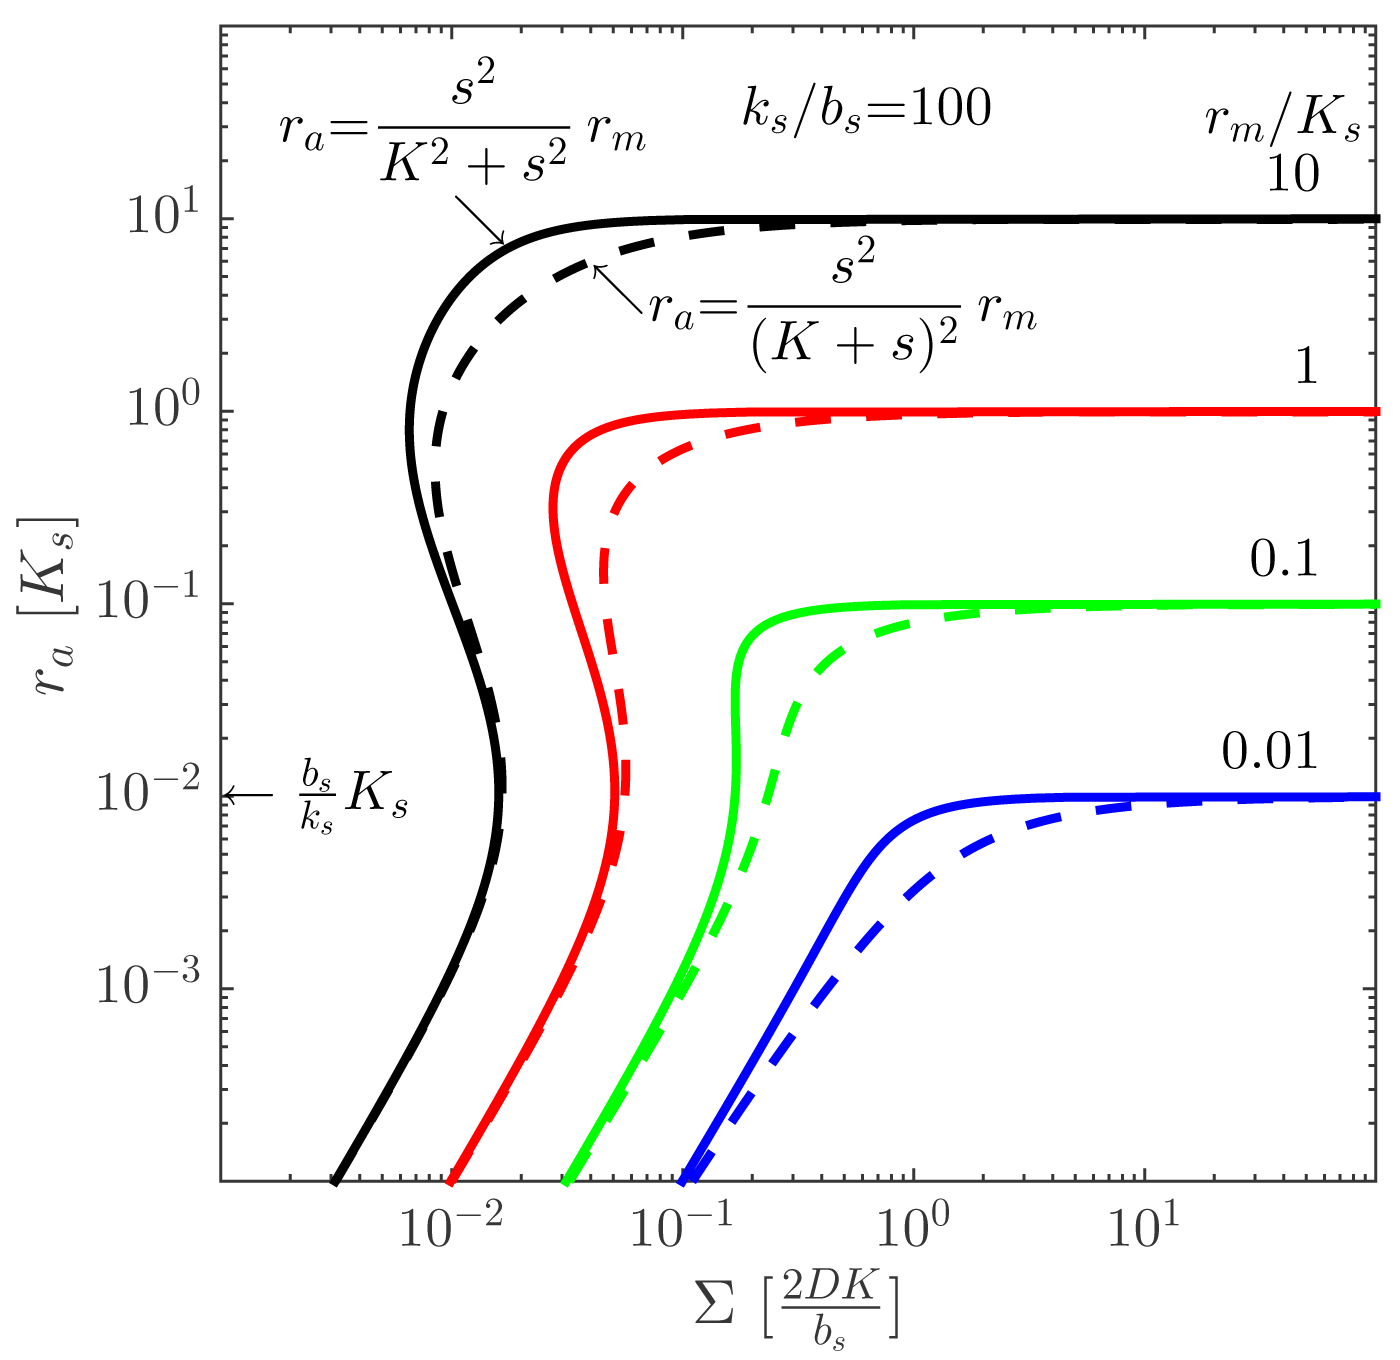
This approximate form allows us to plot the activated regulator concentration, ra = [R2S2], as a function of the proper size, Σ = ρv 2, of the system. The resulting plot is shown in Figure 3 for different values of the maximal regulator concentration, rm = [R2S2]max. As expected, the ignition point is at
. Provided that the maximal regulator concentration is sufficiently large, the quorum sensor produces a well-behaved, robust on/off switch when the size measure, Σ, gets sufficiently large. The size at which the ignition occurs may depend on the internal state of the cells, e.g., growth rate and temperature. The comparison between the switch with cooperative and non-cooperative ligand binding in Figure 4 shows that cooperativity extends the bi-stability region somewhat.
We refer to [11] for a detailed derivation of this result, including the factor “2” for open boundary conditions, which does not come out of the dimensional analysis given here. Other geometries and boundary conditions are elaborated, as well, and a detailed confirmation by numerical integration of the reaction-diffusion Equation (1) is carried out.
6. Signal Modulation in Regulator Production and Activation
The regulator has essentially two forms, the inactive form, where it cannot bind to the promoter for signal molecule production, and the active form, R2S2, which targets the promoter site with the effect of increasing the signal molecule production. As indicated in Figure 1b, the inactive form has sub-forms, the monomer, R, and the inactive regulator dimers, R2 and R2S. Reports indicate that the monomer form in the LuxRI homologues is susceptible to proteolytic degradation, while the dimer forms are resilient [12,15,16,21,22]. The combination of rapid proteolytic degradation of the regulator monomer with slow degradation of the dimeric forms brings two timescales into play and makes it possible for the quorum sensors to form a low-pass filter that may stabilize the switching to the collective mode. We will now take a look into this design as described in [12].
The signal sensor system in Figure 1b consists of an input channel and four regulatory units with concentrations r1 = [R], r2 = [R2], r3 = [R2S] and r4 = [R2S2]. The regulator formation and binding to the ligand is described by the kinetic equations:
The regulator is continuously produced at rate b1Rt normalized to intracellular volume. On-rate constants are superscripted “+”, while off-rates are superscripted “−”. The dilution from cell growth is included in the proteolytic degradation, λi, of each form of the regulator. The combinatorial factor two has been explicitly included, with this normalization K3 = K4 for non-cooperative ligand binding.
In comparison with the overall timescale set by the proteolytic degradation and the growth rate, the association and dissociation given in these equations can be regarded as fast. This results in the approximate quasistatic approximations , 2r2s = K3r3, and r3s = 2K4r4.
The slow timescale can be solved for by regarding the total regulator economy, which is derived by summing Equations (6), (7), (8), and (9):
To simplify, let us assume that all dimer forms are equally resilient to proteolytic degradation, i.e., λ2 = λ3 = λ4 = λd. For this illustrative calculation, let us assume cooperative binding of signal molecules to the dimerized regulator. We then have:
By changing the concentration of signal molecules, we can change the distribution between regulator forms rapidly, while changes in the total concentration of regulator will proceed slowly. This means that if, in the absence of S, we have r1λ1 ≫ 2r2λd, we will get a slow response to a sudden increase in S concentration. This is effectively a low-pass filter. In line with the result for a first order system [13], the low-pass filtering is accompanied by a rescaling of the dissociation constant. The advantage of a low-pass filter in the activation process could be to make the quorum sensing switch robust to noise, even for very low values of the ignition threshold for the quorate state.
On the other hand, if we have r1λ1 ≪ 2r2λd, we will get a fast response to an increase in S concentration. In the latter case, the introduction of signal molecules affects only the distribution between dimer forms, while the overall concentration of the regulator remains unchanged. In this limit, the introduction of signal molecules will not change λ, and we therefore get an all-pass filter and:
The low-pass and all-pass filter designs described here are analogous to the result derived for monomer binding by Garde et al. [13] and Claussen et al. [12]. The all-pass behavior was reported for a synthetic system where the natural promoter for regulator production was replaced by a more potent promoter on a plasmid with a high copy number, thereby suppressing the relative importance of the monomer [12]. However, the demonstration of a fast “degradation” of the activated regulator through the monomer channel provides evidence that the low-pass filtering is important in the LasRI system in P. aeruginosa [12,21]. The low-pass behavior has been reported for an effective first-order system [13]. The details of the filter designs remain a subject of ongoing investigations.
7. Discussion
We have presented a view of a biofilm as a smart material and demonstrated how a size-aware sensor system, capable of producing an on/off switch at a critical system size, can be modeled. The generic quorum sensor consists of only two genetic components, one component coding for the production of a diffusible signal molecule and one component coding for a regulator protein capable of binding the signal molecules. A positive feedback leads to a well-defined ignition point:
The positive feedback loop is effective when the induction factor for the feedback is much larger than the background production, ks ≫ bs. If this is the case and if growth conditions allow efficient binding of the regulator to the promoter site for signal molecule production, rm ≳ Ks, the switch will ignite when the activated regulator concentration reaches the critical value.
The role of the quorum sensor system plays its primary role during micro-colony formation, while most systematic studies of constitutive promoters are conducted on planktonically growing cells [23–27]. There is a outstanding call for systematic studies of promoter activities in the quasi-stationary phase.
Typical biofilm thicknesses range from 13 to 60 μm mean (34 ± 10) μm in Pseudomonas aeruginosa [28]. Thicknesses in flow cells of mixed cultures of Pseudomonas aeruginosa, Pseudomonas fluorescens, Klebsiella pneumoniae, and Stenotrophomonas maltophilia range from (37 ±12) μm with flow to (51 ± 19) μm without flow [29] with corresponding horizontal dimension up to 500 μm. The order of magnitude in the size of biofilm structures is similar in Staphylococcus aureus (30−40 μm thick) [30], Staphylococcus epidermidis (240−590 μm diameter) [5]. It appears that the observed dimensions are in the high end for artificial conditions like implants or flow chambers whereas biofilm aggregates in chronic infections are in the lower end with an upper range limit of ∼200 μm [6].
An estimate of the geometrical size needed to ignite the quorate state may be obtained using the above expressions. At the ignition point, , this results in
As previously mentioned, the geometrical size and density at which the ignition occurs will depend on the internal state of the cells, e.g., growth rate and temperature. The size estimate given above may therefore vary, even within the same microbial strain. The complexity of the response of the biofilm to external conditions is further increased in, e.g., P. aeruginosa, where several quorum sensors are thought to be organized in a hierarchy, where the rhl system acts under the control of the las system [33,34].
8. Conclusions
We have reviewed the key properties of a single-loop quorum sensor with positive feedback and the main properties of the ligand binding. The quorum sensor changes the biofilm from a passive material to an active material capable of responding to external threats in accordance with the quorate state.
A proper measure for the size of the quorum sensing biofilm combines the geometry, cell density, and boundary conditions. When the maximal regulator concentration is sufficiently large to bind to the promoter for signal molecule production and the induction of the signal molecule production is at least an order of magnitude, a functioning quorum sensor with an all-or-none switch results.
- Conflicts of Interest: The authors declare no conflicts of interest.
References
- Janga, S.C.; Collado-Vides, J. Structure and evolution of gene regulatory networks in microbial genomes. Res. Microbiol. 2007, 158, 787–794. [Google Scholar]
- Fuqua, W.C.; Winans, S.C.; Greenberg, E.P. Quorum sensing in bacteria: The LuxR-LuxI family of cell density-responsive transcriptional regulators. J. Bacteriol. 1994, 176, 269–275. [Google Scholar]
- Zhu, J.; Winans, S.C. Autoinducer binding by the quorum-sensing regulator TraR increases affinity for target promoters in vitro and decreases TraR turnover rates in whole cells. Proc. Natl. Acad. Sci. USA 1999, 96, 4832–4837. [Google Scholar]
- Nilsson, P.; Olofsson, A.; Fagerlind, M.; Fagerstrom, T.; Rice, S.; Kjelleberg, S.; Steinberg, P. Kinetics of the AHL Regulatory System in a Model Biofilm System: How Many Bacteria Constitute a Quorum? J. Mol. Biol. 2001, 309, 631–640. [Google Scholar]
- Fux, C.A.; Costerton, J.W.; Stewart, PS.; Stoodley, P. Survival strategies of infectious biofilms. Trends Microbiol. 2005, 13, 34–40. [Google Scholar]
- Bjarnsholt, T.; Alhede, M.; Alhede, M.; Eickhardt-Sørensen, S.; Moser, C.; Kühl, M.; Jensen, P.; Høiby, N. The in vivo biofilm. Trends Microbiol. 2013, 21, 466–474. [Google Scholar]
- Gonzalez, J.E.; Keshavan, N.D. Messing with Bacterial Quorum Sensing. Microbiol. Mol. Biol. Rev. 2006, 70, 859–875. [Google Scholar]
- Bjarnsholt, T.; Ostrup Jensen, P.; Rasmussen, T.B.; Christophersen, L.; Calum, H.; Hentzer, M.; Hougen, H.P.; Rygaard, J.; Moser, C.; Eberl, L.; et al. Pathogens and pathogenicity—Garlic blocks quorum sensing and promotes rapid clearing of pulmonary Pseudomonas aeruginosa infections. Microbiol. Read. 2005, 151, 3873–3880. [Google Scholar]
- Bjarnsholt, T.; Givskov, M. The role of quorum sensing in the pathogenicity of the cunning aggressor Pseudomonas aeruginosa. Anal. Bioana. Chem. 2007, 387, 409–414. [Google Scholar]
- Alhede, M.; Bjarnsholt, T.; Jensen, P.; Phipps, R.; Moser, C.; Christophersen, L.; Christensen, L.; van Gennip, M.; Parsek, M.; Høiby, N.; et al. Pseudomonas aeruginosa recognizes and responds aggressively to the presence of polymorphonuclear leukocytes. Microbiology 2009, 155, 3500–3508. [Google Scholar]
- Ferkinghoff-Borg, J.; Sams, T. Size of quorum sensing communities. Mol. BioSyst. 2014, 10, 103–109. [Google Scholar]
- Claussen, A.; Jakobsen, T.H.; Bjarnsholt, T.; Givskov, M.; Welch, M.; Ferkinghoff-Borg, J.; Sams, T. Kinetic Model for Signal Binding to the Quorum Sensing Regulator LasR. Int. J. Mol. Sci. 2013, 14, 13360–13376. [Google Scholar]
- Garde, C.; Bjarnsholt, T.; Givskov, M.; Jakobsen, T.H.; Hentzer, M.; Claussen, A.; Sneppen, K.; Ferkinghoff-Borg, J.; Sams, T. Quorum Sensing regulation in Aeromonas hydrophila. J. Mol. Biol. 2010, 396, 849–857. [Google Scholar]
- Welch, M.; Gross, J.; Hodgkinson, J.T.; Spring, D.R.; Sams, T. Ligand binding kinetics of the quorum sensing regulator PqsR. Biochemistry 2013, 52, 4433–4438. [Google Scholar]
- Welch, M.; Todd, D.E.; Whitehead, N.A.; McGowan, S.J.; Bycroft, B.W.; Salmond, G.P. N-acyl homoserine lactone binding to the CarR receptor determines quorum-sensing specificity in Erwinia. EMBO J. 2000, 19, 631–641. [Google Scholar]
- Kiratisin, P.; Tucker, K.D.; Passador, L. LasR, a Transcriptional Activator of Pseudomonas aeruginosa Virulence Genes, Functions as a Multimer. J. Bacteriol. 2002, 184, 4912–4919. [Google Scholar]
- Zhang, R.G.; Pappas, T.; Brace, J.L.; Miller, P.C.; Oulmassov, T.; Molyneaux, J.M.; Anderson, J.C.; Bashkin, J.K.; Winans, S.C.; Joachimiak, A. Structure of a bacterial quorum-sensing transcription factor complexed with pheromone and DNA. Nature 2002, 417, 971–974. [Google Scholar]
- Ventre, I.; Ledgham, F.; Prima, V.; Lazdunski, A.; Foglino, M.; Sturgis, J.N. Dimerization of the quorum sensing regulator RhlR: Development of a method using EGFP fluorescence anisotropy. Mol. Microbiol. 2003, 48, 187–198. [Google Scholar]
- Schuster, M.; Urbanowski, M.L.; Greenberg, E.P. Promoter Specificity in Pseudomonas aeruginosa Quorum Sensing Revealed by DNA Binding of Purified LasR. Proc. Natl. Acad. Sci. USA 2004, 101, 15833–15839. [Google Scholar]
- Hill, A.V. The possible effects of the aggregation of the molecules of haemoglobin on its dissociation curves. Proc. Physiol. Soc. 1910, 40, iv–vii. [Google Scholar]
- Sappington, K.J.; Dandekar, A.A.; Oinuma, K.I.; Greenberg, E.P. Reversible Signal Binding by the Pseudomonas aeruginosa Quorum-Sensing Signal Receptor LasR. MBio 2011, 2. [Google Scholar] [CrossRef]
- Pinto, U.M.; Winans, S.C. Dimerization of the quorum-sensing transcription factor TraR enhances resistance to cytoplasmic proteolysis. Mol. Microbiol. 2009, 73, 32–42. [Google Scholar]
- Bremer, H.; Dennis, P.P. Escherichia coli and Salmonella: Cellular and Molecular Biology; Neidhart, F.C., Ed.; ASM Press: Washington, DC, USA, 1996; Chapter 97. [Google Scholar]
- Liang, S.T.; Bipatnath, M.; Xu, Y.C.; Chen, S.L.; Dennis, P.; Ehrenberg, M.; Bremer, H. Activities of constitutive promoters in Escherichia coli. J. Mol. Biol. 1999, 292, 19–37. [Google Scholar]
- Liang, S.T.; Xu, Y.C.; Dennis, P.; Bremer, H. mRNA composition and control of bacterial gene expression. J. Bacteriol. 2000, 182, 3037–3044. [Google Scholar]
- Klumpp, S.; Zhang, Z.; Hwa, T. Growth Rate-Dependent Global Effects on Gene Expression in Bacteria. Cell 2009, 139, 1366–1375. [Google Scholar]
- Scott, M.; Gunderson, C.W.; Mateescu, E.M.; Zhang, Z.; Hwa, T. Interdependence of cell growth and gene expression: Origins and consequences. Science 2010, 330, 1099–1102. [Google Scholar]
- Stewart, P.S.; Peyton, B.M.; Drury, W.J.; Murga, R. Quantitative observations of heterogeneities in Pseudomonas aeruginosa biofilms. Appl. Environ. Microbiol. 1993, 59, 327–329. [Google Scholar]
- Stoodley, P.; Lewandowski, Z.; Boyle, J.D.; Lappin-Scott, H.M. Structural deformation of bacterial biofilms caused by short-term fluctuations in fluid shear: An in situ investigation of biofilm rheology. Biotechnol. Bioeng. 1999, 65, 83–92. [Google Scholar]
- Jefferson, K.K.; Goldmann, D.A.; Pier, G.B. Use of confocal microscopy to analyze the rate of vancomycin penetration through Staphylococcus aureus biofilms. Antimicrob. Agents Chemother. 2005, 49, 2467–2473. [Google Scholar]
- Fagerlind, M.G.; Nilsson, P.; Harlén, M.; Karlsson, S.; Rice, S.A.; Kjelleberg, S. Modeling the effect of acylated homoserine lactone antagonists in Pseudomonas aeruginosa. BioSystems 2005, 80, 201–213. [Google Scholar]
- Andersen, J.B.; Sternberg, C.; Poulsen, L.K.; Bjorn, S.P.; Givskov, M.; Molin, S. New Unstable Variants of Green Fluorescent Protein for Studies of Transient Gene Expression in Bacteria. Appl. Environ. Microbiol. 1998, 64, 2240–2246. [Google Scholar]
- Williams, P.; Stewart, S.; Camara, M.; Winson, M.; Chhabra, S.; Salmond, G.; Bycroft, B. Signal transduction through quorum sensing in Pseudomonas aeruginosa. In Pseudomonas: Molecular Biology and Biotechnology; ASM Press: Washington, DC, USA, 1996; pp. 195–206. [Google Scholar]
- Pesci, E.C.; Pearson, J.P.; Seed, P.C.; Iglewski, B.H. Regulation of las and rhl quorum sensing in Pseudomonas aeruginosa. J. Bacteriol. 1997, 179, 3127–3132. [Google Scholar]
Glossary
| Parameter | Value | |
| on/off rate constants for dimer formation | ||
| , | on/off rate constant for ligand binding | |
| K2 | dimer dissociation constant | |
| K3,K4 | , | ligand-dimer dissociation constants |
| K | dissociation constant for cooperative ligand binding | |
| b1 | ∼1000h−1 | production rate of R [26] |
| bs | background S production | |
| ks | ∼100 bs | maximal S production rate |
| κs | bs < κs < ks | S production |
| λ1 | ∼20h−1 | R monomer degradation, [3] |
| λ2, λ3, λ4 | <1 h−1 | dimer degradation (including growth) [12,21] |
| λd | averaged dimer degradation rate | |
| Rt | [PR], [PS] | intracellular promoter density |
| r1, r2, r3, r4 | [R], [R2], [R2S], [R2S2] | regulator monomer and dimer concentrations |
| r | total regulator concentration | |
| ra | r4, [R2S2] | activated regulator concentration |
| rm | maximal ra | |
| s | [S] | signal molecule concentration |
| t | time | |
| PR | promoter for R synthesis | |
| R | regulator protein | |
| PS | promoter for S synthetase | |
| S | signal molecule/ligand | |
| K | 10 nM−10 μm | R2S2 dissociation constant [13–15,32] |
| Ks | R2S2-PS dissociation constant | |
| D | ∼2 mm2/h | diffusion constant for S (AHLs) |
| ρv | <1 | bacterial density (v/v) |
| Σ | ρv 2 | colony “size” measure |
| | 10−70 μm | radius of colony [5,29] |
 2ρv), and dotted lines are with absorbing boundary (
). Note that the ignition of the collective state always takes place at
, shown on the ordinate. Adapted from [11]—published by The Royal Society of Chemistry.
2ρv), and dotted lines are with absorbing boundary (
). Note that the ignition of the collective state always takes place at
, shown on the ordinate. Adapted from [11]—published by The Royal Society of Chemistry.
2ρv), and dotted lines are with absorbing boundary (
). Note that the ignition of the collective state always takes place at
, shown on the ordinate. Adapted from [11]—published by The Royal Society of Chemistry.
2ρv), and dotted lines are with absorbing boundary (
). Note that the ignition of the collective state always takes place at
, shown on the ordinate. Adapted from [11]—published by The Royal Society of Chemistry.
© 2015 by the authors; licensee MDPI, Basel, Switzerland. This article is an open access article distributed under the terms and conditions of the Creative Commons Attribution license ( http://creativecommons.org/licenses/by/4.0/).
Share and Cite
Garde, C.; Welch, M.; Ferkinghoff-Borg, J.; Sams, T. Microbial Biofilm as a Smart Material. Sensors 2015, 15, 4229-4241. https://doi.org/10.3390/s150204229
Garde C, Welch M, Ferkinghoff-Borg J, Sams T. Microbial Biofilm as a Smart Material. Sensors. 2015; 15(2):4229-4241. https://doi.org/10.3390/s150204229
Chicago/Turabian StyleGarde, Christian, Martin Welch, Jesper Ferkinghoff-Borg, and Thomas Sams. 2015. "Microbial Biofilm as a Smart Material" Sensors 15, no. 2: 4229-4241. https://doi.org/10.3390/s150204229