SnO2 Highly Sensitive CO Gas Sensor Based on Quasi-Molecular-Imprinting Mechanism Design

Abstract
: Response of highly sensitive SnO2 semiconductor carbon monoxide (CO) gas sensors based on target gas CO quasi-molecular-imprinting mechanism design is investigated with gas concentrations varied from 50 to 3000 ppm. SnO2 nanoparticles prepared via hydrothermal method and gas sensor film devices SC (exposed to the target gas CO for 12 h after the suspension coating of SnO2 film to be fully dried, design of quasi-molecular-imprinting mechanism, the experiment group) and SA (exposed to air after the suspension coating of SnO2 film to be fully dried, the comparison group) made from SnO2 nanoparticles are all characterized by XRD, SEM and BET surface area techniques, respectively. The gas response experimental results reveal that the sensor SC demonstrates quicker response and higher sensitivity than the sensor SA does. The results suggest that in addition to the transformation of gas sensor materials, surface area, and porous membrane devices, the Molecular Imprinting Theory is proved to be another way to promote the performance of gas sensors.1. Introduction
As an n-type semiconductor, SnO2 has been extensively applied in gas sensing. SnO2 based nanomaterials have been widely investigated for the detection of various gases, including properties like fast-response speed, high chemical stability and prominent selectivity. A great deal of research has been dedicated to investigating the nanoparticles, nanotubes, nanowires, nanobelts and nanorods of SnO2 in the detection of carbon monoxide, hydrogen, methanol, nitrogen dioxide, and ethanol [1–10]. They attempt to improve the sensors' sensing performance by designing novel nano structures. Other CO gas sensors attempt to fabricate sensors with better performance by adopting methods like doping or using other metal oxide like Indium, since changing the containment of the material may distinctly improve the adsorption/desorption characteristics [11,12]. Accordingly, we choose to leave some marks on the material in advance; in other words, adopt the molecular imprinting method. Gas sensors are mainly applied to detecting toxic gases, flammable gas and medical diagnosis [13,14].
Its operating mechanism can be explained as follows. Oxygen ions absorbed in the surface of SnO2 can form a carrier depletion layer, which leads to a decrease in the electronic conductivity. Once exposed to reducing gas, the active substrate with oxygen adsorbates will react with the gas and enable the electrons injected back into the active material, causing an increase in electronic conductivity. During the procession, what determines the sensing performances is the diffusion of gas throughout the pores of the sensing layer [13].
For the purpose of improving the sensor performance, a large amount of research has focused on controlling SnO2 nanostructure, ignoring device fabrication procedures. As a matter of fact, the method of producing the sensing film can improve the porosity of the material, which will lead to better performance in the gas-sensing behaviors of sensors [15].
Hence, we introduce molecular imprinting technology [16]. Through this technology, the material can be prepared with high selectivity and specificity. Essentially, the gas sensing theory is the process of the absorption of gas on the metal oxide semiconductor surfaces and charge redistribution between the surfaces and the absorbed gas molecules. We here follow the mechanism in the fabrication of gas sensors. Template-shaped cavities are created by molecular imprinting on the surface of the material with a record of the size, structure, and other physicochemical properties of the template molecules to be used in molecular recognition. Molecular imprinting is a technique commonly used for the fabrication of biomimetic polymeric recognition sites or “plastic antibodies/receptors”, which has attracted extensive interest recently. This technique makes exaltation with higher efficiency and selectivity possible, leading to the development of some remarkable features, such as target identification and selectivity, which can be introduced into the design of ultra-sensitive gas sensors [17–21]. Molecular imprinting technique has been widely used in biosensing [22], producing specific separation materials [23] and making selective binding site for specific chemicals [24]. According to the above, we suggest that the similar mechanism, the quasi-molecule-imprinting method, can be used in fabrication of CO gas sensors. When CO comes into contact with the surface of the material, the CO cluster creates a “hole”, which records the “shape” of the CO cluster. Thereby, next time CO is in contact with the material, the sensors demonstrate better adsorption/desorption performance.
Thus, based on the molecular imprinting technique mechanism, we designed highly sensitive SnO2-based carbon monoxide gas sensors. CO molecules were introduced to the device fabrication process to acquire a certain structure which is more suitable for the adsorption and desorption of CO gas. We simply borrow this mechanism and conducted our research based on the simplest scenarios. We tried our best to exclude interference such as the thickness of the film, the temperature, the humidity, etc. (which is not our focus in the research). Furthermore, our target is to examine whether molecular imprinting can independently improve the sensing performance of CO gas sensors.
To make our narrative clearer, first, we use the hydrothermal method to prepare SnO2 mesoporous nanomaterial. Then, the prepared SnO2 film sensors were divided into two groups, which were named SA and SC, respectively. Sensors in SC were dried in a carbon monoxide (which is the target gas) atmosphere to imprint CO on the surface of the material, and sensors in SA were dried in the air to make a comparison group. During the gas response test, two types of SnO2 sensors are exposed to CO gas with various concentrations ranging from 50 to 3000 ppm. The results show that the sensor SC exhibits a quicker response/recovery speed and higher response compared with SA in all CO concentrations. In addition, a quicker response/recovery speed of SC compared with SA is more obvious at low CO concentration, while a higher sensitivity of SC compared with SA is more evident at high CO concentration. It demonstrates that adopting the molecular imprinting technique in the gas film device fabrication process can enhance gas sensor performance remarkably, in addition to gas sensor materials, surface area and porous structures of the device film.
2. Experimental Section
2.1. Synthesis of SnO2 Nanomaterials
All the reagents in this work were analytically pure and used without any further purification. SnO2 mesoporous nanomaterials were synthesized by hydrothermal method [13].
In a typical synthesis, 1 g of tin (II) chloride (SnCl2·2H2O) was dissolved in 70 mL of distilled water with continuous magnetic stirring in a glass beaker (100 mL). Then, 0.5 mL of hydrochloric acid (38%) was dropped into the white suspension above with sufficient stirring at room temperature about 2 h until the solution became clear.
After that, the mixture solution was transferred into Teflon-lined stainless steel autoclaves, which was later sealed tightly, heated and maintained at 90 °C for 20 h. After the hydrothermal reaction, the mixture turned yellow and the mixture was centrifugated to attain the yellow precipitates. The yellow precipitate should be washed with distilled water for several times, and finally dried in air at 60 °C. The yellow precursors were calcinated at 350 °C in air for 2 h. Finally, the light yellow mesoporous SnO2 nanoparticles were obtained.
2.2. Device Fabrication
Gas sensors were fabricated as follows: The as-prepared powder was mixed with water to form a paste. Then the paste was coated onto a ceramic tube (axial length 4 mm and basal diameter 1.5 mm) to form a thick film. The thickness of the sensing film was about 100 μm. The ceramic tube was equipped with two pairs of Au electrodes and a Ni–Cr heater through the tube to control the experimental temperature. Then we divided the sensor into two groups. One was dried in CO gas condition (sensor sample SC) at room temperature for 12 h. The other was dried in air (sensor sample SA) to make a comparison group. Table 1 lists the average pore size and the Brunauer-Emmett-Teller (BET) surface area of two samples, respectively.
2.3. Characterization
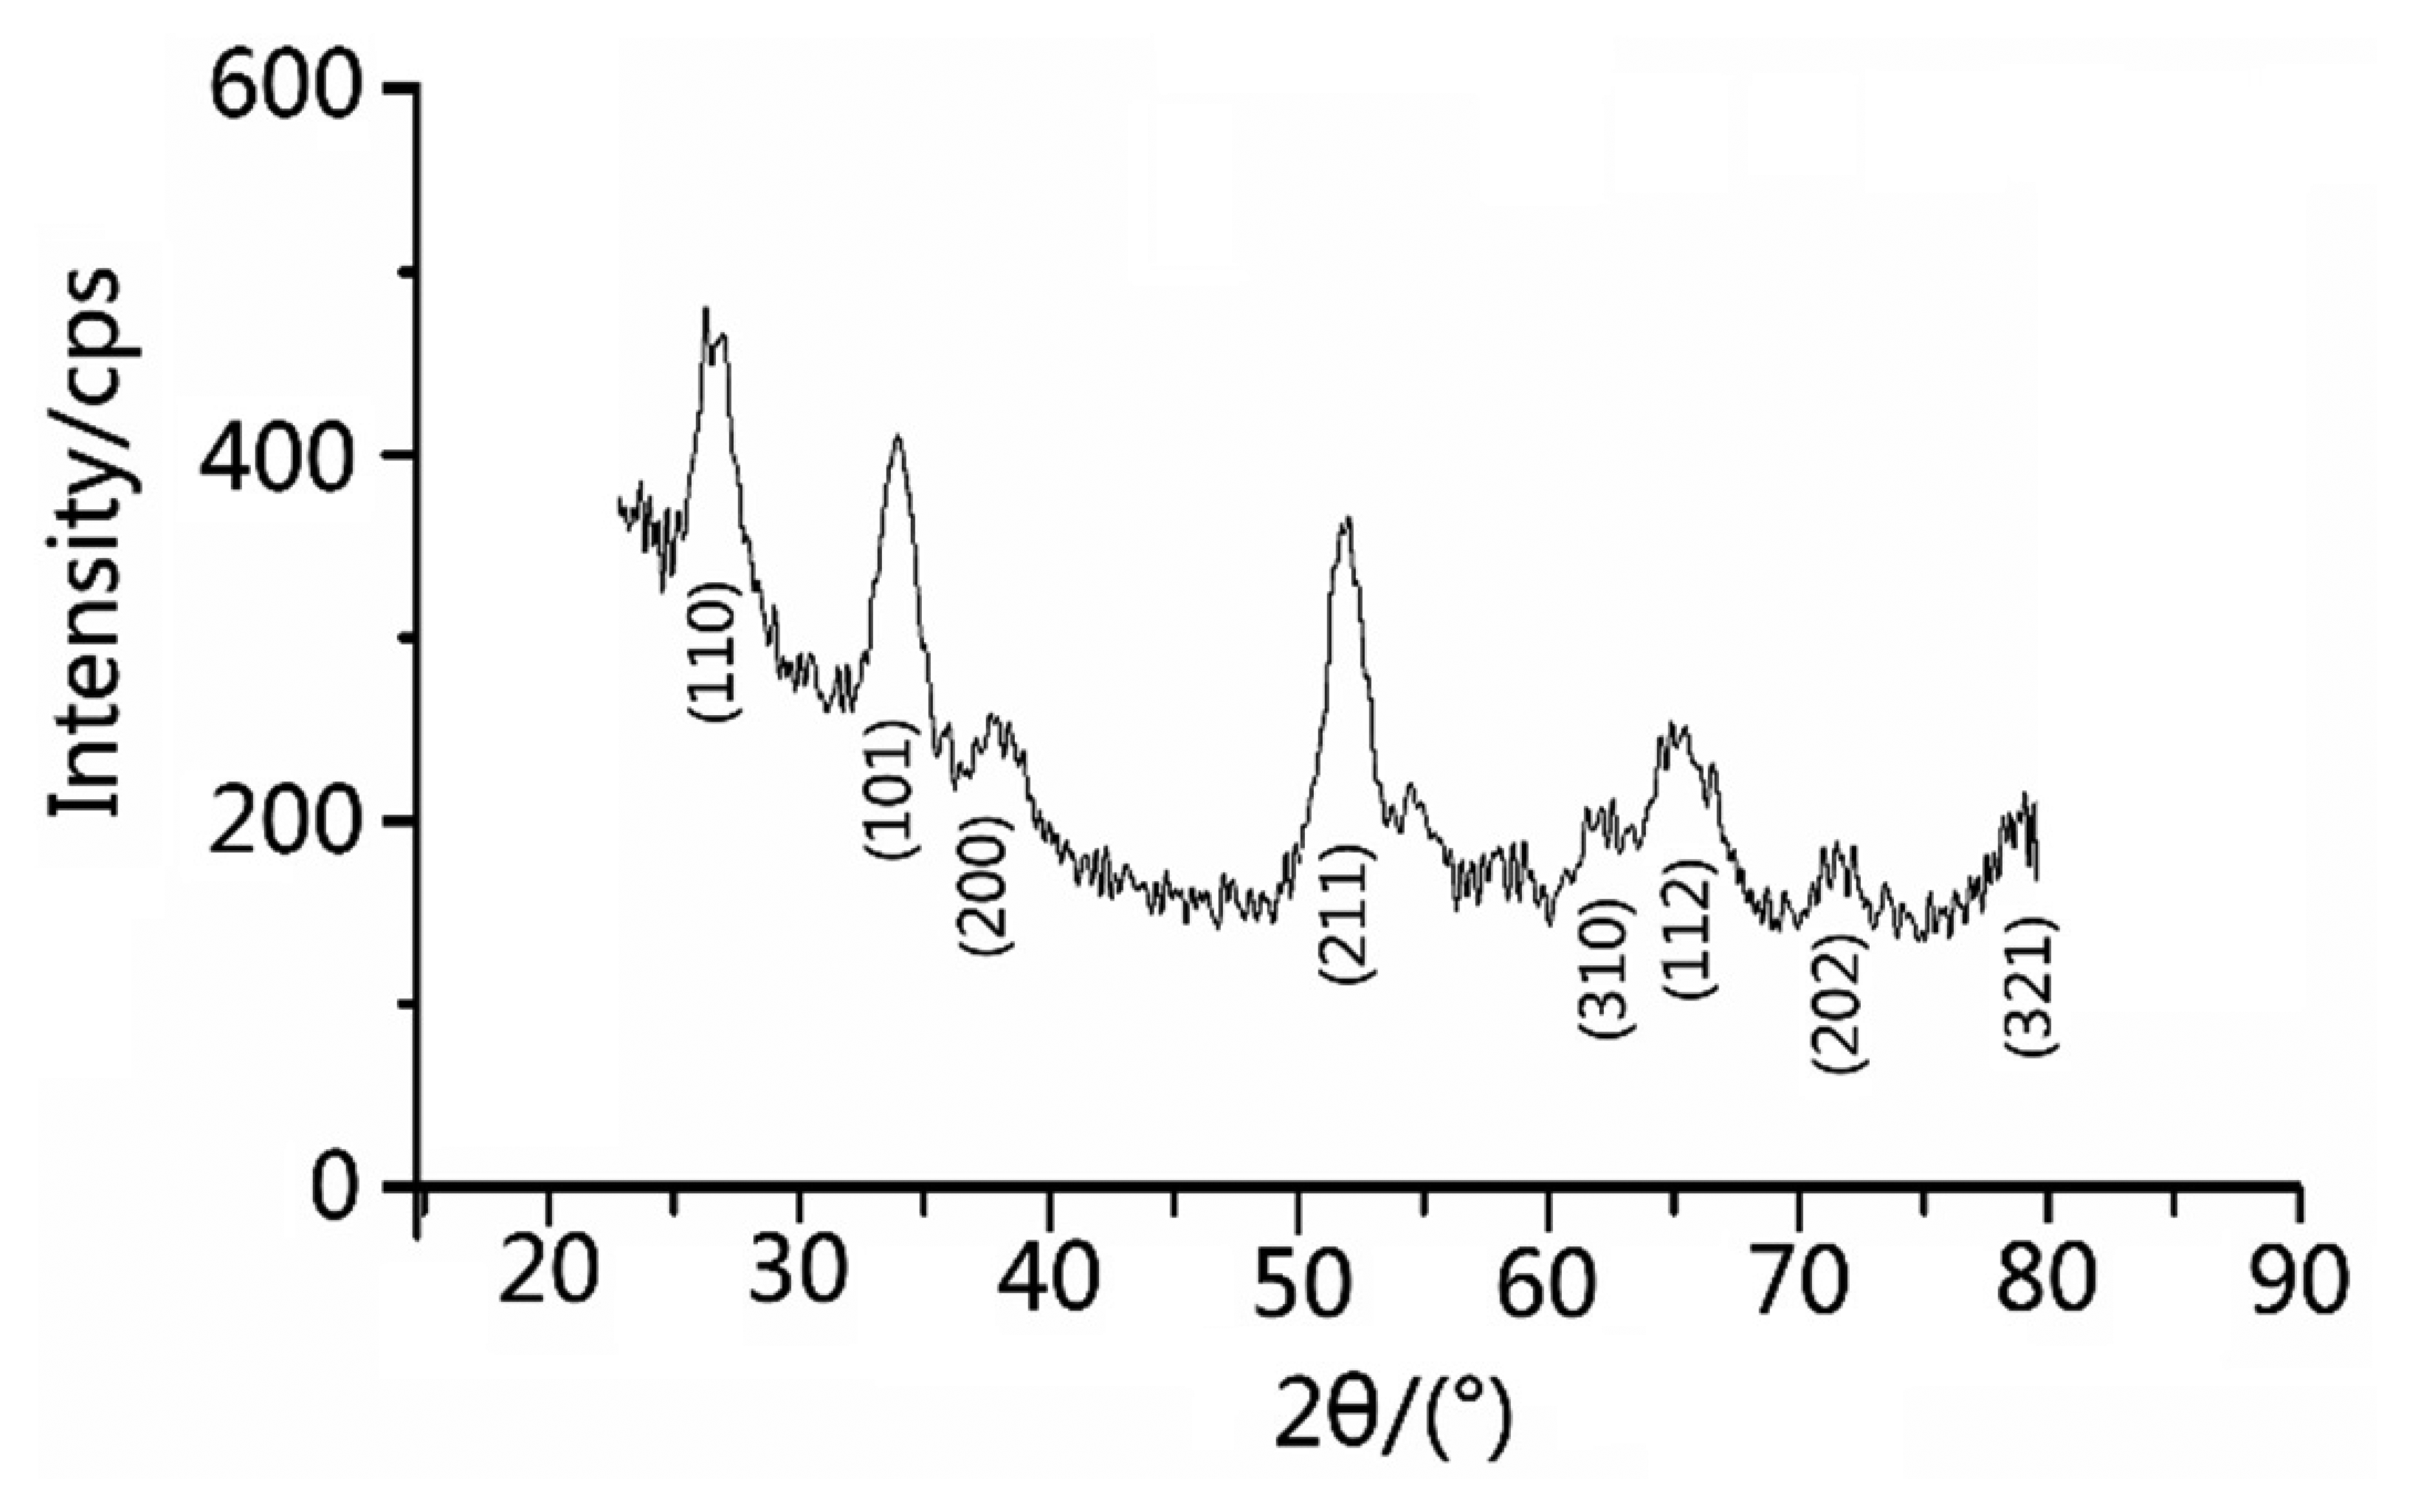
The products were characterized by scanning electron microscopy (SEM, JSM-6700F, JEOL Ltd., Akishima Musashino, Japan; 5 kV). X-ray power diffraction (XRD, Brucker D-8 Avance, BRUKER AXS GmbH, Karlsruhe, Germany, Cu Ka, λ = 1.5418 Å) analysis was conducted to characterize the products in the range of 20°–80°. The porous structure had been further confirmed by the Nitrogen adsorption–desorption analysis (Belsorp Mini, Ankersmid Ltd., Nijverdal, Netherlands). Figure 1 shows the X-ray diffraction (XRD) experiment map of the material. In the XRD pattern, we could barely see any characteristic peaks of any impurities. The fluctuation were possibly caused by noise in the instruments or minor impurities which could be ignored. Such a pattern shows that the SnCl2 have deformed to SnO2 nanoparticles.
Figure 2 shows the schematic diagram of the gas sensing instrument. A static process was used to test the properties of sensors in a 10 L chamber. The test atmosphere was prepared by injecting a given amount of saturated CO gas into the 10 L chamber, where an air pump was fixed to homogenize the CO gas in the chamber. Sensors were inserted onto a detecting stick which could be expediently inserted into the test chamber for the measurement of sensing performance. The gas sensing properties were detected by a computer-controlled Navigation 4000-NMDOG gas-sensing measurement system (Zhongke Micro-Nano Technology Co., Ltd., Beijing, China), and the resistance of the gas sensor in clean air (Ra) together with target gas (Rg) could be monitored in real time respectively. The gas response of the sensor was defined as Ra/Rg for reducing gas. After each test, the chamber was flushed with clean air for 20 min to reset the testing atmosphere.
3. Result and Discussion
3.1. Structure Analysis
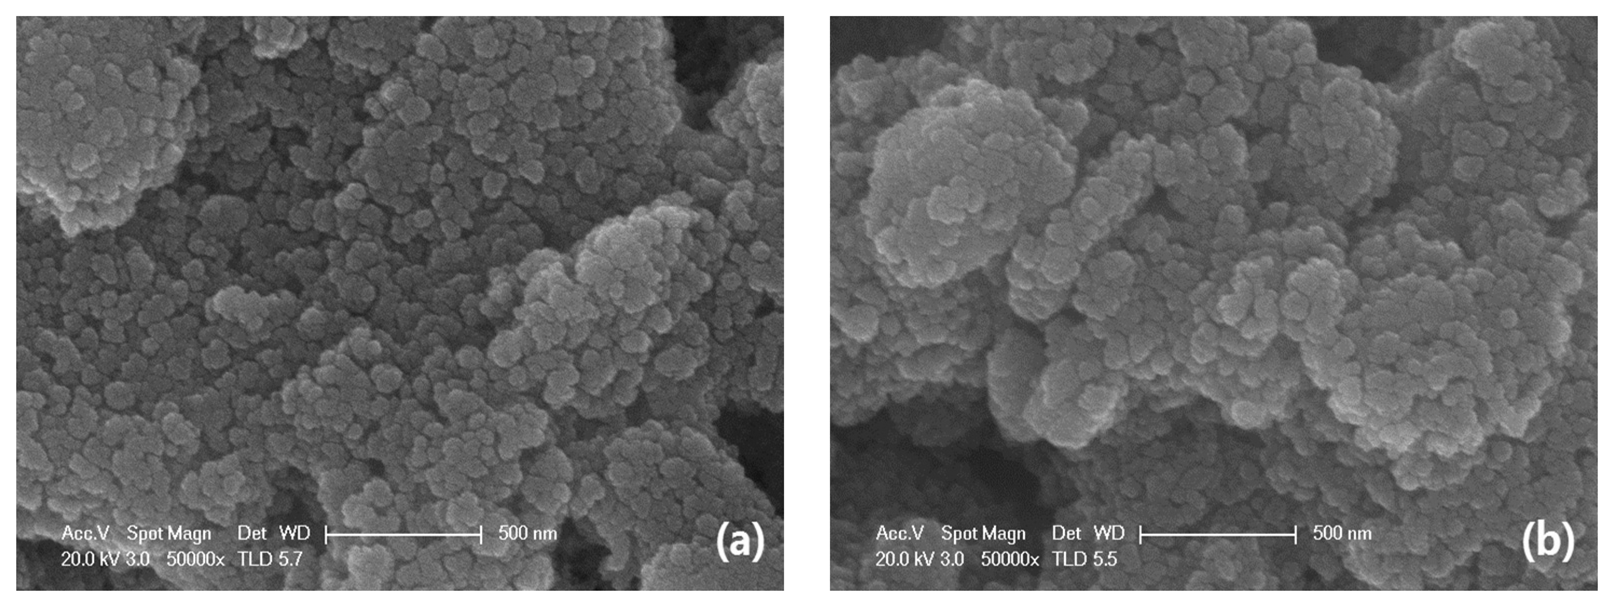
First, we examined the purity of SnO2 nanomaterial. Figure 2 shows the XRD pattern of as-prepared SnO2 nanomaterial. According to the JCPDS file No. 41-1445, the distinguishable characteristic peaks on the map well corresponded to the characteristic peaks of SnO2 in the file and there were no characteristic peaks of any other impurities. The broad and low diffraction peaks exhibited the small crystallite size of as-prepared samples and films [25]. Figure 3 reveals the uniform particle size of SnO2 nanomaterial films that were dried in air and CO, respectively. In fact, the pictures taken by scanning electron microscope (SEM) do not show obvious differences between the samples (SA and SC). While this is exactly the special feature of the molecular imprinting mechanism, which means that the differences in the micro-structures of SA and SC may actually lie within a molecular or atomic scale.
Then, the adsorption-desorption isotherm research is casted in order to have a better understanding of the properties of pores and calculate specific surface area and pore size distribution. According to the IUPAC recommendations [26], the experimental gas adsorption-desorption isotherms are normally categorized into six categories. Additionally, the adsorption-desorption hysteresis loop is divided into four types. In our research, N2 adsorption-desorption analysis confirmed distinctively the porosities of nanoparticles. In Figure 4a,b, SnO2 nanomaterial film device SA and Sc have the adsorption-desorption isotherm shape of IV with the hysteresis loop type of H1. It is usually attributed to the thermodynamic or/and network effects. The type H1 is often reported for materials that consisted of compacts of approximately spherical particles arranged in a fairly uniform way [26,27]. Additionally, the H1 hysteresis loop accounts for materials with cylindrical pore geometry and a high degree of pore size uniformity and indicates that the facile pores are in a 3D intersection network [28]. Moreover, Table 1 shows that the average pore sizes are 5.5383 and 5.5696 nm for sample SA and SC, respectively. The BET (Barrett-Joyner-Halenda) surface area of SC (79.636 m2 g−1) is slightly larger than that of SA (80.786 m2 g−1). All the differences above, the hysteresis loops, the pose size distributions and surface areas of SA and SC, indicate that CO had indeed affected the film device nanostructures. By consequence, these results may enhance the performance of sensors dried in the target gas CO. We call it a SnO2 highly sensitive CO gas sensor based on a molecular imprinting mechanism design. To our knowledge, the design concept of our semiconductor resistant CO gas sensor is reported for the first time.
3.2. Gas-Sensing Properties
In our research, we consider sensitivity and response/recovery time as the two most important factors of sensors' responding performance.
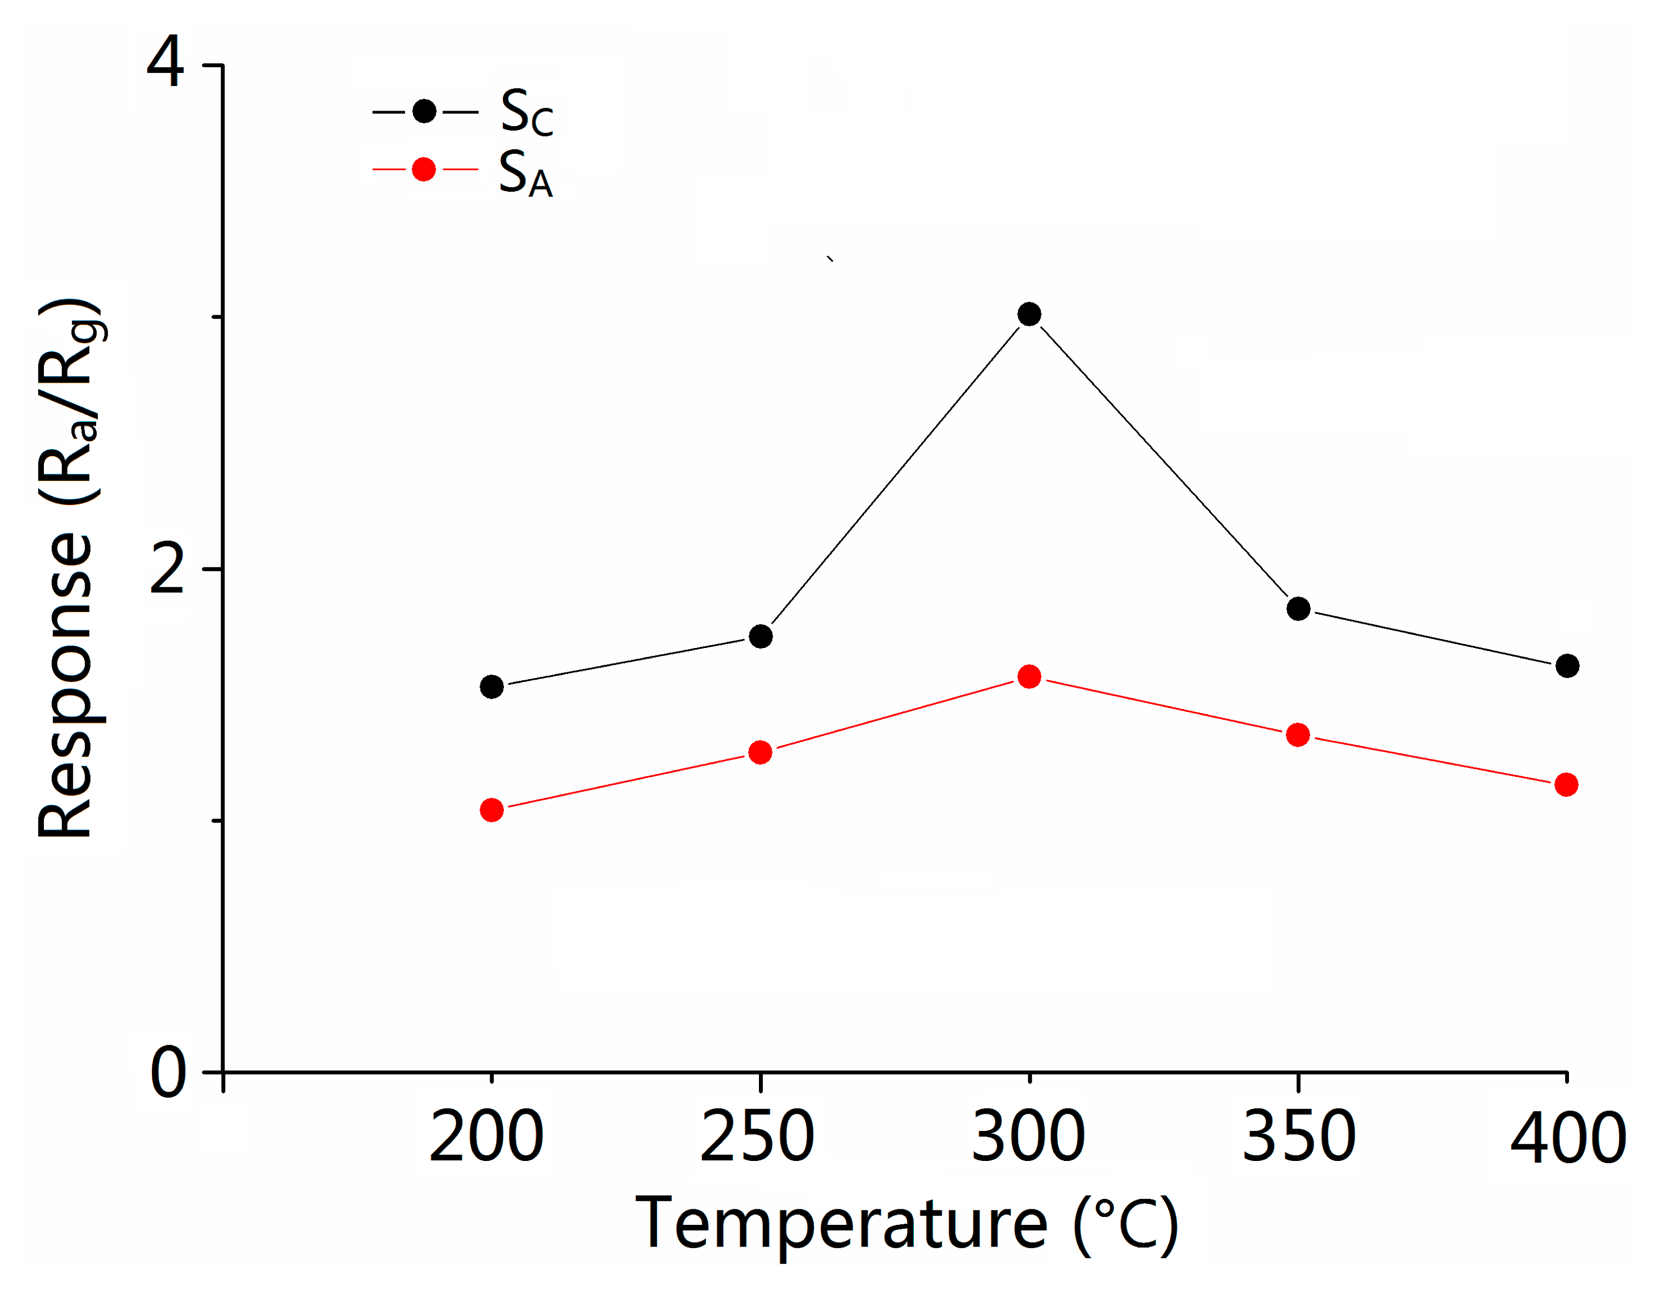
The operating temperature is an important parameter for the semiconductor oxide sensors [29,30]. In order to determine the optimum operating temperature, the temperature-dependent response measurements with 500 ppm CO gas of different sensors were performed at temperatures ranging from 200 °C to 400 °C. Obviously in Figure 5, at 300 °C, the gas sensors show the best response performance. Thus, 300 °C was chosen as the optimal operating temperature for SnO2 based CO gas sensing studies.
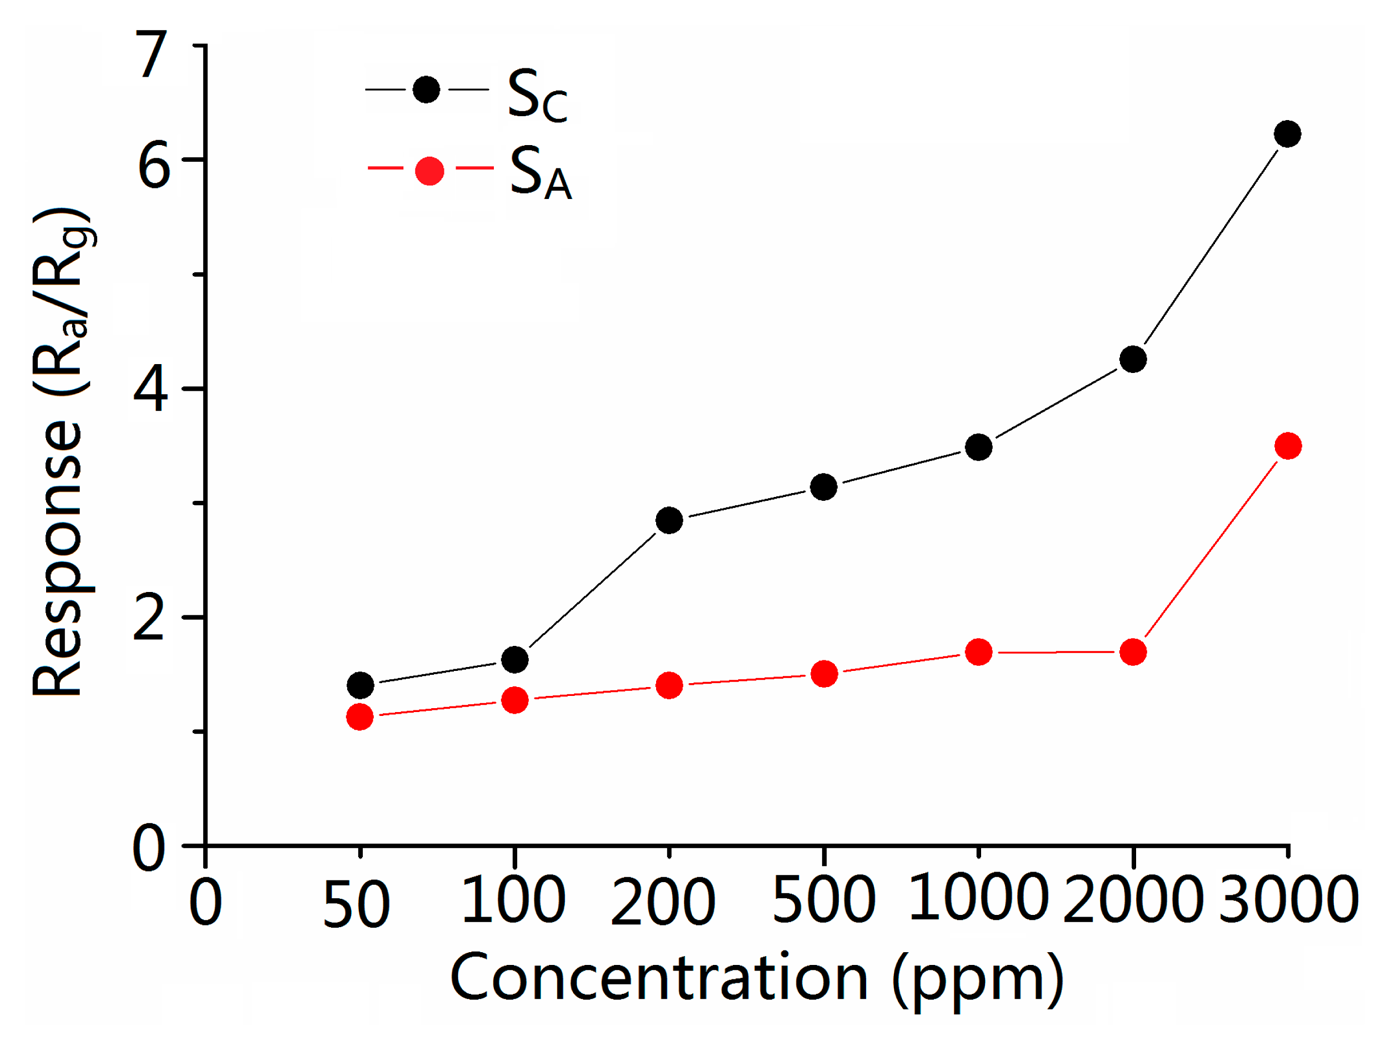
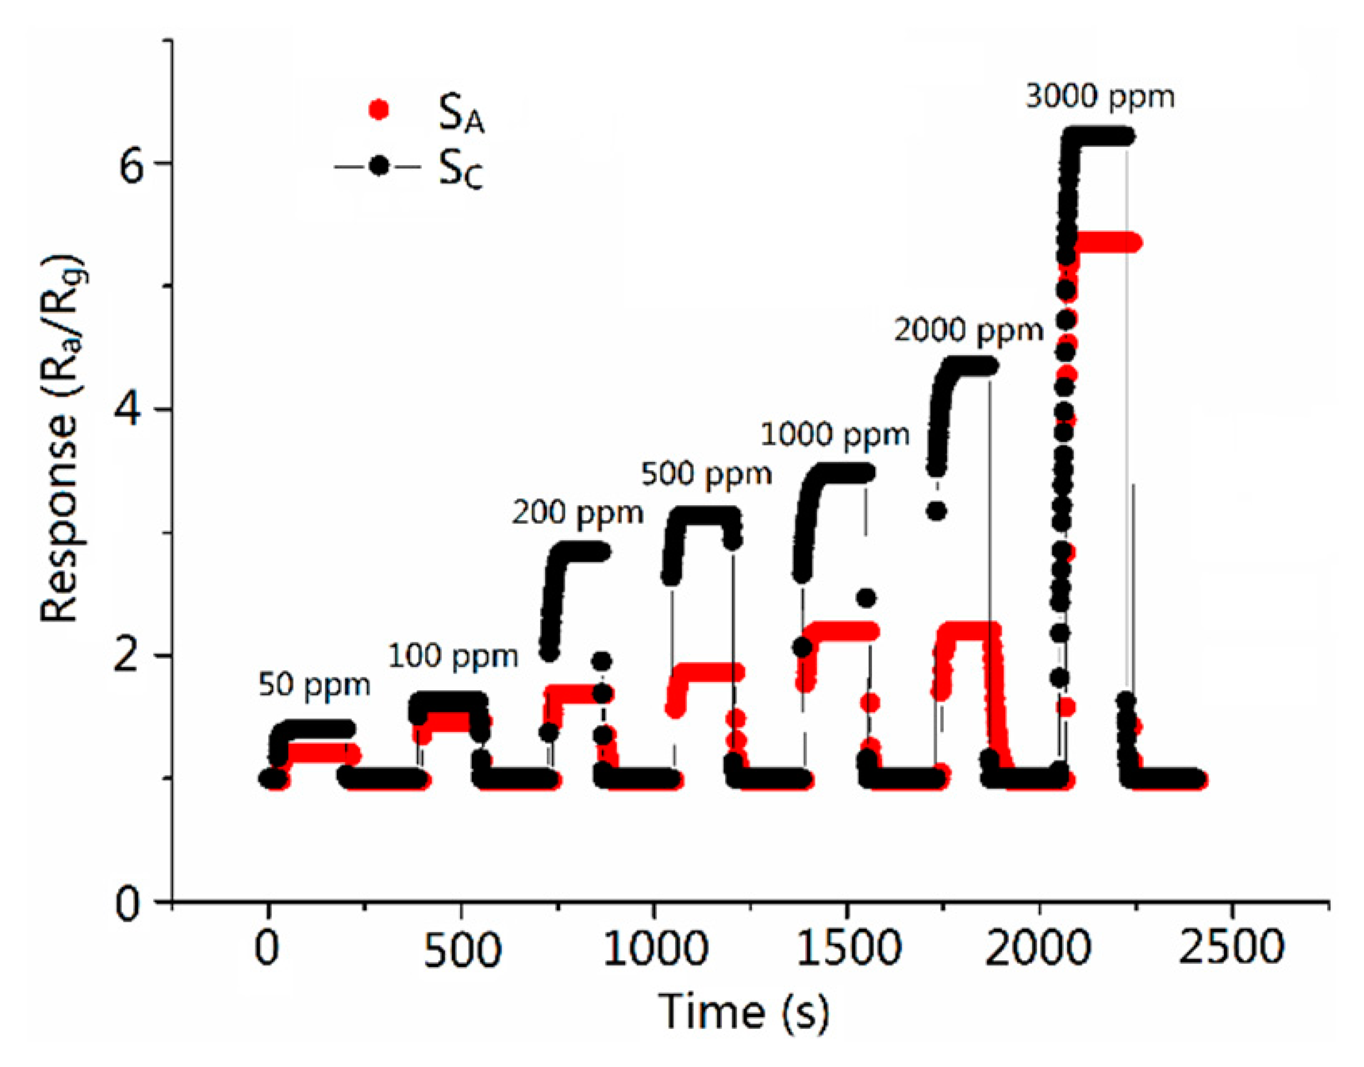
Figures 6 and 7 show the sensitivity of sensors versus the CO concentration ranging from 50 to 3000 ppm at the operating temperature of 300 °C. It is obvious that the sensitivity increases when the concentration increases and the response of SC is higher than SA in the all test ranges of CO concentration. The response of SC toward 500 ppm CO reached the value of 3.13, which is about 2.1 times higher than the response of SA. Table 2 shows the response time of 2.6–12.2 and 3.012–15.875 s (the response/recovery time is defined as the time the sensors take to complete 90% of total signal change), and recovery time of 3.6–14.8 and 3.7–16.4 s at various CO gas concentrations for sensors SC and SA, respectively. It is obvious that SC has a shorter response/recovery time compared with SA at various CO gas concentrations. The shortened response/recovery time and the promoted sensitivity show that because of the design of the molecule imprinting mechanism, the response performance of the sensors has been remarkably improved. Moreover, our research focuses on inventing a new path (borrowing the mechanism of the molecular imprinting method) in improving semiconductor sensors' sensing performance. Therefore, the mechanism can be applied to various kinds of nanomaterial. No matter which method the CO gas semiconductor sensor has previously used, adopting our method can further promote the sensing ability of the sensors.
As we can see in Figures 6 and 7, at comparatively lower concentrations (lower than 500 ppm), the promotion of SC's response is subtle while the response time and the recovery time change to a considerable extent, while on the map, we can barely see the changes in the response time and the recovery time between SC and SA. We here make a presumption that at lower concentrations, compared with that at higher concentrations, CO is so thin that it acted on and left SA slowly. While because of the imprinting method mechanism, SC responds to and recovers with CO immediately. Therefore, we can observe the change in response and recovery times. It fully testifies the improvement in recovery and response times in SC. While at higher concentrations, the CO acted on and left the sensors quickly in the cases of both SC and SA. The disparity between the times still exists but can barely be observed. However, because of the elevation in CO concentration, the manifestation of SC's response is magnified. A more palpable improvement in response performance of Sc can be observed than that at lower concentrations.
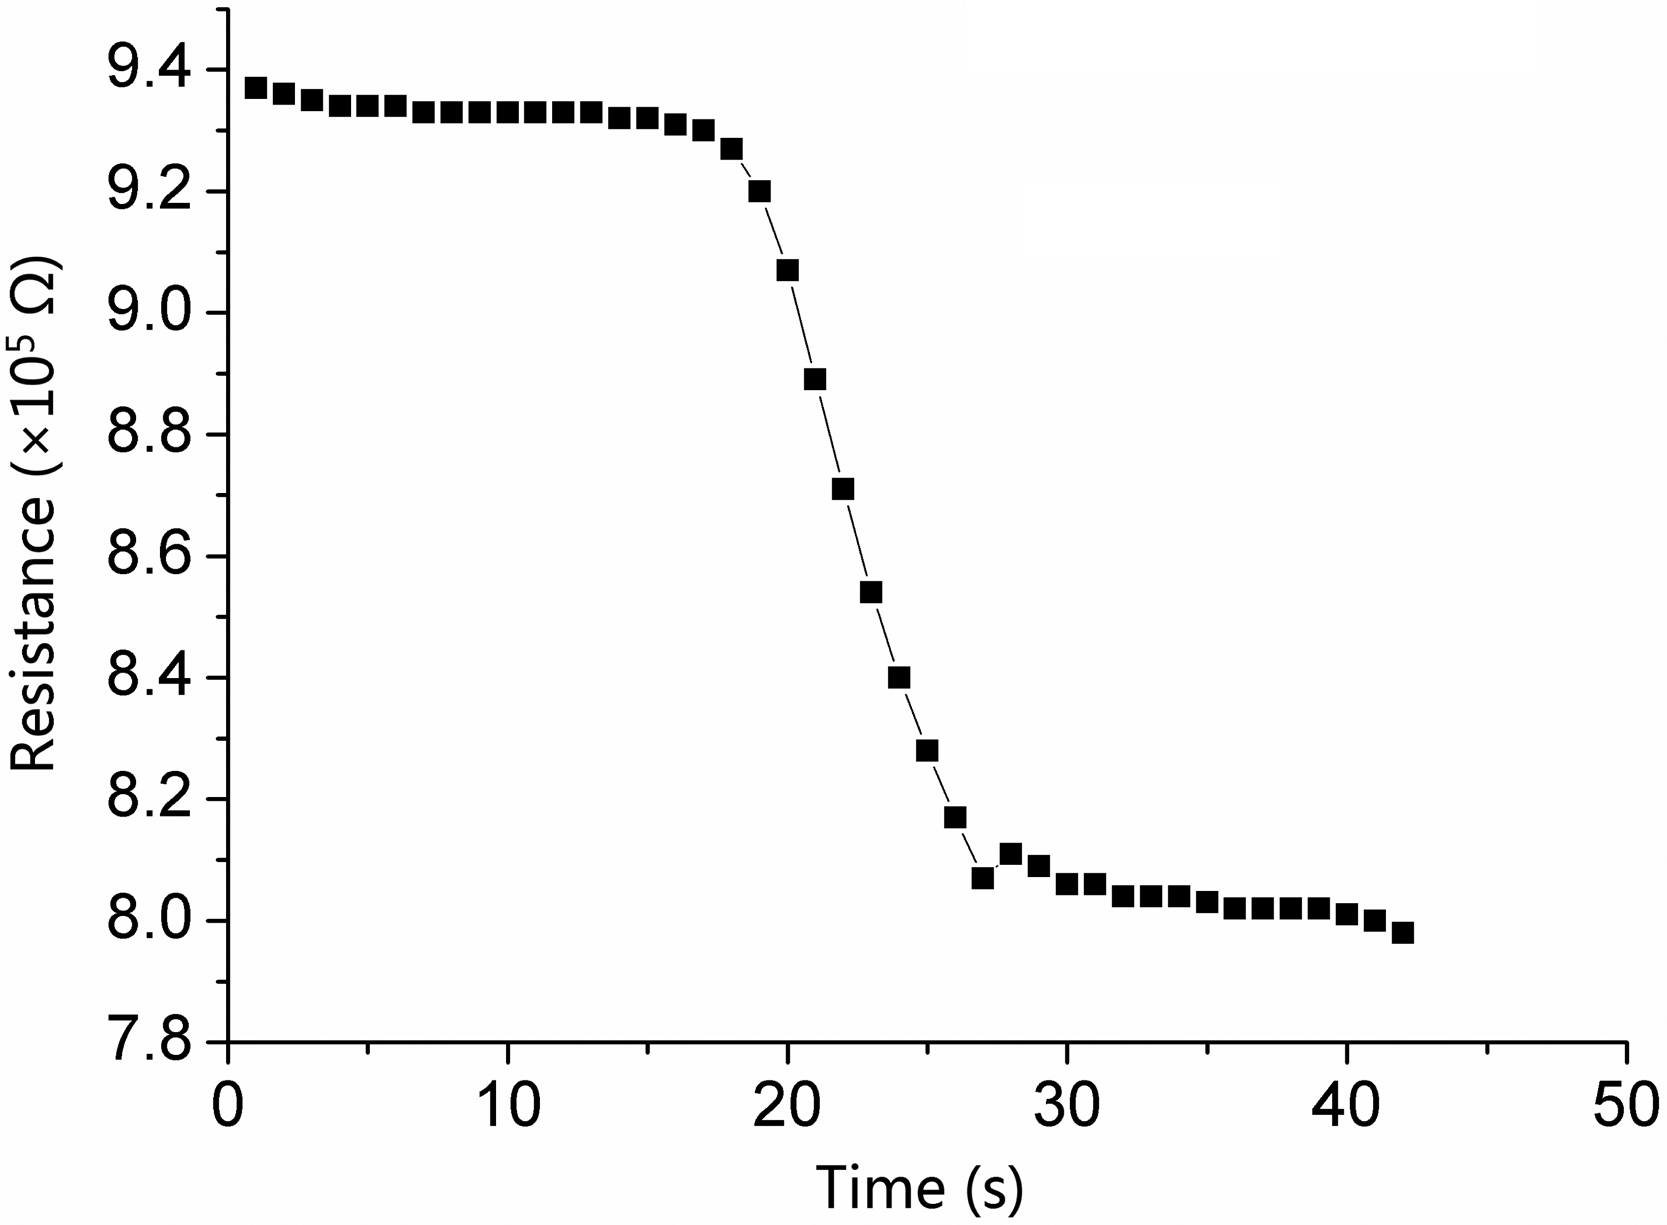
We also examined the detection limits of the sensors. Detection limit is the minimal detecting gas concentration that acted on the sensors. It is another vital factor determining semiconductor sensor's performance [31,32]. In Figure 8, there is a distinct response at a CO concentration of 5 ppm, while at lower concentrations, we can barely see the resistance change. Therefore, we assert that the detection limit of gas concentration is 5 ∼ ppm.
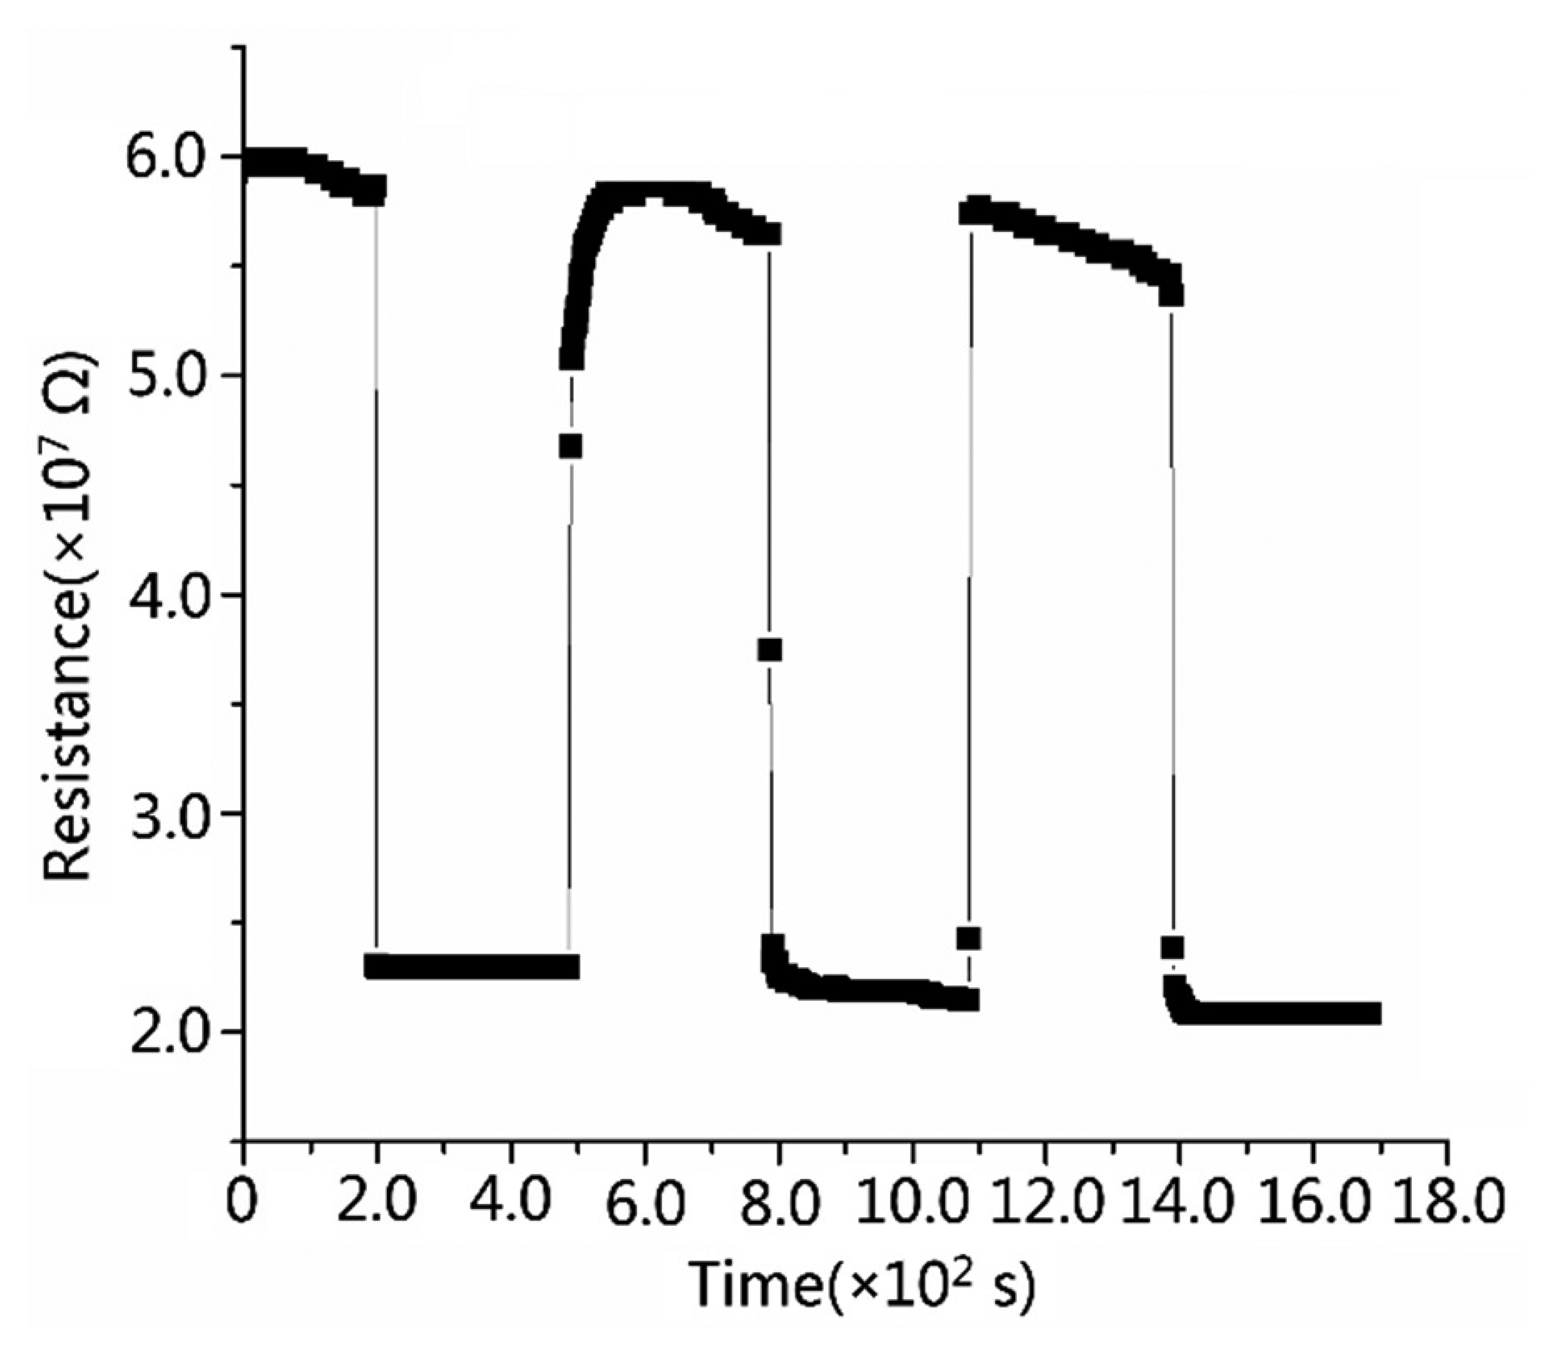
Additionally, the “baseline drift” phenomenon can also be observed in Figure 9. It generally shows that the recovery resistance after each measurement cannot return to that of the last measurement. Moreover, the platform of Ra decreases in recovery curves, which has been reported in previous research [13,15,33,34]. Specially, at lower concentrations of CO, the Ra does not decrease greatly in the recovery period. Additionally, the unobvious “baseline drift” phenomenon at low concentrations fully testifies that Sc demonstrates an excellent adsorption and desorption performance in response to CO.
Stability and repeatability should also be examined for gas sensors in terms of practical applications. In Figure 10, the sensors testing atmosphere cycles between clean air and 50 ppm CO. The stable and repeatable characteristics can be reflected in the reversible cycles of response and recovery curves. Besides, as is mentioned in previous sections, SC has a shorter recovery time than SA. Figures 9 and 10 also indicate that “baseline drift” has nothing to do with the repeated tests.
3.3. Sensing Mechanism
According to the basic gas-sensing theory, the gas molecules adsorbed on metal oxide semiconductor surfaces then changes on nanomaterial surfaces and the molecules redistribute. Specifically, the material's surface adsorb the oxygen molecule and form the oxygen adsorbates such as O2−, O2− and O−. The electrons are from the n-type active material of the oxygen adsorbates. By consequence, the structural changes in such electron-depleted surface layers result in the reduction in the electronic conductivity of the metal oxide i.e., SnO2 in this research. The reducing gas, such as CO, plays the role of the gas molecules mentioned above. The reduction reaction enables the active material to obtain electrons, which results in an increase of electronic conductivity of active material [3].
Thus, the performance of sensors is mainly determined by the adsorption and desorption of CO in this research. CO cluster interacts with the as-prepared material when the sensor is put into CO atmosphere for 12 h, which optimized the pore structure of SnO2 in order to exhibit better adsorption and desorption performance of CO. This process of imprinting nanomaterials (SnO2) by CO clusters is similar to the mechanism of the molecular imprinting method (defined as quasi molecular-cluster imprinting mechanism). Table 1 shows that the average pore size of the film CO is about 4.3 nm, which may be the critical size for the smooth adsorption and desorption of CO gas. However, further relevant research on the mechanism is still in progress.
4. Conclusions
In this research, we first follow the traditional synthesis process of SnO2 semiconductor gas sensors. Then, in the device fabrication process, we dry one group of sensors (SC) in CO, while drying another group (SA) in air. The results show that compared with SA, the sensor Sc exhibits a stronger response and shorter response/recovery time, suggesting that it is plausible to introduce the molecular imprinting mechanism to device fabrication. It also reveals that our method of combining the molecular imprinting mechanism with the hydrothermal method may be a new route to designing highly sensitive gas sensors.
Acknowledgments
This work is financially supported by the National Natural Science Foundation of China (No. 51172085) and “863” national project of China (No. 2013AA031903).
Author Contributions
C.L., M.L. and X.H. designed research; C.L., M.L. and J.Z. performed research and analyzed the data; C.L., M.L. and J.Z. wrote the paper. All authors read and approved the final manuscript.
Conflicts of Interest
The authors declare no conflict of interest.
References
- Zhang, J.; Guo, J.; Xu, H.Y.; Cao, B.Q. Reactive-Template Fabrication of Porous SnO2 Nanotubes and Their Remarkable Gas-Sensing Performance. ACS Appl. Mater. Interfaces 2013, 5, 7893–7898. [Google Scholar]
- Kuang, Q.; Lao, C.S.; Wang, Z.L.; Xie, Z.X.; Zheng, L.S. High-sensitivity humidity sensor based on a single SnO2 nanowire. J. Am. Chem. Soc. 2007, 129, 6070–6071. [Google Scholar]
- Yang, D.J.; Kamienchick, I.; Youn, D.Y.; Rothschild, A.; Kim, I.D. Ultrasensitive and highly selective gas sensors based on electrospun SnO2 nanofibers modified by Pd loading. Adv. Funct. Mater. 2010, 20, 4258–4264. [Google Scholar]
- Kim, H.R.; Haensch, A.; Kim, I.D.; Barsan, N.; Weimar, U.; Lee, J.H. The role of NiO doping in reducing the impact of humidity on the performance of SnO2-based gas sensors: synthesis strategies, and phenomenological and spectroscopic studies. Adv. Funct. Mater. 2011, 21, 4456–4463. [Google Scholar]
- Huang, H.; Ong, C.Y.; Guo, J.; White, T.; Tse, M.S.; Tan, O.K. Pt surface modification of SnO2 nanorod arrays for CO and H2 sensors. Nanoscale 2010, 2, 1203–1207. [Google Scholar]
- Huang, H.; Gong, H.; Chow, C.L.; Guo, J.; White, T.J.; Tse, M.S.; Tan, O.K. Low-temperature growth of SnO2 nanorod arrays and tunable n–p–n sensing response of a ZnO/SnO2 heterojunction for exclusive hydrogen sensors. Adv. Funct. Mater. 2011, 21, 2680–2686. [Google Scholar]
- Lu, G.H.; Ocola, L.E.; Chen, J.H. Room-temperature gas sensing based on electron transfer between discrete tin oxide nanocrystals and multiwalled carbon nanotubes. Adv. Mater. 2009, 21, 2487–2491. [Google Scholar]
- Martinez, C.J.; Hockey, B.; Montgomery, C.B.; Semancik, S. Porous tin oxide nanostructured microspheres for sensor applications. Langmuir 2005, 21, 7937–7944. [Google Scholar]
- Wan, Q.; Wang, T.H. Single-crystalline Sb-doped SnO2 nanowires: Synthesis and gas sensor application. Chem. Commun. 2005, 384, 3841–3843. [Google Scholar]
- Zhang, Z.Y.; Zou, R.J.; Song, G.S.; Yu, L.; Chen, Z.G.; Hu, J.Q. Highly aligned SnO2 nanorods on graphene sheets for gas sensors. J. Mater. Chem. 2011, 21, 17360–17365. [Google Scholar]
- Hiroyuku, Y.; Jun, T.; Koji, M.; Norio, M.; Noboru, Y. Selective CO Detection by Using Indium Oxide-Based Semiconductor Gas Sensor. J. Electrochem. Soc. 1996, 143, 36–37. [Google Scholar]
- Han, K.R.; Kim, C.S.; Kang, K.T.; Koo, H.J.; Kang, D., II; He, J.W. Development of SnO2 Based Semiconductor Gas Sensor with Fe2O3 for Detection of Combustible Gas. J. Electroceram 2003, 10, 69–73. [Google Scholar]
- Feng, X.Y.; Jiang, J.; Ding, H.; Ding, R.M.; Luo, D.; Huang, X.T. Carbon-assisted synthesis of mesoporous SnO2 nanomaterial as highly sensitive ethanol gas sensor. Sens. Actuators B. 2013, 183, 526–534. [Google Scholar]
- Cai, Z.X.; Li, X.Y.; Zeng, X.Y. Direct fabrication of SnO2-based thick film gas sensor using micropen direct writing and laser microcladding. Sens. Actuators B. 2009, 137, 340–344. [Google Scholar]
- Kida, T.; Doi, T.; Shimanoe, K. Synthesis of monodispersed SnO2 nanocrystals and their remarkably high sensitivity to volatile organic compounds. Chem. Mater. 2010, 22, 2662–2667. [Google Scholar]
- Ramström, O.; Ansell, R.J. Molecular imprinting technology: Challenges and prospects for the future. Chirality 1998, 10, 195–209. [Google Scholar]
- Riskin, M.; TelVered, R.; Willner, I. The imprint of electropolymerized polyphenol films on electrodes by donor–acceptor interactions: Selective electrochemical sensing of N,N′ -dimethyl-4,4′ -bipyridinium (methyl viologen). Adv. Func. Mater. 2007, 17, 3858–3863. [Google Scholar]
- Lakshmi, D.; Bossi, A.; Whitcombe, M.J.; Chianella, I.; Fowler, S.A.; Subrahmanyam, S.; Piletska, E.V.; Piletsky, S.A. Electrochemical sensor for catechol and dopamine based on a catalytic molecularly imprinted polymer-conducting polymer hybrid recognition element. Anal. Chem. 2009, 81, 3576–3584. [Google Scholar]
- Panasyuk, T.L.; Mirsky, V.M.; Piletsky, S.A.; Wolfbeis, O.S. Electropolymerized molecularly imprinted polymers as receptor layers in capacitive chemical sensors. Anal. Chem. 1999, 71, 4609–4613. [Google Scholar]
- Lanza, F.; Sellergren, F. The application of molecular imprinting technology to solid phase extraction. Chromatographia 2001, 53, 599–611. [Google Scholar]
- Cameron, A.; Håkan, S.A.; Lars, I.A.; Richard, J.A.; Nicole, K.; Ian, A.N.; John, O.M.; Michael, J.W. Molecular imprinting science and technology: A survey of the literature for the years up to and including 2003. J. Mol. Recognit. 2006, 19, 106–118. [Google Scholar]
- Nenad, G.E.; Umporn, A.; Decha, D.; Frieder, W.S. Molecular Imprinting Technique for Biosensing and Diagnostics. Appl. Nanomater. Sens. Diagn. 2013, 14, 143–170. [Google Scholar]
- Bjorn, E.; Klaus, M. Molecular imprinting: A technique for producing specific separation materials. Trends Biotechnol. 1989, 7, 92–96. [Google Scholar]
- Abhilasha, V.; George, M.M. A Path to Soluble Molecularly Imprinted Polymers. Funct. Biomater. 2012, 3, 1–22. [Google Scholar]
- Chen, J.S.; Cheah, Y.L.; Chen, Y.T.; Jayaprakash, N.; Madhavi, S.; Yang, Y.H.; Lou, X.W. SnO2 nanoparticles with controlled carbon nanocoating as high-capacity anode materials for lithium-ion batteries. J. Phys. Chem. C 2009, 113, 20504–20508. [Google Scholar]
- Sing, K.S.W.; Everett, D.H.; Haul, R.A.W.; Moscou, L.; Pierotti, R.A.; Rouquérol, J.; Siemieniewska, T. Reporting physisorption data for gas/solid system. Pure Appl. Chem. 1985, 57, 603–619. [Google Scholar]
- Kruk, M.; Jaroniec, M. Gas adsorption characterization of ordered organic-inorganic nanocomposite materials. Chem. Mater. 2001, 13, 3169–3183. [Google Scholar]
- Li, L.L.; Zhang, W.M.; Yuan, Q.; Li, Z.X.; Fang, C.J.; Sun, L.D.; Wan, L.J.; Yan, C.H. Room Temperature Ionic Liquids Assisted Green Synthesis of Nanocrystalline Porous SnO2 and Their Gas Sensor Behaviors. Cryst. Growth Des. 8 2008, 11, 4165–4172. [Google Scholar]
- Shinde, V.R.; Gujar, T.P.; Lokhande, C.D. Enhanced response of porous ZnO nanobeads towards LPG: Effect of Pd sensitization. Sens. Actuators B 2007, 123, 701–706. [Google Scholar]
- Cao, Z.; Stetter, J.R. A selective solid-state gas sensor for halogenated hydrocarbons. Sens. Actuators B 1991, 5, 109–113. [Google Scholar]
- Cheng, C.H.; Yeh, F.S.; Chin, A. Low-Power High-Performance Non-Volatile Memory on Flexible Substrate with Excellent Endurance. Sci. Adv. Mater. 2011, 23, 901–906. [Google Scholar]
- Abaker, M.; Umar, A.; Baskoutas, S.; Dar, G.N.; Zaidi, S.A.; al-Sayari, S.A.; Al-Hajry, A.; Kim, S.H.; Huang, S.W. A highly sensitive ammonia chemical sensor based on α-Fe2O3 nanoellipsoids. J. Phys. D-Appl. Phys. 2011, 44. [Google Scholar] [CrossRef]
- Chiu, H.C.; Yeh, C.S. Hydrothermal synthesis of SnO2 nanoparticles and their gas-sensing of alcohol. J. Phys. Chem. C 2007, 111, 7256–7259. [Google Scholar]
- Han, Z.J.; Mehdipour, H.; Li, X.G.; Shen, J.; Randeniya, L.; Yang, H.Y.; Ostrikov, K. SWCNT networks on nanoporous silica catalyst support: Morphological and connectivity control for nanoelectronic, gas-sensing, and biosensing devices. ACS Nano. 2012, 6, 5809–5819. [Google Scholar]


| Sample | Average Pore Size (nm) | BET Surface Area (m2 g−1) |
|---|---|---|
| SA | 5.5383 | 79.636 |
| SC | 5.5696 | 80.786 |
| Gas Concentration (ppm) | Response Time (s) | Recovery Time (s) | ||
|---|---|---|---|---|
| SC | SA | SC | SA | |
| 50 | 12.266 | 15.875 | 14.877 | 16.456 |
| 100 | 8.087 | 10.949 | 12.99 | 13.892 |
| 200 | 7.219 | 10.834 | 10.242 | 12.4 |
| 500 | 5.484 | 7.13 | 7.965 | 8.706 |
| 1000 | 4.45 | 5.773 | 5.186 | 6.499 |
| 2000 | 3.252 | 3.448 | 3.758 | 3.929 |
| 3000 | 2.659 | 3.012 | 3. 625 | 3. 701 |
© 2015 by the authors; licensee MDPI, Basel, Switzerland. This article is an open access article distributed under the terms and conditions of the Creative Commons Attribution license ( http://creativecommons.org/licenses/by/4.0/).
Share and Cite
Li, C.; Lv, M.; Zuo, J.; Huang, X. SnO2 Highly Sensitive CO Gas Sensor Based on Quasi-Molecular-Imprinting Mechanism Design. Sensors 2015, 15, 3789-3800. https://doi.org/10.3390/s150203789
Li C, Lv M, Zuo J, Huang X. SnO2 Highly Sensitive CO Gas Sensor Based on Quasi-Molecular-Imprinting Mechanism Design. Sensors. 2015; 15(2):3789-3800. https://doi.org/10.3390/s150203789
Chicago/Turabian StyleLi, Chenjia, Meng Lv, Jialin Zuo, and Xintang Huang. 2015. "SnO2 Highly Sensitive CO Gas Sensor Based on Quasi-Molecular-Imprinting Mechanism Design" Sensors 15, no. 2: 3789-3800. https://doi.org/10.3390/s150203789