1. Introduction
The surface plasmon resonance (SPR) technique has been extensively studied for its high refractive index (RI) sensitivity since the 1960s, when it was first released. Many kinds of sensors based on the SPR technique have been developed and used in the area of chemical and biomedical sensing in recent years. Bimolecular interactions and chemical reactions can be specified by monitoring the accompanying RI changes [
1,
2,
3,
4]. Most of these SPR sensors (SPRSs) are prism based and fiber based. In particular, fiber SPRSs have attracted much interest in recent years for their advantages, such as easy coupling, small volume and remote sensing [
5,
6,
7].
As a kind of optical waveguide, hollow fiber (HF) has been widely studied in recent years for its high power threshold and low transmission losses in the infrared and visible region. Furthermore, taking advantage of the hollow core in its structure, HF can act as an optical waveguide and a sensing cell simultaneously. It found applications in the field of sensing, such as infrared absorption and Raman scattering [
8,
9,
10,
11,
12,
13]. In 2013, the HF-SPRS, which was fabricated by depositing a silver film with a thickness less than 100 nm on the inner wall of a fused silica (FSG) capillary tube, was reported [
14]. This sensor has comparable sensitivity to other fiber SPRS, while its figure of merit (FOM) is not so high. Later, a kind of HF long-range SPR (LRSPR) sensor based on dielectric/silver-coated HF was reported [
15]. Comparing to the HF-SPRS, the HF LRSPR sensor was significantly enhanced five times approximately in the FOM without decreasing in sensitivity. However, both of these sensors are based on fused silica HF, so they cannot detect a medium with an RI lower than fused silica. In other words, these HF-SPRSs are suitable for the detection of medium with a high RI because of their high RI detection range, which is above 1.5 approximately. Since aqueous solutions with lower RIs are more common in biomedical sensing, the HF-SPRS will be more useful if its RI detection range can be shifted towards a lower RI direction to match the aqueous solutions.
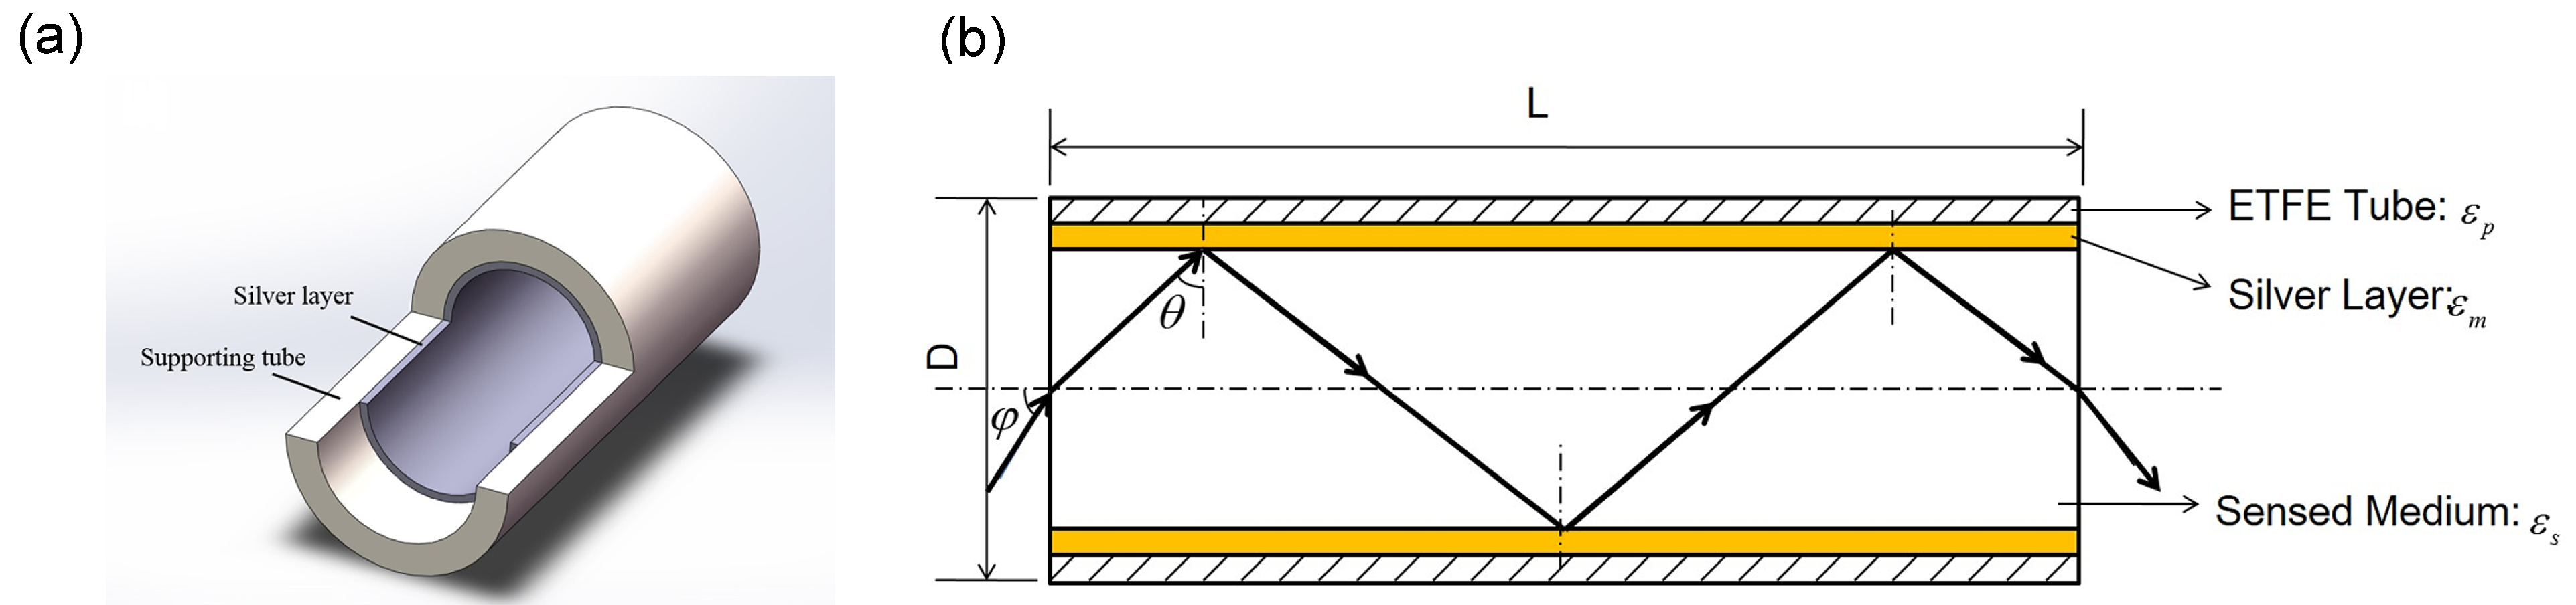
Changing the tube material of the HF from fused silica to some other materials with lower RIs is a feasible solution to extend the detection range of the HF-SPRS to a lower RI range. In this paper, we present a new kind of ethylene tetra-fluoro-ethylene (ETFE) HF-SPRS, which adopts ETFE instead of FSG as the base tube material. The ETFE tube is more flexible and less fragile than the FSG tube, which makes it safer in medical applications and more conducive to miniaturization of the instruments. More importantly, polymers with low RIs, such as Teflon AF, PTFE and other series, are very difficult to coat with a metal film because of their non-stick property, while ETFE has a relatively strong ability of metal adhesion. An ETFE HF-SPRS with a lower RI detection range than the FSG HF-SPRS was fabricated. Its performance was investigated experimentally by measuring the transmission spectra of the sensor. Theoretically analysis based on the ray transmission model was also carried out. The presented sensor shows the capability to extend the detection range to a lower RI range, which could greatly enhance the application potential of the HF-SPRS.
3. Fabrication and Experimental Setup
The essential procedure to fabricate ETFE HF-SPRS is coating a smooth and uniform silver film with a thickness less than 100 nm on the inner surface of the ETFE tube. Comparing to FSG, ETFE has a much lower RI, which can shift the sensor’s detection range to a lower RI range. However, coating of a silver film in the ETFE tube is not as easy as doing that in the FSG tube, although ETFE has much stronger metal adhesion than other fluoropolymers. There are several kinds of approaches, such as electrochemical deposition [
21] and electrophoretic deposition [
22], that could give a homogenous silver coating. In our experiments, we use an improved liquid phase deposition method, as shown in
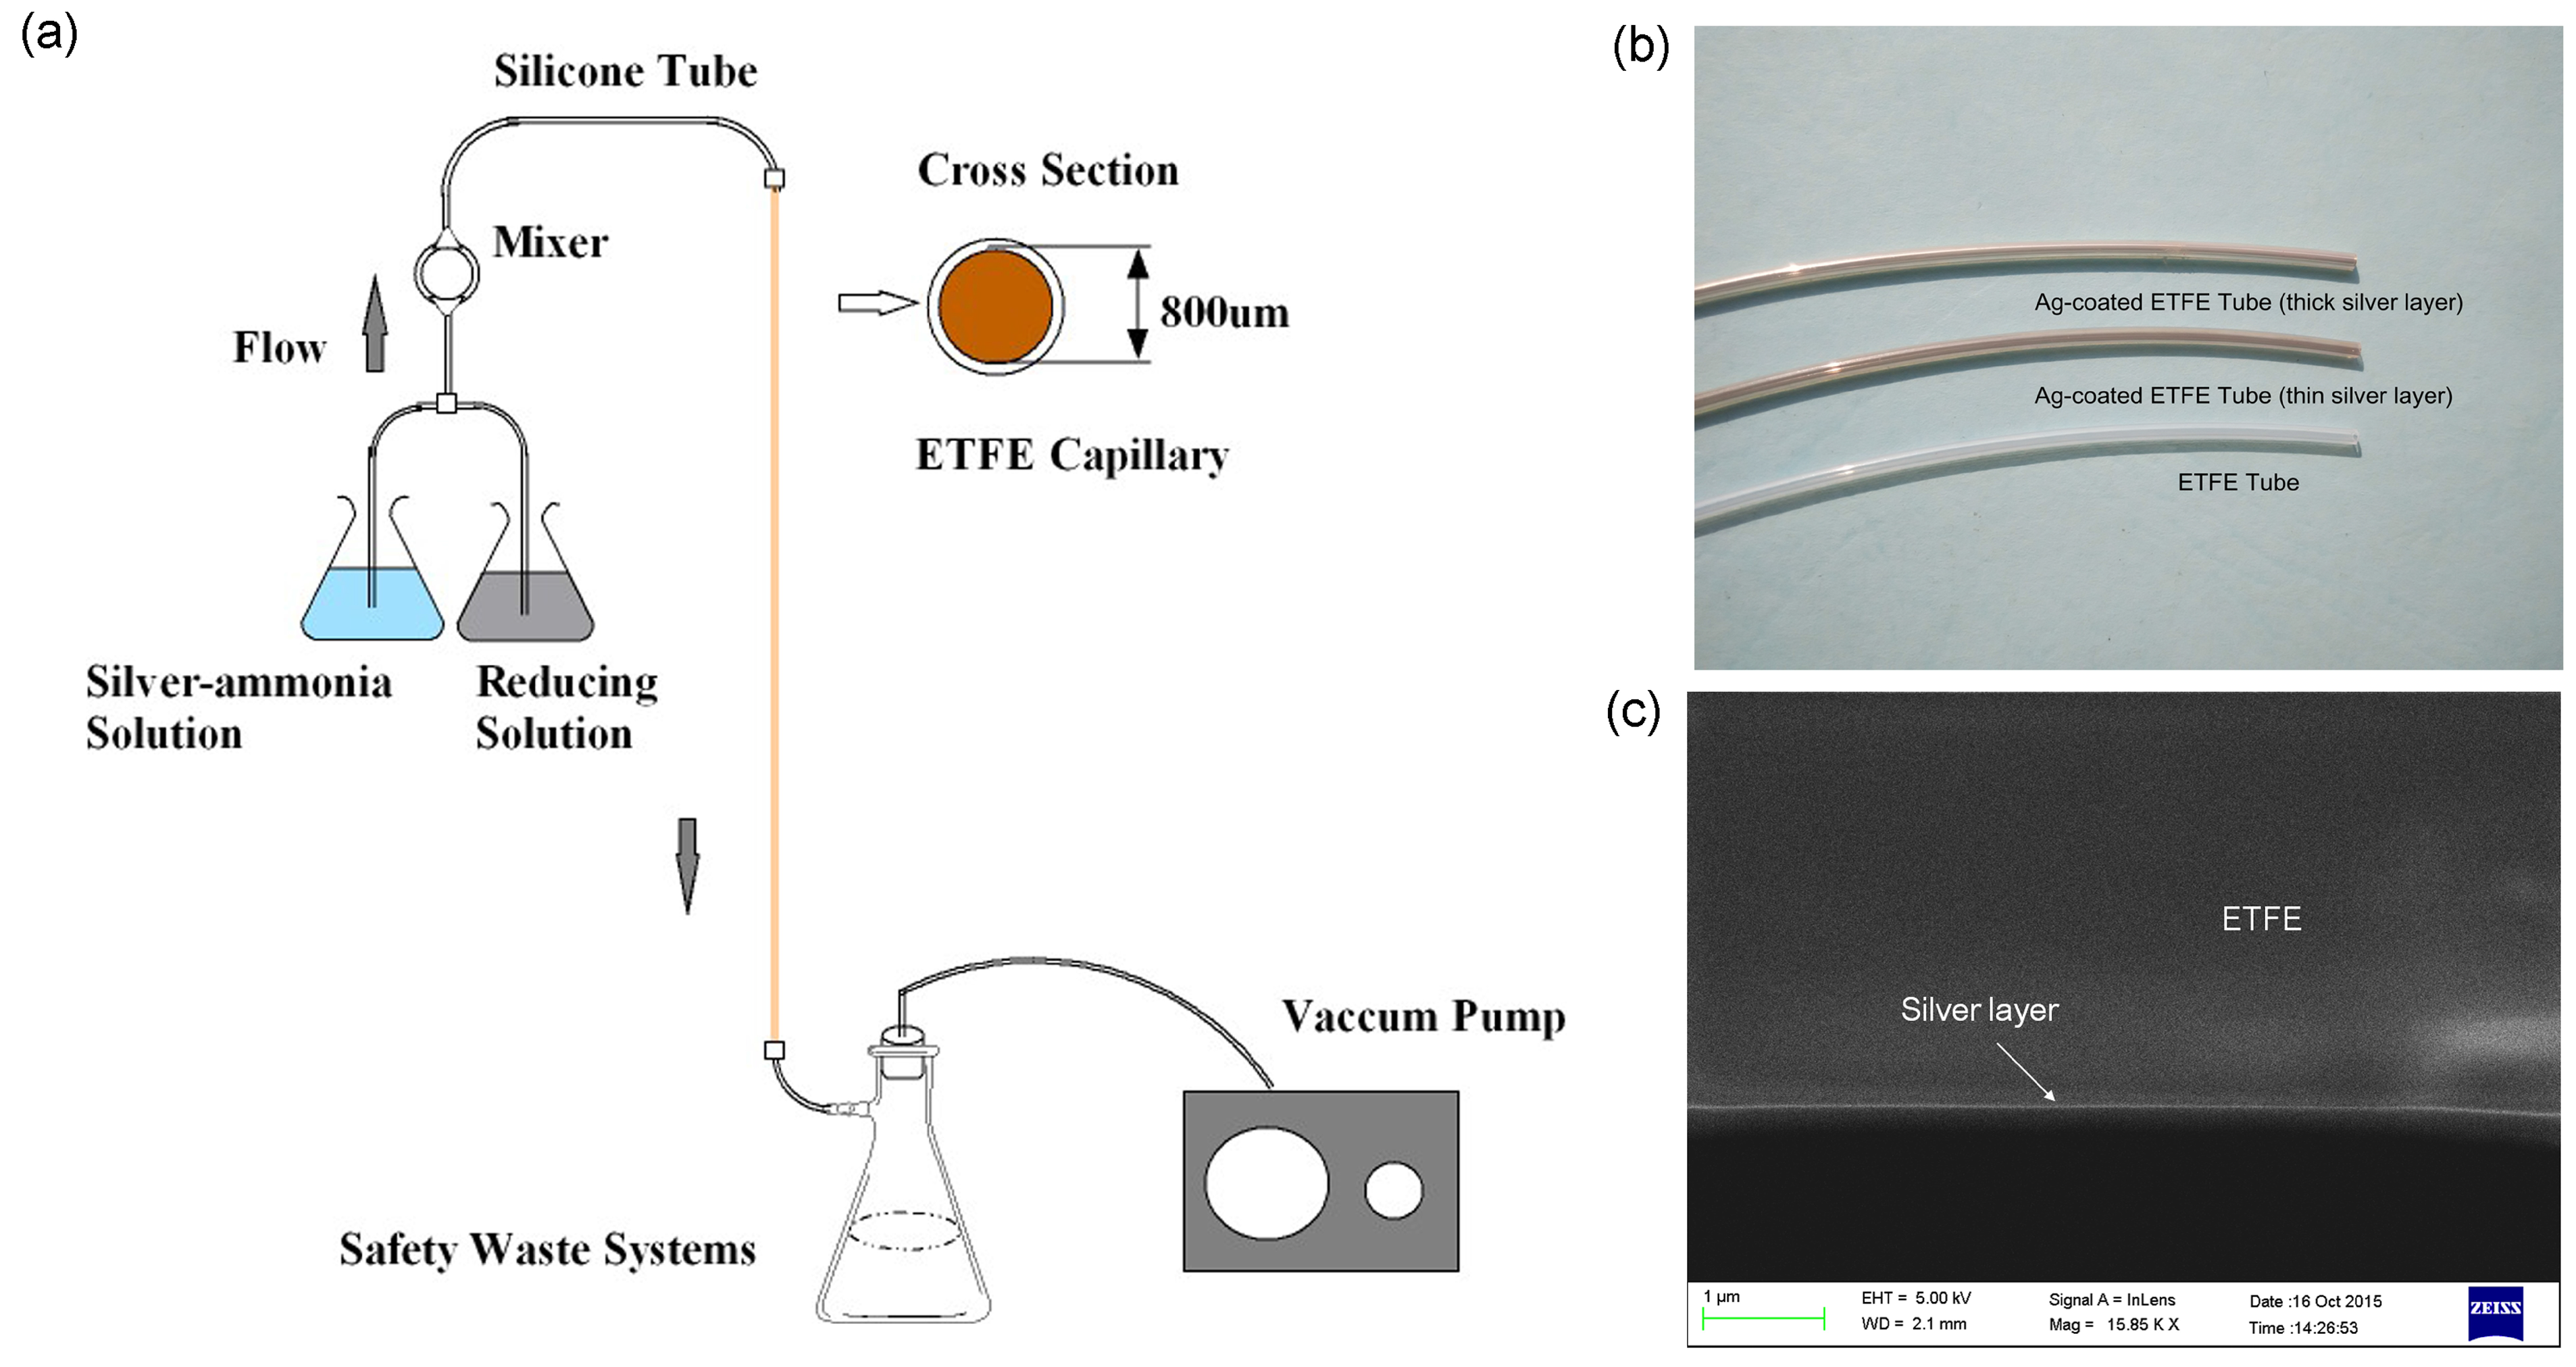
Figure 2a, to deposit the silver film on the inner surface of the ETFE tube. Pumped by a vacuum pump, the prepared silver-ammonia and glucose solutions are fully mixed in the mixer and then pass through the ETFE tube. Silver particles will deposit on the inner surface of the tube and form a silver film gradually. The deposition temperature, time and speed of solution passing through the tube are the key factors affecting the quality of the silver film. A high temperature causes difficulties in controlling the silver layer thickness, while a low temperature leads to bad silver layer quality. The deposition time influences the silver layer thickness, and the solution speed affects the film quality. Experiments show that the coating procedure in the ETFE tube should have a little bit lower temperature and faster solution speed than that in the FSG tube to achieve better film quality. Moreover, because the growth rate of the silver film is slower in the ETFE tube than in FSG tube, it costs more time to get the same silver film thickness. A 20 cm-long ETFE HF with an 800-μm diameter was fabricated at a temperature of 12 °C. The deposition time of the silver layer was 90 s, and the solution speed is 28 mL/min. A piece of fiber with a short length of about 5 cm is cut off as the SPRS used in the following spectra experiments.
In addition, the photo of the ETFE tube and two Ag-coated ETFE tubes with different Ag film thicknesses is shown as
Figure 2b. This could convince one that Ag has been coated properly. The SEM photo of the Ag/ETFE interface of the cross-section of the Ag-coated ETFE tube was also taken and shown as
Figure 2c. We have tried to obtain a photo with larger magnification, but this failed. Because of the charging effect and the low electrical conductivity of the ETFE tube, the image becomes even worse and too blurred to be distinguished if increasing the magnification further. The silver film can be seen clearly in the SEM photo, although its thickness cannot be measured because of the low magnification.
Figure 3 shows the experimental system for measuring the SPR spectra. The light emitted from a halogen lamp was launched into the ETFE HF-SPRS via the multi-mode fiber (MMF) and then collected by the spectrometer (Horiba JobinYvon iHR550, Paris, France). In addition, to realize real-time detection, the liquid sensed medium was injected into the sensor by a peristaltic pump through an L-type joint connected with silicone tubes.
Figure 2.
(a) Schematic diagram of the liquid phase coating method for silver plating; (b) ETFE tube and two Ag-coated ETFE tubes with different Ag film thicknesses; (c) SEM picture of the cross-section of the HF used in the experiment.
Figure 2.
(a) Schematic diagram of the liquid phase coating method for silver plating; (b) ETFE tube and two Ag-coated ETFE tubes with different Ag film thicknesses; (c) SEM picture of the cross-section of the HF used in the experiment.
Figure 3.
Diagram of the experimental setup.
Figure 3.
Diagram of the experimental setup.
Two kinds of solutions were used as the sensed media to cover the RI range from 1.42 to 1.58. They are mixed solutions of deionized water and glycerin with different volume ratios for the RI range of 1.42 to 1.46, while mixed solutions of kerosene and polymethyl phenyl silicone fluid for an RI range above 1.46. The exact RIs of the solutions used in experiments were measured by the Abbey refractometer as 1.4287, 1.4328, 1.4413, 1.4506, 1.4605, 1.4701, 1.4808, 1.4904, 1.5003, 1.5102, 1.5190, 1.5367 and 1.5412, respectively.
4. Results and Discussion
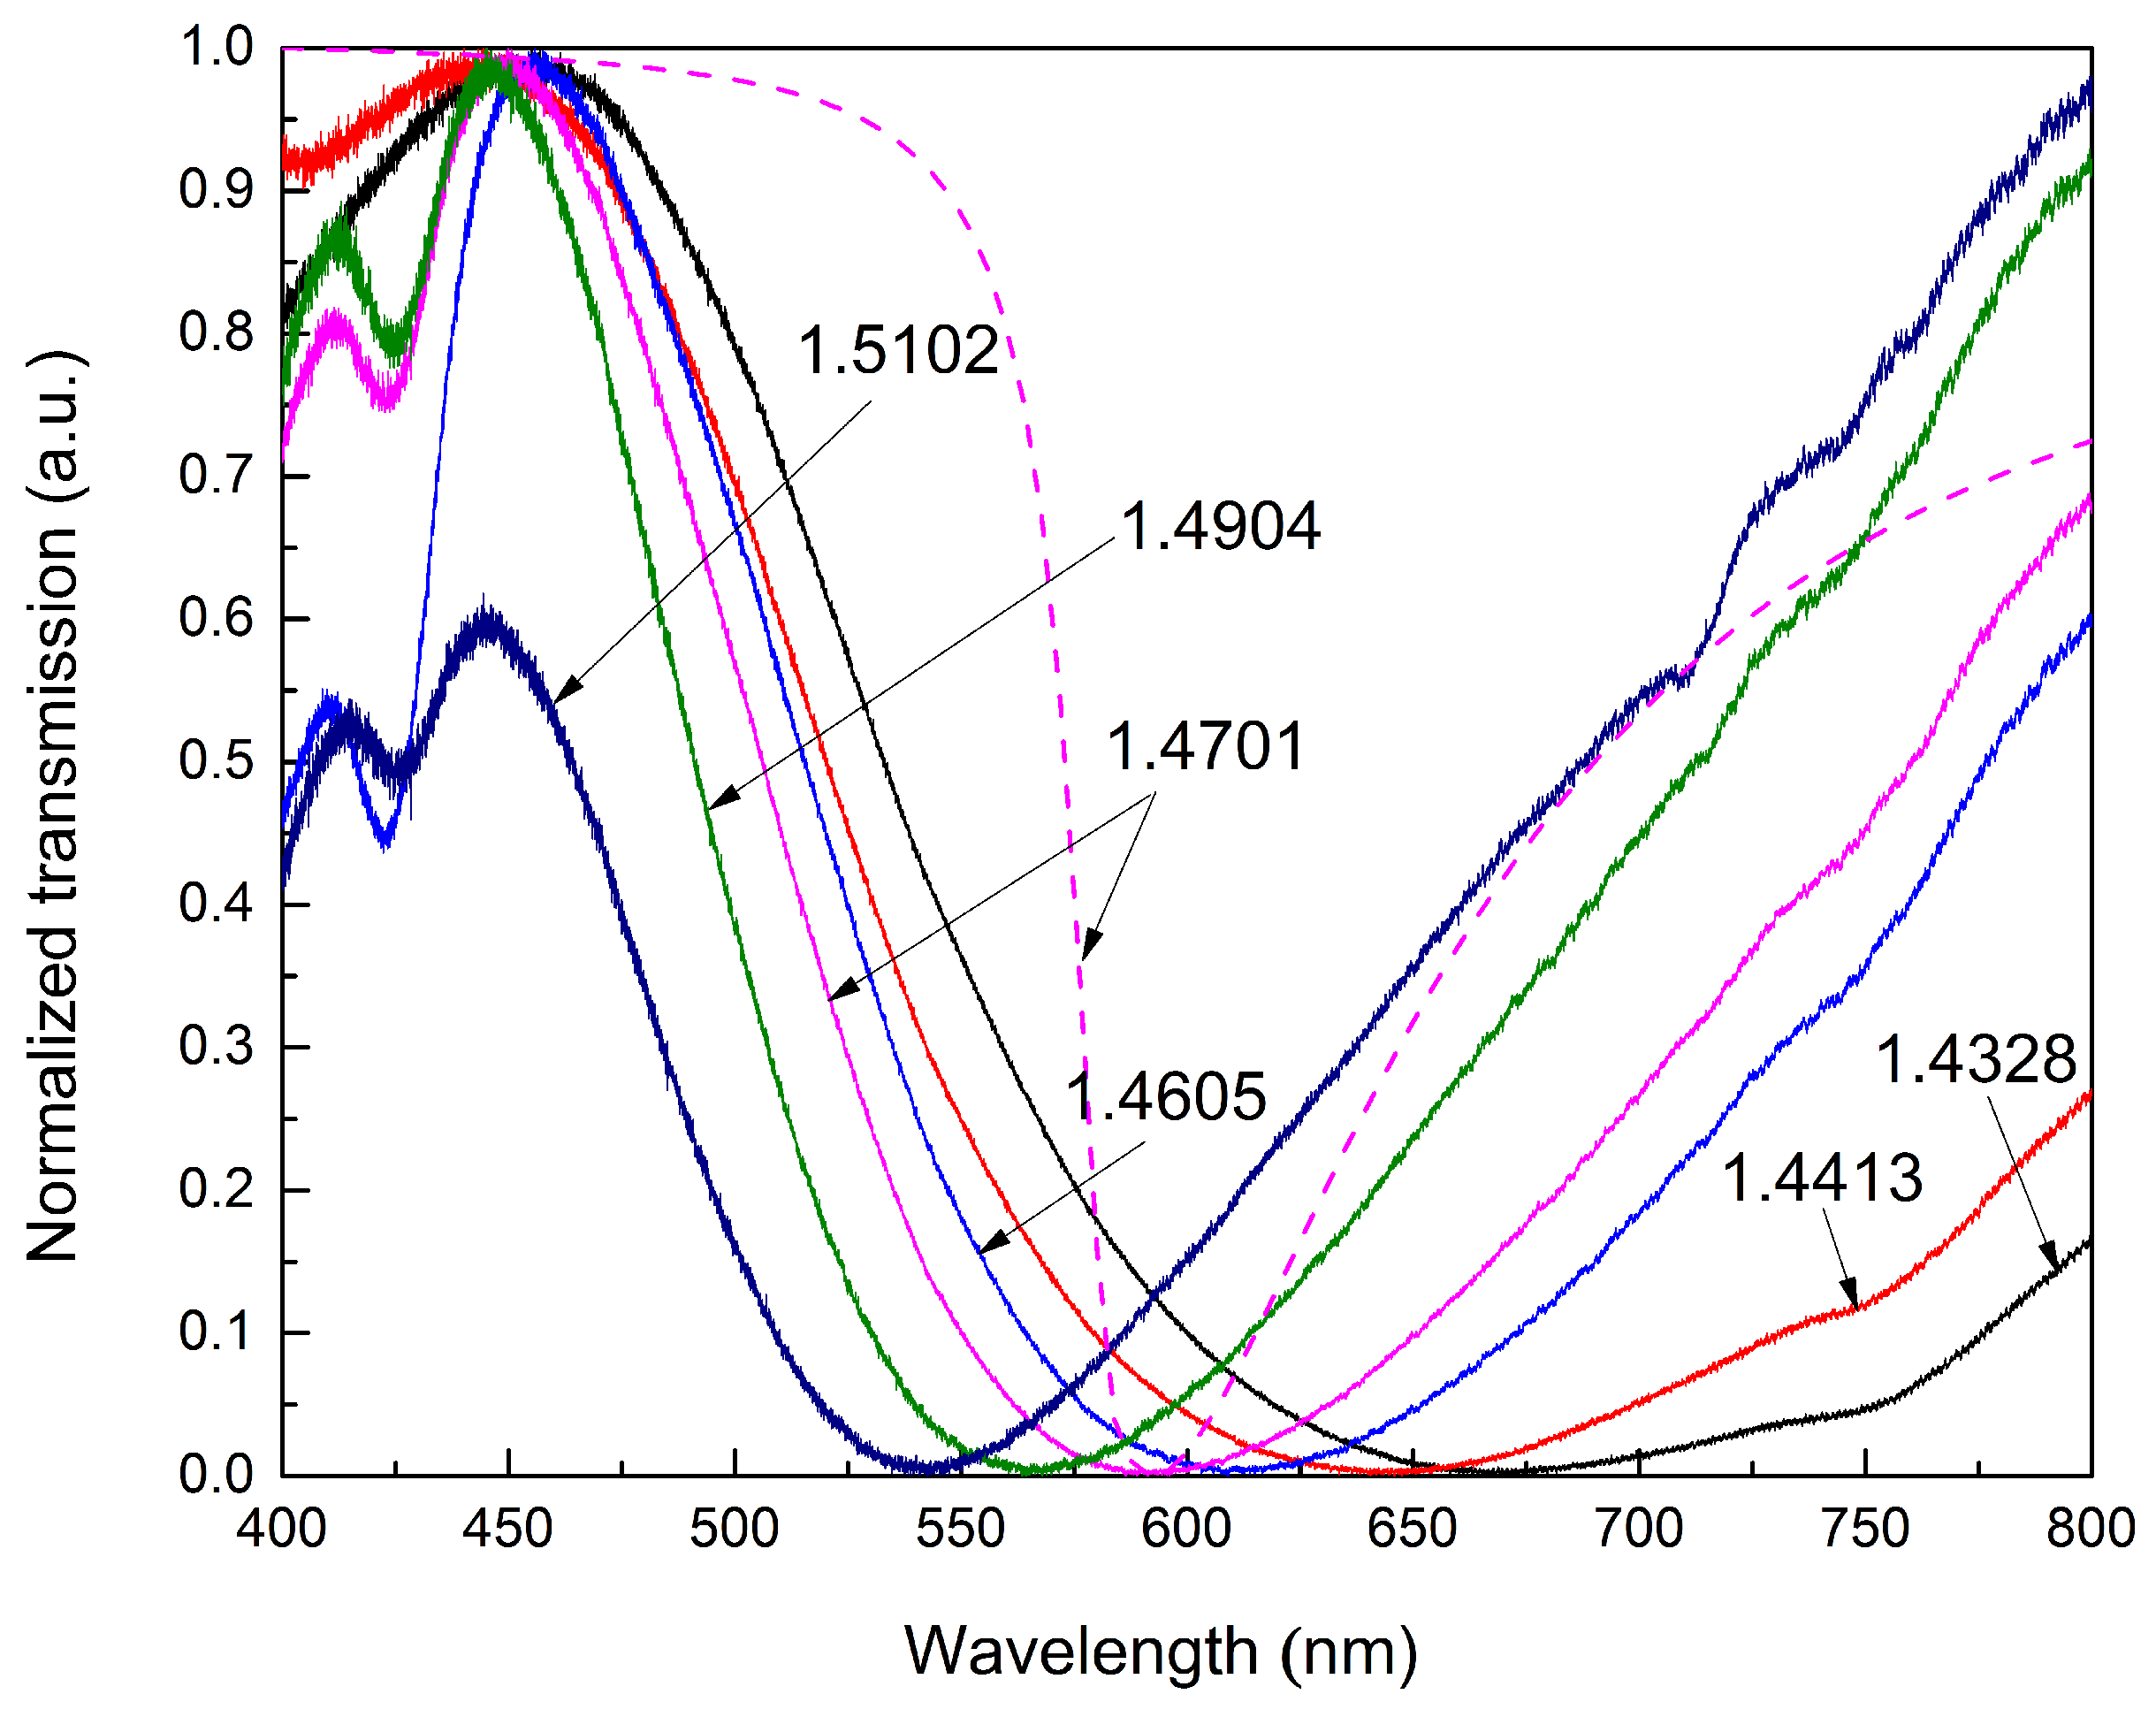
Figure 4a shows the normalized transmission spectra of the ETFE HF-SPRS for the liquid sensed media with different RIs. The RIs of the media are 1.4328, 1.4413, 1.4605, 1.4701, 1.4904 and 1.5102, respectively. The solid lines represent the measured spectra. As can be seen from the figure, the resonance dip in the spectrum shifts towards shorter wavelength when the RI of the sensed medium increases. In other words, the RW blue shifts with increased RI. The theoretical calculated spectrum with Equation (12) for
ns = 1.4701 is also shown in the figure as the dashed line for comparison. It can be seen that the RW of the theoretical spectrum is close to the measured result, while the resonance dip is much narrower. The wider SPR dip of the measured spectra means that the experimental data have much larger FWHM than the theoretical results. This is mainly due to the non-uniformity of the silver layer. The SPR spectrum of a non-uniform silver layer can be simply seen as the combination of the SPR spectra of a set of silver layers with different thicknesses. Additionally, the RW of the SPR spectra will shift as the silver layer thickness varies. Therefore, the combination will definitely broaden the SPR dip.
Figure 4.
Normalized transmission spectra of ETFE HF-SPRS with different ns; the corresponding ns is labeled in the figure.
Figure 4.
Normalized transmission spectra of ETFE HF-SPRS with different ns; the corresponding ns is labeled in the figure.
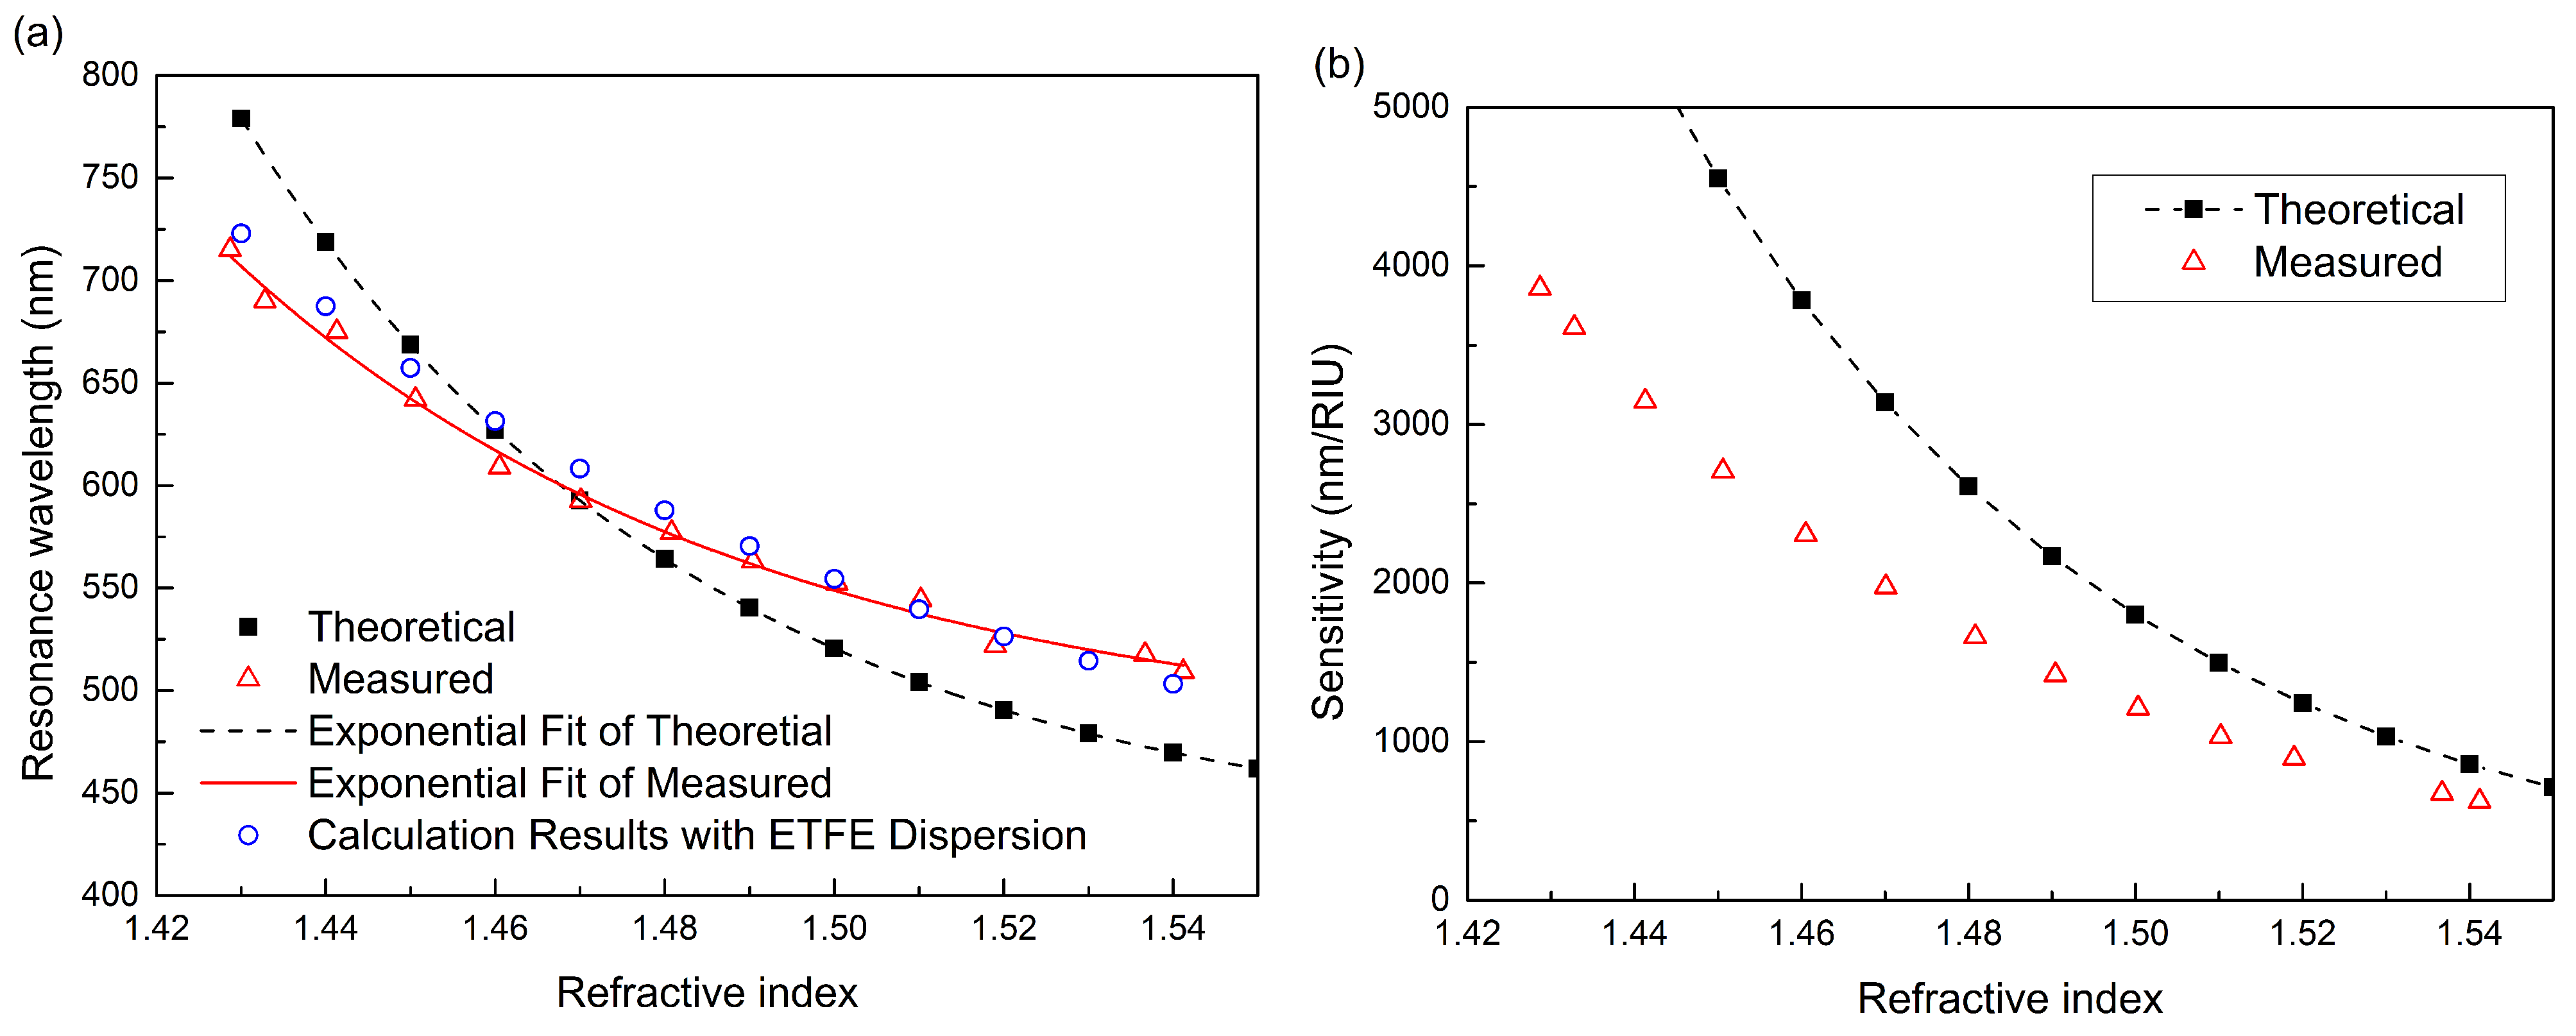
The RW of each experimental SPR spectrum for different sensed RI was measured, shown with red triangles in
Figure 5a. Theoretical data of RWs obtained from the spectra calculated with Equation (12) are also shown in the figure with black squares for comparison, while the thickness of silver layer is 42 nm and the RI of ETFE tube in the calculation is about 1.3850 at a wavelength of 589 nm (measured by an Abbe refractometer).
The black dashed line represents exponential fitting results of the theoretical data. The fit function is
λres = 423.43324 + 1.18189 × 10
14 exp(−18.55224
ns), with a correlation coefficient of 0.99856. It can be seen that the exponential fitting matches very well with the data points. Therefore, we also use the exponential function to fit the experimental measured data. The red solid line is the result of exponential fitting. The fit function is
λres = 407.6446 + 2.64321 × 10
12 exp(−16.18922
ns), and the correlation coefficient is 0.99379. The lines of theoretical simulations and measured results have approximately the same trend. The deviation is mainly because of the dispersion of ETFE and sensed media, which is not taken into consideration in the calculation with Equation (12). Here, we assume that the RI of ETFE is expressed according to the Cauchy equation as:
This dispersion is similar to the dispersion curve in [
23]. Although it may have a small difference in values, we could use it to qualitatively illustrate the influence of the dispersion of ETFE on the theoretical results. The calculation results of taking the above dispersion into consideration are shown in
Figure 5a as the blue circles. It can be seen that the absolute slope rate of the theoretical curve decreases and is very close to the experimental curve. This means that the deviation of RW between experimental and theoretical results is mainly due to the material dispersion. Because the assumed dispersion of ETFE is not strictly accurate, the later theoretical analyses still use the non-dispersion results. Theoretically, the sensor’s detection range could cover any RI higher than the the ETFE tube. However, it is also limited because of the finite wavelength range of the light source and spectrometer. For example, if the RI of the sensed medium is lower than 1.42, the resonance dip will go beyond 800 nm, which is the upper limit of the spectrometer in our experiments. Thus, the efficient detection range of the ETFE HF-SPRS in our experiments is approximately from 1.42 to 1.54.
Figure 5.
Theoretical and measured results of resonance wavelength (RW) and sensitivity for ETFE HF-SPRS. (a) RW versus ns; (b) sensitivity versus ns.
Figure 5.
Theoretical and measured results of resonance wavelength (RW) and sensitivity for ETFE HF-SPRS. (a) RW versus ns; (b) sensitivity versus ns.
According to Equation (14), the definition of the sensitivity, the first derivatives of the curves of RW
versus ns in
Figure 5a are the sensitivities of the sensor. The absolute values of the calculated sensitivities for both theoretical and experimental data are shown in
Figure 5b. It can be seen that the sensor has a higher sensitivity in the lower RI region, while the RW is located in the longer wavelength region. Additionally, the sensitivity decreases gradually from about 4000 nm/RIU to 600 nm/RIU as the RI of sensed medium increases from 1.42 to 1.54.
Besides sensitivity, the detection accuracy is another important parameter for evaluating the performance of the SPRS [
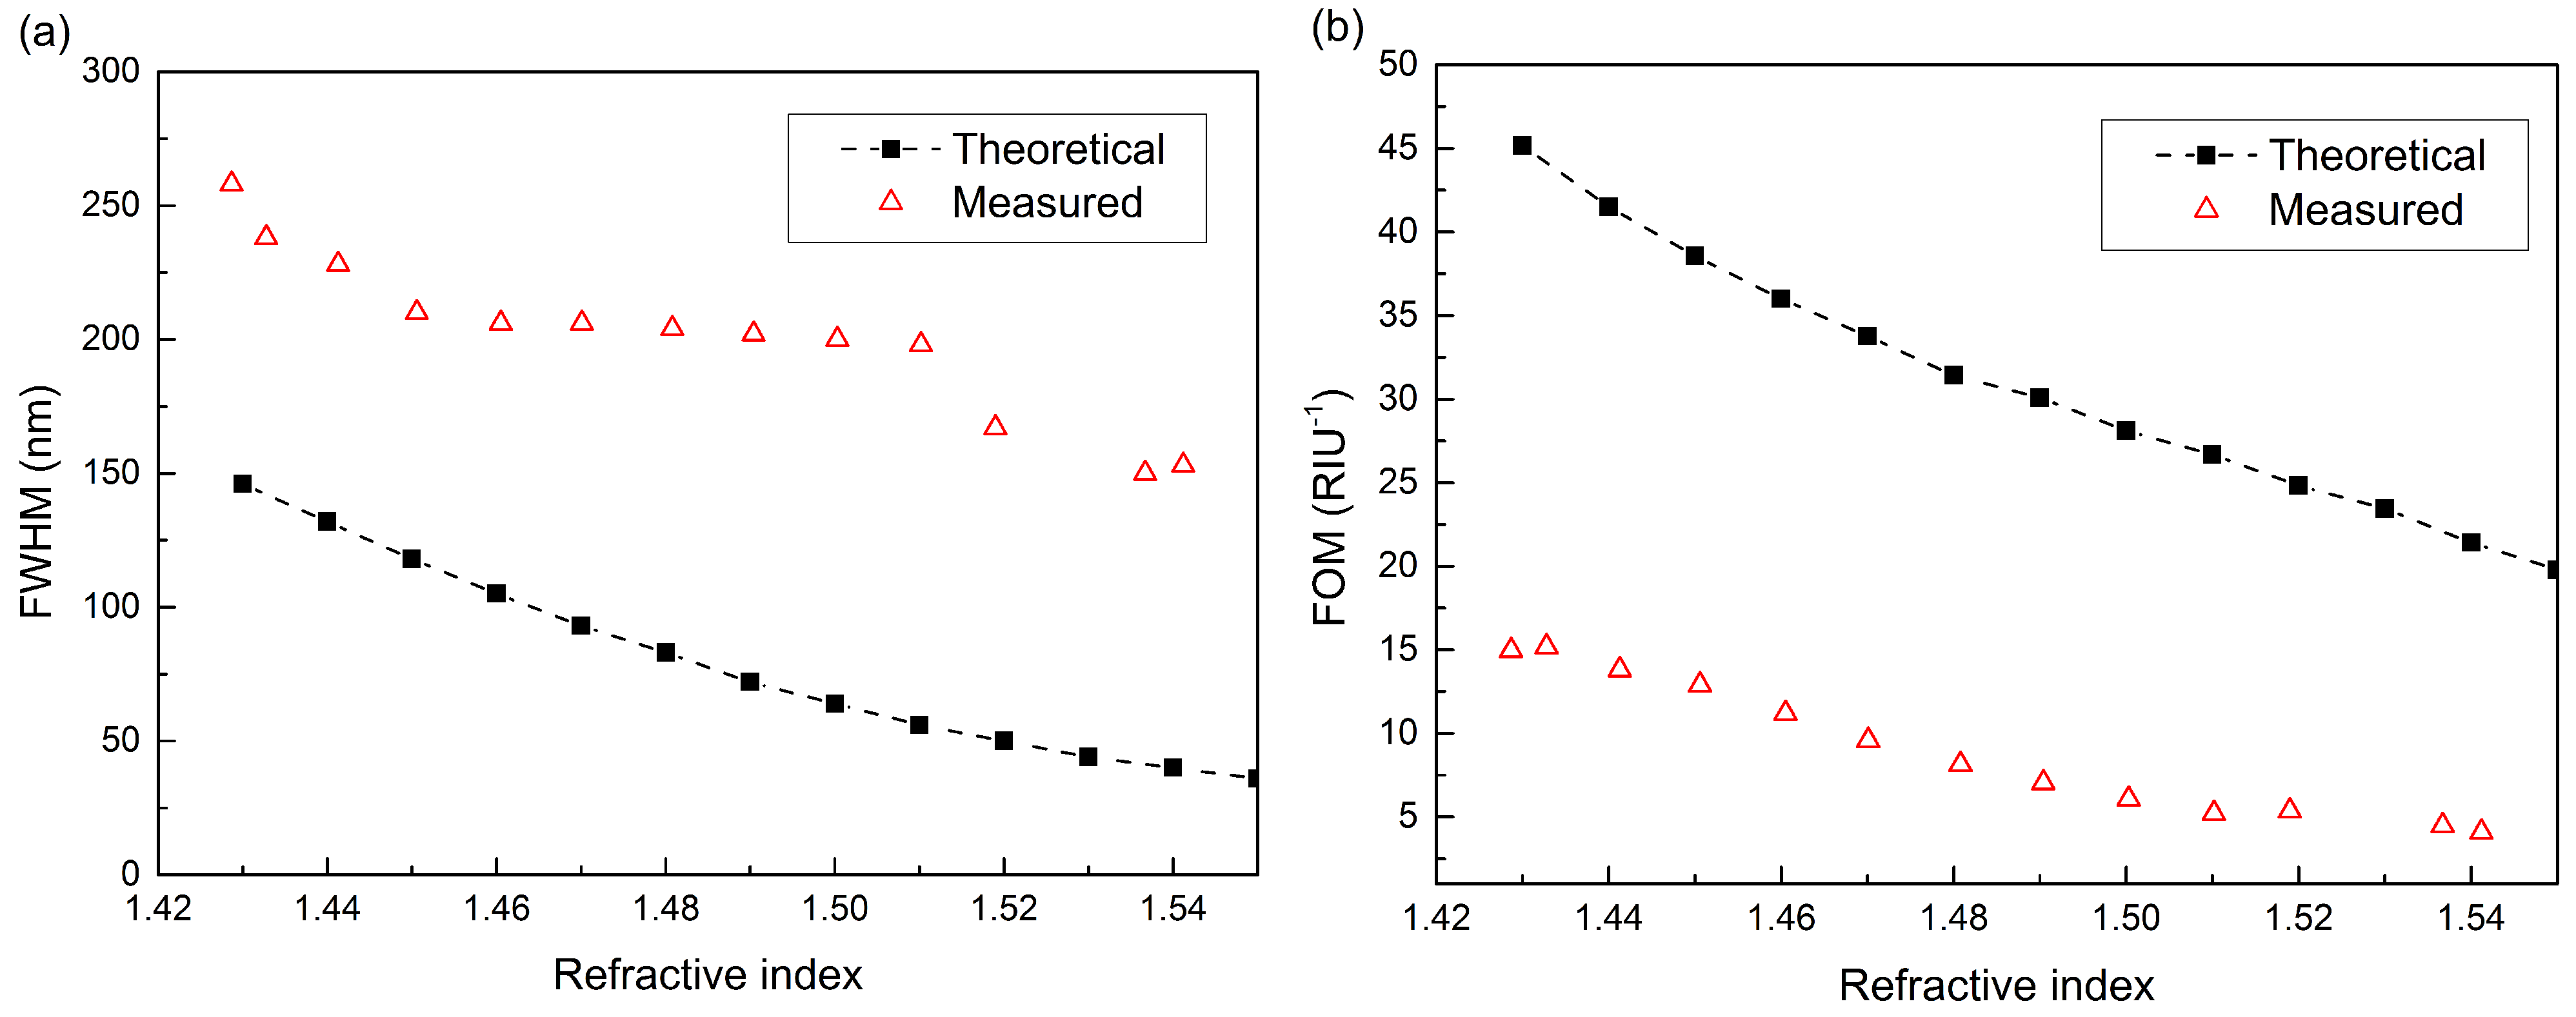
24]. Additionally, the FWHM of the resonance dip is the major factor that affects the detection accuracy. A large FWHM would increase the difficulty to determine the RW accurately and leads to a larger deviation.
Figure 6a shows the FWHMs of the resonance dips for the ETFE HF-SPRS, both theoretically and experimentally. Generally, the experimentally-measured FWHMs are larger than the theoretical data, which could be clearly seen in
Figure 4. The result is consistent with the conclusions in [
14,
15,
25]. Coating with a more uniform silver layer by improving the coating method can decrease the FWHM effectively. Moreover, adopting a light source with a smaller divergence angle will also contribute to a smaller FWHM [
14].
With the FWHM data in
Figure 6a, the FOM of the sensor was calculated with Equation (15) and is shown in
Figure 6b. The experimental FOM decreases gradually from more than 15 to 4 as the sensed RI increases from 1.42 to 1.54. Additionally, it is smaller than the theoretical value because of the larger FWHM.
Figure 6.
Comparison of measured transmission spectra and theoretical results with different ns. (a) FWHM versus ns; (b) figure of merit (FOM) versus ns.
Figure 6.
Comparison of measured transmission spectra and theoretical results with different ns. (a) FWHM versus ns; (b) figure of merit (FOM) versus ns.
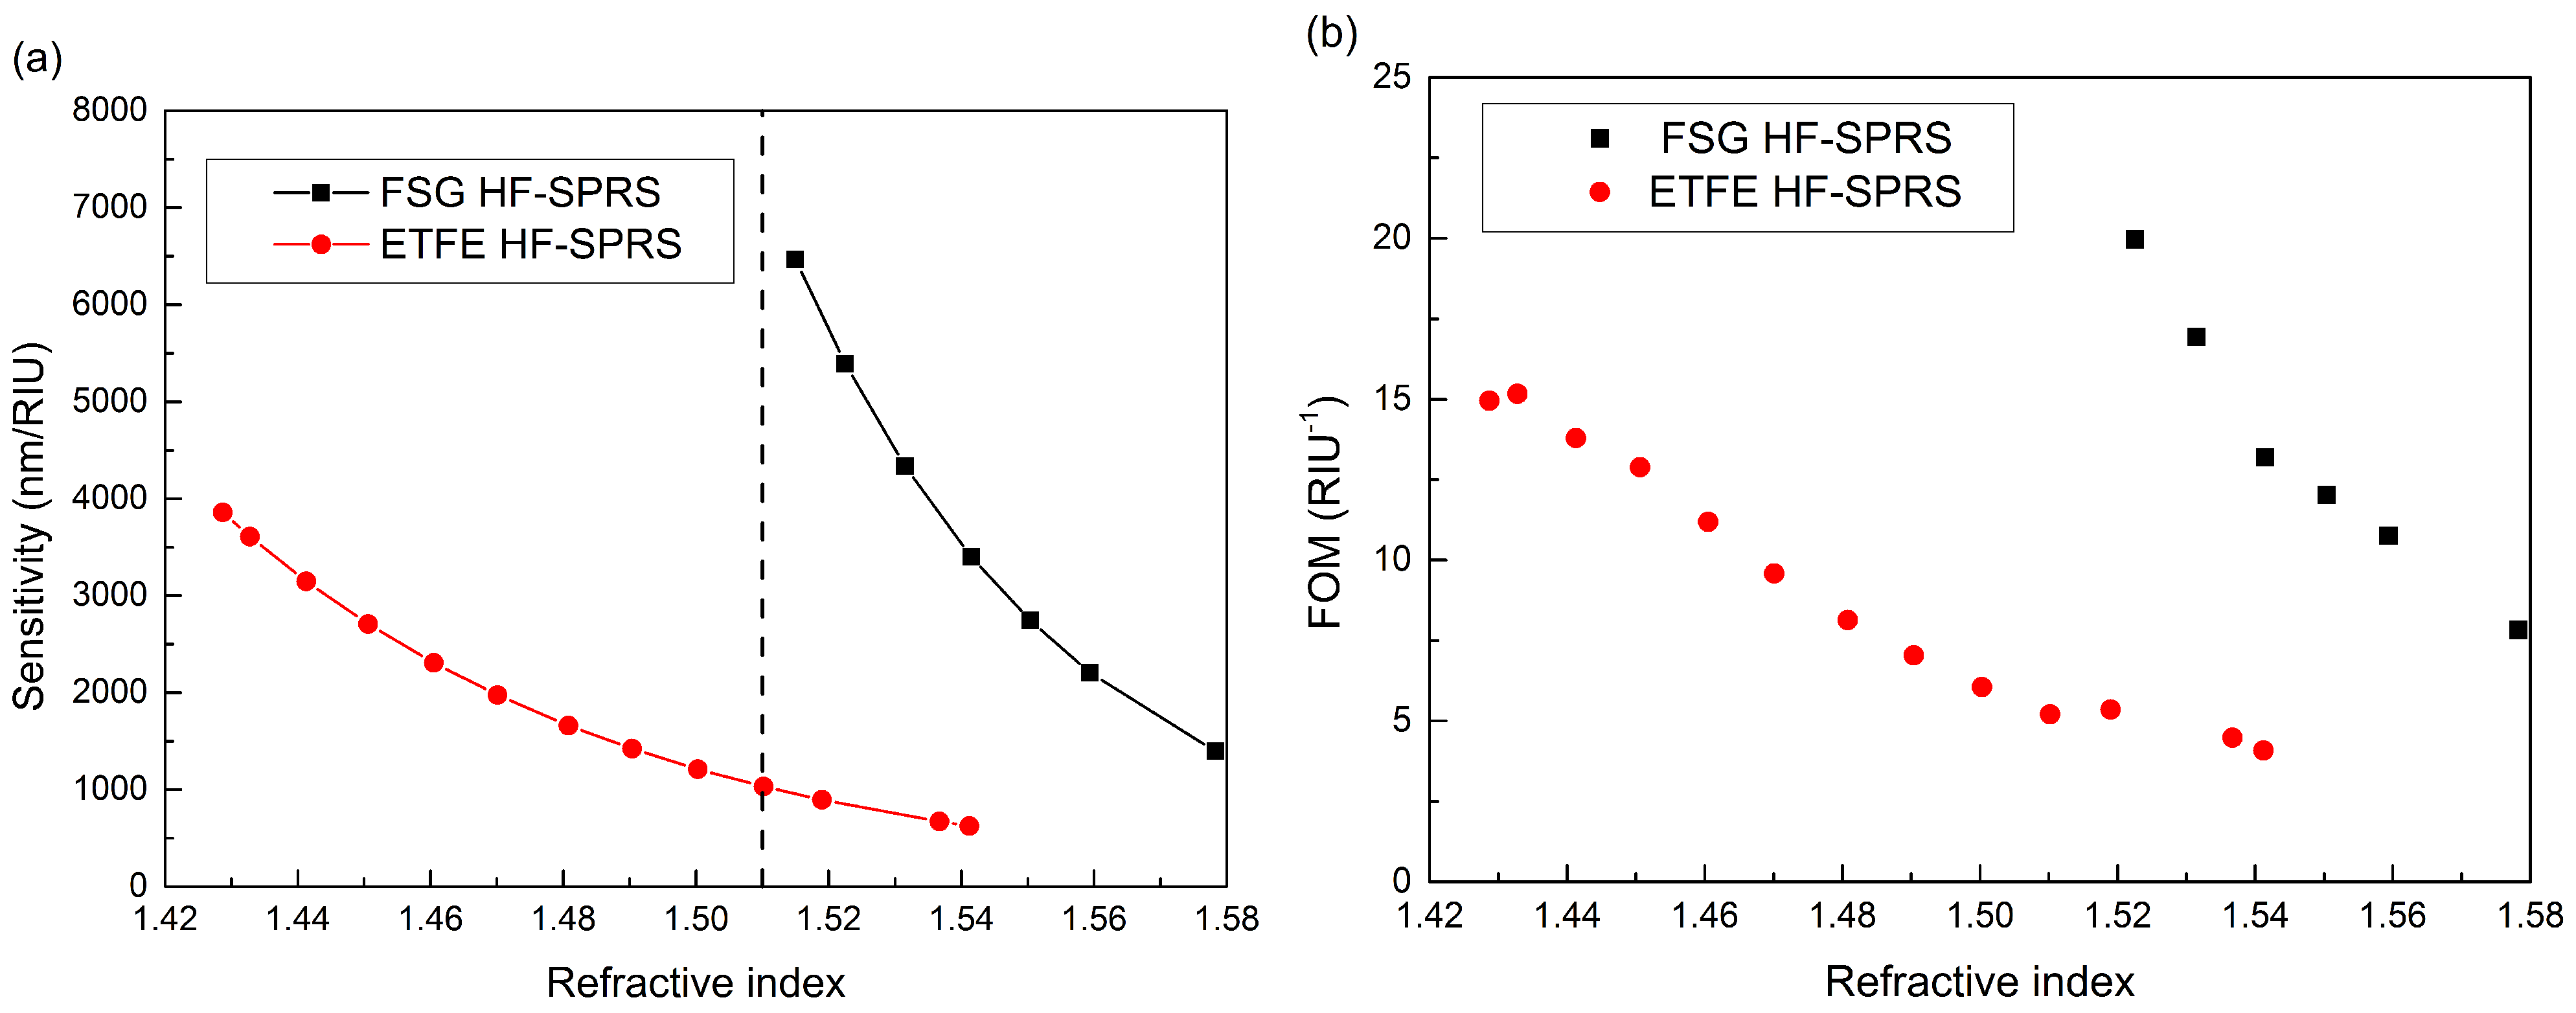
The main contribution of the ETFE HF-SPRS is to extend the lower limit of the RI detection range of HF-SPRS approximately from 1.51 to 1.42. Although the sensor’s detection range can be up to 1.54, its performance decreases quickly as the sensed RI increases. Utilizing the ETFE HF-SPRS in the RI range above 1.51 is not a good choice. Thus, the joint use of both ETFE HF-SPRS and FSG HF-SPRS to get high performance in the whole detection range is optimal.
Figure 7a,b shows the sensitivities and FOMs of both ETFE HF-SPRS and FSG HF-SPRS in the wide RI range from 1.42 to 1.58. The data of the FSG HF-SPRS are from [
14], when the silver layer thickness is 57 nm. If 1.51 is chosen to be the boundary of the detection range of the two sensors,
i.e., using the ETFE HF-SPRS and the FSG HF-SPRS in the RI range below and above 1.51, respectively, we can achieve optimal sensitivities larger than 1000 nm/RIU and FOMs larger than 5 RIU
−1 in the whole RI range above 1.42. The parameter details of both sensors and their joint use are also listed in
Table 1. The sensitivity and FOM ranges listed in the table are the maximum and minimum values of experimental data, but not the exact data corresponding to the upper and lower limits of the RI ranges. Therefore, the joint use of ETFE and FSG HF-SPRSs has a wide detection range and a high sensitivity comparable to the theoretical values reported for cladding-off cylindrical fiber (3000 nm/RIU) [
26], tapered fiber (2700–4900 nm/RIU) [
27], long period grating fiber (817 nm/RIU) [
28] and selected coated photonic crystal fiber (PCF) (maximum of 5500 nm/RIU) [
29]. The hollow core fiber sensor assisted by a fiber Bragg grating can also detect the RI of the sensed medium filled in the hollow core [
30]. This sensor has a lower sensitivity 230 nm/RIU, but a fairly high resolution because of the narrow reflection spectrum of the fiber Bragg grating. However, the sensor is a theoretical model and may encounter some difficulties in fabrication and the injection of the sensed medium, because of its small bore size, which is only several microns.
Figure 7.
(a) Sensitivities of ETFE and FSG HF-SPRS: using the ETFE HF-SPRS and FSG HF-SPRS in the refractive index (RIs) range below and above 1.51, respectively; (b) FOMs versus ns.
Figure 7.
(a) Sensitivities of ETFE and FSG HF-SPRS: using the ETFE HF-SPRS and FSG HF-SPRS in the refractive index (RIs) range below and above 1.51, respectively; (b) FOMs versus ns.
Table 1.
Characteristics of the HF-SPRS.
Table 1.
Characteristics of the HF-SPRS.
| Structure | Wavelength (nm) | RI Detection Range | Sensitivity (nm/RIU) | FOM (RIU−1) |
|---|
| ETFE HF-SPRS | 400 to 800 | 1.42 to 1.54 | 624 to 3858 | 4 to 15 |
| FSG HF-SPRS | 400 to 800 | 1.51 to 1.58 | 1189 to 6607 | 12 to 25 |
| ETFE and FSG | 400 to 800 | 1.42 to 1.58 | 1031 to 6607 | 5 to 25 |


