Investigation on Dynamic Calibration for an Optical-Fiber Solids Concentration Probe in Gas-Solid Two-Phase Flows

Abstract
: This paper presents a review and analysis of the research that has been carried out on dynamic calibration for optical-fiber solids concentration probes. An introduction to the optical-fiber solids concentration probe was given. Different calibration methods of optical-fiber solids concentration probes reported in the literature were reviewed. In addition, a reflection-type optical-fiber solids concentration probe was uniquely calibrated at nearly full range of the solids concentration from 0 to packed bed concentration. The effects of particle properties (particle size, sphericity and color) on the calibration results were comprehensively investigated. The results show that the output voltage has a tendency to increase with the decreasing particle size, and the effect of particle color on calibration result is more predominant than that of sphericity.1. Introduction
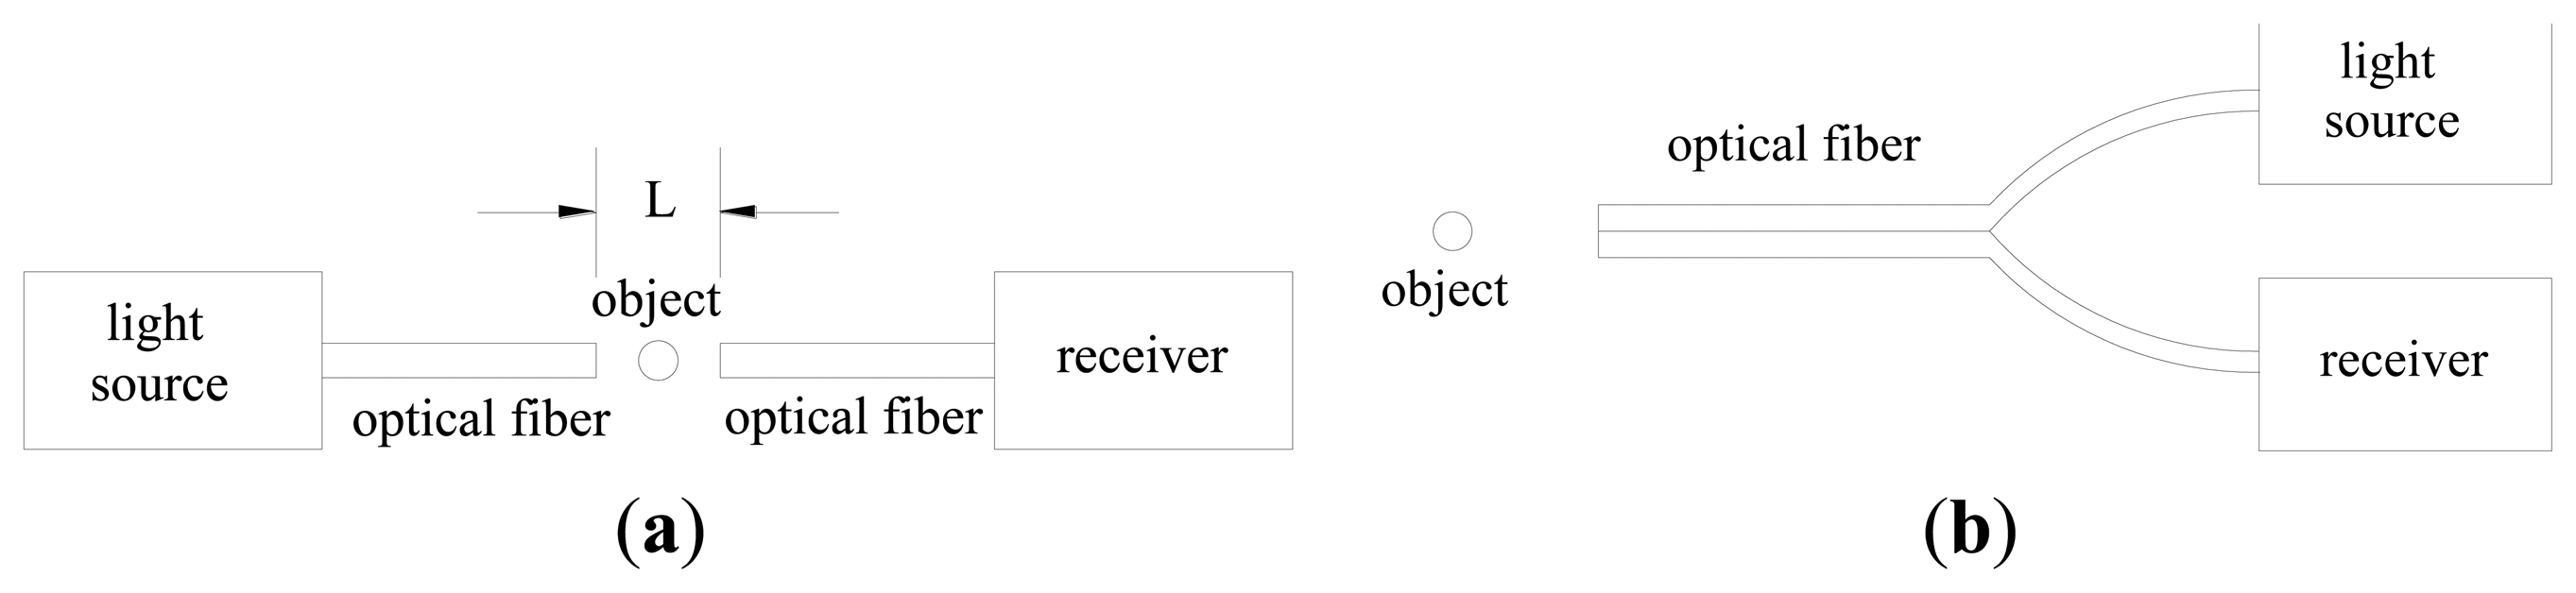
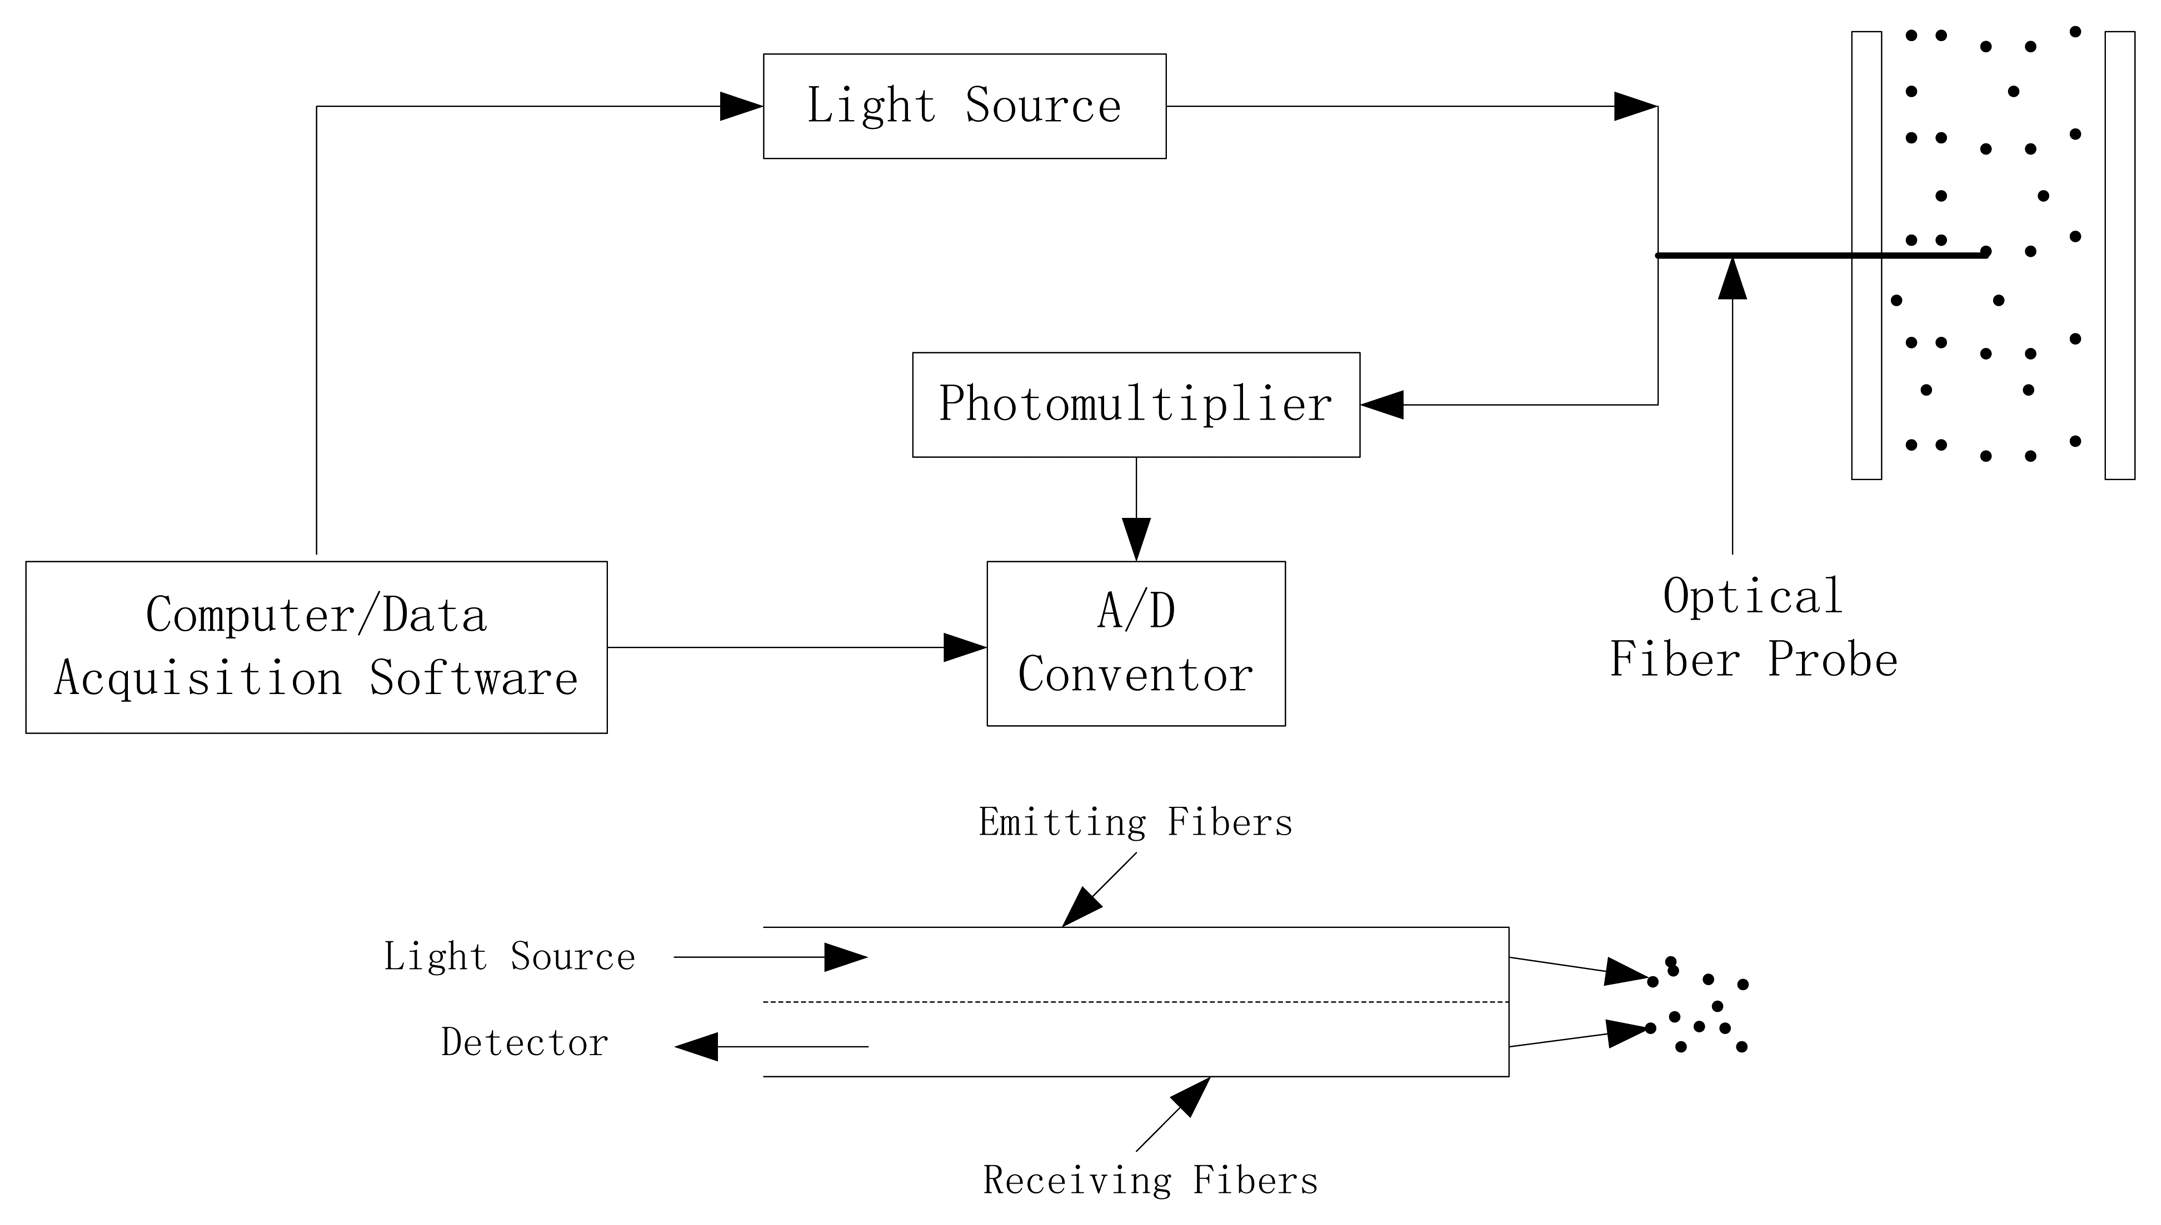
The measurements of solids concentration are essential to understand the gas-solid flow behavior in fluidized beds, blow tanks, pneumatic conveying lines, and other multiphase flow systems. A detailed knowledge of solids concentration profile is critical to the accurate design and valid modeling of these systems. Many techniques have been carried out for measuring solids concentration: X-ray or γ-ray absorption, laser Doppler anemometry, acoustics methods, capacitance probes, optical-fiber probes, and so on [1-7]. Optical-fiber probes have been widely used in recent years for the determination of velocity and concentration of particles in gas-solid flow systems [1-3,8-17], which have the advantages of high sensitivity, fast response, high signal-to-noise ratio, large dynamic range, small volume and light weight, fire and shock resistance and corrosion proof, freedom from disturbance by temperature, humidity, electrostatics and electromagnetic fields, and suitability for remote transmission and multi-channel detection. The application of optical-fiber probes to the solids concentration measurement is based on the principle that the particles in the fluid produce scattering of incident light [18]. There are two different arrangements of optical-fiber probes [19]: transmission-type probe and reflection-type probe, as shown in Figure 1.
As for the transmission-type probe, which is based on the forward scattering of particles against the incident light, the object to be measured is located between the two probe tips and the light input and output are coaxial. The effective measurement volume is dependent on the distance between the two probe tips L, diameter and numerical aperture of the probe. The output signal is independent of the chromaticness of particles, which means that a single white or black particle may produce the same output signals. As for the reflection-type probe, which is based on the back scattering of incident light by particles, it has only one tip, where the projecting and receiving fibers are intermingled or in rows, in parallel or crossed. The effective measurement volume is dependent on the diameter, numerical aperture, overlap region of the capture angles and the optic sensitivity of the photoelectric converter. The output signals depend on the chromaticness and reflectivity of the particles [18]. The transmission-type probe is restricted to relatively low solids concentration and considered to cause strong disturbance of the flow structure compared to the reflection-type probe [13,20]. The reflection-type probe may be used over the entire range of particle concentration, from extremely dilute flows to the fixed bed state [21]. Thus, more attention has been paid to the reflection-type optical-fiber probe.
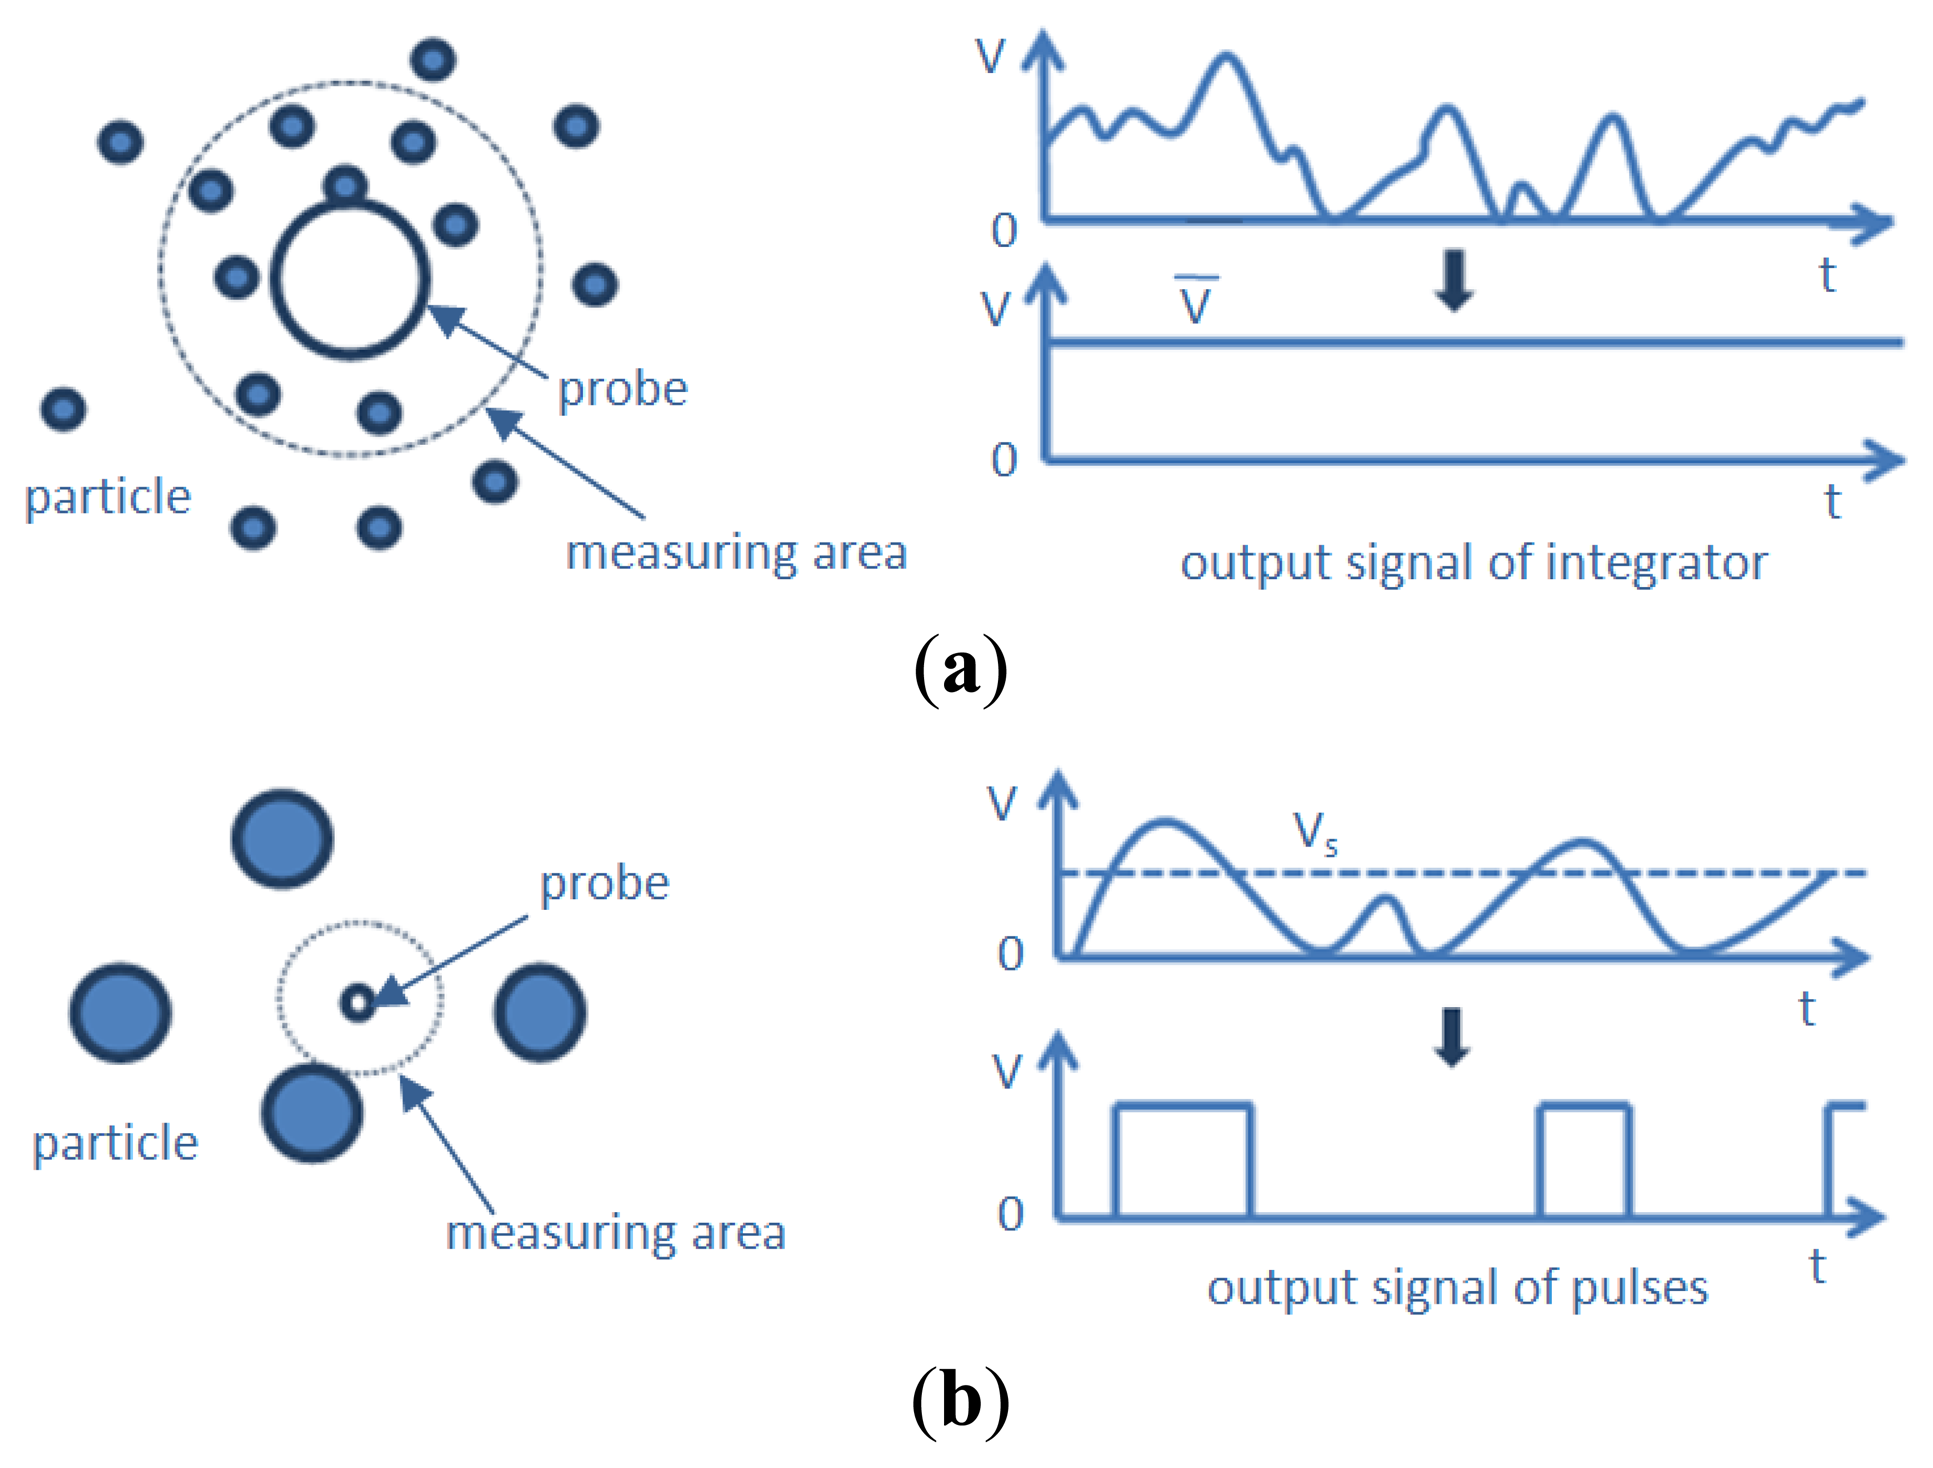
According to the ratio of particle diameter to fiber diameter, Matsuno et al. [19] classified the reflection-type probes into two categories. Figure 2a shows the optical-fiber probe with fiber diameter larger than particle diameter, the output signals are all generated by the reflected light from the particles existing within the measuring area. The integrated values of the output signal can be correlated with the particle concentration by any calibration method, and the instantaneous concentration can be obtained. Figure 2b shows the optical-fiber probe with fiber diameter smaller than the particle diameter. The output signals from the light receiver are converted into pulses at some threshold level Vs, and the pulse count corresponds to the number of particles. The particle velocity must be known in order to convert pulses to concentration. Only the average concentration can be measured if the flow field fluctuates.
For the measurement of solids concentration, the emitted light reflected by the moving particles is magnified by a photo-multiplier and converted into voltage signals. The optical-fiber solids concentration probe should be calibrated to obtain a relationship between the output voltages and the solids concentration, which depends on the particle size distribution, concentration and optical properties of the solids and the surrounding fluid. The reliability of the measurements is strongly affected by the accuracy of the calibration method [9,16,21,23]. Calibration of a probe is finding a calibration curve with experiments and computations to convert the voltage time series into solids concentration time series [24]. The appropriate calibration method must be suitable for a wide range of solids concentrations from very low concentrations up to the solids concentrations of a packed bed [14]. However, it is difficult to generate a reference suspension of particles with a given concentration, and it is nearly impossible to produce a homogeneous gas-solid flow. Thus, calibration has become a problem.
The output signals of the reflection-type probe depend, to a large extent, on the aforementioned chromaticness of the particles, and the intensity of reflected light of white and black particles of the same diameter may differ by several times, and the roughness of particle surfaces may also have a similar influence [18]. Consequently, a calibration is required for each kind of particle. Very few studies have been carried out with regard to the effects of particle properties on the calibration curve of an optical-fiber solids concentration probe systematically and comprehensively, hindering the progress on the accurate calibration of the optical-fiber solids concentration probes.
The objective of this paper is to carry out investigation on dynamic calibration for an optical-fiber solids concentration probe in gas-solid two-phase flows. The remainder of this paper is organized as follows: a brief review of existing techniques for the calibration of optical-fiber solids concentration probes has been presented in Section 2. From the literature survey, it can be concluded that satisfactory calibration procedures are lacking in the literature and the calibration methods mainly focus on the low solids concentration. Thus, a calibration method, which is capable of calibrating the optical-fiber at nearly full range of the solids concentrations from 0 to packed bed concentration, is proposed. We combined the calibration method proposed by Hong et al. [23] with the calibration method used by Qi et al. [24]. The detailed experimental setup and calibration procedures are described in Section 3. With this combined method, the probe was uniquely calibrated with two kinds of powders. Finally, the calibration results are discussed and summarized in Section 4. The effects of particle properties on the calibration curve were also investigated.
2. Literature Survey
Both the transmission-type probe and the reflection-type probe needed to be calibrated for their measuring range before using them for the solids concentration measurement. Several techniques for the calibration of optical-fiber probes have been developed.
Matsuno et al. [19] calibrated the optical-fiber probe containing a pair of bundles of two small plastic optical fibers by employing the free-falling particles at their terminal velocities after having travelled a certain distance. The particles were poured through a vibrating sieve at a sufficient height to fall at a uniform velocity. The particle concentration was varied by changing the weight of particle on the sieve which was located at the top of the system and also by using sieves of different apertures. The probe was set at a height sufficiently below the sieve. The solids concentration was calculated with the following equation:
Cutolo et al. [15] calibrated his probe with an apparatus consisted of a solids feed hopper and a 41 mm i.d. and 1 m high Plexiglas pipe. The particles were charged into the hopper and fell downward through a series of nets which acted as a solids distributor. The solids flow rate was regulated by the number of nets and their meshes. Measurement was made throughout the pipe core at a distance from the axis from -15 mm to +15 mm. A smaller tube with 33 mm i.d. was coaxially positioned at the bottom of the high pipe, which allowed the separation of solids falling along the walls of the larger tube. A collecting vessel placed on a balance was located below the apparatus. The average solids concentration es,v in the pipe of cross section A could be calculated with the following expression:
Lischer and Louge [20] calibrated the optical-fiber probe used for measuring the particle volume fraction in dense suspensions against a quantitative capacitance probe. The material used was poured randomly along the probe assembly, which was mounted flush with the inside wall of a pipe that had a 15 cm i.d. They found that in a practical system, such regular calibration may be mandated by long-term variations of the average backscattered signal caused by subtle changes in the optical alignment or the quality of the fiber tip exposed to the particle suspension. However, the values from the optical-fiber probe and the capacitance probe didn't agree well.
Yamazaki et al. [25] carried out calibration experiments in a flat-bottomed cylindrical tank of 6.0 cm diameter. A known mass of solids was charged into a tank filled with water. After a steady state suspension was reached, the intensity of reflected light from the solids particles was measured by immersing the probe at various angular positions in the stirred tank. The light reflected from the solid particles in the solids-liquid mixtures had been measured in the range of solids concentration from 5% to 40% by volume. The axial concentration profiles at different radial positions agreed well, which implied that a homogeneous suspension of solids in the radial direction could be obtained by this method. It was found that measureable range for solids concentration was affected by particle species, particle diameter, particle shape, and particle color, variations in the refractive index of particles and continuous phase.
Zhou et al. [26] calibrated their optical-fiber solids concentration probe in two liquid-solid systems. For voidages less than 0.8, the calibration was carried out in a liquid-solid fluidized bed for the reason that particles were quite uniformly distributed in such a system. The solids concentration could be obtained with the following expression:
Herbert et al. [21] calibrated a single-fiber optical reflection-type probe with a technique similar to that used by Cutolo et al. [15]. They established a stable downward flow of particles at a known velocity and in a column small enough so that a local measurement could yield a cross-sectional average value. The particles flowed from a fluidized bed feeder with a diameter of 12.5 cm, through an orifice in the center of the porous metal grid into a tube of square cross-section 8 × 8 mm, then fell 2.5 m into a collection pot. The particle flow rate from the fluidized bed could be kept stable by changing the orifice diameter. The average solids concentration could be calculated with the following expression:
Hong et al. [23] developed a method for calibrating the optical-fiber probe using a polynomial regression to correlate the output signal with the solids volume concentration in the fluidized calibration vessel. Solid particles of mass Ws were placed in the fluidized vessel made of transparent glass and then fluidized to the full vessel volume after closing the top end of the vessel with a filter screen. The overall volume concentration of solids within the full vessel could be calculated with the following expression:
San José et al. [28] calibrated the optical-fiber probe used for voidage measurement of a conical spouted bed. For the spout zone, the calibration was carried out in a 60 mm i.d. column, where the probe had been introduced at a given level. The solid was fed by a hopper to the column. A linear relationship between the intensity of the reflected light and the volume fraction of the bed occupied by the particles, 1 − ε, was obtained. Bed voidage, ε, which was changed by adjusting the solid mass flow rate in the feed, Q, could be calculated with the following expression:
Zhang et al. [27] proposed a back pressure control method to calibrate a multi-fiber optical reflection probe in a downer to obtain quantitatively precise solids concentration. The calibration apparatus was similar to that of Herbert et al. [21], and the significant improvement was adding a back pressure control system by sealing the bottom collection vessel. By using quick closing valves [1], the particles were trapped to determine various solids concentrations to compare with the data obtained with optical-fiber probe. The solids concentration could be obtained as large as 0.56 because the increase of the back pressure decreased the particle velocity and increased the solids concentration. Meanwhile, an iteration procedure was employed to modify the initial calibration curves. They also found that the probes were sensitive to minor variations of particle color and reflective properties. However, the flow was not entirely radial uniform even by using a vibrator to distribute the particles in the downer, which would cause calibration errors.
Johnsson et al. [29] carried out calibration experiments of an optical-fiber probe in a cold CFB riser, and compared the output signals with those obtained by an optical reference probe, which was calibrated with a guarded capacitance probe. The guarded capacitance probe was calibrated from measurements in a packed bed. They found that the reference probe and the optical-fiber probe gave similar response in amplitude and frequency with respect to variations in solids volume-fraction. The shape of the calibration function of the reference probe was also valid for the optical-fiber probe. The calibration and the reference measurement were carried out at ambient conditions, while the measurements were done at 850 °C with the assumption that the shape of the calibration function obtained under ambient condition was valid at elevated temperatures. They believed that it was a reasonable assumption because the shape of the calibration function depended on the optical properties of the probe and not on the temperature of the gas and particles.
Cui et al. [30] suggested a novel calibration method and correlation for different optical-fiber probes. They made a series of uniform mixture samples of FCC and amorphous transparent polystyrene by blending the two materials in a Brabender mixer at 200 ° C, shaped the samples into a cubic form in a size of 20 mm, and finally polished them to attain good optical properties. For different samples, the FCC particle concentration varied from 0 to that of the minimum fluidization state. The mixtures were used to simulate gas-solid flow systems with different solids concentrations, in which the transparent polystyrene was seen as air. The transparent polystyrene had refractive index higher than that of air. They found that the cross probe and parallel probes with glass window had similar calibration curves. The output voltages of the probe increased sharply with increasing solids concentration at low concentration but increased slowly at high solids concentration. This method is very interesting and novel. The probes were calibrated with a homogeneous dispersion of solids in the polymer-solid cubes with different and exact solids concentrations which is representative of different solids concentrations inside the gas-solid fluidized bed.
Rundqvist et al. [10] proposed an improvement in the design of a dual optical-fiber probe as well as a general calibration theory. They calibrated the probes in a small stirred tank filled with water, and a controlled mass of particles was added. The results of their calibration experiments showed some discrepancies relative to theoretical calibrations. A disproportional fraction of the particles were observed to reside close to the walls and the bottom of the calibrating vessel, which hindered the calibration experiments, leading to lower volume fractions than expected and offered a possible explanation to the above mentioned discrepancies. It was concluded that the calibration theory scaled well with probe size, particle size and particle volume fraction, although the exact shape of the calibration function could not be verified exactly.
Liu et al. [22,31] calibrated three-fiber optical probes with two units. The first was a dropping/trapping technique [32]. Particles fall into a collection vessel from an incipiently fluidized bed through a short tube located in the center of a punched plate distributor covered with fine wire mesh into a 12 mm i.d. tube. After a steady flow was obtained, two slide plates located 32 mm apart were closed quickly and simultaneously to trap the particles in a section of pipe where the probe inserted. By using different sizes of feeding tube and the flow rate of aeration air, different solids concentration could be obtained. The second was to obtain a water-FCC suspension in a well-stirred beaker. The probe with and without the quartz glass window was calibrated using both the two calibration units, and the results were compared with simulation predictions. The simulation results were in good agreement with the calibration results. They found that without the glass window, the calibration curves were highly nonlinear, which meant that the protective window could improve the linearity of the calibration curve. They also suggested that one should not directly apply calibrations obtained in liquids to calibrate probes for gas-solids systems.
Magnusson et al. [33] calibrated a dual fiber-optical probe based on the calibration theory proposed by Rundqvist et al. [10] in a circulating fluidized bed, for the reason that circulating fluidized beds provide a wide range of flow conditions and solids volume fractions. The particle volume fractions measured by the optical-fiber probe were compared to the pressure drop measured for a range of operation conditions. The relation between the pressure drop and the solids volume fraction could be expressed as follows:
As can be seen from the literature review above, most of the researchers performed their calibration procedure and obtained specific kind of calibration curve, either linear or non-linear. All the calibration procedures were established by comparing the optical-fiber probe output signals to the concentration values obtained by the traditional methods for direct measurement of solids concentration, which could be mainly divided into three categories. The first is to use quick closing valves [1], with which the column to be studied can be positioned in sections of suitable length. The two valves were used to trap the solids within the desired section of the downer. After a certain period of time, the valves were closed simultaneously. The solids contained in the section can be collected and weighed, thus the solids concentration may be determined. This method was used by Zhang et al. [27] and Issangya et al. [32]. The second is to measure the pressure drop over a certain section of a riser tube, and the Bernoulli equation neglecting wall friction and acceleration forces was solved for solids concentration. This method was adopted by Magnusson et al. [33]. The third is to build a stable downward flow system with particle density deduced from mass flux of particles and measurement where phase velocities were nearly equal [18]. This method was widely used by researchers with appropriate modifications, like Matsuno et al. [19], Cutolo et al. [15], Lischer and Louge [20], Herbert et al. [21] and so on. In addition, liquid fluidized beds had been used by some investigators with the purpose to overcome the difficulty of obtaining stable suspensions of solids in gases, like Yamazaki et al. [25], Zhou et al. [26], Rundqvist et al. [10], and Liu et al. [22,31]. However, it is worthwhile to mention that the validity of such a calibration in gaseous suspensions is questionable due to the differences in the refractive index between gases and liquids [13], and the probes should be calibrated in the same medium for which they will be utilized. Different calibration methods used by researchers are summarized in Table 1.
The accuracy of solids concentration measurement by using an optical-fiber solids concentration probe is strongly dependent on the precision of the calibration technique utilized. The calibration of optical-fiber solids concentration probe in gas-solid environment is challenging due to the heterogeneity and instability of gas-solids flow. It is difficult to offer a series of standard gas-solid flow covering solids concentrations from 0 to packed bed. Because it is rather difficult to maintain a homogeneous gas-solids flow at high solids concentrations, the majority of calibration methods developed to date are focused on obtaining relatively homogeneous gas-solids flow at low solids concentrations. When applying them to the practical measurements, the calibration methods may be inaccurate or problematic. There are no widely-accepted calibration methods which cover a wide range of solids concentrations up to now. Thus, a feasible and simple method for the calibration of optical-fiber solids concentration probe which could solve the above mentioned questions of the existing calibration methods is urgently needed to be developed. More research on the calibration of optical-fiber solids concentration probe, especially experimental, is still required.
3. Experiment Setup and Calibration Procedure
This study utilized a model PC6M optical-fiber solids concentration probe which was developed by the Institute of Process Engineering, Chinese Academy of Science, Beijing, China. This measurement system was composed of PC6M concentration measurement main unit, optical-fiber probes, and the signal cable, A/D converter and application software. The probe tip is 4 mm in diameter and contains approximately 8,000 emitting and receiving quartz fibers, each of a diameter of about 25 μm. These fibers are arranged in an alternating array, corresponding to emitting and receiving layers of fibers. The active area, where the fibers are located, is approximately 2 mm × 2 mm. The fiber tips are protected from the material by a glass window with thickness of 0.2 mm. The received light reflected by the particles is multiplied by the photo-multiplier and converted into a voltage signal. The voltage signal is further amplified and fed into a computer. The high voltage adjustment is used to adjust the upper measuring limit or full scale of the instrument. There is a zero voltage potentiometer which adjusts the output signal to zero when no powder is on the tip of the probe, thus the offsets of PC6M were set at zero with empty black box and the gains roughly at 4.5 V with packed box (less than the full range of 5 V), making the calibration procedure respond to most of possible particle concentrations. In order to make the day-to-day measurement comparable, the lamp voltage which sets the power voltage of the light source, and the gain factor should be kept constant during the calibration procedures [27]. Figure 3 shows the schematic diagram of the optical-fiber probe system.
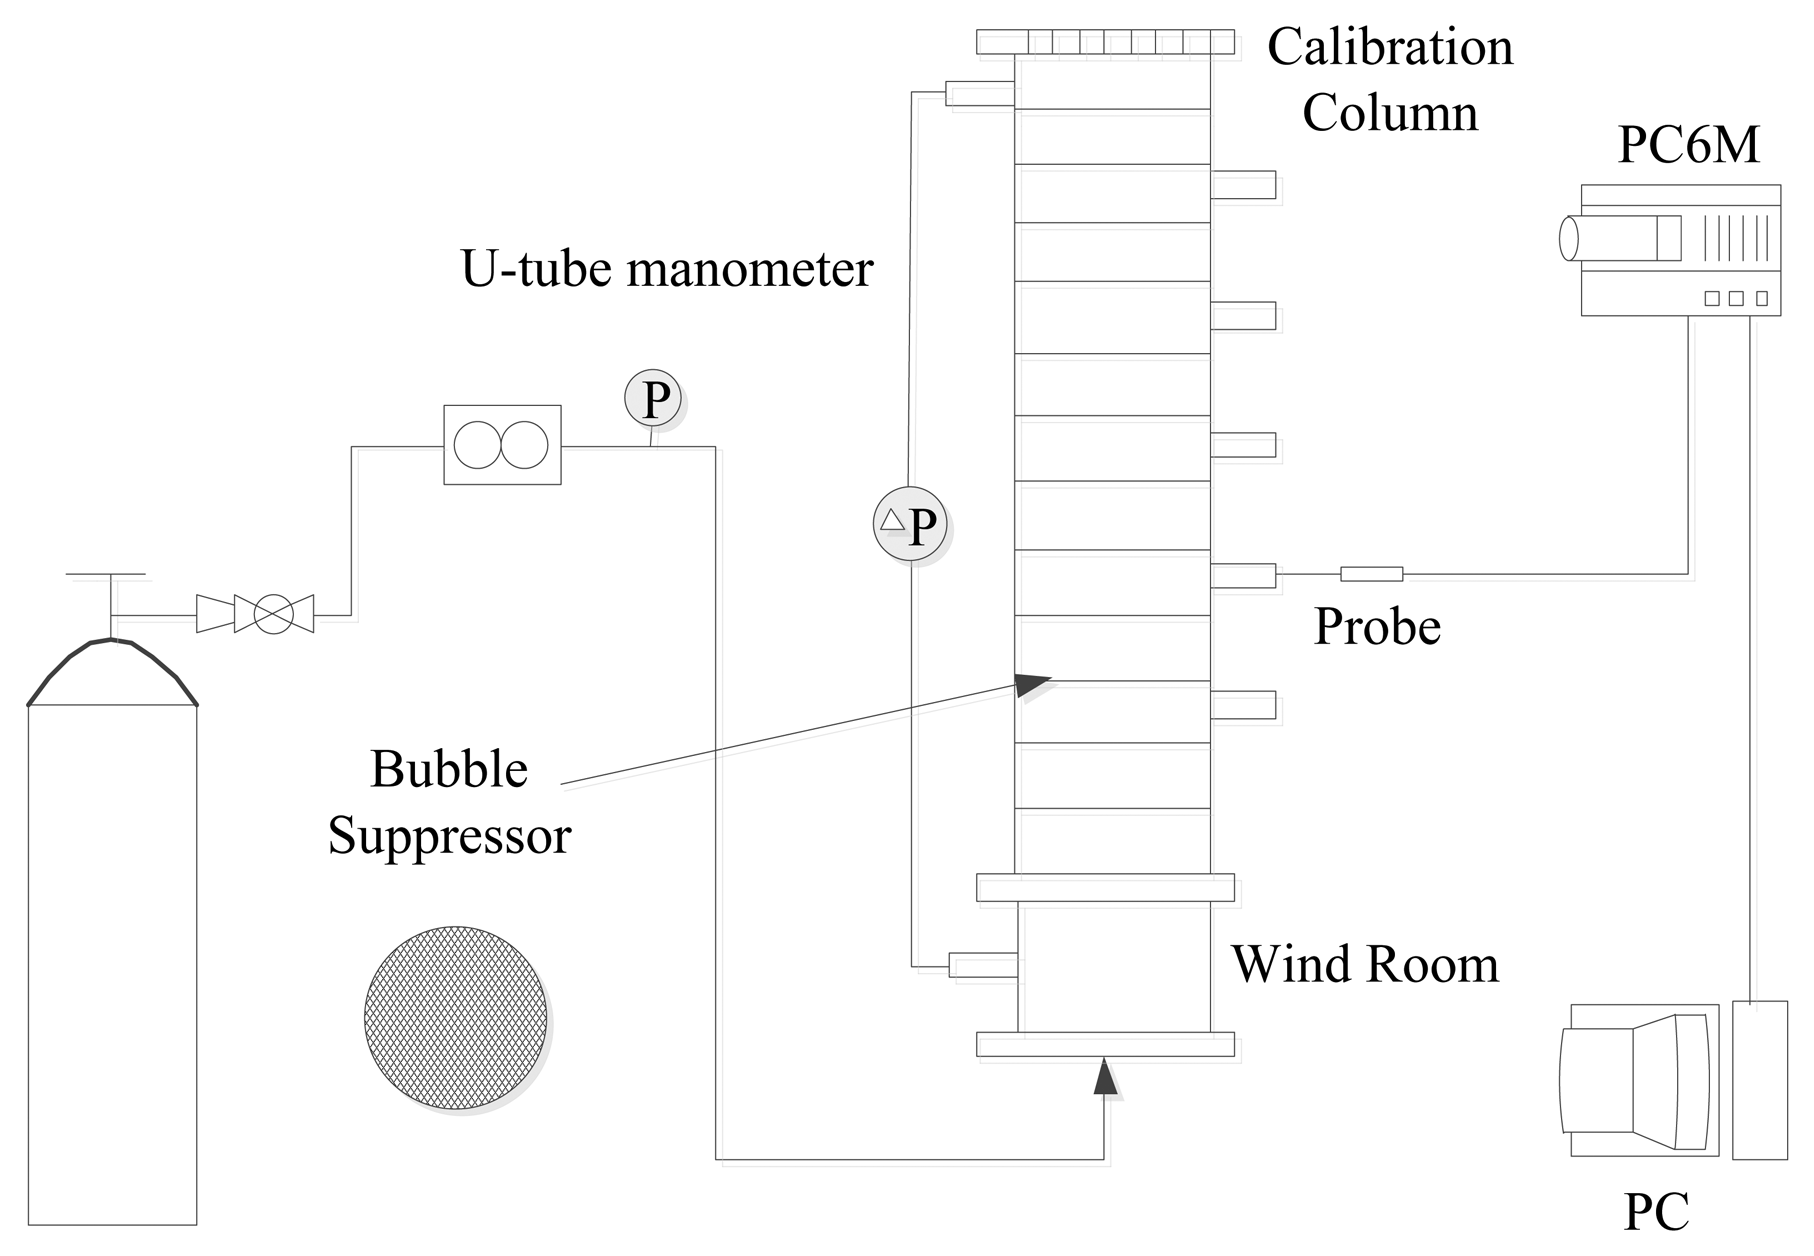
A Plexiglas column was used to calibrate the probes. As shown in Figure 4, the column is 50 mm in diameter and 300 mm high. A perforated Plexiglas plate covered with fine screens was employed as the gas distributor. Optical-fiber probes were installed along the column with their tips located on the axis of the column. Two pressure taps, one at the wind room and the other at the exit section of the column were provided to record the pressure drops. Pressure drop was measured by a 1 m long U-tube manometer, and water was used as the manometric fluid. The fluidizing gas was supplied by a nitrogen cylinder to the wind room which is 50 mm in diameter and 100 mm in length below the gas distributor. Bubble suppressor was installed in the calibration column, which contained a set of metal meshes with 25 mm axial pitches, the diameter of the metal mesh was 45 mm and the opening of each metal mesh was 3 mm × 3 mm with 0.5 mm steel wire. The top end of the column was covered with a filter screen to prevent the fine particles escaping from the column. Meanwhile, all metal portions of the whole calibration apparatus were carefully connected and grounded to eliminate static electricity effect.
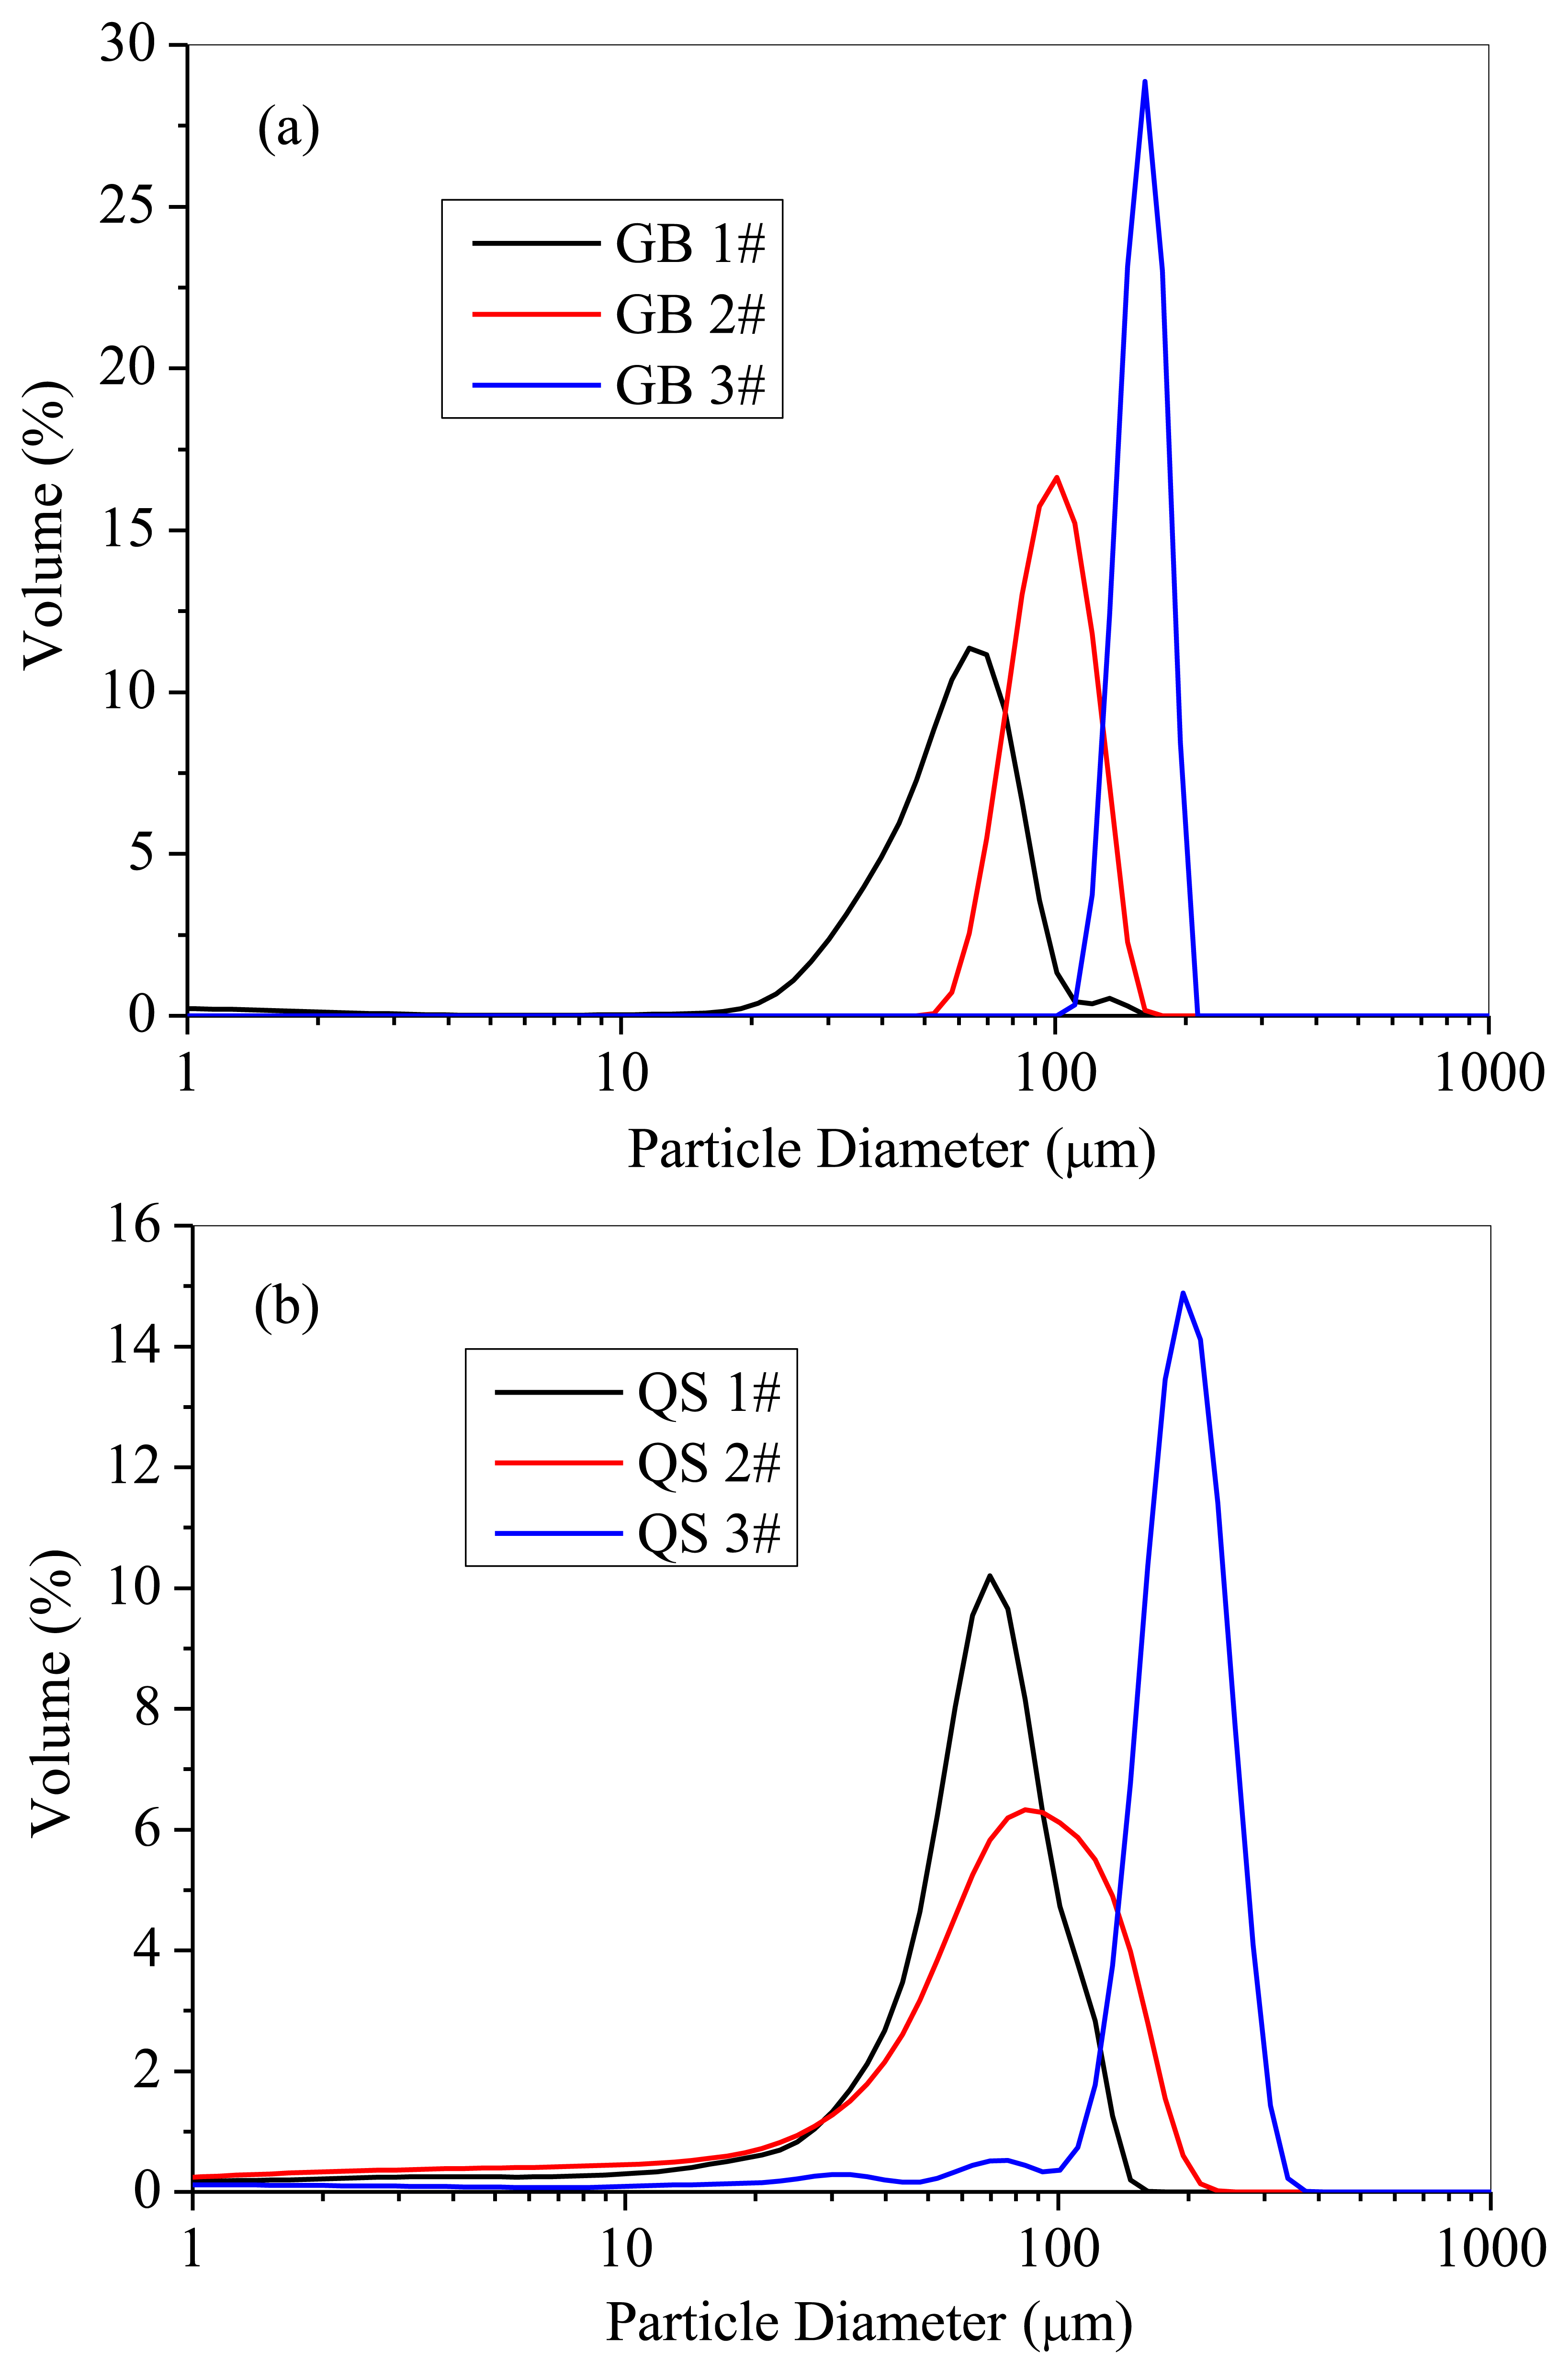
Glass beads and quartz sand were used to investigate the particle properties. Both of the two powders were sieved into three narrow distribution parts, and their physical properties are listed in Table 2. The particle size distributions were measured with a laser particle analyzer (LS, Beckman Coulter Inc., Brea, CA, USA), as shown in Figure 5. Because the particle diameter is much smaller than the bundle diameter, light is reflected by the particles in the measurement volume, allowing the probe to detect to measure the solids concentration.
The novel calibration procedure in the present study are consisted of two parts: one for high solids concentration (Method I) and the other for low solids concentration (Method II). The calibration procedure for high solids concentrations was similar to that of Qi [24] used a Pseudo Bubble-Free Fluidized Bed (PBFF). The powder was filled into the column with an initial bed height of about 100 mm, then fluidized by the fluidizing gas and was better distributed throughout the column with the assistance of bubble suppressors compared to without the installing of bubble suppressors.
During the calibration process, the optical-fiber probe was inserted into the column center between two successive bubble suppressor plates. The experiments were carried out under different ratio of H/Hmf, where Hmf is the bed height at minimum fluidization state and H is the bed height under other fluidizing gas flow rate. The solids concentration could be calculated according to the following equation:
From the results obtained by this paper, this kind of calibration procedure was limited to solids concentration higher than 0.2. Thus, for the low solids concentration, the calibration data was obtained with the method similar to Hong et al. [23] and the detail procedures were with reference to Wang et al. [34]. All the calibration experiments were repeated 6 times under the same condition for the accuracy of the reproducibility. To minimize the influence of fine particles adhering to the tip surface of the probe on the calibration, particularly at the relatively high concentration, the optical-fiber probe was removed for cleaning of its surface for every test. In order to avoid the effect of any outside light source, the calibration column was covered with black cloth after fluidization of the solids particles. The sampling rate of the optical-fiber probe was 1 kHz and the sampling time approximately 4 s.
4. Results and Discussion
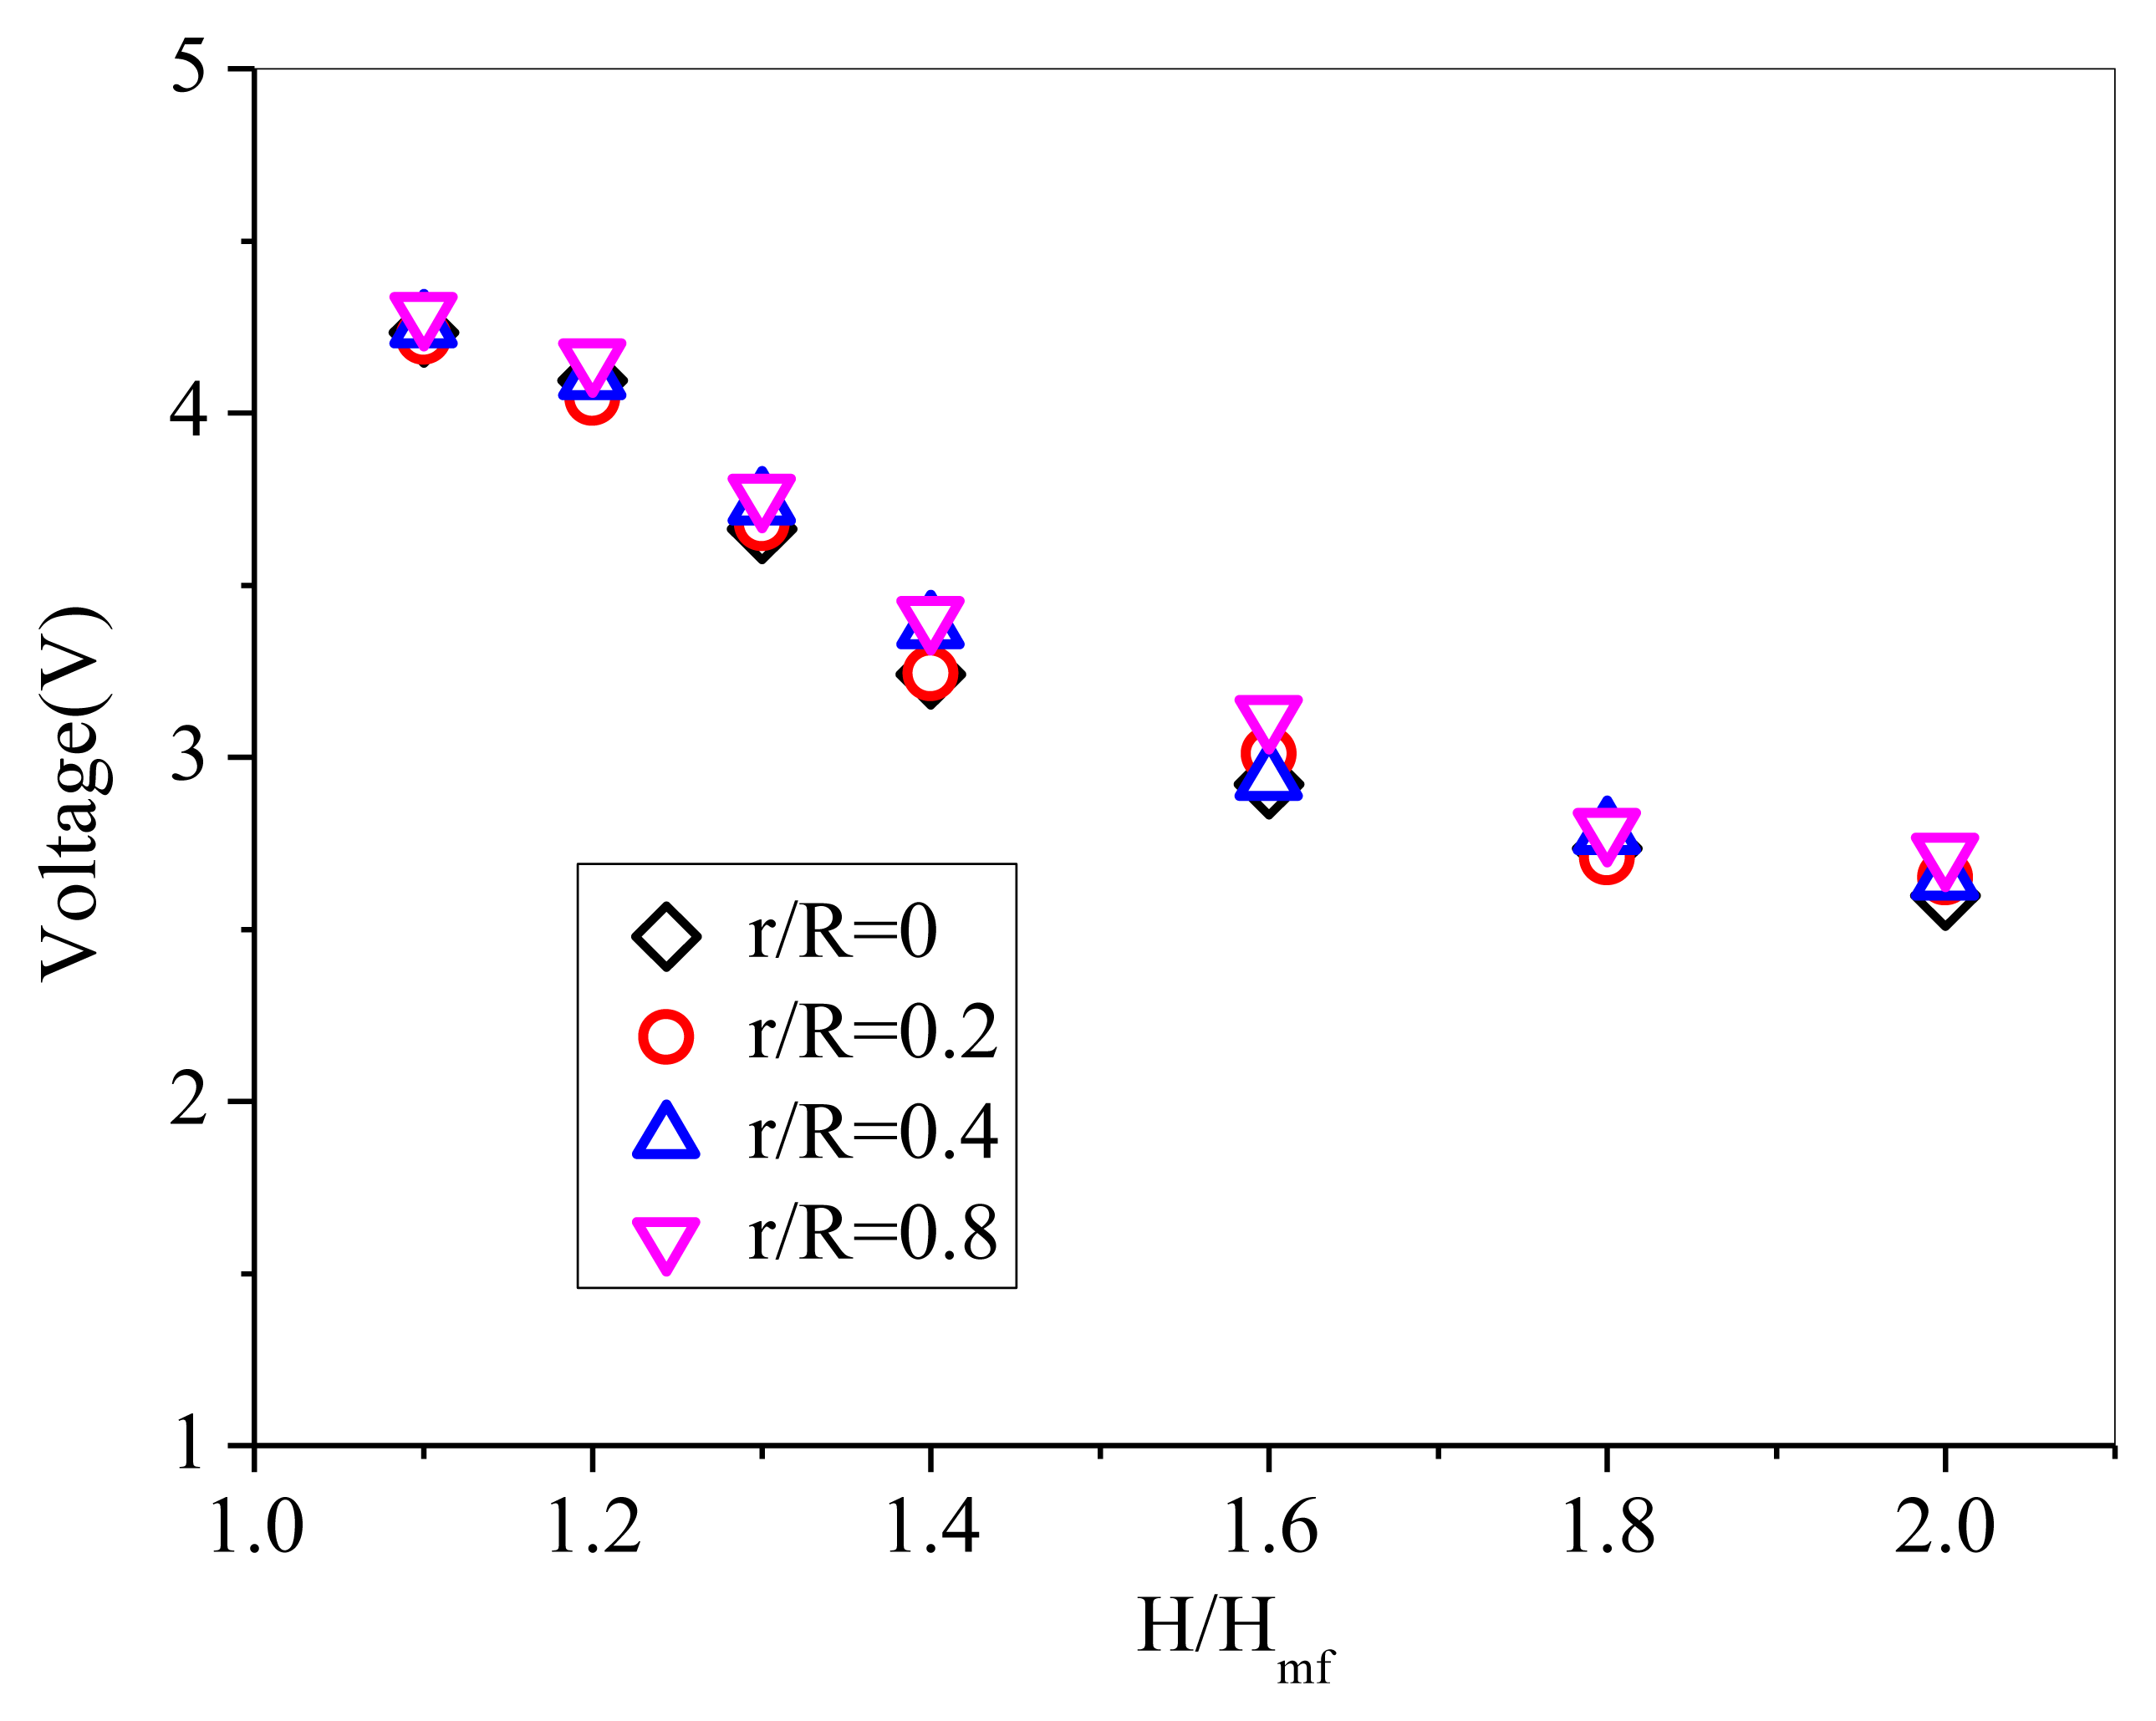
Due to that the complexity of the heterogeneous gas-solids flow manifests in the irregular, non-periodic variation of solids concentration with time, the typical time-resolved signals from the probe exhibit sharp spikes that correspond to the passage of individual particles in the near vicinity of the probe [20]. Different from pressure fluctuation signals, the solids concentration signals show binary behavior [35]. The peaks of the signals stand for high solids concentration and the valleys represent low solids concentration. During the calibration experiments, after reaching steady state, the mean output voltages of the probe were measured by immersing the probe at four radical positions: r/R = 0, r/R = 0.2, r/R = 0.4, r/R = 0.8. The radial voltage values of the probe are plotted in Figure 6. It can be seen that the output voltages of the probe at different radial positions basically agree well. The output voltages of the probe recorded near the wall is higher than those of the other three radial positions, which indicates higher solids concentration near the wall due to the wall effect. It can be inferred that relatively homogeneous suspension of solids was obtained.
In order to ensure that day-to-day measurements could be compared on an equal basis and to eliminate any parasitic effects caused by this particular apparatus which may prevent the use of the calibration curve in other systems, the output voltages were normalized according to the following expression [21]:
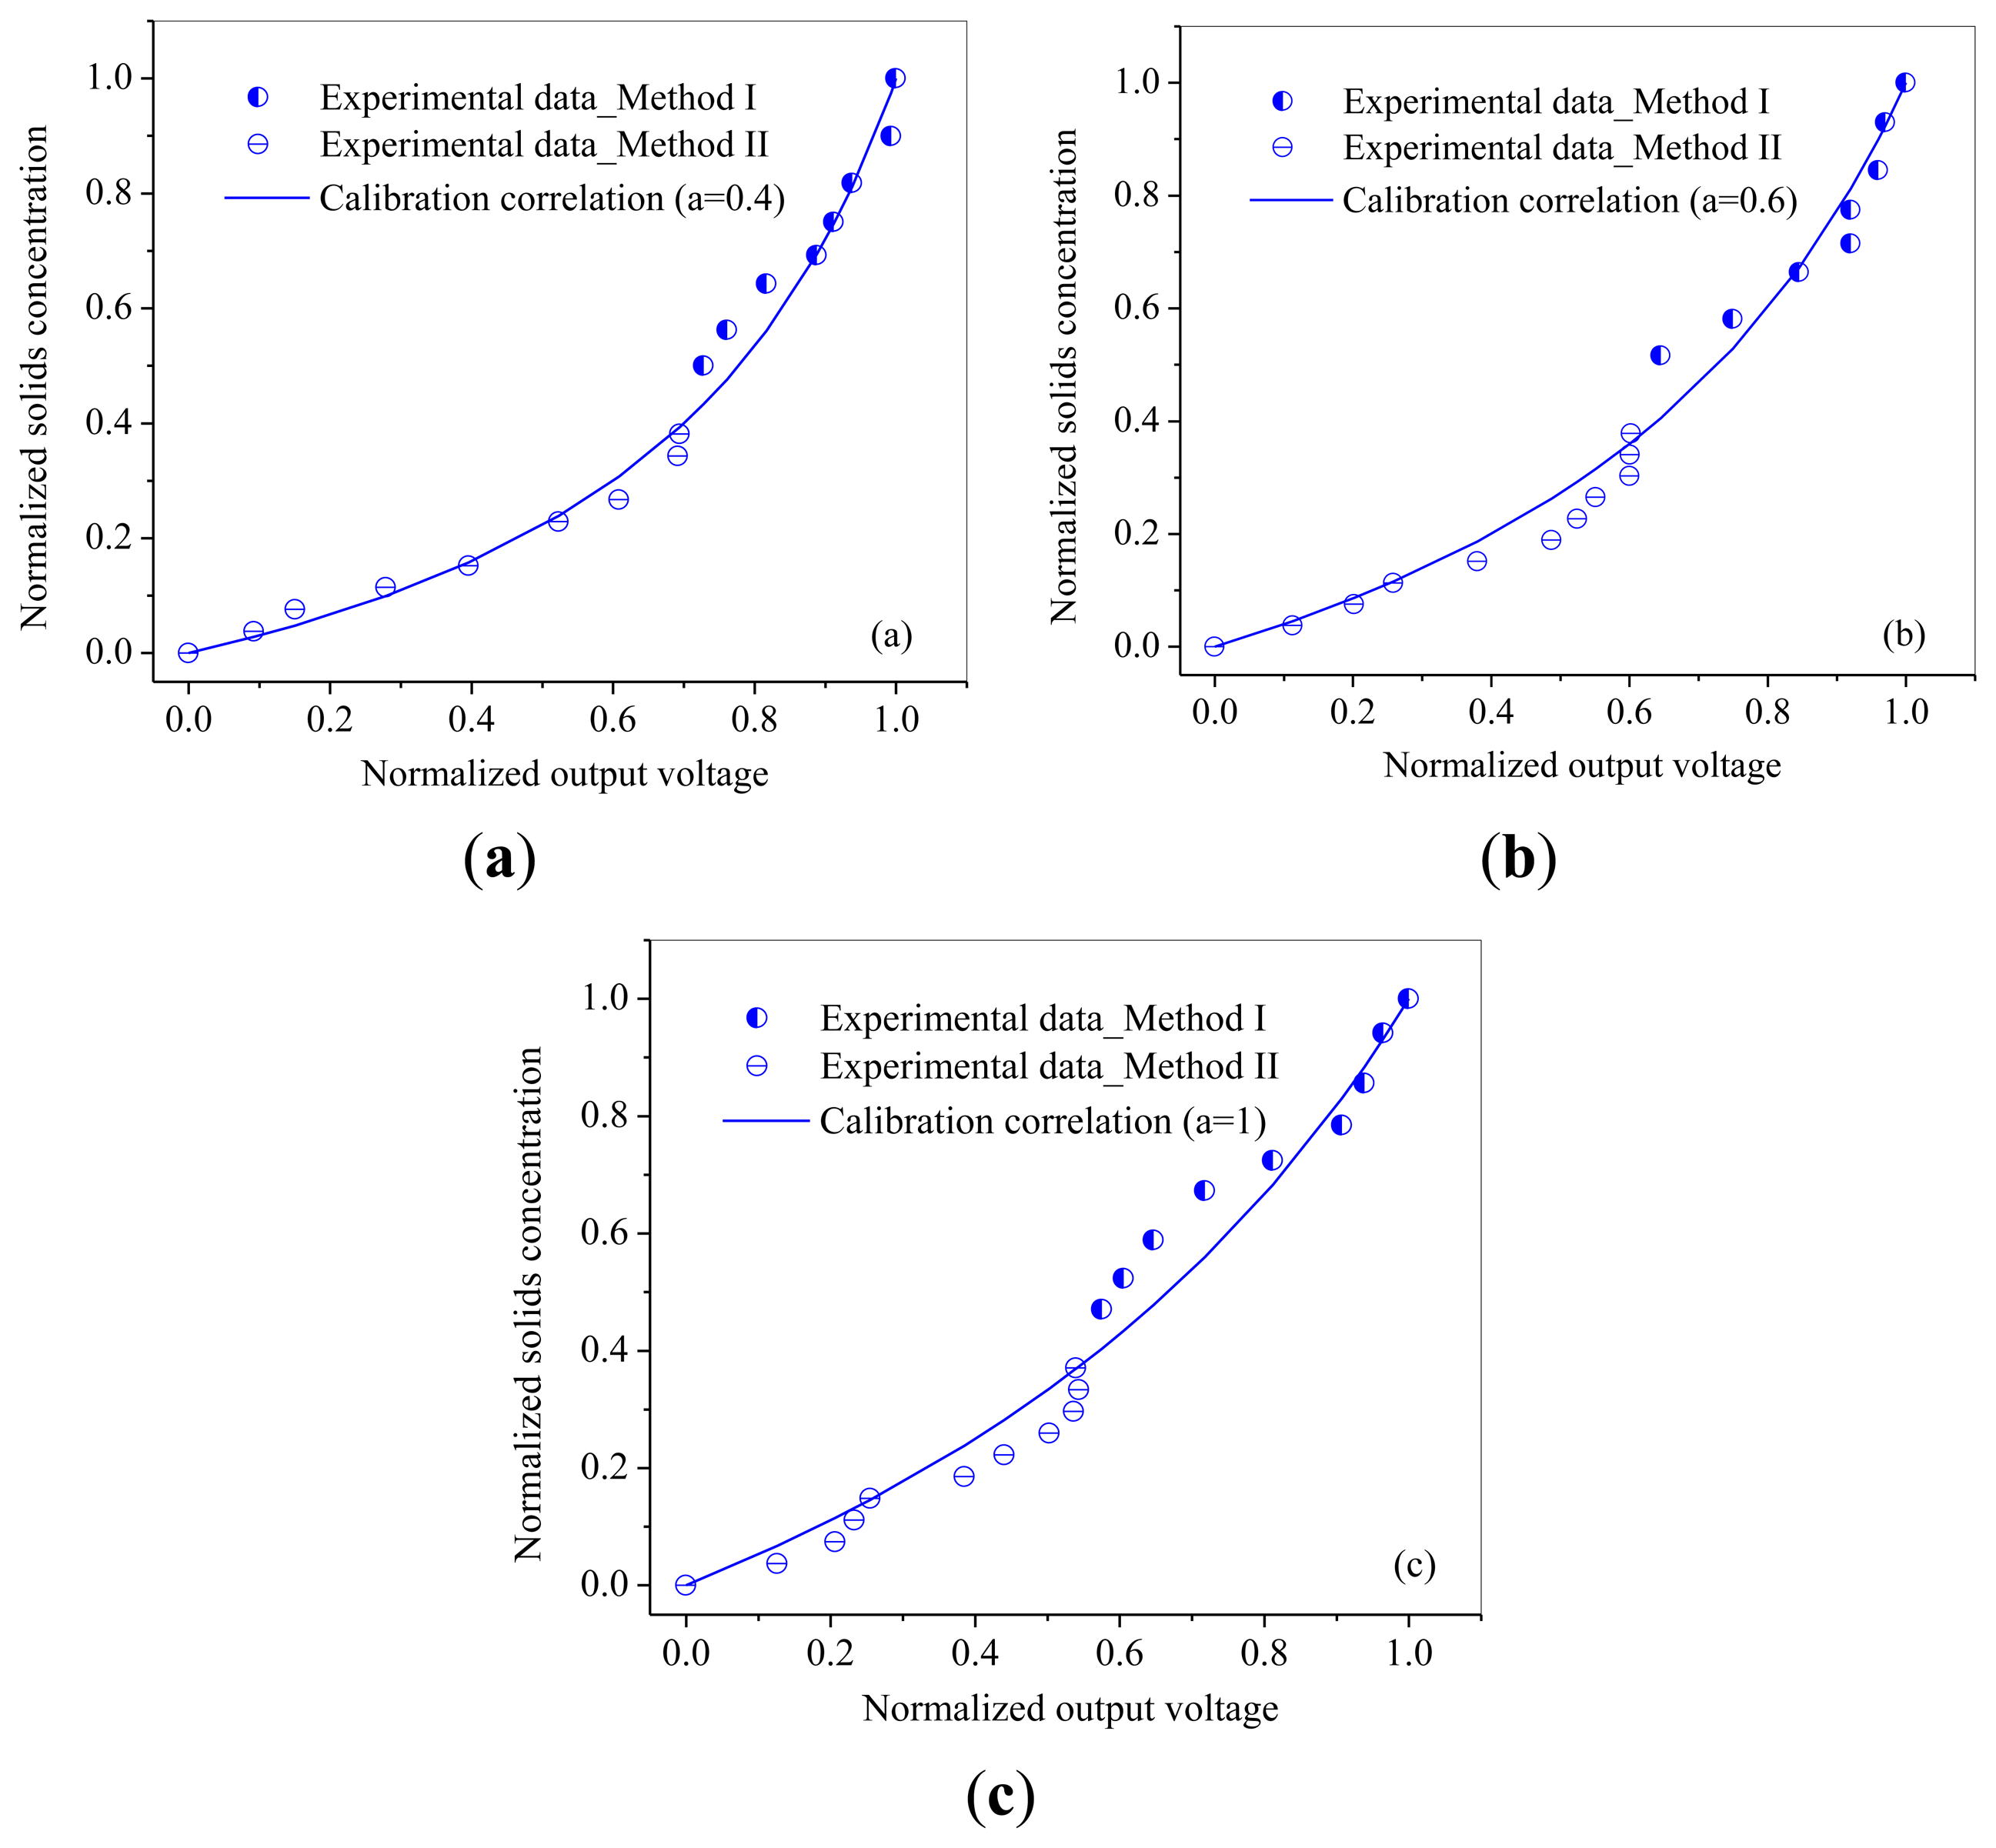
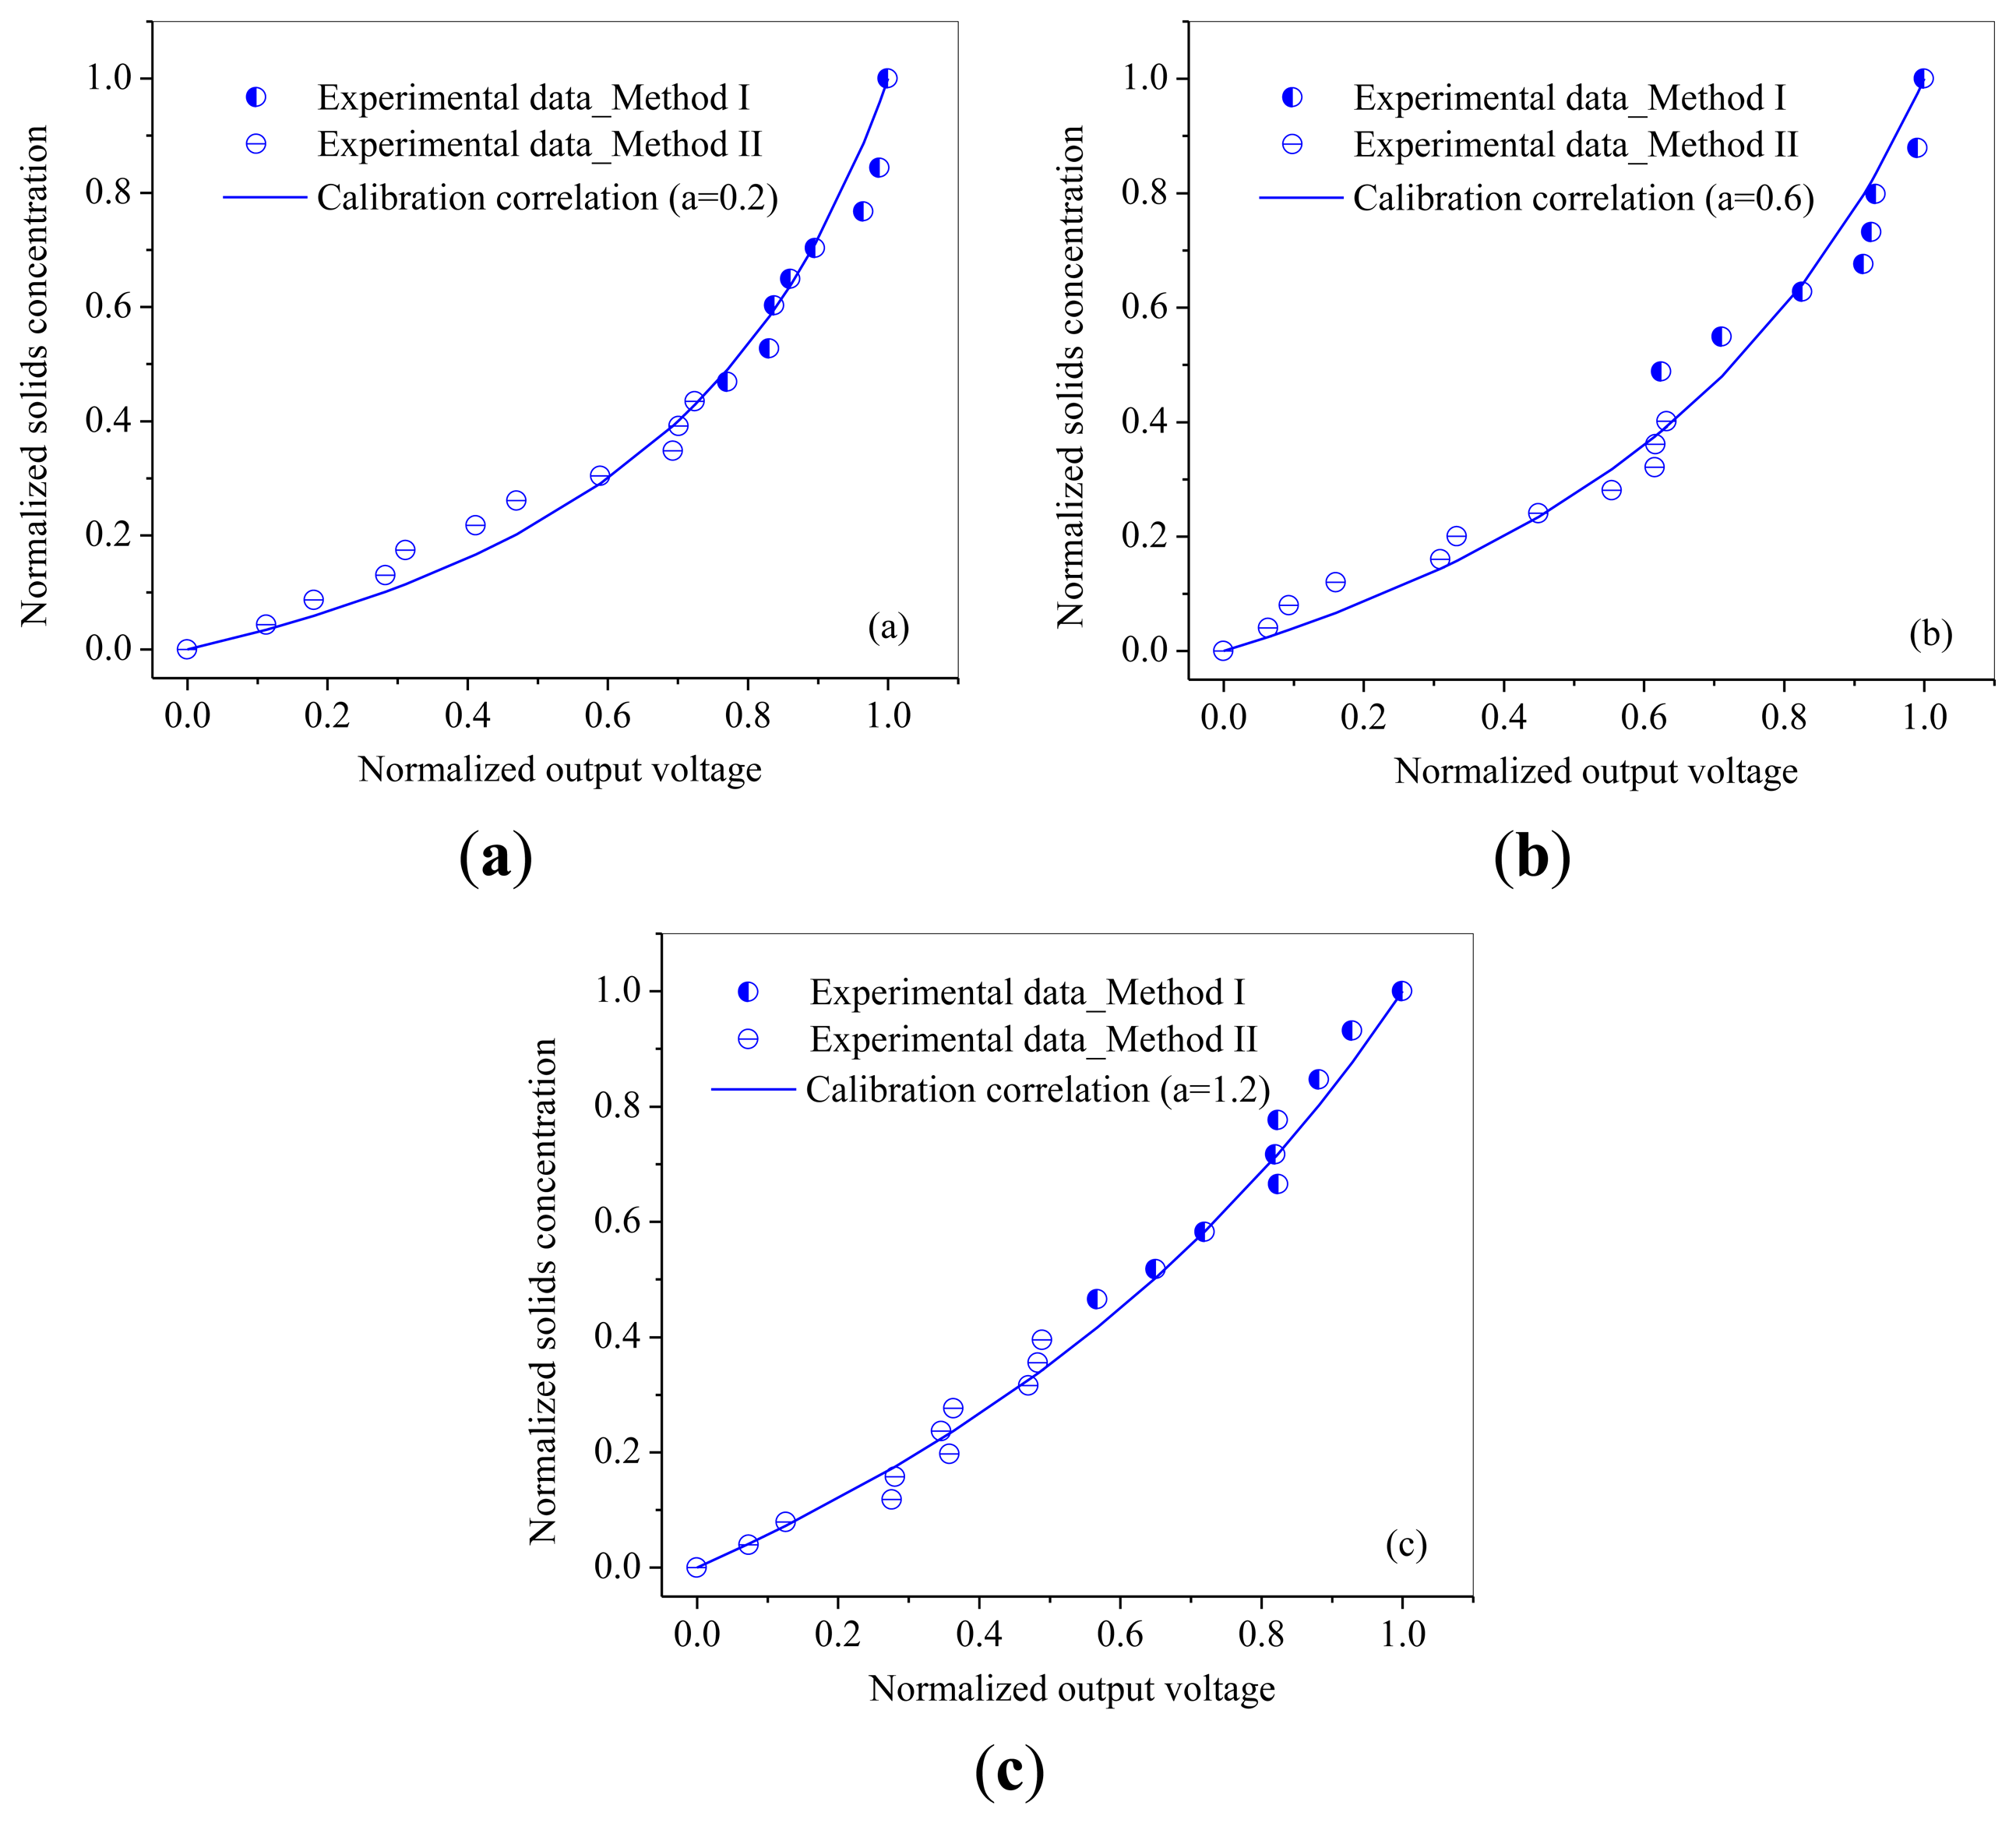
The relationships between normalized output voltages and normalized solids concentration are shown in Figures 7 and 8. From Figures 7 and 8, it can be seen that the output voltages increases sharply with increasing solids concentration at low solids concentrations, while increases slowly at high solids concentrations, which is consistent with the variation trend obtained by Cui et al. [30]. It may due to that for higher solids concentrations, the probe has a smaller measuring volume and lead to a more ‘local’ measurement because particles in the measuring volume woule be blocked by particles in front of them. Meanwhile, it can also been seen that the calibration coefficient a increases with the increasing of particle size.
Method II was used to calibrate the probe with a solids concentration range from 0.02 to 0.2 for both of the two powders. Method I worked at the solids concentrations from 0.26 to 0.53 for glass beads and from 0.22 to 0.5 for quartz sand. From Figures 7 and 8, it can also be seen that method I and method II together are capable of calibrating the optical-fiber probe at nearly full range of the solids concentrations from 0 to packed bed concentration.
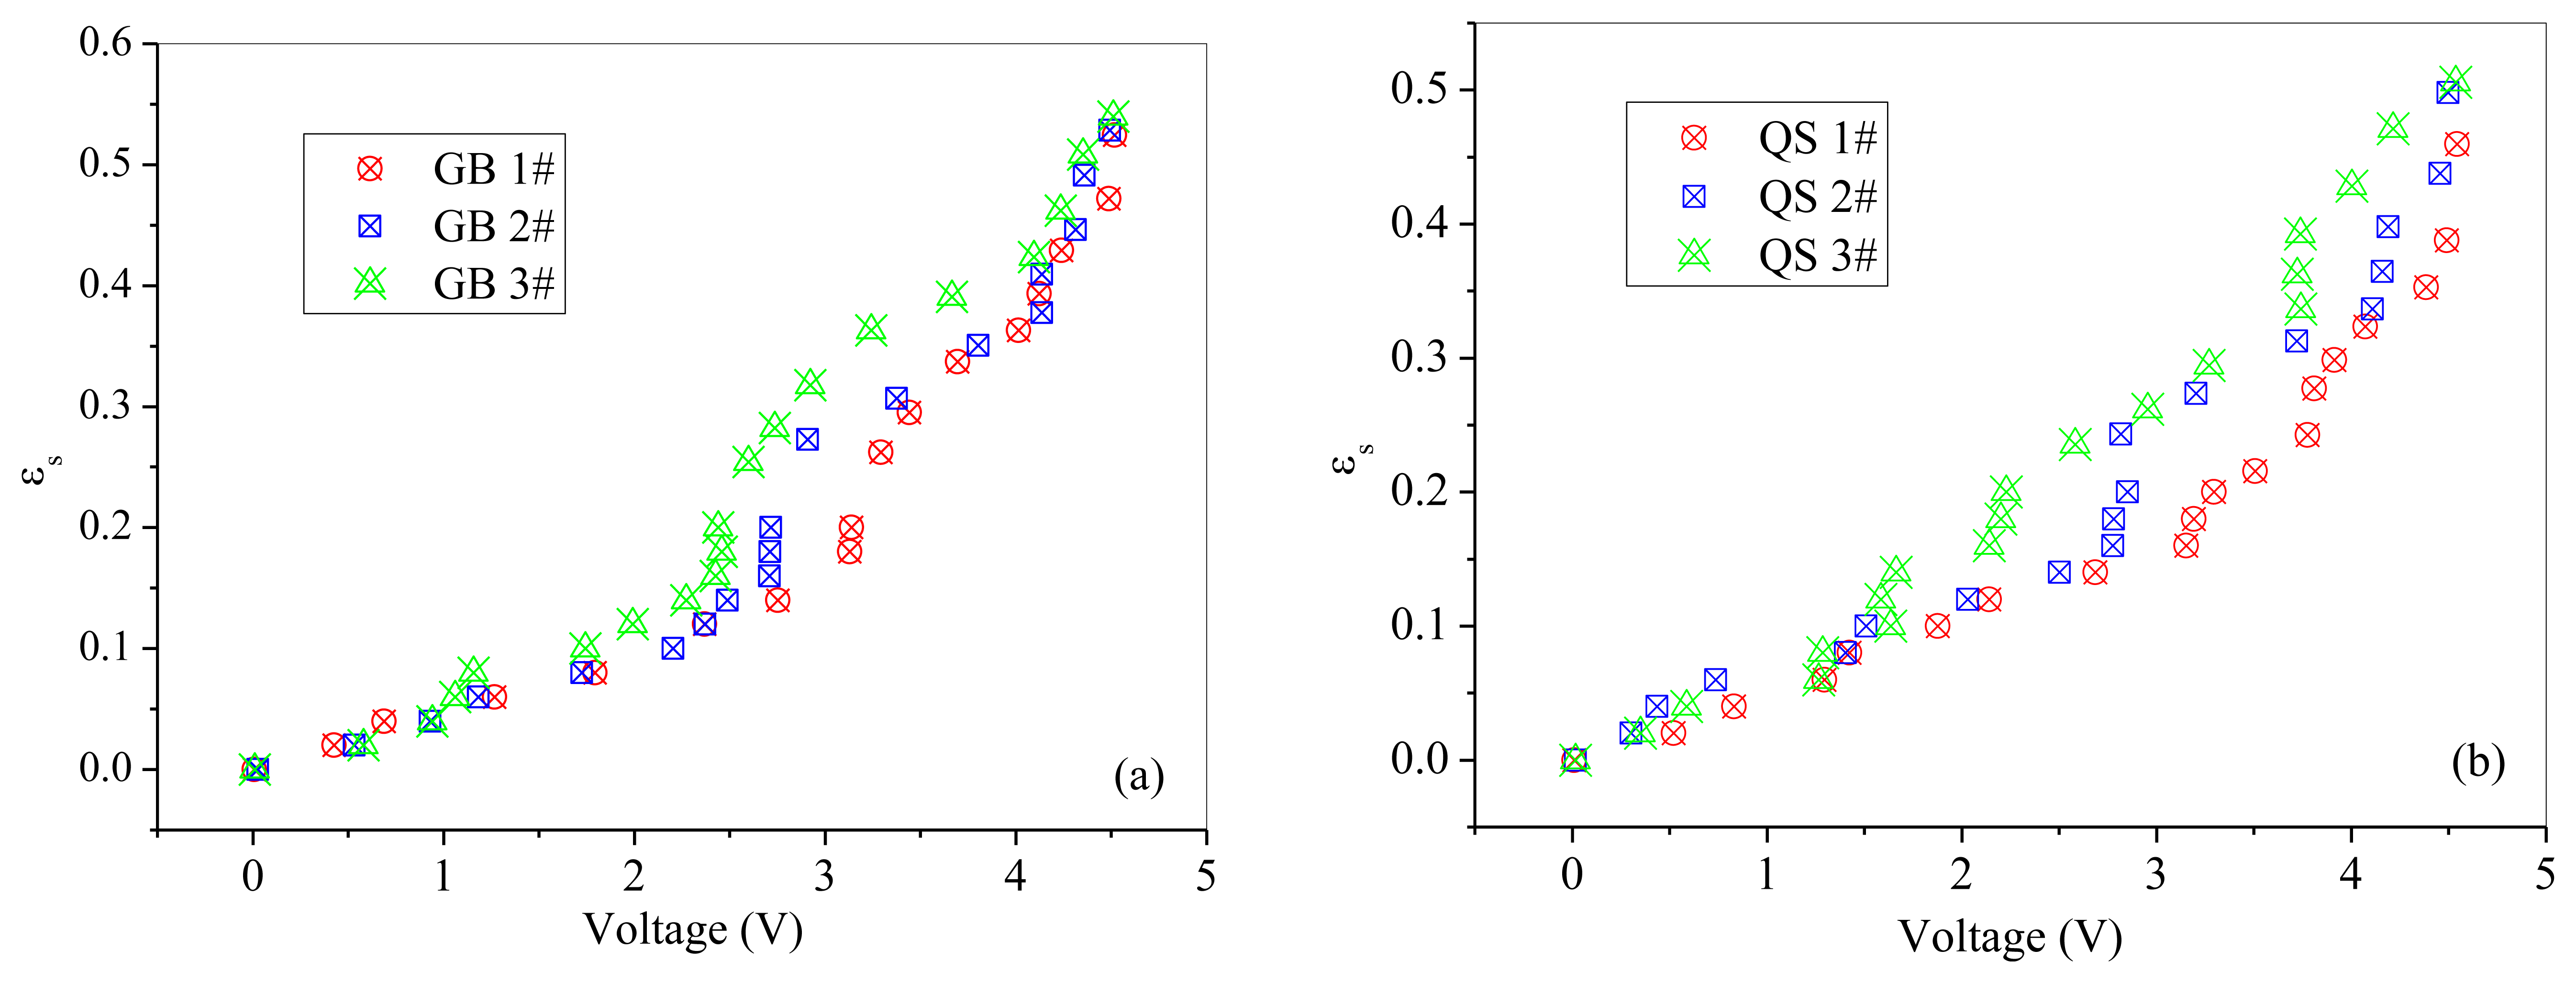
The suspensions encountered in practical problems of chemical engineering usually consist of particles with statistically varying irregular shapes, size and surface properties, locations and spatial orientations which are altogether unknown and for practical problems also may not be exactly describable [36]. The effect of particle size on calibration results is shown in Figure 9. It can be inferred that the output voltage of the optical fiber probe has a tendency to increase with decreasing particle size for the whole range of solid concentrations, but the increase tendency is not so obvious when the solids concentration less than 0.1. The intensity of the backscattered light is a function of the solids concentration and the mean particle size [25,37]. Yamazaki et al. [25] found that the intensity of the reflected light is affected by the particle diameter and the back-scattered light reach the probe decreases as the particle diameter increases. This may be attributed to the increase in the average path length of the light beam, which is caused by an increased particle diameter. Bos et al. [37] indicated that the intensity of the reflected light increases as the particle diameter decreases and the solids concentration increases. The present finding is consistent with their results. Meanwhile, Qi [24] also obtained similar conclusions that the output voltage decreases substantially with increasing particle size. According to Amos et al. [38], the relationship between the probe output and the solids concentration and the variation of this relationship seemed to be strongly dependent on the relationship between the particle size and the fiber diameter. With fixed fiber diameter, the relationship between the probe output and the solids concentration seemed to have the same slop at the low solids concentrations. In our study, the offset of the probe were adjusted to nearly zero with empty black box for each power with different particle diameter. Thus, the difference of calibration curves within the low solids concentration range between different particle sizes is not obvious. Amos et al. [38] also found that particle size effect was greater at higher solids concentrations, and that increasing the particle diameter while keeping constant the solids concentration and fiber diameter would lead to more light penetrate into the solid suspension. The light penetrating into the bed deeper than one particle would never be reflected out of the solids suspension. Meanwhile, the discrepancy of calibration results with different particle size exists at moderate solids concentration may also have some relationship with some heterogeneity effect in the gas-solid system due to that the inherent fluctuations are unable to be completely avoided in a gas-solid flow system. During the calibration experiments, it was found that the bubbles are more likely to form and expand at moderate solids concentrations. The bubble suppressor can reduce the generation of bubbles and avoid inherent fluctuations inside the calibration column to a certain extent, but it can't suppress the generation of bubbles totally. The degree of heterogeneity was relatively larger at moderate solids concentrations. Thus, a powder with very homogeneous fluidized behavior would be expected to have a more reliable calibration curve with this applied methodology.
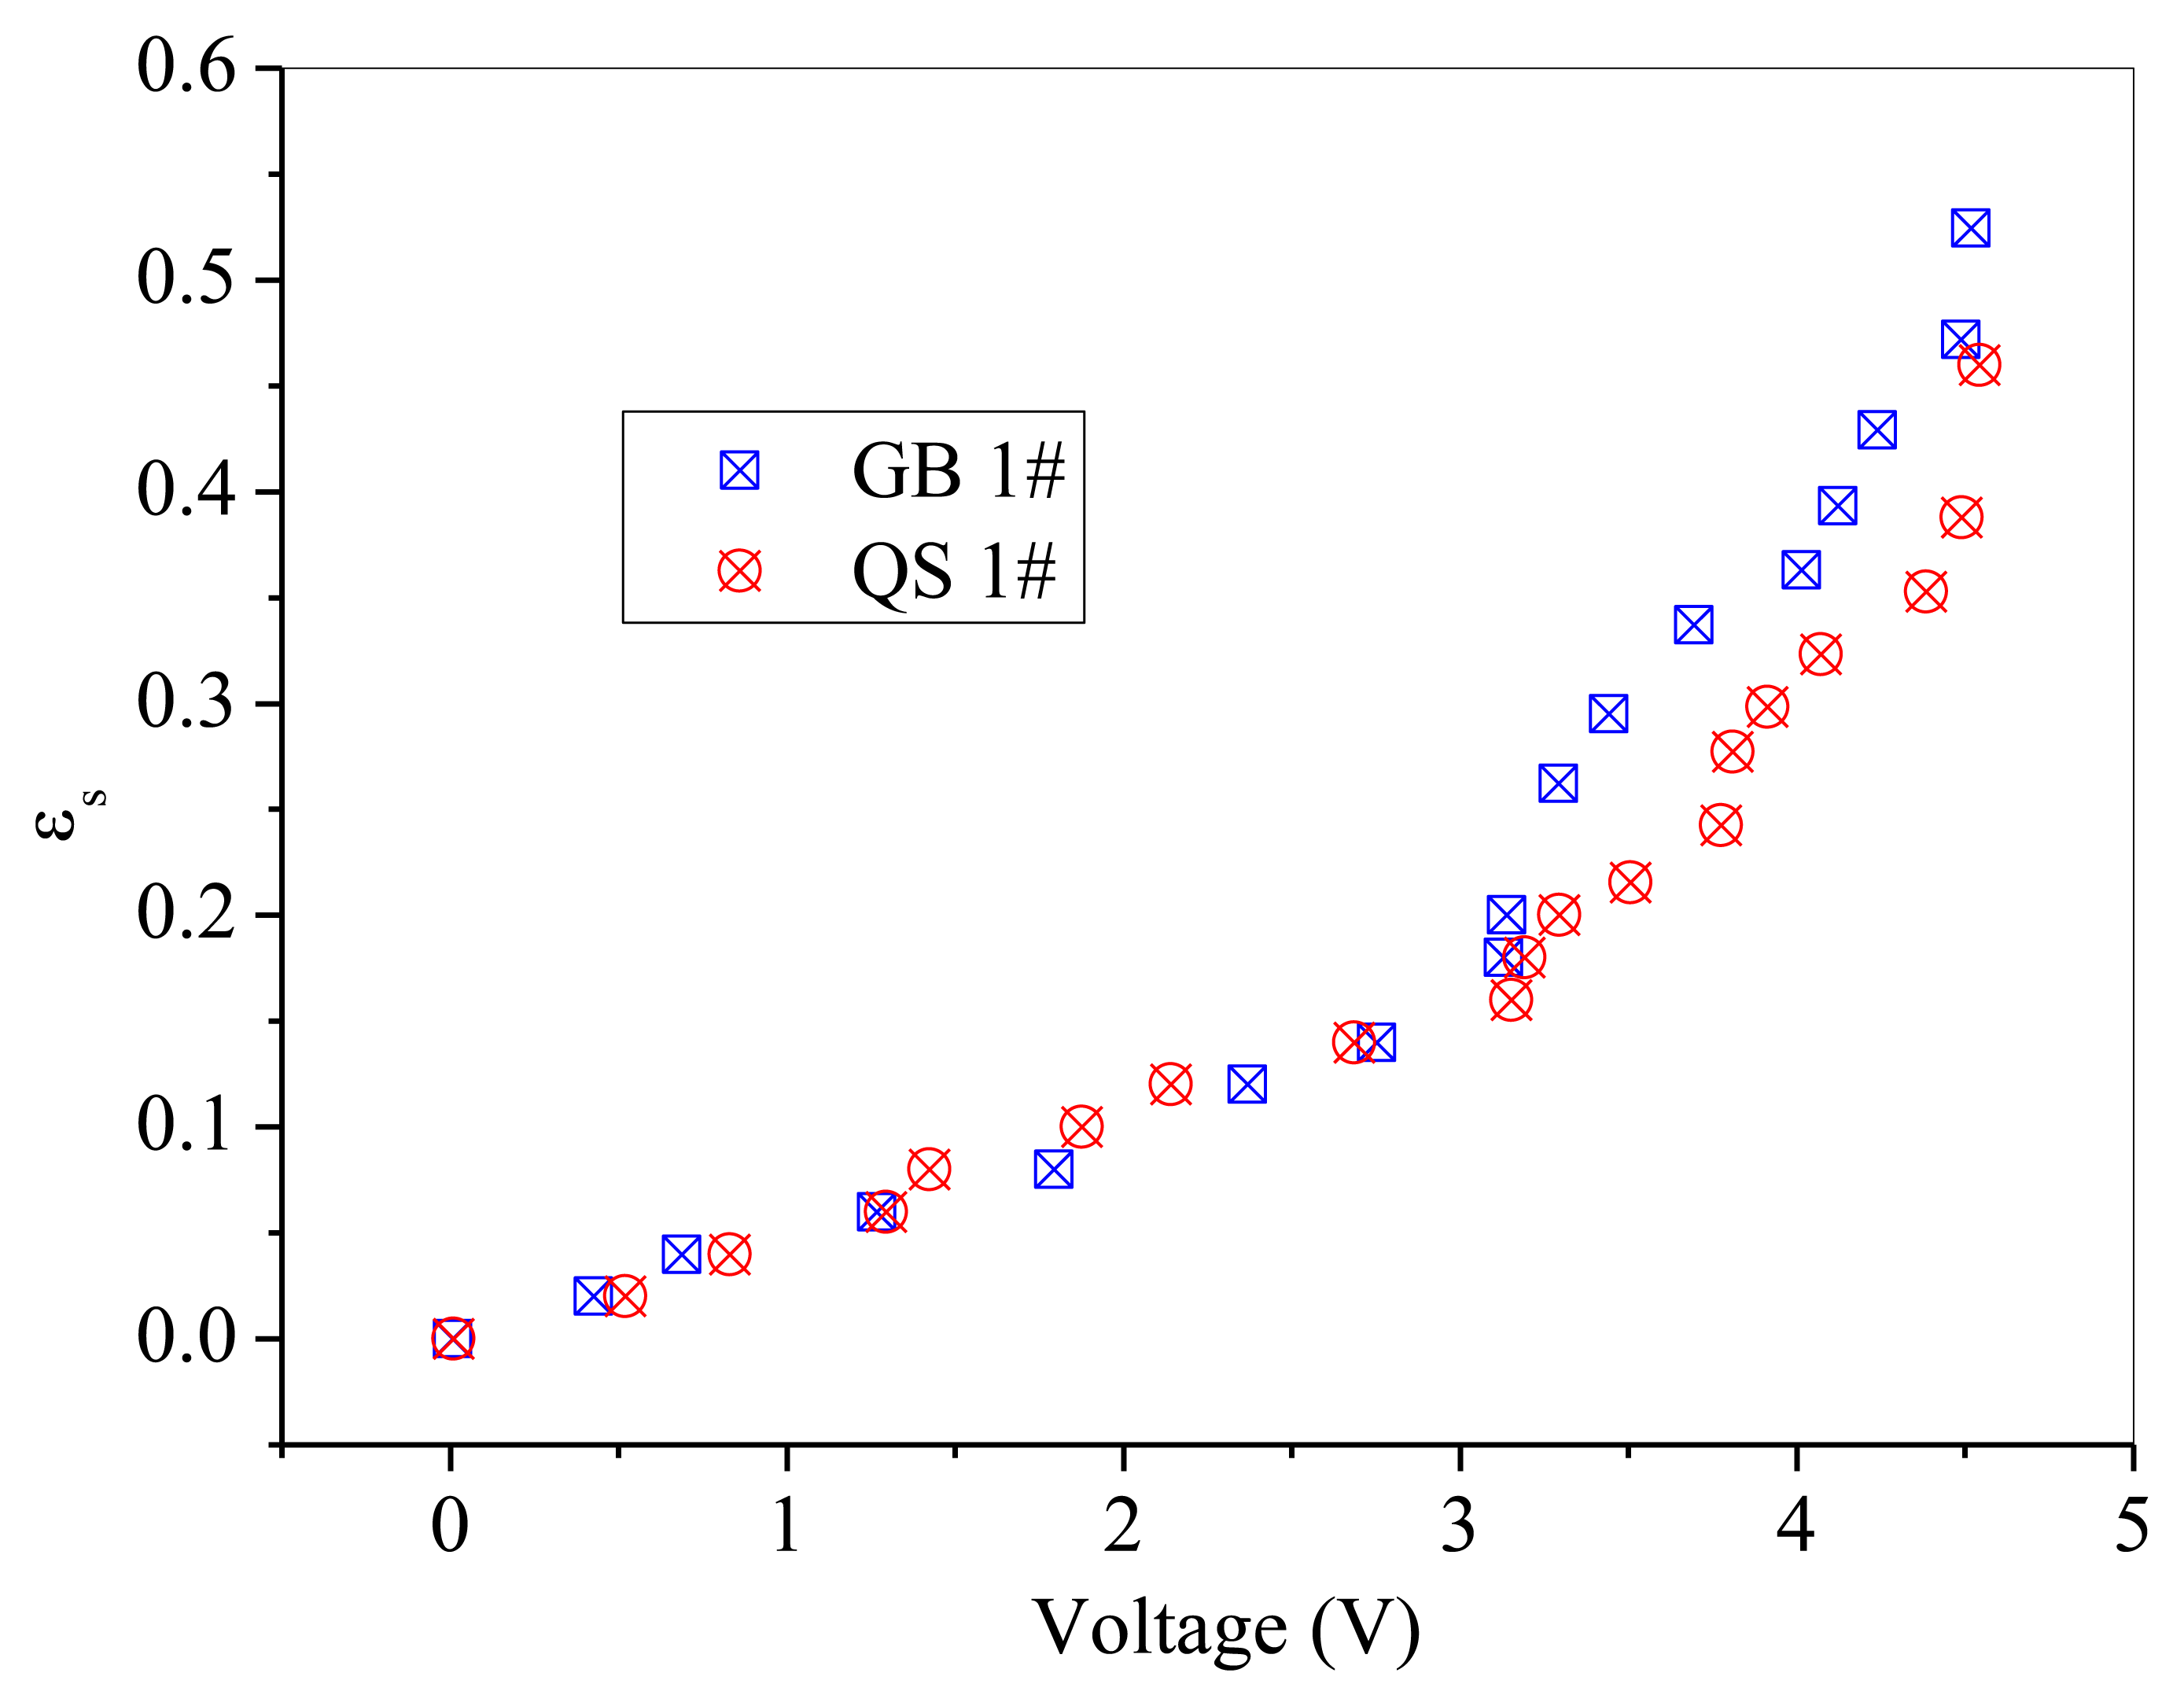
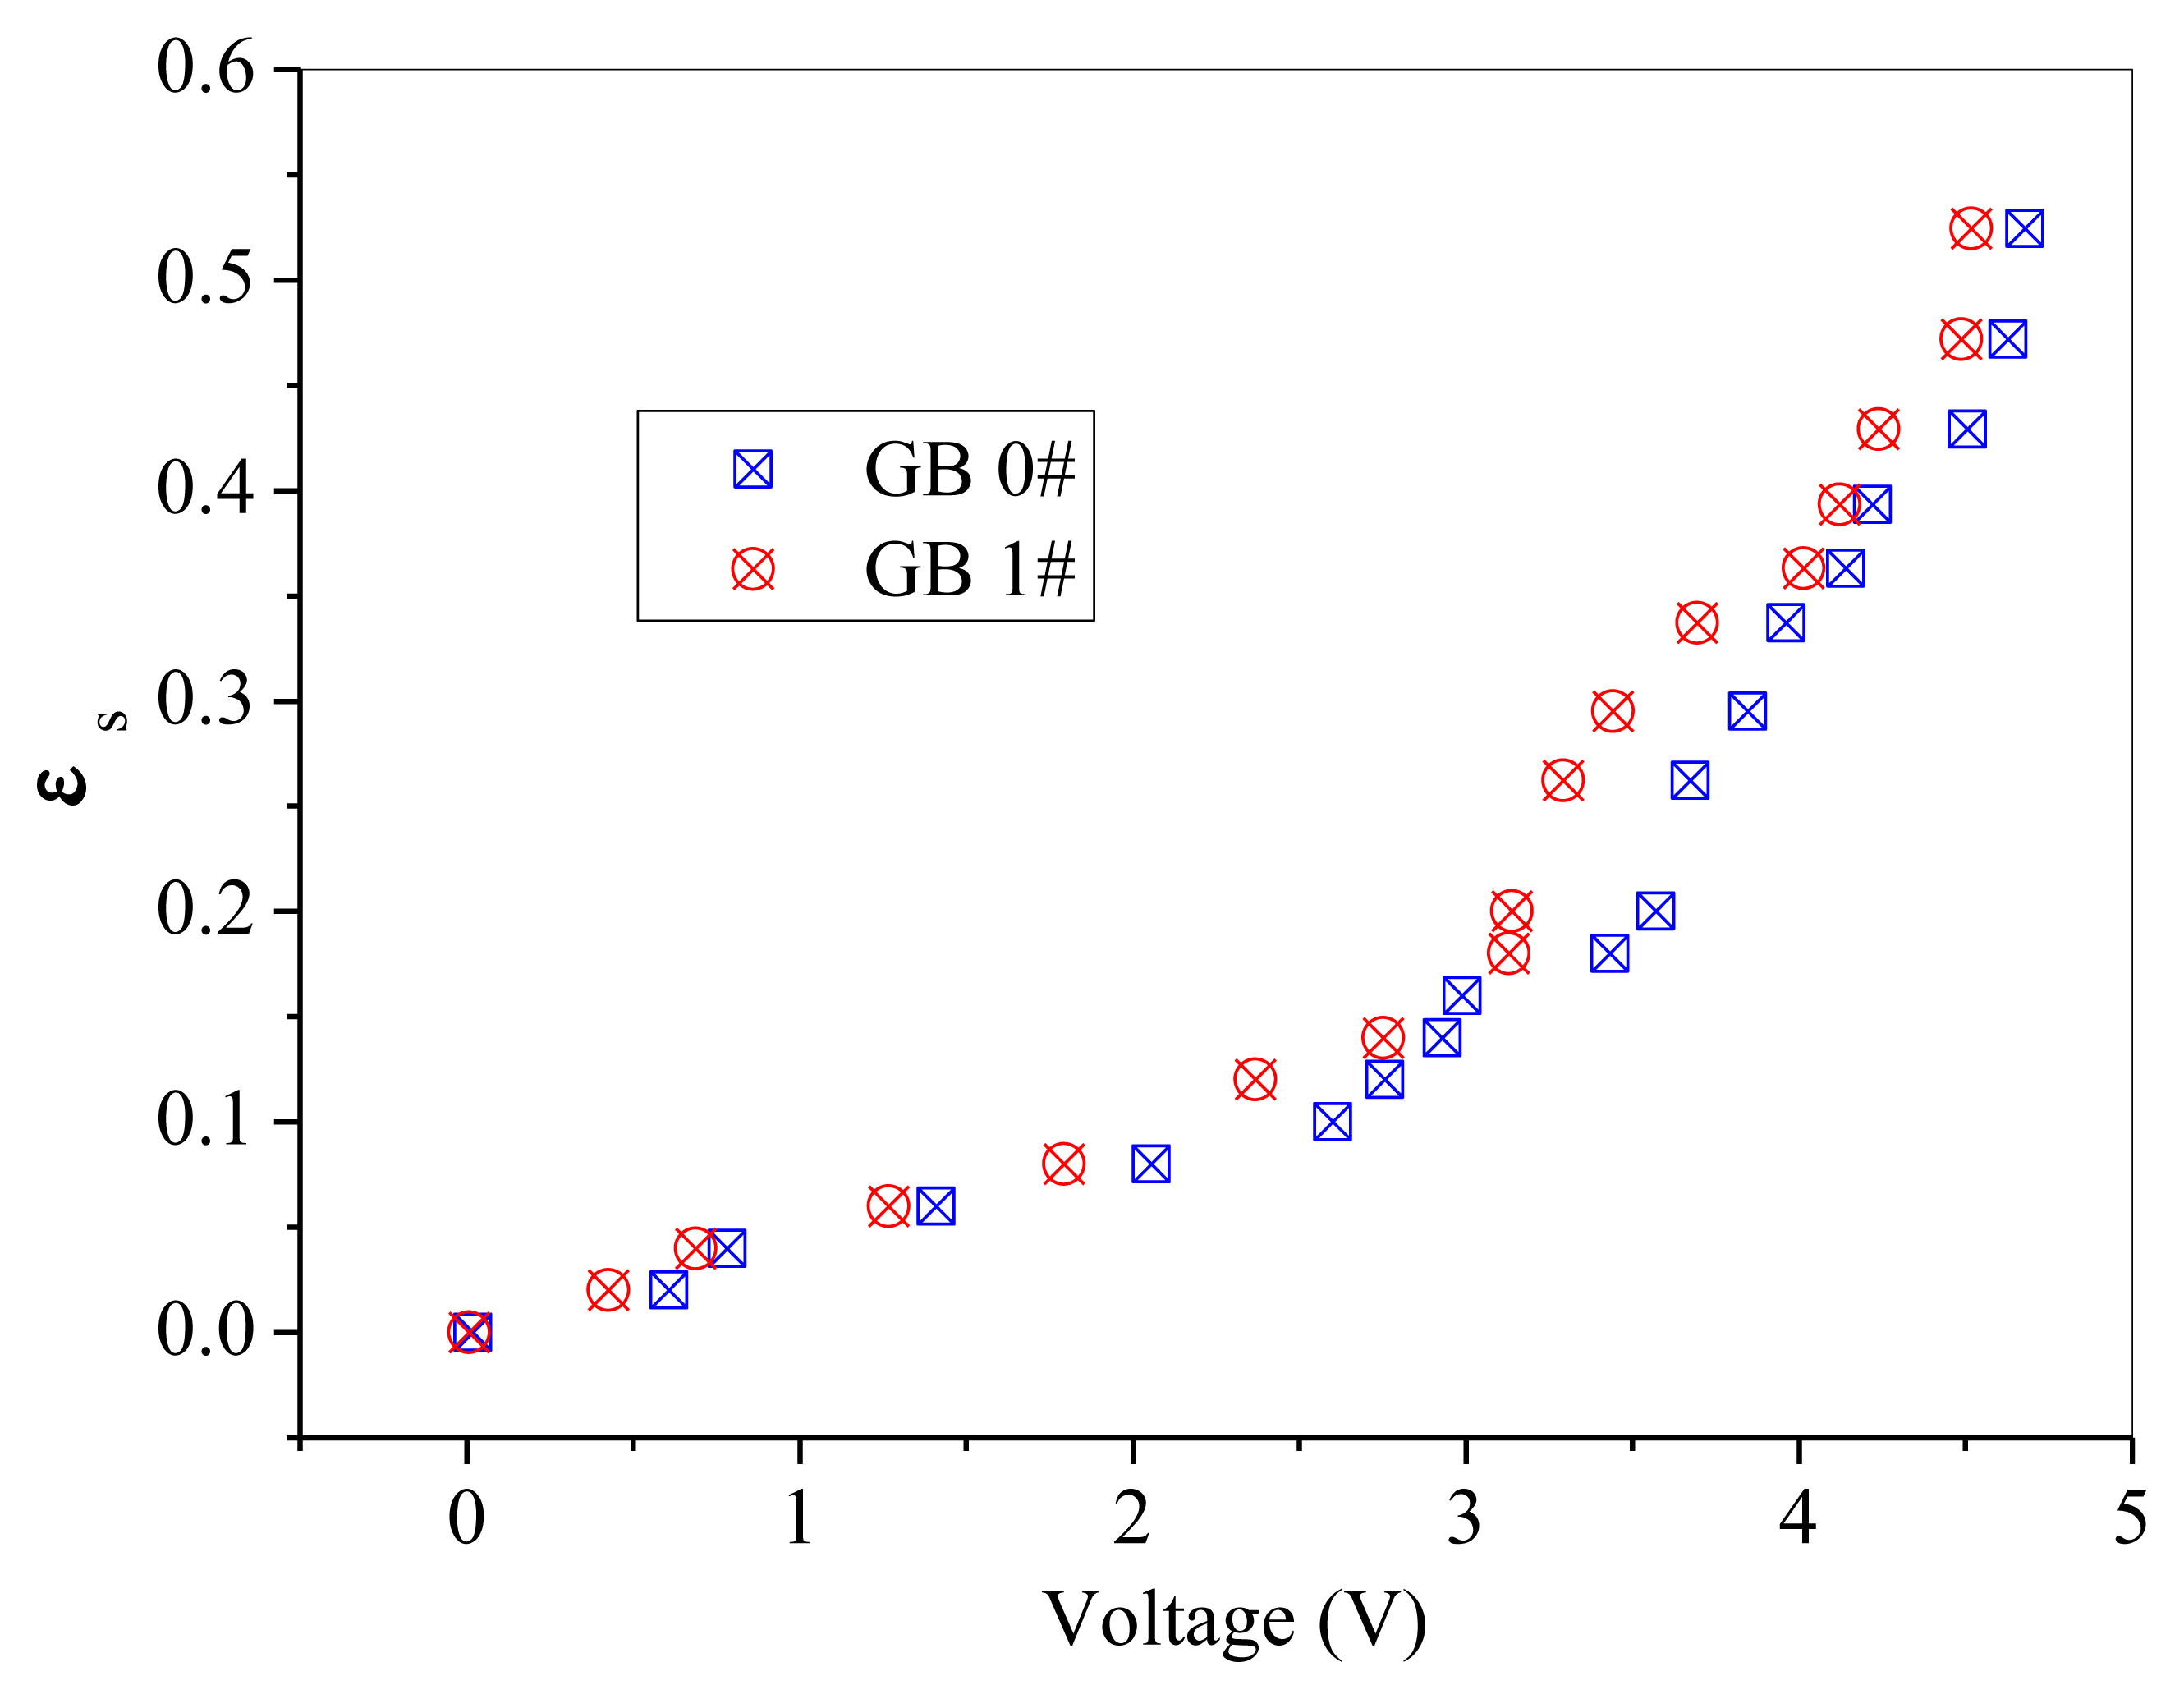
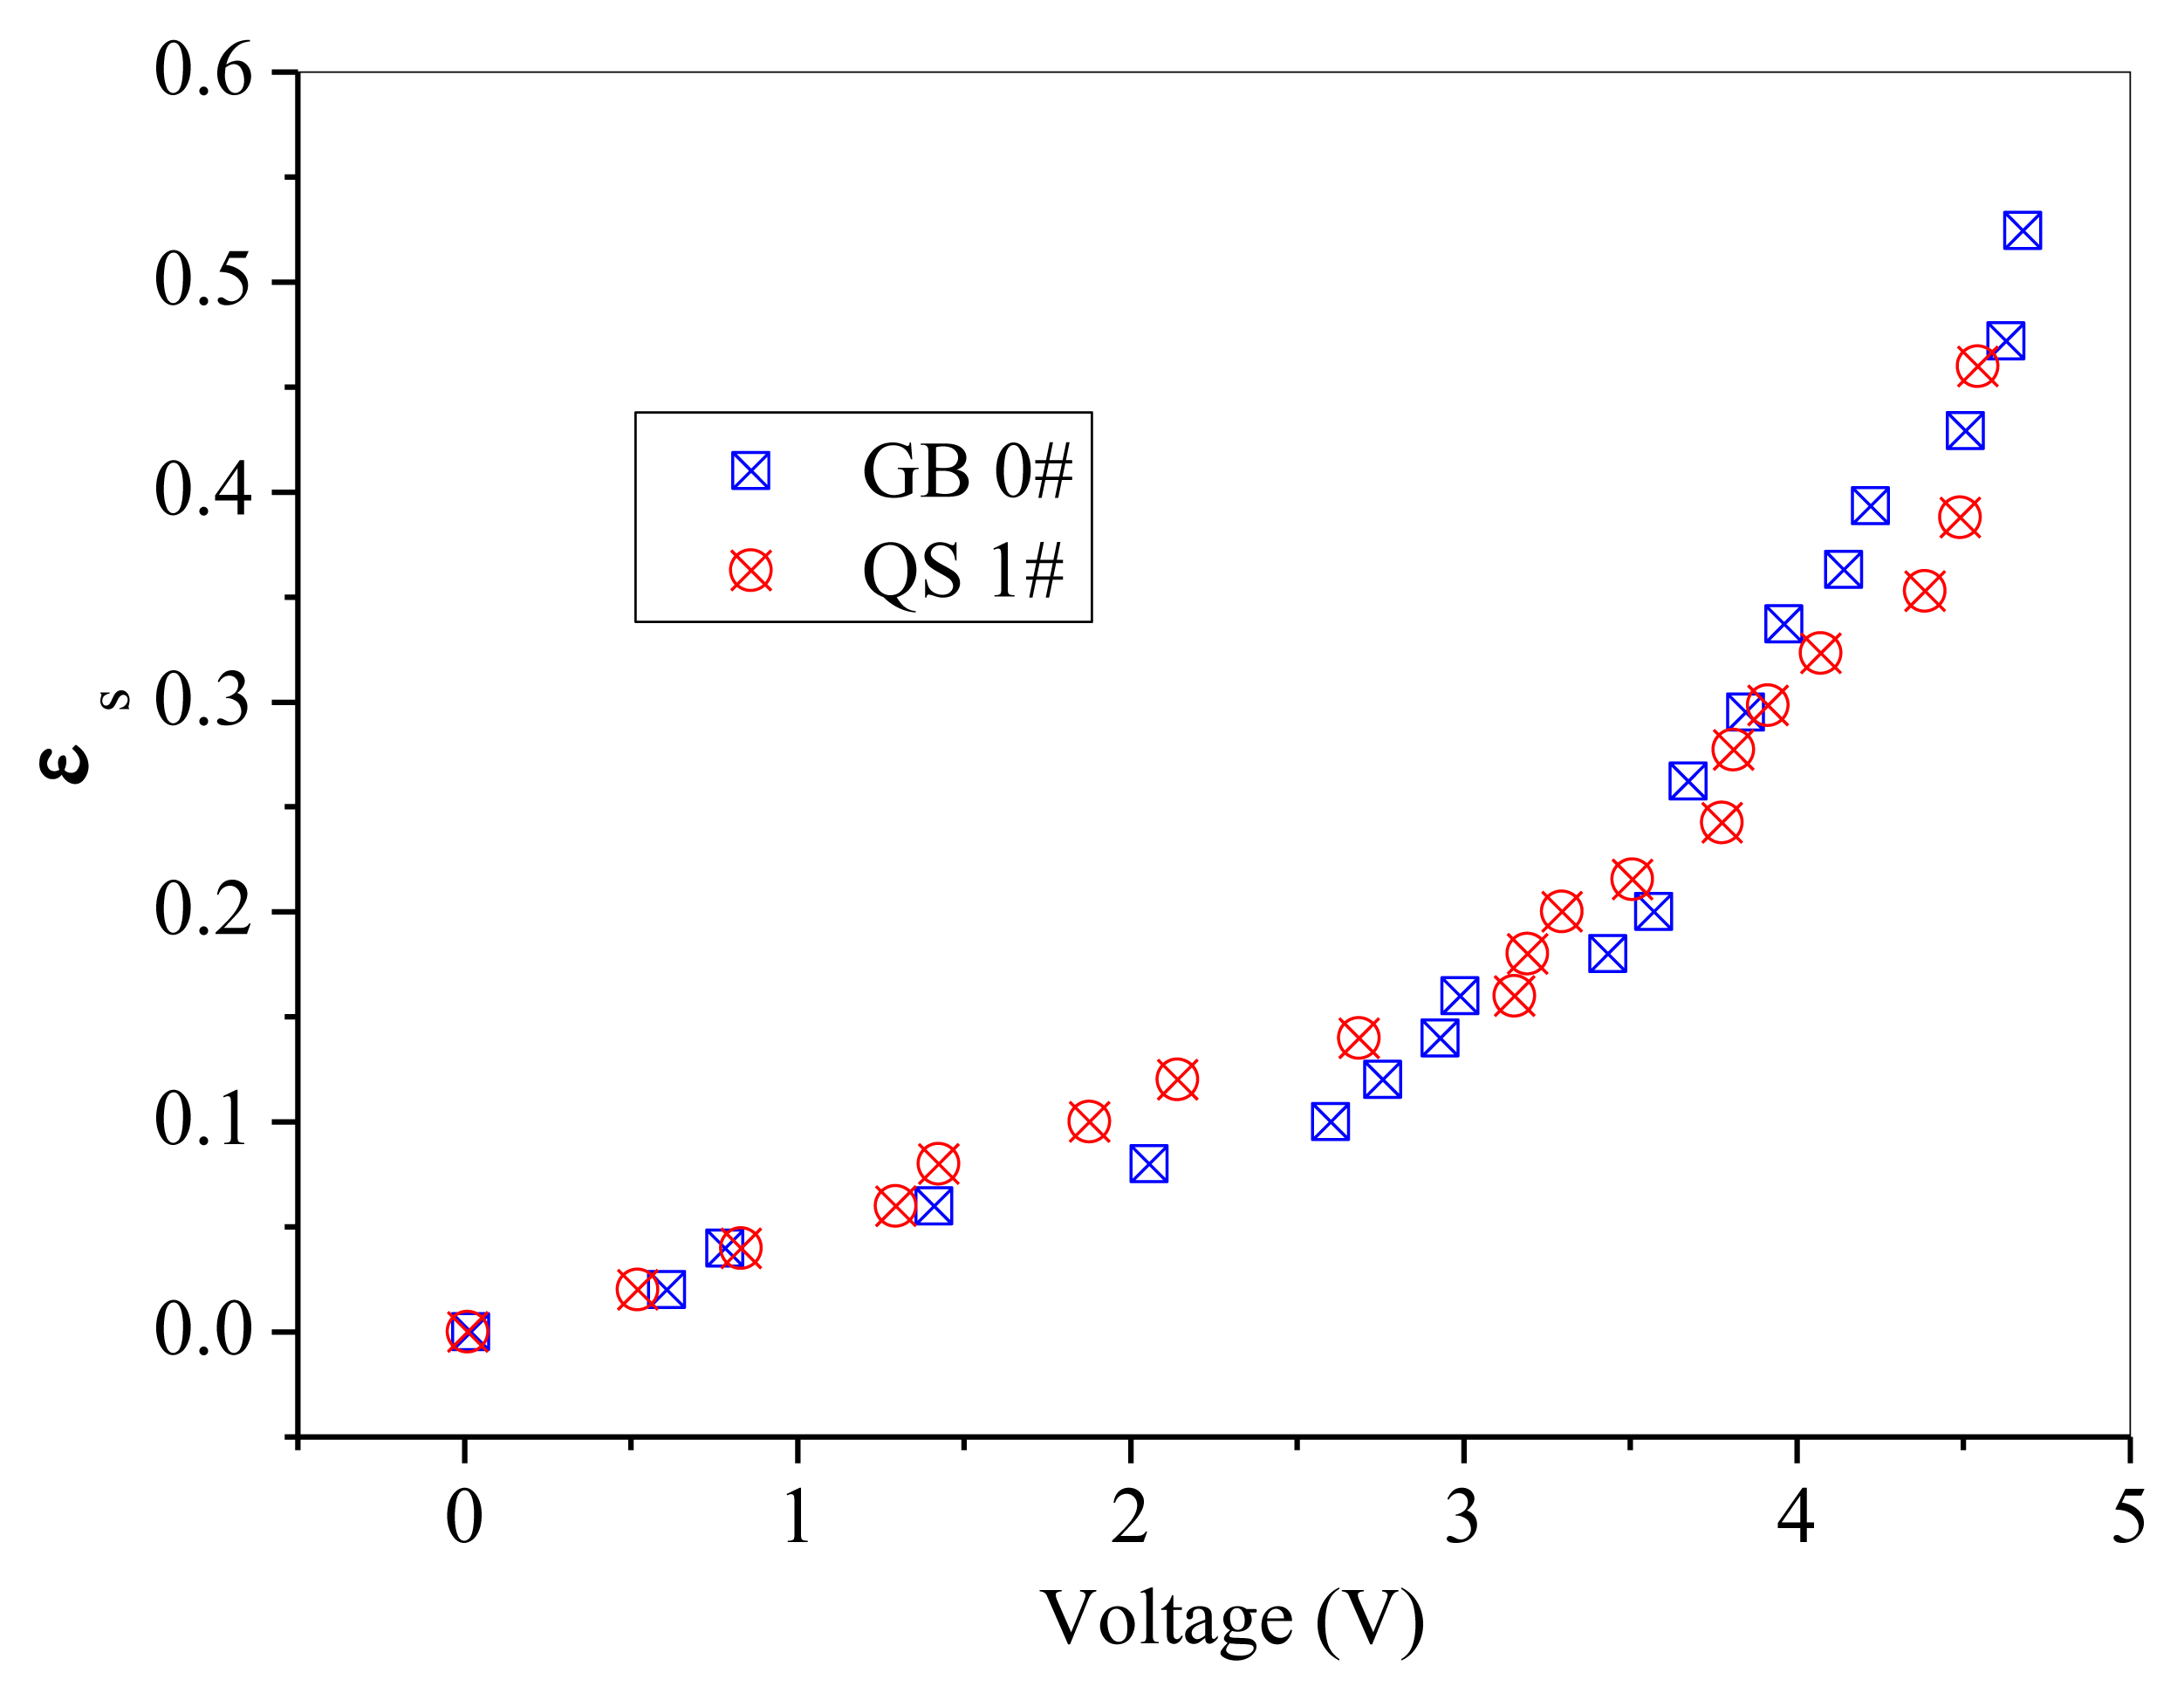
GB 1# and QS 1# are similar in particle size, but different in sphericity and color. Thus, comparisons are difficult to be made directly between these two powders, as shown in Figure 10. A batch of fresh glass beads with the same particle size as GB 1# but has a color of white, which was named GB 0#, was used to compare with the above mentioned two powders separately. The effect of particle color on calibration results is shown in Figure 11. The difference between GB 0# and GB 1# was color, and GB 1# was darker than GB 0#. It can be seen from Figure 11 that GB 0# has higher output voltages than those of GB 1#, which is due to that dark powder reflects less light [27]. The effect of particle sphericity on calibration results is shown in Figure 12. The calibration curves of GB 0# and QS 1# overlapped together. For sand particles, the sphericity is in the region of 0.8∼0.98 [10] which is usually less than that of glass beads. Rundqvist et al. [10] pointed out that the sampling light scattered from irregular particles will approximate the light scattered from the same number of spherical particles if a sufficient number of particles are considered, as the particles are oriented randomly in the suspension. The irregular object will appear more spherical as angular velocity increases, which is equivalent to sampling the same object from different angles. The impact of sphericity on the calibration theory was neglected in their research. Thus, it can be inferred that the effect of particle color on calibration result is more predominant than that of sphericity, Qi [24] also obtained the same conclusion. The calibration curves in Figure 10 are very close and overlapped at solids concentrations less than 0.2, which means that the calibration curve is less sensitive to the particle color when the solids concentration is low.
The difference of the calibration curve at solids concentration more than 0.2 may due to the color difference. The GB 1# are darker in color than QS 1#. Grey glass beads have the tendency to absorb more light compared to white quartz sand. It can be seen that under the same solids concentration, the output voltages of QS 1# are higher than that of GB 1#.
5. Conclusions
Different calibration methods of optical-fiber solids concentration probes reported in the literature were reviewed in this paper. Satisfactory calibration procedures are lacking in the literature, and the exact shape of the calibration function has not been verified exactly. A combined calibration method, which is capable of calibrating the optical-fiber probe at nearly full range of the solids concentrations from 0 to packed bed concentration, is proposed. With this combined method, the probe was uniquely calibrated with two kinds of powders. The effects of particle properties (particle size, sphericity and color) on the calibration results were comprehensively investigated. From the experiments carried out here, it can be concluded that the output voltage has a tendency to increase with the decreasing particle size, and the effect of particle color on the calibration curve is more predominant than that of sphericity.
Acknowledgments
The authors acknowledge the financial supports of the National Natural Science Foundation of China (51276036), Special Funds of National Key Basic Research and Development Program of China (2010CB227002), and the anonymous reviewers are thanked for their insightful and detailed comments.
Conflict of Interest
The authors declare no conflict of interest.
References
- Nieuwland, J.J.; Meijer, R.; Kuipers, J.A.M.; van Swaaij, W.P.M. Measurements of solids concentration and axial solids velocity in gas-solid two-phase flows. Powder Technol. 1996, 87, 127–139. [Google Scholar]
- Wiesendorf, V.; Werther, J. Capacitance probes for solids volume concentration and velocity measurements in industrial fluidized bed reactors. Powder Technol. 2000, 110, 143–157. [Google Scholar]
- Werther, J. Measurement techniques in fluidized beds. Powder Technol. 1999, 102, 15–36. [Google Scholar]
- Van Ommen, J.R.; Mudde, R.F. Measuring the gas-solids distribution in fluidized beds—A review. Int. J. Chem. Reactor Eng. 2008, 6. [Google Scholar] [CrossRef]
- Makkawi, Y.; Ocone, R. Integration of ECT measurements with hydrodynamic modelling of conventional gas—Solid bubbling bed. Chem. Eng. Sci. 2007, 62, 4304–4315. [Google Scholar]
- Rautenbach, C.; Mudde, R.F.; Yang, X.; Melaaen, M.C.; Halvorsen, B.M. A comparative study between electrical capacitance tomography and time-resolved X-raytomography. Flow Meas. Instrum. 2013, 30, 34–44. [Google Scholar]
- Wang, F.; Marashdeh, Q.; Fan, L.-S.; Warsito, W. Electrical capacitance volume tomography: Design and applications. Sensors 2010, 10, 1890–1917. [Google Scholar]
- Xu, J.; Zhu, J. Effects of particle properties on flow structure in a 2-D circulating fluidized bed: Solids concentration distribution and flow development. Chem. Eng. Sci. 2011, 66, 5064–5076. [Google Scholar]
- Saberi, B.; Shakourzadeh, K.; Guigon, P. Local solid concentration measurement by fibre optics: Application to circulating fluidized beds. Chem. Eng. Res. Des. 1998, 76, 748–752. [Google Scholar]
- Rundqvist, R.; Magnusson, A.; van Wachem, B.G.M.; Almstedt, A.E. Dual optical fibre measurements of the particle concentration in gas/solid flows. Exp. Fluids 2003, 35, 572–579. [Google Scholar]
- Zhang, H.; Zhu, J.X.; Bergougnou, M.A. Hydrodynamics in downflow fluidized beds (1): Solids concentration profiles and pressure gradient distributions. Chem. Eng. Sci. 1999, 54, 5461–5470. [Google Scholar]
- Zhu, H.; Zhu, J. Characterization of fluidization behavior in the bottom region of CFB risers. Chem. Eng. J. 2008, 141, 169–179. [Google Scholar]
- Amos, G.; Rhodes, M.J.; Benkreira, H. Calculation of optic fibres calibration curves for the measurement of solids volume fractions in multiphase flows. Powder Technol. 1996, 88, 107–121. [Google Scholar]
- Link, J.M.; Godlieb, W.; Tripp, P.; Deen, N.G.; Heinrich, S.; Kuipers, J.A.M.; Schönherr, M.; Peglow, M. Comparison of fibre optical measurements and discrete element simulations for the study of granulation in a spout fluidized bed. Powder Technol. 2009, 189, 202–217. [Google Scholar]
- Cutolo, A.; Rendina, I.; Arena, U.; Marzocchella, A.; Massimilla, L. Optoelectronic technique for the characterization of high concentration gas-solid suspension. Appl. Opt. 1990, 29, 1317–1322. [Google Scholar]
- Li, X.; Yang, C.; Yang, S.; Li, G. Fiber-optical sensors: Basics and applications in multiphase reactors. Sensors 2012, 12, 12519–12544. [Google Scholar]
- Ximei, Z. Measurements on the Local Solids Concentration in the Lower Part of a Circulating Fluidized Bed Riser. Proceedings of the International Conference on Energy and Environment Technology (ICEET 2009), Guilin, China, 16–18 October 2009; pp. 728–732.
- Soo, S.L. Instrumentation for Fluid-Particle Flow; Noyes Publications: Park Ridge, NJ, USA, 1999. [Google Scholar]
- Matsuno, Y.; Yamaguchi, H.; Oka, T.; Kage, H.; Higashitani, K. The use of optic fiber probes for the measurement of dilute particle concentrations: Calibration and application to gas-fluidized bed carryover. Powder Technol. 1983, 36, 215–221. [Google Scholar]
- Lischer, D.J.; Louge, M.Y. Optical fiber measurements of particle concentration in dense suspensions: Calibration and simulation. Appl. Opt. 1992, 31, 5106–5113. [Google Scholar]
- Herbert, P.M.; Gauthier, T.A.; Briens, C.L.; Bergougnou, M.A. Application of fiber optic reflection probes to the measurement of local particle velocity and concentration in gas—Solid flow. Powder Technol. 1994, 80, 243–252. [Google Scholar]
- Liu, J.; Grace, J.R.; Bi, X. Novel multifunctional optical-fiber probe: I. Development and validation. AlChE J. 2003, 49, 1405–1420. [Google Scholar]
- Hong, J.; Tomita, Y. Measurement of distribution of solids concentration on high density gas-solids flow using an optical-fiber probe system. Powder Technol. 1995, 83, 85–91. [Google Scholar]
- Maozhan, Q. Hydrodynamics and Micro Flow Structure of Gas-Solid Circulating Turbulent Fluidized Beds. Ph.D. Thesis, The University of Western Ontario, London, ON, Canada, 2012. [Google Scholar]
- Yamazaki, H.; Tojo, K.; Miyanami, K. Measurement of local solids concentration in a suspension by an optical method. Powder Technol. 1992, 70, 93–96. [Google Scholar]
- Zhou, J.; Grace, J.R.; Qin, S.; Brereton, C.M.H.; Lim, C.J.; Zhu, J. Voidage profiles in a circulating fluidized bed of square cross-section. Chem. Eng. Sci. 1994, 49, 3217–3226. [Google Scholar]
- Zhang, H.; Johnston, P.M.; Zhu, J.X.; de Lasa, H.I.; Bergougnou, M.A. A novel calibration procedure for a fiber optic solids concentration probe. Powder Technol. 1998, 100, 260–272. [Google Scholar]
- San, J.M.J.; Olazar, M.; Alvarez, S.; Bilbao, J. Local bed voidage in conical spouted beds. Ind. Eng. Chem. Res. 1998, 37, 2553–2558. [Google Scholar]
- Johnsson, H.; Johnsson, F. Measurements of local solids volume-fraction in fluidized bed boilers. Powder Technol. 2001, 115, 13–26. [Google Scholar]
- Cui, H.; Mostoufi, N.; Chaouki, J. Comparison of Measurement Techniques of Local Particle Concentration for Gas-Solid Fluidization. In Fluidization X; Engineering Foundation: New York, NY, USA, 2001; pp. 779–786. [Google Scholar]
- Liu, J.; Grace, J.R.; Bi, X. Novel multifunctional optical-fiber probe: II. High-density CFB measurements. AlChE J. 2003, 49, 1421–1432. [Google Scholar]
- Issangya, A.S. Flow Dynamics in High Density Circulating Fluidized Beds. Ph.D. Thesis, The University of British Columbia, Vancouver, BC, Canada, 1998. [Google Scholar]
- Magnusson, A.; Rundqvist, R.; Almstedt, A.E.; Johnsson, F. Dual fibre optical probe measurements of solids volume fraction in a circulating fluidized bed. Powder Technol. 2005, 151, 19–26. [Google Scholar]
- Wei, W.; Qingliang, G.; Yuxin, W.; Hairui, Y.; Jiansheng, Z.; Junfu, L. Experimental study on the solid velocity in horizontal dilute phase pneumatic conveying of fine powders. Powder Technol. 2011, 212, 403–409. [Google Scholar]
- Manyele, S.V.; Zhu, J.X.; Khayat, R.E.; Pärssinen, J.H. Analysis of the chaotic dynamics of a high-flux CFB riser using solids concentration measurements. China Particuol. 2006, 4, 136–146. [Google Scholar]
- Rensner, D.; Werther, J. Estimation of the effective measuring volume of single-fibre reflection probes for solid volume concentration measurements. Part. Part. Syst. Charact. 1993, 10, 48–55. [Google Scholar]
- Bos, A.S.; Heerens, J.J. Light backscattering as a technique to measure solids particle size and concentration in suspension. Chem. Eng. Commun. 1982, 16, 301–311. [Google Scholar]
- Amos, G. Fluid Dynamics of Upward-Flowing Gas-Solids Suspensions. Ph.D. Thesis, University of Bradford, Bradford, UK, 1994. [Google Scholar]


| Year | Author | Probe Type | Material | Particle Diameter | Particle Density | Calibration Apparatus | Verification Method | Linear/Non-Linear Calibration Curve | Remarks | Measuring System |
|---|---|---|---|---|---|---|---|---|---|---|
| 1983 | Matsuno et al. | Reflection-type | Glass beads | 56.5 μm | 2520 kg/m3 | vibrating sieves | Theoretical calculation | linear | Limited to low solids concentration | Gas-fluidized bed |
| 1990 | Cutolo et al. | Transmissi on-type | Glass beads | 90 μm | - | A solids feed hopper with a 41 mm i.d. and 1 m high Plexiglas pipe | Theoretical calculation | linear | Good linearity when the volume was below 0.1 | Highconcentration (up to 0.16) gas-solid suspension |
| 1992 | Lischer and Louge | Reflection-type | Glass beads | 70 μm 210 μm | - | 15 cm i.d. pipe | capacitance probe/simulatio n calculation | non-linear | Simple construction | - |
| 1992 | Yamazaki et al. | Reflection-type | Glass beads | 225 μm | 2,490 kg/m3 | a flat-bottomed cylindrical tank of 6.0 cm diameter | Theoretical calculation | non-linear | The refractive index of liquids is different from that of gases | Slurry mixing tank |
| 131 μm | 2,490 kg/m3 | |||||||||
| 42 μm | 2,350 kg/m3 | |||||||||
| Toyoura sands | 163 μm | 2,650 kg/m3 | ||||||||
| PVC powders | 164 μm | 1,500 kg/m3 | ||||||||
| 1994 | Zhou et al. | Reflection-type | Ottawa sand | 213μm | 2,640 kg/m3 | a liquid-solid fluidized bed/well-stirred water-sand beaker | Theoretical calculation | near-linear | The refractive index of liquids is different from that of gases | CFB of square cross-section |
| 1994 | Herbert et al. | Reflection-type | FCC particles | 0.78 mm | 1,630 kg/m3 | A fluidized feeder with a 2.5 m long and 8 × 8 mm square cross-section tube | Theoretical calculation | non-linear | The volume fraction range calibrated was only 0.01 to 0.1 | 0.05 m diameter downflow CFB reactor |
| 1994 | Zhou et al. | Reflection-type | Ottawa sand | 213 μm | 2,640 kg/m3 | a liquid-solid fluidized bed/well-stirred water-sand beaker | Theoretical calculation | near-linear | The refractive index of liquids is different from that of gases | CFB of square cross-section |
| 1995 | Hong et al. | Reflection-type | Limestone | 0.124 mm | 2,170 kg/m3 | fluidized vessel | Theoretical calculation | non-linear | A powder with very homogeneous fluidized behavior is more suitable | Horizontal pneumatic piplies |
| 1998 | San José et al. | Reflection-type | Glass beads | 3 mm | 2,420 kg/m3 | moving bed/60 mm i.d. column | image treatment system | linear | - | Conical spouted beds |
| 4 mm | ||||||||||
| 5 mm | ||||||||||
| 1998 | Zhang et al. | Reflection-type | FCC particles | 49.4 μm | 1,500 kg/m3 | An incipiently fluidized bed and vibrating solids feeder with a 3.81 m downer | quick closing valves | non-linear | The solids concentration range calibrated could be from 0 to about 0.56 | - |
| 59.0 μm | 1,420 kg/m3 | |||||||||
| 2001 | Johnsson et al. | Reflection-type | Silica sand | 0.30 mm | - | cold CFB riser | Optical reference probe | non-linear | - | Electrically heated fluidized bed/CFB boiler |
| 2001 | Cui et al. | Reflection-type | FCC particles Sand | 70 μm | 1,673 kg/m3 | Mixtures of FCC and amorphous transparent polystyrene | Theoretical calculation | non-linear | Use known solids concentration mixture to simulate gas-solid flow | Air-fluidized bed |
| 385 μm | 2,650 kg/m3 | |||||||||
| 2003 | Rundqvist et al. | Reflection-type | Silica sand | 0.15 mm | - | small stirred tank with water | Theoretical calculation | near-linear | - | - |
| 0.20 mm | ||||||||||
| 2003 | Liu et al. | Reflection-type | FCC particles | 70 μm | - | 3-D gas-solid suspension/well-mixed water-FCC tank | quick-closing valves/Theoretical calculation | non-linear | - | High-density CFB riser |
| 2005 | Magnusson et al. | Reflection-type | Silica sand | 0.08 mm | 2,600 kg/m3 | circulating fluidized bed | pressure drop measurement | non-linear | - | CFB |
| 0.46 mm | ||||||||||
| Powder | Average Diameter (μm) | Particle Poured Bulk Density (kg/m3) | Particle Density (kg/m3) | Color | |
|---|---|---|---|---|---|
| Glass beads | GB 1# | 60.29 | 1,390 | 2,650 | grey |
| GB 2# | 104.3 | 1,400 | |||
| GB 3# | 166.8 | 1,430 | |||
| Quartz sand | QS 1# | 66.53 | 1,200 | 2,610 | white |
| QS 2# | 78.85 | 1,300 | |||
| QS 3# | 192.8 | 1,320 | |||
© 2013 by the authors; licensee MDPI, Basel, Switzerland. This article is an open access article distributed under the terms and conditions of the Creative Commons Attribution license (http://creativecommons.org/licenses/by/3.0/).
Share and Cite
Xu, G.; Liang, C.; Chen, X.; Liu, D.; Xu, P.; Shen, L.; Zhao, C. Investigation on Dynamic Calibration for an Optical-Fiber Solids Concentration Probe in Gas-Solid Two-Phase Flows. Sensors 2013, 13, 9201-9222. https://doi.org/10.3390/s130709201
Xu G, Liang C, Chen X, Liu D, Xu P, Shen L, Zhao C. Investigation on Dynamic Calibration for an Optical-Fiber Solids Concentration Probe in Gas-Solid Two-Phase Flows. Sensors. 2013; 13(7):9201-9222. https://doi.org/10.3390/s130709201
Chicago/Turabian StyleXu, Guiling, Cai Liang, Xiaoping Chen, Daoyin Liu, Pan Xu, Liu Shen, and Changsui Zhao. 2013. "Investigation on Dynamic Calibration for an Optical-Fiber Solids Concentration Probe in Gas-Solid Two-Phase Flows" Sensors 13, no. 7: 9201-9222. https://doi.org/10.3390/s130709201