Voltammetric Determination of the Herbicide Linuron Using a Tricresyl Phosphate-Based Carbon Paste Electrode

Abstract
: This paper summarises the results of voltammetric studies on the herbicide 3-(3,4-dichlorophenyl)-1-methoxy-1-methylurea (Linuron), using a carbon paste electrode containing tricresyl phosphate (TCP-CPE) as liquid binder. The principal experimental conditions, such as the pH effect, investigated in Britton-Robinson buffer solutions (pH 2.0–7.0), the peak characteristics for the analyte of interest, or instrumental parameters for the differential pulse voltammetric mode were optimized for the method. As found out, the best electroanalytical performance of the TCP-CPE was achieved at pH 2.0, whereby the oxidation peak of Linuron appeared at ca. +1.3 V vs. SCE. The analytical procedure developed offers good linearity in the concentration range of 1.25–44.20 μg mL−1 (1.77 × 10⁻⁴–5.05 × 10⁻⁶ mol L−1), showing—for the first time—the applicability of the TCP-CPE for anodic oxidations in direct voltammetry (without accumulation). The method was then verified by determining Linuron in a spiked river water sample and a commercial formulation and the results obtained agreed well with those obtained by the reference HPLC/UV determination.1. Introduction
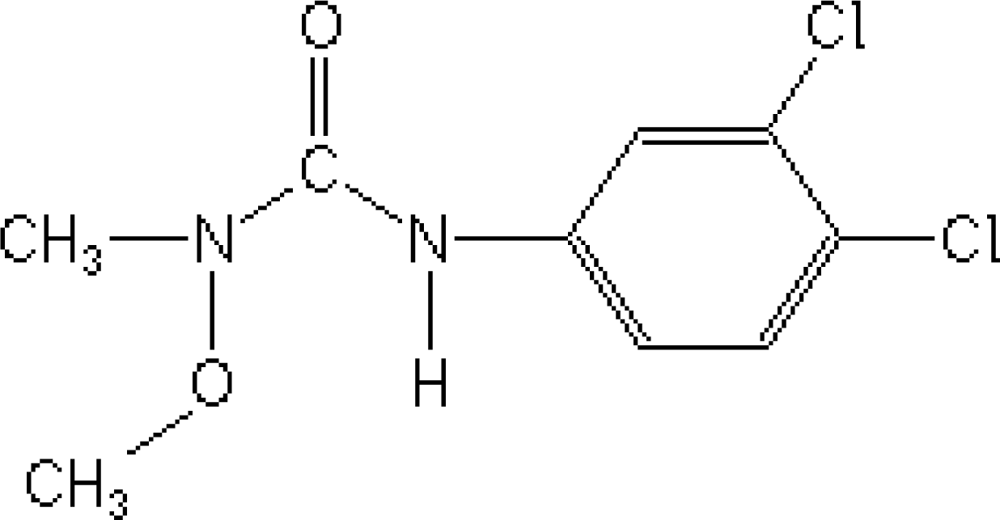
Pesticides, where used correctly, can save up to 40% of crop losses; however, when pesticides are mal-, mis- or over-used, the environmental and public health consequences can be quite severe [1]. Phenylurea herbicides are among the most widely used herbicides in non-crop areas, as well as in tree crops [2]. Linuron [3-(3,4-dichlorophenyl)-1-methoxy-1-methylurea, Figure 1] is a herbicide from the substituted phenylurea family that is used widely for selective control of broadleaf weeds and grasses in fruit or field crops, cereals, and shelter belts [3]. The half-life of Linuron in soil is ca. from 40 to 70 days [2], and the ground water may retain milligram concentrations for several days and weeks [4], depending on the water temperature and pH.
A wide spectrum of analytical methods has been applied to the analysis of pesticides; most of them being based on chromatographic techniques [5,6]. Phenylurea herbicides cannot be analyzed directly by gas chromatography due to their polar and thermolabile nature [7,8], therefore, high performance liquid chromatography (HPLC) is preferably used for phenylurea analysis, often with UV or diode array detection [9–11]. Other detection systems, such as photolysis cells in series with a fluorescence detector [12], post-column derivatization system [13], electrochemical detectors [14], and mass spectrometry [15,16] have been coupled with HPLC to analyze these compounds. However, HPLC is both instrumentally and financially demanding and the respective analysis may be time-consuming.
Compared to these techniques modern voltammetric methods—in combination with a large variety of electrodes and other detection systems [17,18]—are usually simpler, inexpensive, rapid, as well as sufficiently sensitive and selective to be employed for a large-scale monitoring of electrochemically active environmental pollutants [17]. Among the electrodes of choice, the so-called carbon paste electrodes (CPEs [19–22]) offer a number of advantageous features; namely, simple preparation (often in labs in a wide palette of various configurations, including very special mixtures), minimal cost, favorable signal-to-noise characteristics (in both faradic and non-faradic measurements), unique surface characteristics, and mainly, almost unlimited possibilities for chemical and biological modification [21,23–25]. When one considers also their enviromentally friendly character, wide adaptability to the latest trends, or a full compatibility with miniaturised detection systems and modern technologies, it is not so surprising that these electrodes are so frequently employed in analysis of pesticides and related substances (see [22] and refs. therein).
This is also the case of hitherto-known voltammetric studies dealing with Linuron, where CPEs have represented a fully comparable alternative to other carbon-based electrodes [26–29], including some micro- and ultramicro-configurations [28,29].
One of “special” carbon pastes mentioned above as possible alternative is a mixture of graphite powder and liquid tricresyl phoshate (TCP), introduced into electrochemistry with CPEs in the early 1990s [30,31]. The configuration of the TCP-CPE was inspired by research work by Kalcher, who had employed similar substances as liquid ion-exchangers properties intentionally selected for modification of carbon paste [32–34], as well as by previous use of TCP as the plasticizer for liquid membranes of some ion-selective electrodes [35]. The resultant TCP-CPE is a typical representative of a CPE with chemically active binder, where the molecules of organophoshate can readily be protonated [36]:
Thus, the main goal of this work was the basic voltammetric characterization of Linuron and subsequently, the elaboration of a simple and effective method for its determination at the TCP-CPE, when using a Britton-Robinson buffer as the supporting electrolyte of choice. The resultant differential pulse voltammetric method could then be successfully applied to determine the herbicide in model solutions, a spiked river water sample and in a specimen of a commercial formulation. All the important observations and results are given in the following sections.
2. Experimental Procedures
2.1. Chemicals and Solutions
Linuron (purity 95% w/w) was obtained from Galenika-Fitofarmacija A.D. (Serbia). The concentration of the Linuron stock solution—prepared by dissolving this herbicide in methanol (Sigma-Aldrich)—was 2,500 μg mL−1, and it was further diluted as required. As supporting electrolytes, BR buffer solutions of different pHs (between 2.0 and 7.0) were prepared by mixing solutions of 0.04 mol L−1 H3PO4 (Merck), 0.04 mol L−1 H3BO3 (Merck), and 0.04 mol L−1 CH3COOH (Merck) and adjusting pH by adding suitable amounts of 0.2 mol L−1 NaOH (Merck). All other reagents were of analytical reagent grade and solutions were prepared in doubly distilled water. For the preparation of the mobile phase in HPLC experiments, methanol (Sigma-Aldrich, Germany) and doubly distilled water were used. The river water sample was collected from the Tisa River (Senta, Serbia) and stored in the dark at ca. 4 °C for one week before analysis.
2.2. Apparatus
Voltammetric experiments were performed on an Autolab (PGSTAT12, Ecochemie, The Netherlands) electrochemical analyzer operated via the GPES 4.9 software from the same manufacturer. The cell stand included a three-electrode system with a TCP-CPE as working electrode, a saturated calomel electrode (SCE, Amel, Italy) as the reference, and a platinum auxiliary electrode (Amel). All potentials are quoted vs. SCE reference electrode. A PC–controlled magnetic stirrer was employed rotating at approx. 300 rpm. All electrochemical experiments were carried out in a one-compartment 20 mL−1 voltammetric cell at room temperature at ca. 23 ± 1 °C. The reference HPLC measurements were performed using a Dionex-0650 liquid chromatograph (Dionex, USA), Agilent Eclipse XDB-C18 (4.6 mm × 250 mm, 3.5 μm) column, and a UV-detector.
2.3. Procedures
Preparation of CPE. Carbon paste was made by thorough hand-mixing CR 5 graphite powder (Maziva Týn, Czech Republic, 0.25 g) with 0.1 mL tricresyl phosphate (mixture of isomers, Sigma-Aldrich Chemie GmbH, Switzerland) as the pasting liquid. The detailed procedure of the electrode preparation was described earlier [46]. The paste was packed into a piston-driven Teflon® holder [51]. The electrode surface of CPEs (2 mm in diameter) was renewed mechanically by smoothing some paste off with a wet piece of filter paper before starting a new set of experiments.
Voltammetry on TCP-CPE. Solutions were measured in 10.00 mL of Britton-Robinson (BR) buffer supporting electrolyte to which different concentrations of Linuron was added. The solutions were deaerated by passing a nitrogen stream through them for 5 min. The voltammograms were recorded at room temperature. Before each measurement, the buffer-immersed working electrode was electrochemically activated by potential cycling (with 50 cycles) in the range from −0.1 to +1.6 V using a scan rate, v = 0.25 V s−1. Before measuring Linuron, the blank signal was recorded in the supporting electrolyte. The scan rate in the cyclic voltammetric (CV) investigation of Linuron was 25 mV s−1. The DPV measurement parameters were as follows: start potential −0.1 V, end potential +1.6 V, pulse amplitude 50 mV, pulse width 50 ms, pulse time of 0.05 s, and scan rate 25 mV s−1. The model solutions and also the river water sample were measured without filtering.
Chromatography. For the HPLC/UV analysis, all aliquots were filtered through Restek 0.22 μm syringe filters. The mobile phase was a mixture of methanol and doubly distilled water in ratio 7:3, v/v. The separation was performed in the isocratic regime and the flow rate was 0.8 mL min−1. Linuron was detected at a wavelength of 220 nm with the retention time of 12 min.
Real Sample Preparation. Because HPLC analysis did not confirm the presence of detectable amounts of the target compound, the river water sample was spiked with the standard solution of Linuron to achieve a concentration of 14.92 μg mL−1. The sample was kept in the dark at ca. 4 °C for 1 h before analysis without any sample pretreatment. Before DPV measurements the aliquots of the spiked river water sample were diluted with BR buffer pH 2.0 in ratio 1:1 v/v. The commercial formulation of Linuron, Galolin mono, was dissolved in methanol and further diluted with BR buffer pH 2.0 to the required concentration. Filtering was performed only before HPLC measurements.
3. Results and Discussion
3.1. Voltammetric Investigation of Linuron at TCP-CPE
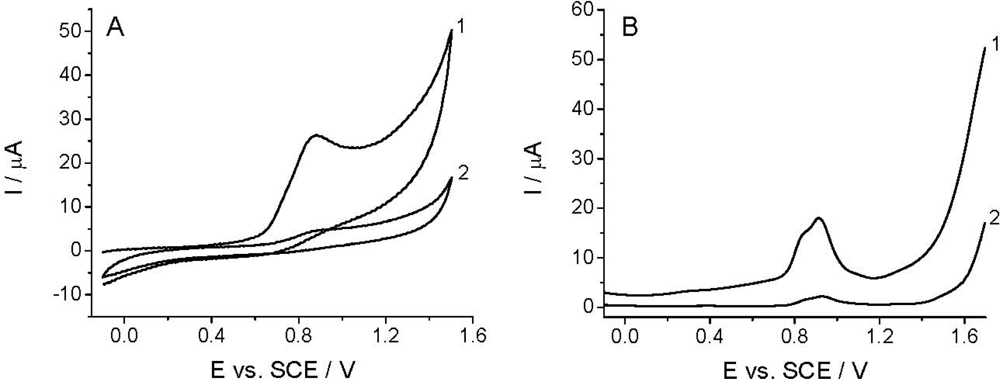
The voltammetric detection, as well as the determination of Linuron is based on its oxidation at the working electrode [26–29]. Among others, the quality of the analytical signal depens on the nature of working electrode, electrode pretreatment, supporing electrolyte, and the compound investigated. Figure 2 shows that the CV and DPV curves (curves 1) obtained in the BR buffer solution at pH 2.0 recorded with TCP-CPE working electrode contained one irreversible oxidation peak with Ep at around +0.9 V. The oxidation peak is wide and covers the potential range between +0.65 and +1.10 V, which makes difficult to measure within this potential range. This undesirable signal is also present in some another electrolytes (phosphate, sulfate, acetate), and it is assumed to be a result of the oxidation of the working electrode surface. Additionally, the residual current is too high; especially, from +0.7, narrowing the accessible potential window of the working electrode. As well known, electrochemical pretreatment (also termed electrochemical activation) of the working electrode surface is a widely used procedure to enhance sensitivity and selectivity in voltammetric analyses of organic compounds [52]. Both anodic (or cathodic) polarization performed at extreme potentials and anodic-cathodic cycling, are commonly employed procedures to pre-treat the surface of carbon electrodes, including CPEs [53,54], for which one can also utilize a special “surface erosion” with surfactants [55]. In order to obtain reproducible response, a lower residual current and wider potential window in the anodic range the TCP-CPE working electrode was subjected to electrochemical activation by potential cycling in the range from −0.1 to +1.60 V (10 cycles, v = 0.25 V s−1) in the blank prior to measurements. This pretreatment led to a significant improvement in the baseline characteristics in the case of both CV and DPV measurements (Figure 2, curves 2). Increasing the number of potential cycles (curves) lead to a further widening of the potential window, decreases of the mentioned oxidation peak an additional signal stabilization. During the electrochemical treatment the TCP-CPE did not lose its sensitivity.
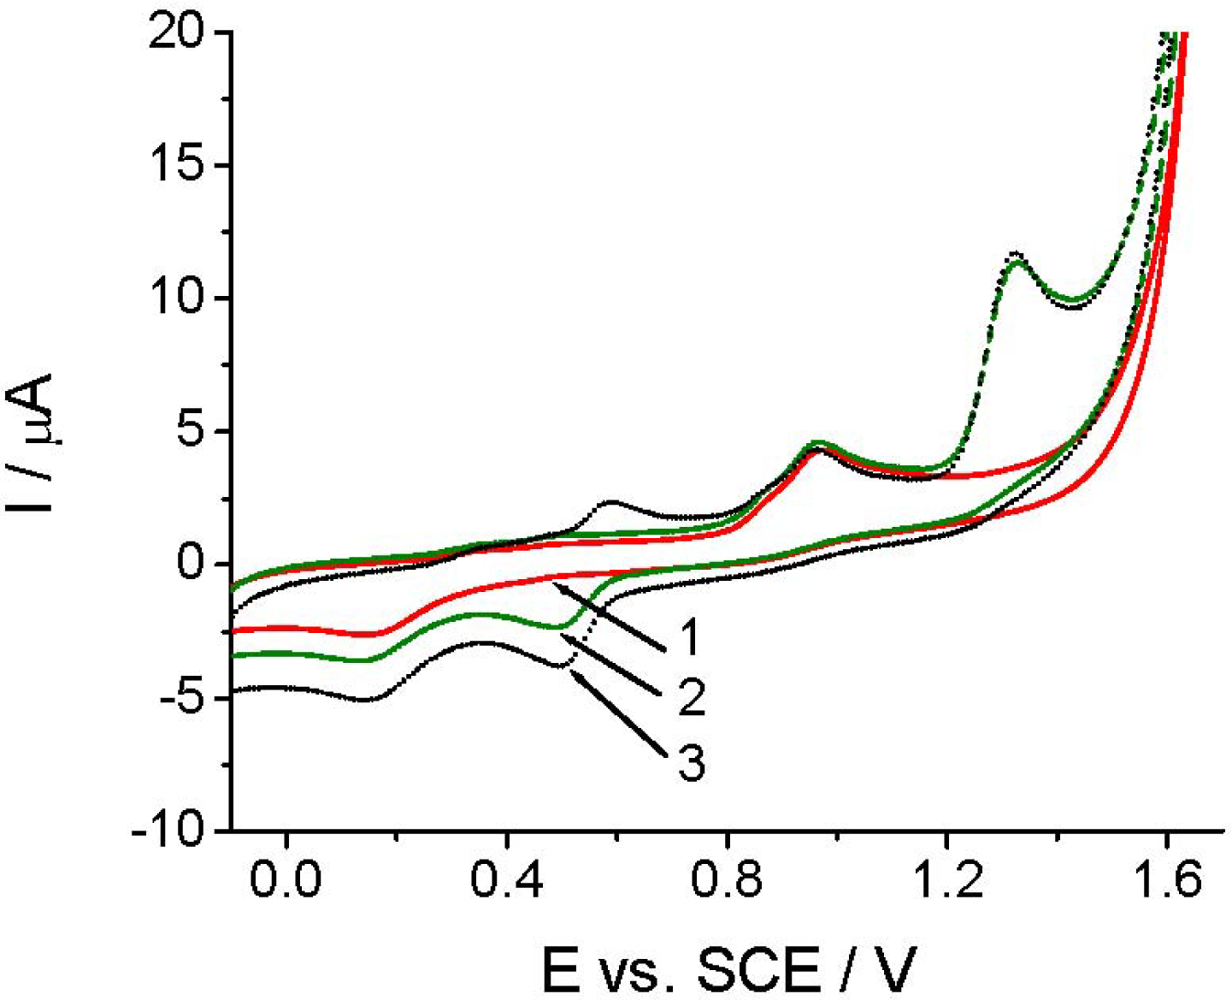
Before applying TCP-CPE for quantitative determinations, it was also necessary to perform characterization of the target compound. As demonstrated at pH 2.0 (Figure 3), Linuron exhibited a rather complex electrochemical behavior. On the first cyclic voltammogram (curve 2), in addition to the peaks at +0.14 and +0.95 V, which are also present in the blank (curve 1), a well defined Linuron oxidation peak appears at +1.32 V. The oxidation of Linuron resulted in the appearance of a new reduction signal at around +0.5 V in the second potential half-cycle (Figure 3, curve 2). In the second cycle (after solution stirring), a counterpart of this signal appeared in the positive scan at ca. +0.6 V (Figure 3, curve 3). The appearance of these new signals corresponded possibly to the degradation products of Linuron [29]. The appearance of the new signals did not affected the intensity of the analytical signal, neither in CV nor in DPV mode, which allowed us to choose a simpler direct voltammetric determination also for achieving a good reproducibility.
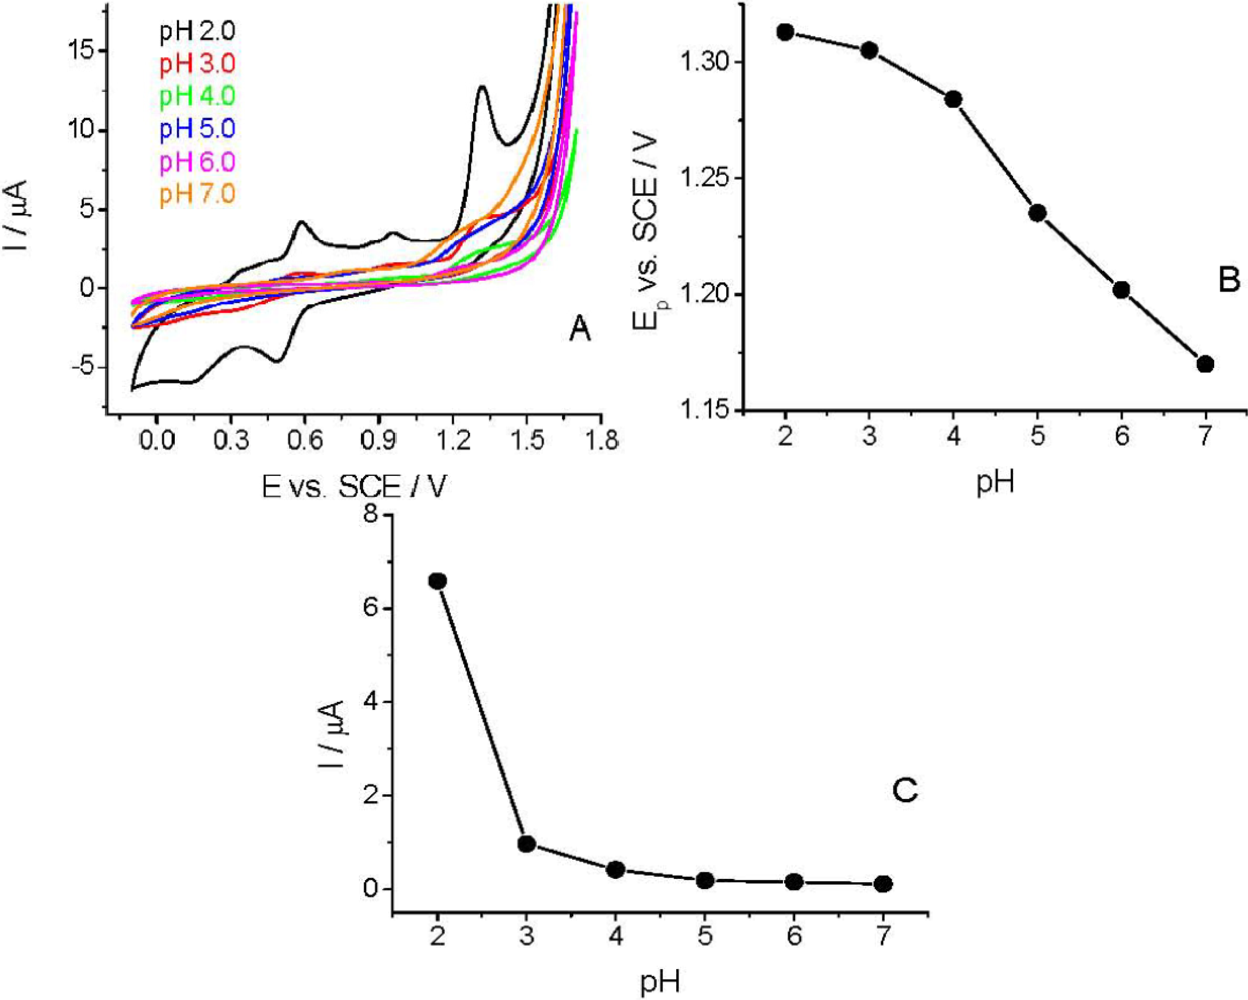
The CV curves were recorded in the pH range of 2.0–7.0 to study the effect of pH on the voltammetric behavior of Linuron. The sharpest and most favorably developed oxidation peak for Linuron was obtained in strongly acidic solution (pH 2.0). As clearly visible (Figure 4), both peak potential and peak current intensity depend on the pH of the supporting electrolyte. At pH > 3.0 the peak potential (Ep) is more pH-dependent than at lower pHs. This pH-dependency indicates the involvement of protons in the electrode reaction and that the proton-transfer reaction precedes the electrode process proper. Similarly to the earlier published experimental data [28,29], the Ep–pH plot [Figure 4(B)] for the main oxidation peak shows two linear parts with a break at approximately pH 4.0; the slope of the first part being 14.5 mV pH−1 and of the second one 37.5 mV pH−1.
3.2. Direct Anodic DPV Determination of Linuron at TCP-CPE
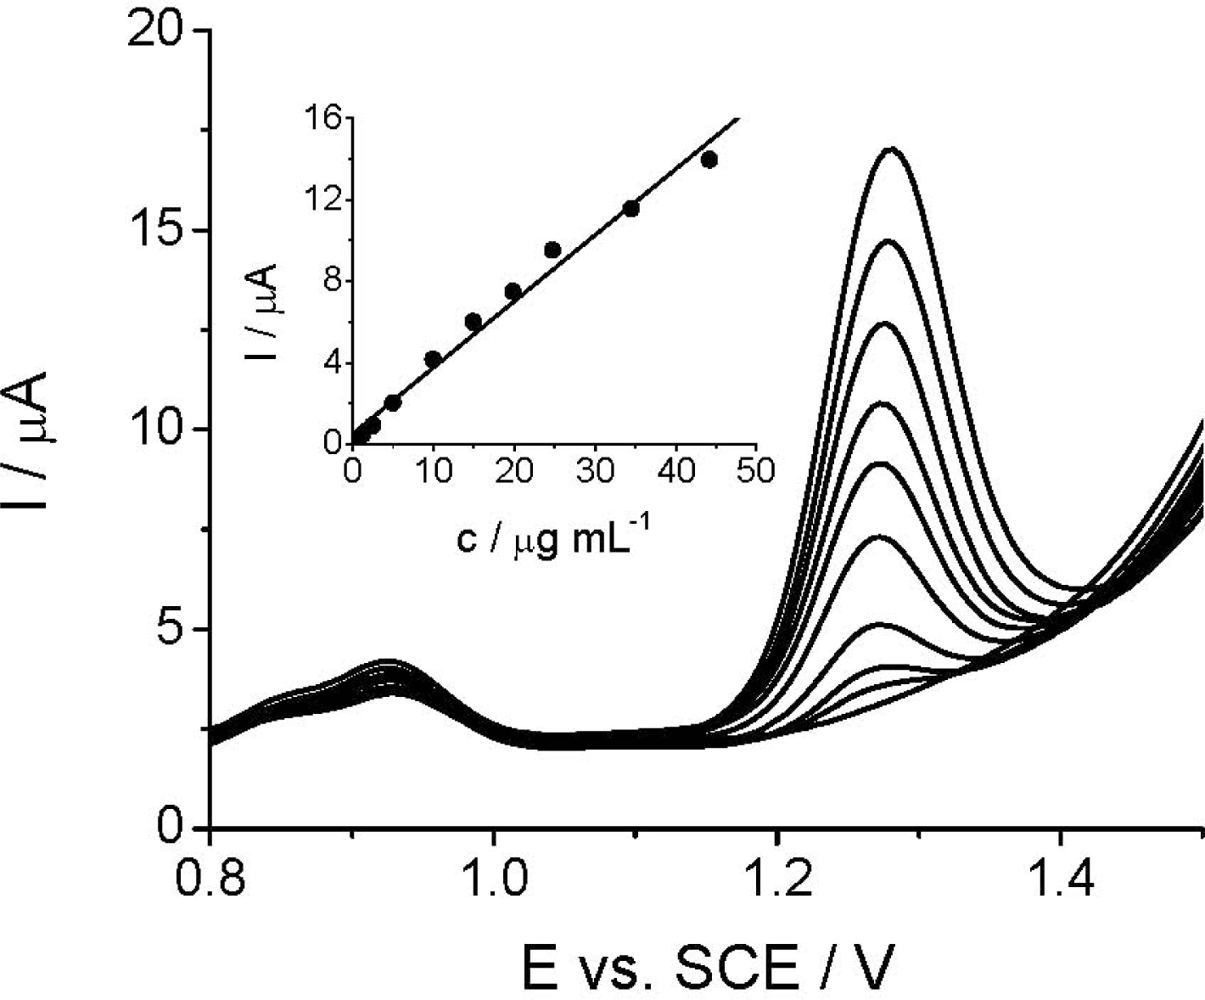
The quantitative DPV determination of Linuron at TCP-CPE is based on the linear relationship between the peak current intensity at +1.3 V and Linuron concentration. As can be seen, Linuron could be determined by DPV in the concentration range of 1.25–44.20 μg mL−1 (1.77 × 10⁻⁴–5.05 × 10⁻⁶ mol L−1) (Figure 5), while the relative standard deviation (RSD) did not exceed 2.7%. The analytical parameters of the developed DPV method and the comparative HPLC/UV measurements are shown in the Table 1.
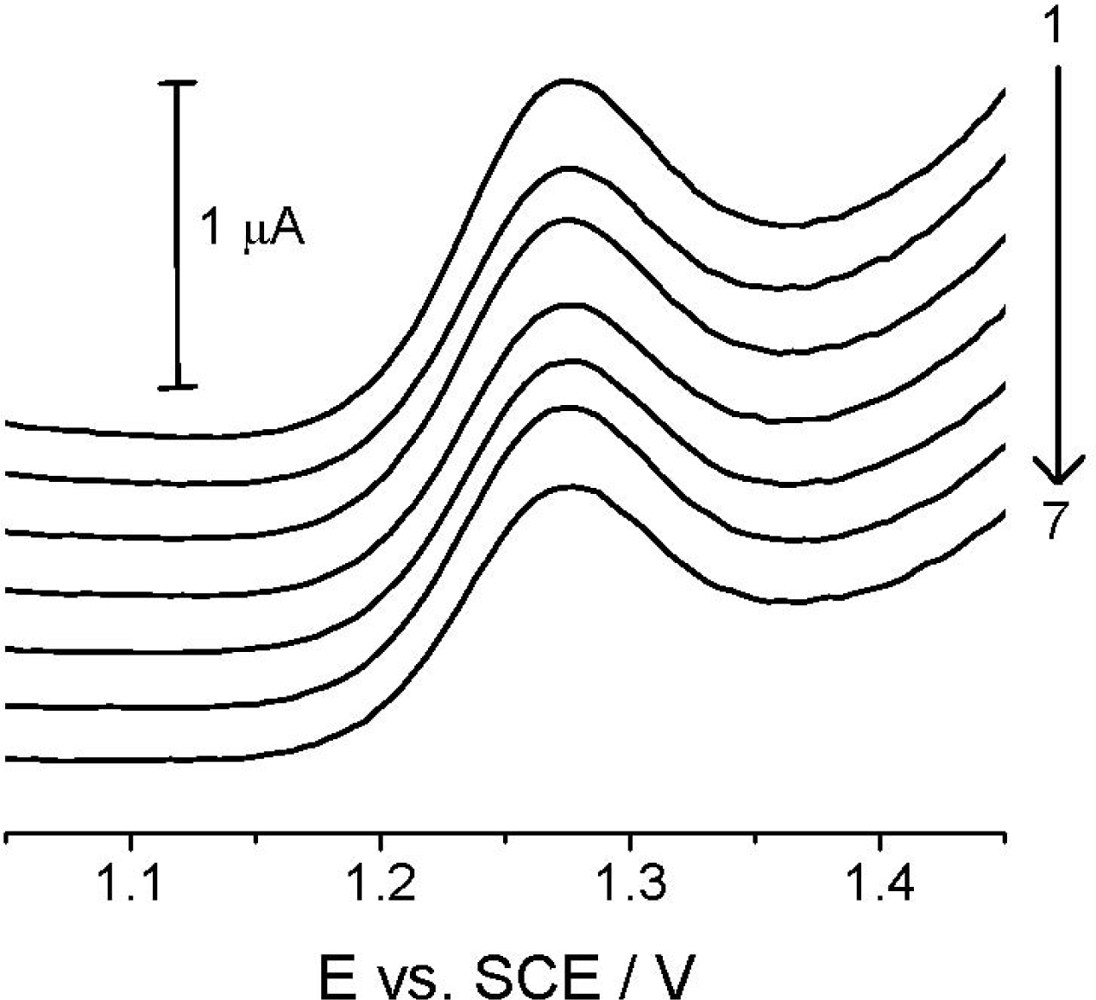
Reproducibility studies at TCP-CPE were also performed, first of all to check the signal stability and possible changes in its shape because of potentially approaching absorption/adsorption processes. Figure 6, in which records are presented for seven repeated measurements of the 4.99 μg mL−1 (2.00 × 10⁻⁵ mol L−1) Linuron solution, showing good reproducibility of the analytical signal in the time interval of approx. 30 minutes, with no significant changes in the electrode properties and the analyte signal itself during the experimentation.
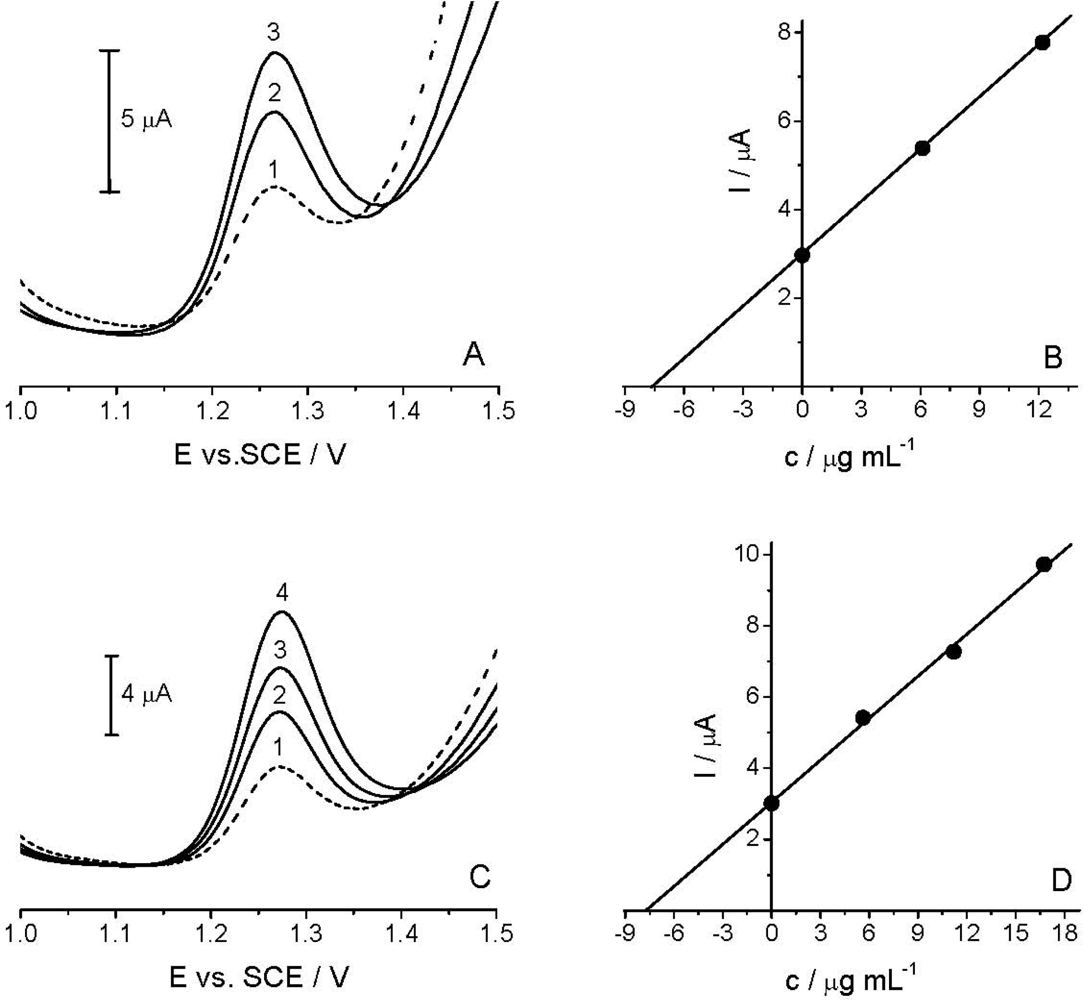
The applicability of the voltammetric procedure was tested by the determination of the Linuron in the spiked river water sample [Figure 7(A)] and commercial formulation Galolin mono [Figure 7(C)], using DPV with TCP-CPE.
As HPLC/UV measurements did not confirm the presence of Linuron in the analyzed river water sample, in subsequent experiments a spiked sample (14.92 μg mL−1) was used. As described in Section 2.3, the sample was diluted with BR pH 2.0 at a 1:1 v/v ratio. The standard addition method was applied for the determination of the target compound [Figure 7(B)]. Like in the river water analysis, the content of the active compound in the analyzed commercial formulation was determined by the standard addition method [Figure 7(D)]. Good correlation between the quantity determined and the amount added/declared, as well as fairly low RSD, reflected both the high accuracy and precision of the proposed method (see Table 2). Finally, the results obtained by DPV method agreed well with the comparative HPLC/UV analysis (Table 2). Thus, it can be stated that further experiments are needed to further extend the applicability of the TCP-CPE for anodic oxidations, as well as to achieve yet better detection parameters for particularly low concentrations of the target compound in some environmental samples.
4. Conclusions
In this article, the tricresyl phosphate-based carbon paste electrode, TCP-CPE, has been shown to be the electrode of choice for the determination of an organic pollutant—the herbicide Linuron. As demonstrated and discussed in the previous sections, the respective quantitative measurements can be characterized by all principal features needed for the use of the method developed in environmental analysis. Moreover, the TCP-CPE—as a typical representative of special carbon paste electrodes with the chemically active binder [21]—has been employed for the first time in direct voltammetry (i.e., without an accumulation step); in this case, for anodic oxidation at a very high positive potential, when using a sensitive differential pulse potential ramp.
Thus, in contrast to many previous procedures employing the TCP-CPE in electrochemical stripping analysis (ESA) with pre-concentration step (see [31,36–39,43–45]), there is yet another interesting aspect of this method that is associated with direct measurements and that has not been described above. It is a lowered risk of unwanted saturation of the TCP-CPE surface layer which is among the less attractive features of this special CPE and which has been observed repeatedly (see e.g., [36,38,41]) as a spontaneous extraction of the analyte into the deep carbon paste bulk, requiring afterwards a very thorough removal of so “infected” paste (up to several mms of paste portion extruded from the body). On the other hand, the use of some of ESA techniques with an incorporated accumulation step would surely lead to an improvement in detection capabilities of the TCP-CPE towards presented herein for direct measurements. Then, there will be a strong motivation for continuing investigations with this electrode in practical electroanalysis—to find and define a compromise in using TCP-CPE within an ESA procedure. It seems that it could be accomplished by means of pre-concentration for a very short period (e.g., 5–10 s), for which the specific saturation inside the TCP-based carbon pastes would not be so pronounced.
Acknowledgments
Financial support from the Ministry of Education and Science of the Republic of Serbia (Project No. 172012 and III 45006), the Secretariat for Science and Technological Development, Autonomous Province of Vojvodina, Republic of Serbia (No. 114-451-02011/2007-02), the Ministry of Education, Youth and Sports of the Czech Republic (MSM0021627502), and the CEEPUS II program (CII-CZ-0212-04-1011) are gratefully acknowledged.
References
- Richardson, M. Pesticides—friend or foe? Water Sci. Technol 1998, 37, 19–25. [Google Scholar]
- Tomlin, C.D.S. The Pesticide Manual, 15th ed; British Crop Protection Council: Farnham, Surrey, UK, 2009. [Google Scholar]
- Caux, P.-Y.; Kent, R.A.; Fan, G.T.; Grande, C. Canadian water quality guidelines for linuron. Environ. Toxicol. Water Qual 1998, 13, 1–41. [Google Scholar]
- Biziuk, M.; Przyjazny, A.; Czerwinski, J.; Wiergowski, M. Occurrence and determination of pesticides in natural and treated waters. J. Chromatogr. A 1996, 754, 103–123. [Google Scholar]
- Brodesser, J. Quality Control of Pesticides Products; International Atomic Energy Agency: Vienna, Austria, 2009. [Google Scholar]
- Likas, D.T.; Tsiropoulos, N.G. Residue screening in apple, grape and wine food samples for seven new pesticides using HPLC with UV detection. An application to trifloxystrobin dissipation in grape and wine. Int. J. Environ. Anal. Chem 2009, 89, 857–869. [Google Scholar]
- Crespo-Corral, E.; Santos-Delgado, M.J.; Polo-Díez, L.M.; Soria, A.C. Determination of carbamate, phenylurea and phenoxy acid herbicide residues by gas chromatography after potassium tert-butoxide/dimethyl sulphoxide/ethyl iodide derivatization reaction. J. Chromatogr. A 2009, 1209, 22–28. [Google Scholar]
- Carabias-Martínez, R.; García-Hermida, C.; Rodríguez-Gonzalo, E.; Soriano-Bravo, F.E.; Hernández-Méndez, J. Determination of herbicides, including thermally labile phenylureas, by solid-phase microextraction and gas chromatography-mass spectrometry. J. Chromatogr. A 2003, 1002, 1–12. [Google Scholar]
- Ferrer, I.; Barceló, D.; Thurman, E.M. Double-disk solid-phase extraction: Simultaneous cleanup and trace enrichment of herbicides and metabolites from environmental samples. Anal. Chem 1999, 71, 1009–1015. [Google Scholar]
- Lourencetti, C.; de Marchi, M.R.R.; Ribeiro, M.L. Determination of sugar cane herbicides in soil and soil treated with sugar cane vinasse by solid-phase extraction and HPLC-UV. Talanta 2008, 77, 701–709. [Google Scholar]
- Saraji, M.; Tansazan, N. Application of dispersive liquid-liquid microextraction for the determination of phenylurea herbicides in water samples by HPLC-diode array detection. J. Sep. Sci 2009, 32, 4186–4192. [Google Scholar]
- Muñoz de la Peña, A.; Mahedero, M.C.; Bautista-Sánchez, A. Monitoring of phenylurea and propanil herbicides in river water by solid-phase-extraction high performance liquid chromatography with photoinduced-fluorimetric detection. Talanta 2003, 60, 279–285. [Google Scholar]
- Mughari, A.R.; Galera, M.M.; Vázquez, P.P.; Valverde, R.S. Coupled-column liquid chromatography combined with postcolumn photochemical derivatization and fluorescence detection for the determination of herbicides in groundwater. J. Sep. Sci 2007, 30, 673–678. [Google Scholar]
- Henze, G.; Meyer, A.; Hausen, J. Determination of the phenylurea herbicide linuron and its metabolites in environmental samples by HPLC with serial ultraviolet and amperometric detection. Fresenius J. Anal. Chem 1993, 346, 761–765. [Google Scholar]
- Dagnac, T.; Bristeau, S.; Jeannot, R.; Mouvet, C.; Baran, N. Determination of chloroacetanilides, triazines and phenylureas and some of their metabolites in soils by pressurised liquid extraction, GC-MS/MS, LC-MS and LC-MS/MS. J. Chromatogr. A 2005, 1067, 225–233. [Google Scholar]
- Dujaković, N.; Grujić, S.; Radišić, M.; Vasiljević, T.; Laušević, M. Determination of pesticides in surface and ground waters by liquid chromatography–electrospray–tandem mass spectrometry. Anal. Chim. Acta 2010, 678, 63–72. [Google Scholar]
- Barek, J.; Fischer, J.; Navratil, T.; Peckova, K.; Yosypchuk, B.; Zima, J. Nontraditional electrode materials in environmental analysis of biologically active organic compounds. Electroanalysis 2007, 19, 2003–2014. [Google Scholar]
- Wang, J. Analytical Electrochemistry, 3rd ed; Wiley-VCH: Hoboken, NJ, USA, 2006. [Google Scholar]
- Adams, R.N. Carbon paste electrodes. Anal. Chem 1958, 30, 1576. [Google Scholar]
- Švancara, I.; Vytřas, K.; Kalcher, K.; Walcarius, A.; Wang, J. Carbon paste electrodes in facts, numbers, and notes: A Review on the occasion of the 50-years jubilee of carbon paste in electrochemistry and electroanalysis. Electroanalysis 2009, 21, 7–28. [Google Scholar]
- Švancara, I.; Kalcher, K.; Walcarius, A.; Vytřas, K. Electroanalysis with Carbon Paste Electrodes; Taylor & Francis/CRC Press: Boca Raton, FL, USA, In Press.
- Guzsvány, V.; Papp, Zs.; Švancara, I.; Vytřas, K. Electroanalysis of Insecticides at Carbon Paste Electrodes with Particular Emphasis on Selected Neonicotinoid Derivatives. In Insecticides—Advances in Integrated Pest Management; Perveen, F., Ed.; InTech: Rijeka, Croatia, in press.
- Kalcher, K. Chemically modified carbon paste electrodes in voltammetric analysis. Electroanalysis 1990, 2, 419–433. [Google Scholar]
- Kalcher, K.; Kauffmann, J.-M.; Wang, J.; Švancara, I.; Vytřas, K.; Neuhold, C.; Yang, Z. Sensors based on carbon paste in electrochemical analysis: A Review with particular emphasis on the period 1990–1993. Electroanalysis 1995, 7, 5–22. [Google Scholar]
- Kalcher, K.; Švancara, I.; Metelka, R.; Vytřas, K.; Walcarius, A. Heterogeneous Electrochemical Carbon Sensors. In The Encyclopedia of Sensors; Grimes, C.A., Dickey, E.C., Pishko, M.V., Eds.; ASP Publishers: Stevenson Ranch, CA, USA, 2006; pp. 283–429. [Google Scholar]
- Hernandez, P.; Vicente, J.; Gonzalez, M.; Hernandez, L. Voltammetric determination of linuron at a carbon-paste electrode modified with sepiolite. Talanta 1990, 37, 789–794. [Google Scholar]
- De Lima, F.; Gozzi, F.; Fiorucci, A.R.; Cardoso, C.A.L.; Arruda, G.J.; Ferreira, V.S. Determination of linuron in water and vegetable samples using stripping voltammetry with a carbon paste electrode. Talanta 2011, 83, 1763–1768. [Google Scholar]
- Gonzalez De La Huebra, M.J.; Hernández, P.; Ballesteros, Y.; Hernández, L. Rapid identification of carbendazim and linuron by adsorptive stripping on a carbon fiber ultramicroelectrode. Fresenius J. Anal. Chem 2000, 368, 853–856. [Google Scholar]
- González de la Huebra, M.J.; Hernández, P.; Ballesteros, Y.; Hernández, L. Determination of linuron in soil by stripping voltammetry with a carbon fiber microelectrode. Talanta 2001, 54, 1077–1085. [Google Scholar]
- Srey, M. Voltammetric and Potenciometric Method for the Determination of Gold. M.Sc. Dissertation (in Czech),. University of Chemistry and Technology, Pardubice, Czech Republic, 1992. [Google Scholar]
- Švancara, I.; Vytras, K. Voltammetry with carbon paste electrodes containing membrane plasticizers used for PVC-based ion-selective electrodes. Anal. Chim. Acta 1993, 273, 195–204. [Google Scholar]
- Kalcher, K. Voltammetric determination of trace amounts of gold with a chemically modified carbon paste electrode. Anal. Chim. Acta 1985, 177, 175–182. [Google Scholar]
- Kalcher, K. Voltammetric determination of iodide with ion-exchanger modified carbon paste electrode. Fresenius Z. Anal. Chem 1985, 321, 666–670. [Google Scholar]
- Kalcher, K.; Greschonig, H.; Pietsch, R. Extractive preconcentration of gold with carbon paste electrodes modified with organophosphorus compounds. Fresenius Z. Anal. Chem 1987, 327, 513–517. [Google Scholar]
- Vytras, K. Potentiometric titrations based on ion-pair formation. Ion-Sel. Electrode Rev 1985, 7, 77–164. [Google Scholar]
- Švancara, I.; Konvalina, J.; Schachl, K.; Kalcher, K.; Vytřas, K. Stripping voltammetric determination of iodide with synergistic accumulation at a carbon paste electrode. Electroanalysis 1998, 10, 435–441. [Google Scholar]
- Vytřas, K.; Švancara, I.; Renger, F.; Srey, M.; Vaňková, R.; Hvízdalová, M. Voltammetric and potentiometric determination of gold in gold-plated electrotechnical components. Collect. Czech. Chem. Commun 1993, 58, 2039–2046. [Google Scholar]
- Švancara, I.; Kalcher, K.; Diewald, W.; Vytřas, K. Voltammetric determination of silver at ultratrace levels using a carbon paste electrode with improved surface characteristics. Electroanalysis 1996, 8, 336–342. [Google Scholar]
- Konvalina, J.; Vytřas, K. Determination of thallium(III) at a Carbon Paste Electrode Using Potentiometric Stripping Analysis. In Monitoring of Environmental Pollutants; Vytřas, K., Kellner, J., Fischer, J., Eds.; University of Pardubice: Pardubice, Czech Republic, 1999; pp. 99–104. [Google Scholar]
- Vytřas, K.; Švancara, I. Carbon Paste-Based Ion-Selective Electrodes. In Sensing in Electroanalysis; Vytřas, K., Kalcher, K., Eds.; University Press Pardubice: Pardubice, Czech Republic, 2007; pp. 7–22. [Google Scholar]
- Švancara, I.; Ogorevc, B.; Nović, M.; Vytřas, K. Simple and rapid determination of iodide in table salt by stripping potentiometry at a carbon paste electrode. Anal. Bioanal. Chem 2002, 372, 795–800. [Google Scholar]
- Švancara, I.; Baldrianová, L.; Vlček, M.; Metelka, R.; Vytřas, K. A microscopic study on carbon paste electrodes. Electroanalysis 1996, 8, 61–65. [Google Scholar]
- Švancara, I. Electroanalysis with Carbon Paste Electrodes (in Czech). Habilitation Thesis,. University Pardubice Press, Pardubice, Czech Republic, 2002. [Google Scholar]
- Švancara, I.; Zima, J.; Schachl, K. The testing of carbon paste electrodes: An example on the characterisation of a carbon paste electrode prepared from newly used graphite powder. Sci. Pap. Univ. Pardubice Ser. A 1998, 4, 49–63. [Google Scholar]
- Švancara, I.; Pěchová, D.; Kotouček, M.; Vytřas, K. A Study on the applicability of carbon paste electrodes for the determination of 6-benzylaminopurine. Sci. Pap. Univ. Pardubice Ser. A 2001, 7, 17–32. [Google Scholar]
- Papp, Z.; Švancara, I.; Guzsvány, V.; Vytřas, K.; Gaál, F. Voltammetric determination of imidacloprid insecticide in selected samples using a carbon paste electrode. Microchim. Acta 2009, 166, 169–175. [Google Scholar]
- Papp, Z.; Guzsvány, V.; Kubiak, S.; Bobrowski, A.; Bjelica, L. Voltammetric determination of the neonicotinoid insecticide thiamethoxam using a tricresyl phosphate-based carbon paste electrode. J. Serb. Chem. Soc 2010, 75, 681–687. [Google Scholar]
- Papp, Z.; Guzsvány, V.; Švancara, I.; Vytřas, K. Carbon paste electrodes for the analysis of some agricultural pollutants and trace metals. J. Agric. Sci. Technol 2011, 5, 85–92. [Google Scholar]
- Papp, Z. Voltammetric Characterization and Determination of Selected Neonicotinoid Insecticides Using Different Carbon-Based Electrodes (in Serbian). Ph.D. Thesis,. University of Novi Sad, Faculty of Sciences, Novi Sad, Serbia, 2011. [Google Scholar]
- Guzsvány, V.; Papp, Z.; Zbiljić, J.; Vajdle, O.; Rodić, M. Bismuth modified carbon-based electrodes for the determination of selected neonicotinoid insecticides. Molecules 2011, 16, 4451–4466. [Google Scholar]
- Švancara, I.; Metelka, R.; Vytřas, K. Piston-Driven Carbon Paste Electrode Holders for Electrochemical Measurements. In Sensing in Electroanalysis; Vytřas, K., Kalcher, K., Eds.; University of Pardubice: Pardubice, Czech Republic, 2005; pp. 7–18. [Google Scholar]
- Lawrence, N.S.; Beckett, E.L.; Davis, J.; Compton, R.G. Advances in the voltammetric analysis of small biologically relevant compounds. Anal. Biochem 2002, 303, 1–16. [Google Scholar]
- Švancara, I.; Vytřas, K.; Barek, J.; Zima, J. Carbon paste electrodes in modern electroanalysis. Crit. Rev. Anal. Chem 2001, 31, 311–345. [Google Scholar]
- Ravichandran, K.; Baldwin, R.P. Enhanced voltammetric response by electrochemical pretreatment of carbon paste electrodes. Anal. Chem 1984, 56, 1744–1747. [Google Scholar]
- Albahadily, F.N.; Mottola, H.A. Improved response of carbon-paste electrodes for electrochemical detection in flow systems by pretreatment with surfactants. Anal. Chem 1987, 59, 958–962. [Google Scholar]


| Parameter | Method (employing) | |
|---|---|---|
| DPV | HPLC/UV | |
| Concentration interval [μg mL−1] | 1.25–44.20 | 0.125–10.00 |
| Intercept | 0.5126 μA | 2.5279 mAU min |
| Slope | 0.3249 μA mL μg−1 | 97.1291 mAU min mL μg−1 |
| Correlation coefficient, r | 0.992 | 0.999 |
| Limit of detection, LOD [μg mL−1] | 0.38 | 0.0375 |
| Limit of quantitation, LOQ [μg mL−1] | 1.25 | 0.125 |
| RSD [%] (n = 7) | 2.7 | 1.1 |
© 2012 by the authors; licensee MDPI, Basel, Switzerland This article is an open access article distributed under the terms and conditions of the Creative Commons Attribution license (http://creativecommons.org/licenses/by/3.0/).
Share and Cite
Ðorđević, J.; Papp, Z.; Guzsvány, V.; Švancara, I.; Trtić-Petrović, T.; Purenović, M.; Vytřas, K. Voltammetric Determination of the Herbicide Linuron Using a Tricresyl Phosphate-Based Carbon Paste Electrode. Sensors 2012, 12, 148-161. https://doi.org/10.3390/s120100148
Ðorđević J, Papp Z, Guzsvány V, Švancara I, Trtić-Petrović T, Purenović M, Vytřas K. Voltammetric Determination of the Herbicide Linuron Using a Tricresyl Phosphate-Based Carbon Paste Electrode. Sensors. 2012; 12(1):148-161. https://doi.org/10.3390/s120100148
Chicago/Turabian StyleÐorđević, Jelena, Zsigmond Papp, Valéria Guzsvány, Ivan Švancara, Tatjana Trtić-Petrović, Milovan Purenović, and Karel Vytřas. 2012. "Voltammetric Determination of the Herbicide Linuron Using a Tricresyl Phosphate-Based Carbon Paste Electrode" Sensors 12, no. 1: 148-161. https://doi.org/10.3390/s120100148