Raman Microspectroscopy of Individual Algal Cells: Sensing Unsaturation of Storage Lipids in vivo

Abstract
:1. Introduction
2. Materials and Methods
2.1. Organisms and cultivation conditions
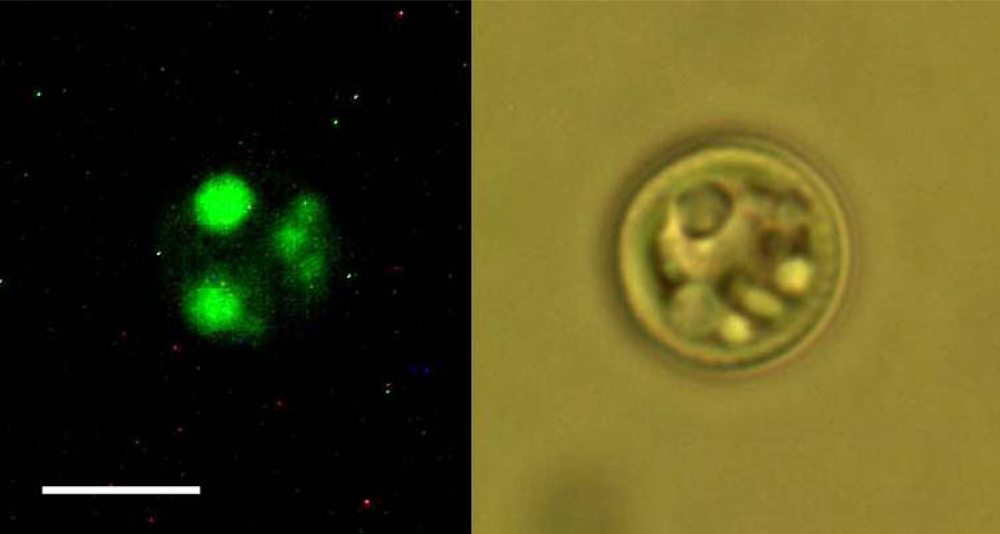
2.2. Nile Red staining and fluorescence microscopy
2.3. Gas chromatography-mass spectrometry technique
2.4. Sample preparation
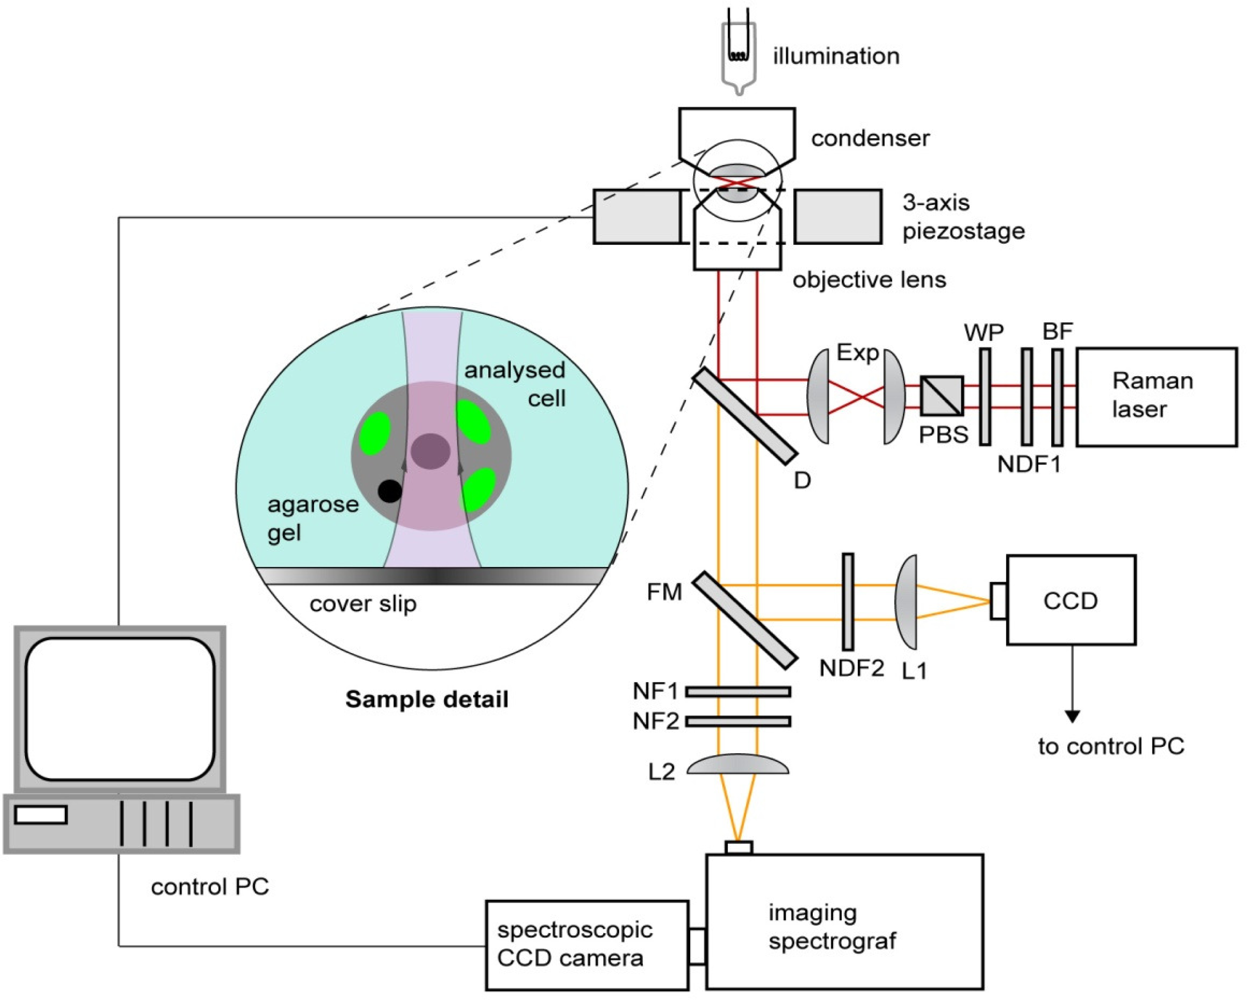
2.5. Raman microspectroscopy
2.6. Spectrum processing and analysis
3. Results and Discussion
3.1. Calibration of iodine value against spectroscopic data
3.2. Determination of iodine value of lipids in living algal cells
3.3. Influence of carotene on the iodine value determination
4. Conclusions
Acknowledgments
References
- Field, CB; Behrenfeld, MJ; Randerson, JT; Falkowski, P. Production of the biosphere: integrating terrestrial and oceanic components. Science 1998, 281, 237–240. [Google Scholar]
- Schenk, PM; Thomas-Hall, SR; Stephens, E; Marx, UC; Mussgnug, JH; Posten, C; Kruse, O; Hankamer, B. Second generation biofuels: high-efficiency microalgae for biodiesel production. Bioenerg. Res 2008, 1, 20–43. [Google Scholar]
- Gouveia, L; Marques, AE; da Silva, TL; Reis, A. Neochloris oleabundans UTEX#1185: A suitable renewable lipid source for biofuel production. J. Ind. Microbiol. Biotechnol 2009, 36, 821–826. [Google Scholar]
- Gouveia, L; Oliveira, AC. Microalgae as a raw material for biofuels production. J. Ind. Microbiol. Biotechnol 2009, 36, 269–274. [Google Scholar]
- Cooper, MS; Hardin, WR; Petersen, TW; Cattolico, RA. Visualizing “green oil” in live algal cells. J. Biosci. Bioeng 2010, 109, 198–201. [Google Scholar]
- Chen, W; Zhang, C; Song, L; Sommerfeld, M; Hu, Q. A high throughput Nile red method for quantitative measurement of neutral lipids in microalgae. J. Microbiol. Meth 2009, 77, 41–47. [Google Scholar]
- Maquelin, K; Kirschner, C; Choo-Smith, LP; van den Braak, N; Endtz, HP; Naumann, D; Puppels, GJ. Identification of medically relevant microorganisms by vibrational spectroscopy. J. Microbiol. Meth 2002, 51, 255–271. [Google Scholar]
- Harz, M; Rosch, P; Peschke, KD; Ronneberger, O; Burkhardt, H; Popp, J. Micro-Raman spectroscopic identification of bacterial cells of the genus Staphylococcus and dependence on their cultivation conditions. Analyst 2005, 130, 1543–1550. [Google Scholar]
- Samek, O; Al-Marashi, JFM; Telle, HH. The potential of Raman spectroscopy for the identification of biofilm formation by Staphylococcus epidermidis. Laser Phys. Lett 2010, 5, 378–383. [Google Scholar]
- De Gelder, J; De Gussem, K; Vandenabeele, P; Moens, L. Reference database of Raman spectra of biological molecules. J. Raman Spectrosc 2007, 38, 1133–1147. [Google Scholar]
- Notingher, I. Raman spectroscopy cell-based biosensors. Sensors 2007, 7, 1343–1358. [Google Scholar]
- Downes, A; Elfick, A. Raman spectroscopy and related techniques in biomedicine. Sensors 2010, 10, 1871–1889. [Google Scholar]
- Movasaghi, Z; Rehman, S; Rehman, IU. Raman spectroscopy of biological tissues. Appl. Spectrosc. Rev 2007, 42, 493–541. [Google Scholar]
- Heraud, P; Beardall, J; McNaughton, D; Wood, BR. In vivo prediction of the nutrient status of individual microalgal cells using Raman microspectroscopy. FEMS Microbiol. Lett 2007, 275, 24–30. [Google Scholar]
- Heraud, P; Wood, BR; Beardall, J; McNaughton, D. Effect of pre-processing of Raman spectra on in vivo classification of nutrient status of microalgal cells. J. Chemometrics 2006, 20, 193–197. [Google Scholar]
- Huang, YY; Beal, CM; Cai, WW; Ruoff, RS; Terentjev, EM. Micro-Raman spectroscopy of algae: Composition analysis and fluorescence background behavior. Biotechnol. Bioeng 2010, 105, 889–898. [Google Scholar]
- Řezanka, T; Petránková, M; Cepák, V; Přibyl, P; Sigler, K; Cajthaml, T. Trachydiscus minutus, a new biotechnological source of eicosapentaenoic acid. Folia Microbiol 2010, 55, 265–269. [Google Scholar]
- Tran, HL; Hong, SJ; Lee, CG. Evaluation of extraction methods for recovery of fatty acids from Botryococcus braunii LB572 and Synechocystis sp. PCC 6803. Biotechnol. Bioprocess Eng 2009, 14, 187–192. [Google Scholar]
- Bailey, GF; Horvat, RJ. Raman spectroscopic analysis of the cis/trans isomer composition of edible vegetable oils. J. Am. Oil. Chem. Soc 1972, 49, 494–498. [Google Scholar]
- Sadeghi-Jorabchi, H; Hendra, PJ; Wilson, RH; Belton, PS. Determination of the total unsaturation in oils and margarines by Fourier Transform Raman spectroscopy. J. Am. Oil. Chem. Soc 1990, 67, 483–486. [Google Scholar]
- Ozaki, Y; Cho, R; Ikegaya, K; Muraishi, S; Kawauchi, K. Potential of near-infrared Fourier Transform Raman spectroscopy in food analysis. Appl. Spectrosc 1992, 46, 1503–1507. [Google Scholar]
- Schober, S; Mittelbach, M. Iodine value and biodiesel: Is limitation still appropriate? Lipid Techn 2007, 19, 281–284. [Google Scholar]
- Setlik, I. Contamination of algal cultures by heterotrophic microorganisms and its prevention. Ann Rep Algol Trebon 1966, 89–100. [Google Scholar]
- Greenspan, P; Mayer, EP; Fowler, SD. Nile red: A selective fluorescent stain for intracellular lipid droplets. J. Cell Biol 1995, 100, 965–973. [Google Scholar]
- Elsey, D; Jameson, D; Raleigh, B; Cooney, MJ. Fluorescent measurement of microalgal neutral lipids. J. Microbiol. Meth 2007, 68, 639–642. [Google Scholar]
- McGinnis, KM; Dempster, TA; Sommerfeld, MR. Characterization of the growth and lipid content of the diatom Chaetoceros muelleri. J. Appl. Phycol 1997, 9, 19–24. [Google Scholar]
- Jonas, A; Jezek, J; Sery, M; Zemanek, P. Raman microspectrometry of optically trapped micro- and nanoobjects. Proc. SPIE 2008, 7141, 714111. [Google Scholar]
- Inoue, S. Foundations of confocal scanned imaging in light microscopy. In Handbook of Biological Confocal Microscopy, 3rd ed; Pawley, JB, Ed.; Springer Science: New York, NY, USA, 2006; pp. 1–19. [Google Scholar]
- Thapper, A; Mamedov, F; Mokvist, F; Hammarström, L; Styring, S. Defining the far-red limit of photosystem II in Spinach. Plant Cell 2009, 21, 2391–2401. [Google Scholar]
- Brandt, NN; Brovko, OO; Chikishev, AY; Paraschuk, OD. Optimization of the rolling-circle filter for Raman background subtraction. Appl. Spectrosc 2006, 60, 288–293. [Google Scholar]
- Ham, B; Shelton, R; Butler, B; Thionville, P. Calculating the iodine Value for marine oils fatty acid profiles. J. Am. Oil. Chem. Soc 1998, 75, 1445–1446. [Google Scholar]
- Converti, A; Casazza, AA; Ortiz, EY; Perego, P; Del Borghi, M. Effect of temperature and nitrogen concentration on the growth and lipid content of Nannochloropsis oculata and Chlorella vulgaris for biodiesel production. Chem. Eng. Proc 2009, 48, 1146–1151. [Google Scholar]
- Liu, ZY; Wang, GC; Zhou, BC. Effect of iron on growth and lipid accumulation in Chlorella vulgaris. Biores. Technol 2008, 99, 4717–4722. [Google Scholar]
- Dayanandaa, C; Saradaa, R; Ranib, MU; Shamalab, TR; Ravishankara, GA. Autotrophic cultivation of Botryococcus braunii for the production of hydrocarbons and exopolysaccharides in various media. Biomass Bioenerg 2007, 31, 87–93. [Google Scholar]


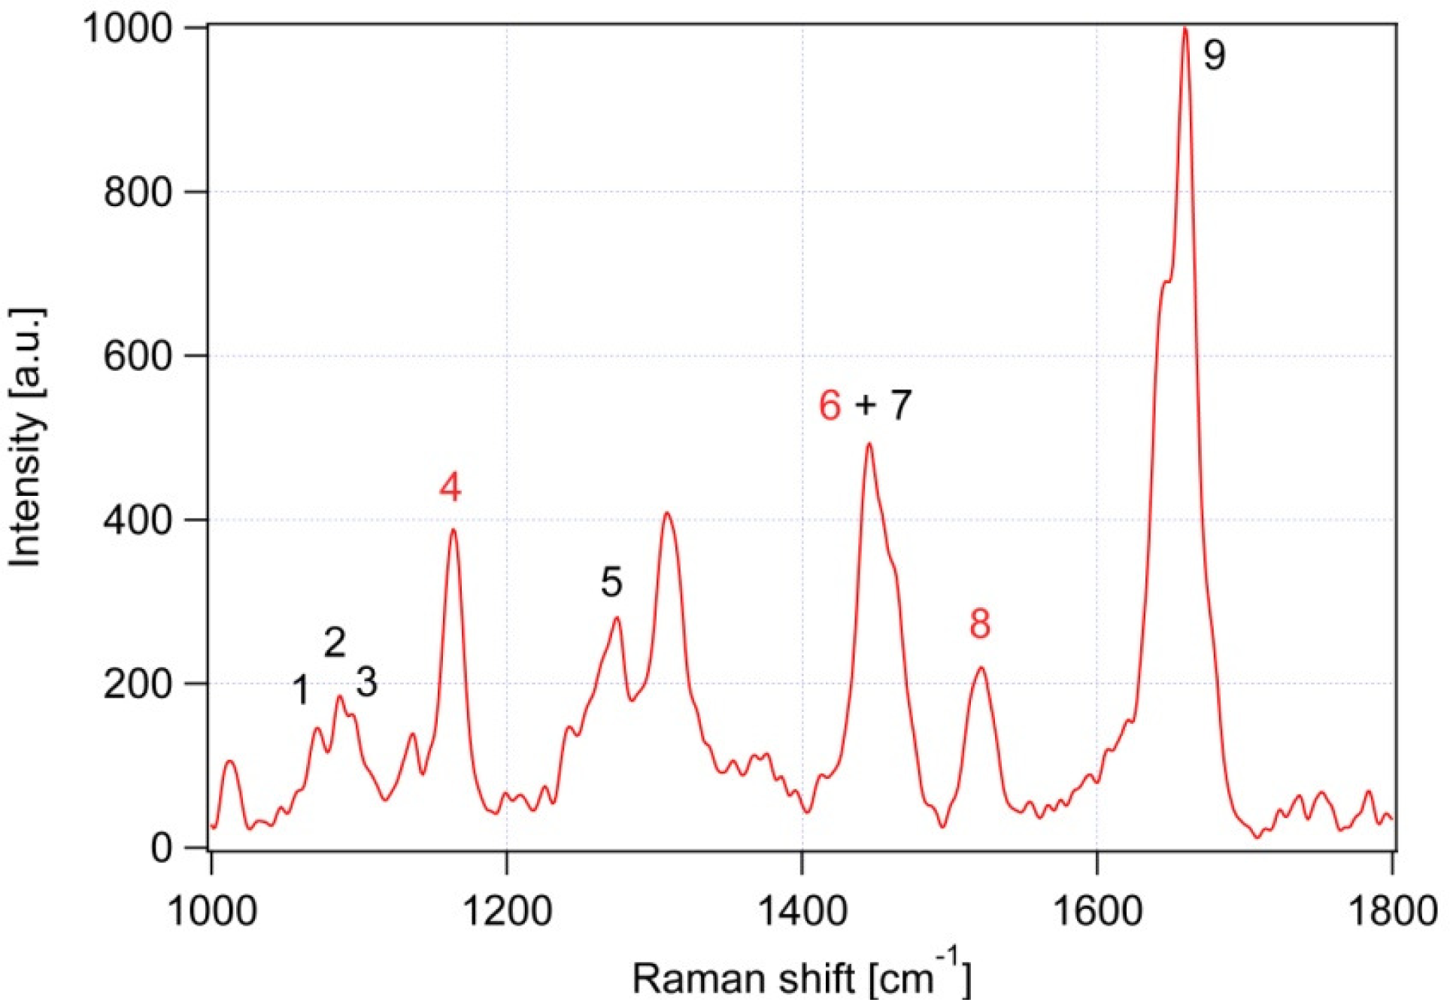
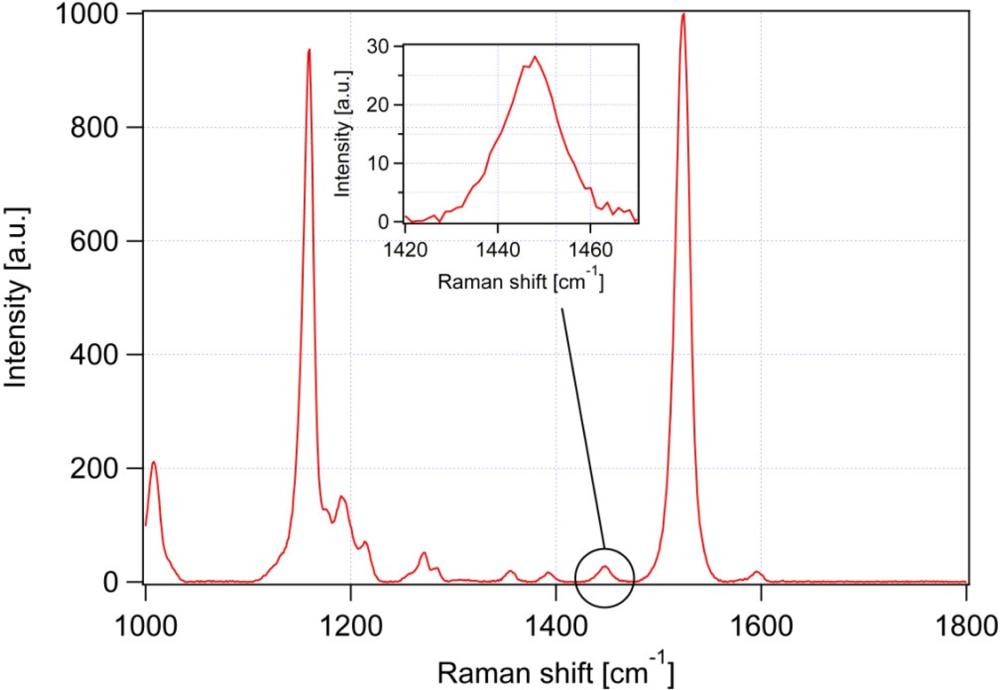
| Peak # | Raman feature (in cm−1) | Suggested assignment |
|---|---|---|
| 1 | 1,060 | C-C skeletal stretching vibration, out-of-plane |
| 2 | 1,085 | C-C skeletal stretching vibration; gauche chain conformer |
| 3 | 1,125 | C-C skeletal stretching vibration; trans chain conformer, in-plane |
| 4 | 1,157 | β-carotene |
| 5 | 1,267 | cis double bond ═C-H bend’ in plane |
| 6 | 1,442 | β-carotene |
| 7 | 1,445 | CH2 bend, scissoring deformation; saturated fat indicator |
| 8 | 1,525 | β-carotene |
| 9 | 1,656 | cis C═C stretching vibration; unsaturated fat indicator |
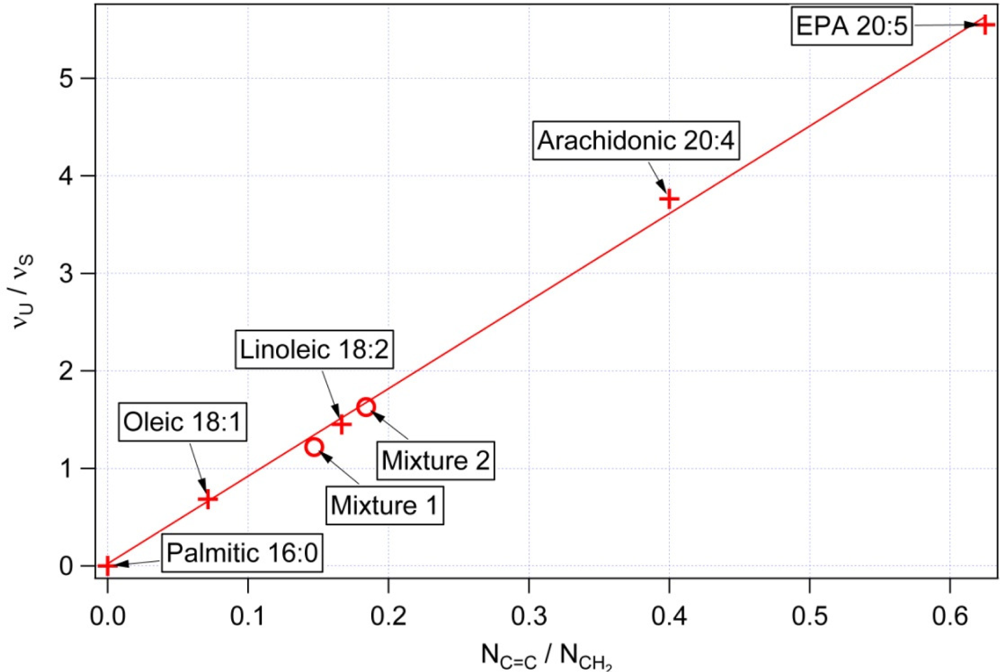
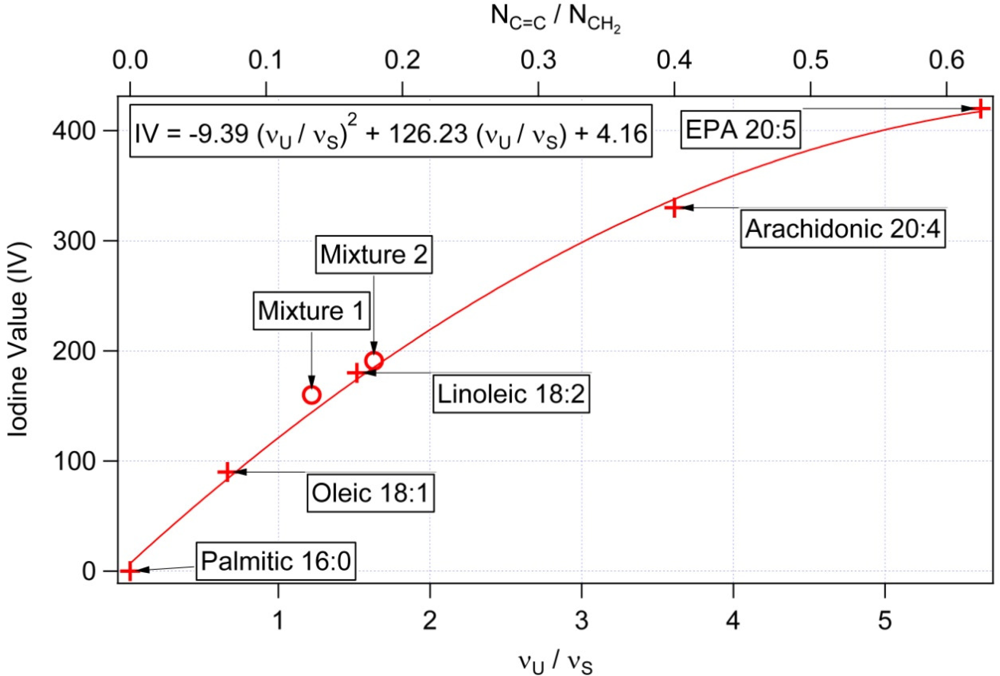
| NC═C Number of double bonds per molecule | NCH2 Total number of CH2 groups per molecule | NC═C/NCH2 Mass unsaturation | IV Iodine values [31] | υU/υS Raman intensity at 1656 cm−1/1445 cm−1 | |
|---|---|---|---|---|---|
| Palmitic 16:0 | 0 | 14 | 0 | 0 | <0.03 |
| Oleic 18:1 | 1 | 14 | 0.071 | 90 | 0.65 |
| Linoleic 18:2 | 2 | 12 | 0.166 | 180 | 1.46 |
| Arachidonic 20:4 | 4 | 10 | 0.4 | 330 | 4.18 |
| EPA (Eicosapentaenoic acid) 20:5 | 5 | 8 | 0.625 | 420 | 5.61 |
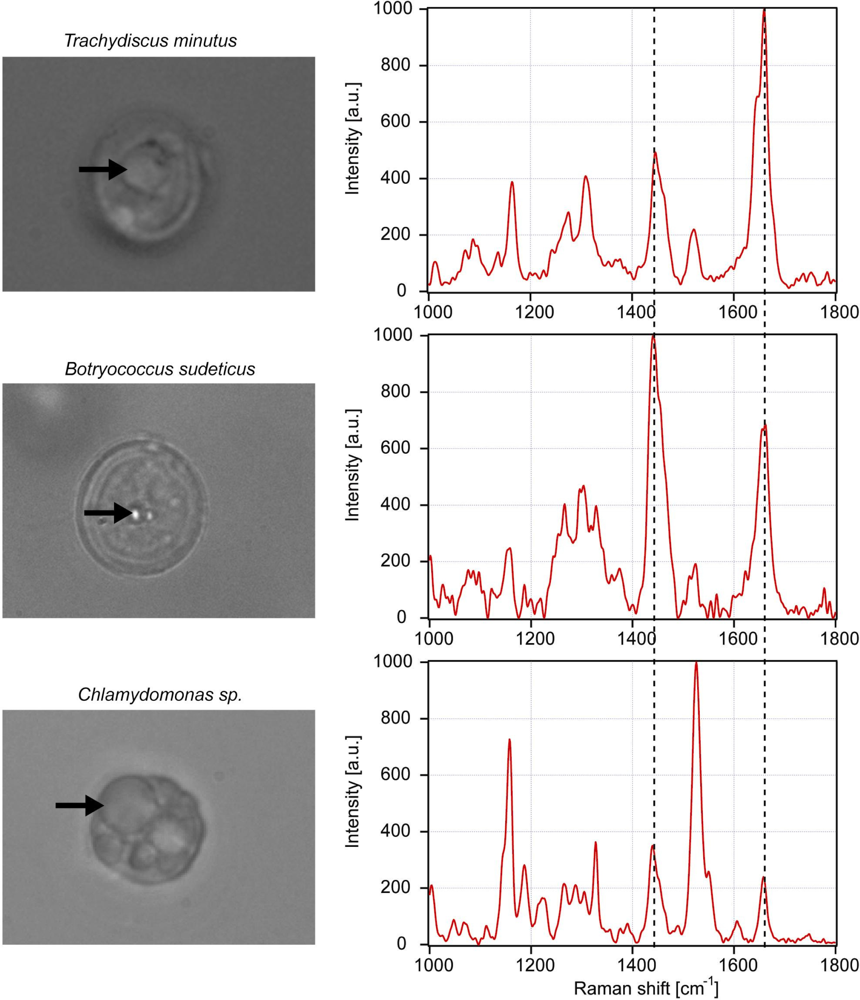
| Trachydiscus minutus | Botryococcus sudeticus | Chlamydomonas sp. | |
|---|---|---|---|
| Algal cell 1 | 1.91 | 0.74 | 0.76 |
| Algal cell 2 | 1.9 | 0.73 | 0.73 |
| Algal cell 3 | 2.01 | 0.67 | 0.74 |
| Algal cell 4 | 2.07 | 0.66 | 0.76 |
| Averaged value νU /νS | 1.97 | 0.70 | 0.75 |
| SD νU /νS | 0.081 | 0.040 | 0.015 |
| Estimated IV (equation from Figure 5) | 216 | 88 | 93 |
| SD IV | 7 | 5 | 2 |
| Fatty acids | Content (% w/w) | Molecular weight | Molar ratio ni | NC═Ci | NCH2i |
|---|---|---|---|---|---|
| Myristic | 5.13 | 228.37 | 0.065 | 0 | 12 |
| Palmitoleic | 7.48 | 254.41 | 0.085 | 1 | 12 |
| Palmitic | 9.9 | 256.42 | 0.111 | 0 | 14 |
| Linoleic | 12.95 | 280.45 | 0.133 | 2 | 12 |
| Oleic | 9.12 | 282.46 | 0.093 | 1 | 14 |
| Stearic | 1.99 | 284.48 | 0.020 | 0 | 16 |
| Arachidonic | 8.54 | 304.5 | 0.081 | 4 | 10 |
| EPA | 30.25 | 302.45 | 0.289 | 5 | 8 |
| Behenic | 11.58 | 340.58 | 0.098 | 0 | 20 |
| Lignoceric | 3.06 | 368.63 | 0.024 | 0 | 22 |
© 2010 by the authors; licensee MDPI, Basel, Switzerland. This article is an open access article distributed under the terms and conditions of the Creative Commons Attribution license (http://creativecommons.org/licenses/by/3.0/).
Share and Cite
Samek, O.; Jonáš, A.; Pilát, Z.; Zemánek, P.; Nedbal, L.; Tříska, J.; Kotas, P.; Trtílek, M. Raman Microspectroscopy of Individual Algal Cells: Sensing Unsaturation of Storage Lipids in vivo. Sensors 2010, 10, 8635-8651. https://doi.org/10.3390/s100908635
Samek O, Jonáš A, Pilát Z, Zemánek P, Nedbal L, Tříska J, Kotas P, Trtílek M. Raman Microspectroscopy of Individual Algal Cells: Sensing Unsaturation of Storage Lipids in vivo. Sensors. 2010; 10(9):8635-8651. https://doi.org/10.3390/s100908635
Chicago/Turabian StyleSamek, Ota, Alexandr Jonáš, Zdeněk Pilát, Pavel Zemánek, Ladislav Nedbal, Jan Tříska, Petr Kotas, and Martin Trtílek. 2010. "Raman Microspectroscopy of Individual Algal Cells: Sensing Unsaturation of Storage Lipids in vivo" Sensors 10, no. 9: 8635-8651. https://doi.org/10.3390/s100908635