Application of a Hybrid 3D-2D Laser Scanning System to the Characterization of Slate Slabs

Abstract
: Dimensional control based on 3D laser scanning techniques is widely used in practice. We describe the application of a hybrid 3D-2D laser scanning system to the characterization of slate slabs with structural defects that are difficult for the human eye to characterize objectively. Our study is based on automating the process using a 3D laser scanner and a 2D camera. Our results demonstrate that the application of this hybrid system optimally characterizes slate slabs in terms of the defects described by the Spanish UNE-EN 12326-1 standard.1. Introduction
The control of the quality of slate slabs, from the initial slate block cutting tasks to the point when suitably sized slabs are obtained by a stonemason, continues to be a manual process.
The process of obtaining slates to be used for roofing commences with the extraction of slate blocks from the quarry. These blocks are transported to the processing plant in dump trucks and unloaded onto a bed of earth. If a mechanical cutting system is used, the blocks are unloaded using a small crane so as to minimize damage and take advantage of existing cuts. Blocks are exfoliated along the schistosity planes using a jackhammer with a flat bit. A hammer and stonecutter’s chisel are used to obtain slate slabs, cut according to the schistosity planes. Finally, slate slabs are cut to commercial sizes using a guillotine or pedal-operated cutters, with the operator choosing the final size according to the cut allowed by the slate thin section.
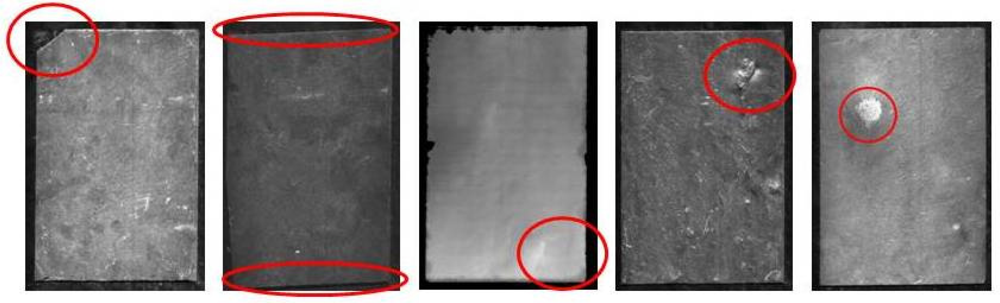
Each slate slab undergoes quality control to detect possible defects before being assigned to a particular use. Quality control, performed manually by an expert, has the drawback that it is subjective and aggravated by the possible effects of fatigue. Furthermore, experts need specific and costly training. There is, therefore, a need to develop a more reliable automated passive (non-intrusive) system. In its product specification section, the Spanish UNE-EN12326-1 standard [1] defines the defects that characterize roofing slate. Roofing slate quality, furthermore, has been the subject of a number of studies [2,3]. The defects analysed in this study are described as follows:
Material defects: Slate slabs, divided into thirds, need to be checked for material defects in each third. The ratio (%) between the slab surface area and the theoretical ideal rectangular contour area contained in the slab was calculated.
False squaring: Slate slabs need to be as rectangular in shape as possible. The degree of difference between each angle and a right angle is analysed.
Warping: Warping in slates may result in breakage when slate is being fitted. This is expressed as the difference in millimetres between the height of a corner compared to the rest of the slate.
Fissuring: Cracks are assessed by calculating the mean surface area and studying the standard deviation of the typical distribution in order to evaluate homogeneity. The standard does not describe limit values for this criterion (as it tends to depend on commercial varieties); in this case, the limit value based on expert opinion given in Table 1 was used [2].
White (flowerlike) staining: Flowerlike stains have tones that are clearly different from the rest of the slate. Studied, therefore, is the area of the stains identified in the image.
Figure 1 illustrates the defects analysed in this study and Table 1 indicates the limit values established for this particular application, based on the values given in the ruling standard. The above list covers all the defects referred to in the UNE standard, with the exception of quartz filaments, which will be dealt with in future research.
Bearing in mind the information extracted from the UNE standard, the most restrictive slab slate size for all the defects listed is estimated to be 0.5 mm length- and crossways and 0.1 mm in terms of thickness.
This study was based on artificial vision techniques, given that they are non-intrusive. We chose the hybrid 2D-3D laser scanner technology over other techniques (such as stereo vision) because it is more robust [4]—a key aspect given the industrial setting of the application. Furthermore, commercial artificial vision systems produce very accurate results for our kind of problem.
Precision results basically from the resolution of the camera sensors, which, in turn, depends on the field of view (FOV) necessary. In our particular case, the FOV was 340 × 240 mm length- and crossways, resulting in a minimum 2D camera resolution of 960 pixels. As for thickness (affecting the 3D scanner), the FOV was 4 mm, requiring a minimum resolution of 80 pixels. Different measurement techniques have been used to inspect ceramic slabs for quality (e.g., [5]). There are four main approaches to characterization:
Methods based on differentiating between grey tones [6], with small differences in the grey scale reflecting defects in the slate.
Morphological methods [7], based on assessing the shape and surface of the defects [8].
Local binary pattern methods [9], based on the construction of an invariant texture measure based on the grey scale and derived from a general definition of texture in a local environment.
Texture analysis [10–11], in which texture is the criterion used to differentiate between slate qualities.
Since texture is a key feature of slate, Ghita [12] proposed using a 2D viewing system inspired by different studies in which a diffuse lighting method was used [13,14]. We studied the feasibility of including, as part of the slate classification process, a 3D laser scanning system that would make geometric measurements of the slate slabs in three dimensions (see [15–18] for engineering applications to industrial inspection processes). However, to overcome the problem of a costly prior calibration process, we developed our own simple calibration algorithm as a particular case of the Tsai method [19]. This simplified approach substantially reduced the complexity of the calibration. The article is structured as follows: firstly, the methodology is described in terms of the equipment and the calibration algorithm used; secondly, the results obtained using this methodology are described, focusing on those of most significance; and finally, the most relevant conclusions arising from our research are discussed.
2. Methodology
2.1. Equipment
For our proposed 3D-2D hybrid control system, in a first inspection phase, different kinds of slate defects (described in more detail below) were identified using dimensional control implemented in 3D. In a second phase, white (flowerlike) staining of the slate surface were identified using the 2D system.
The cameras used for this artificial vision system were the following:
For 3D characterization, a Ranger C55 camera, with a resolution of 1,546 × 512 and a speed of 30,000 profiles per second.
For 2D characterization, a DALSA Spyder3 linear camera, with a resolution of 2,048 pixels and a speed of up to 18,000 lines per second.
The system was configured so that each slate slab would be fully included in the images created by both the 2D and 3D systems, with the FOV greater than the slab dimensions. Furthermore, the 3D laser camera viewing field (and the laser angle) was established in such a way that it could account for surface defects up to 7.5 mm over the mean height of the slate slabs.
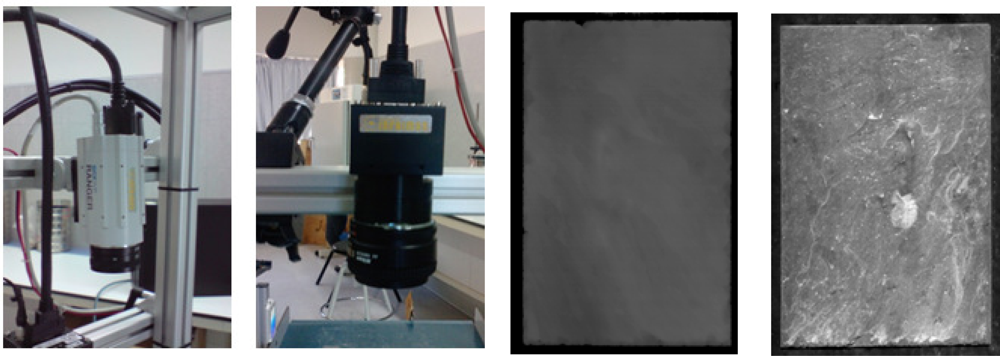
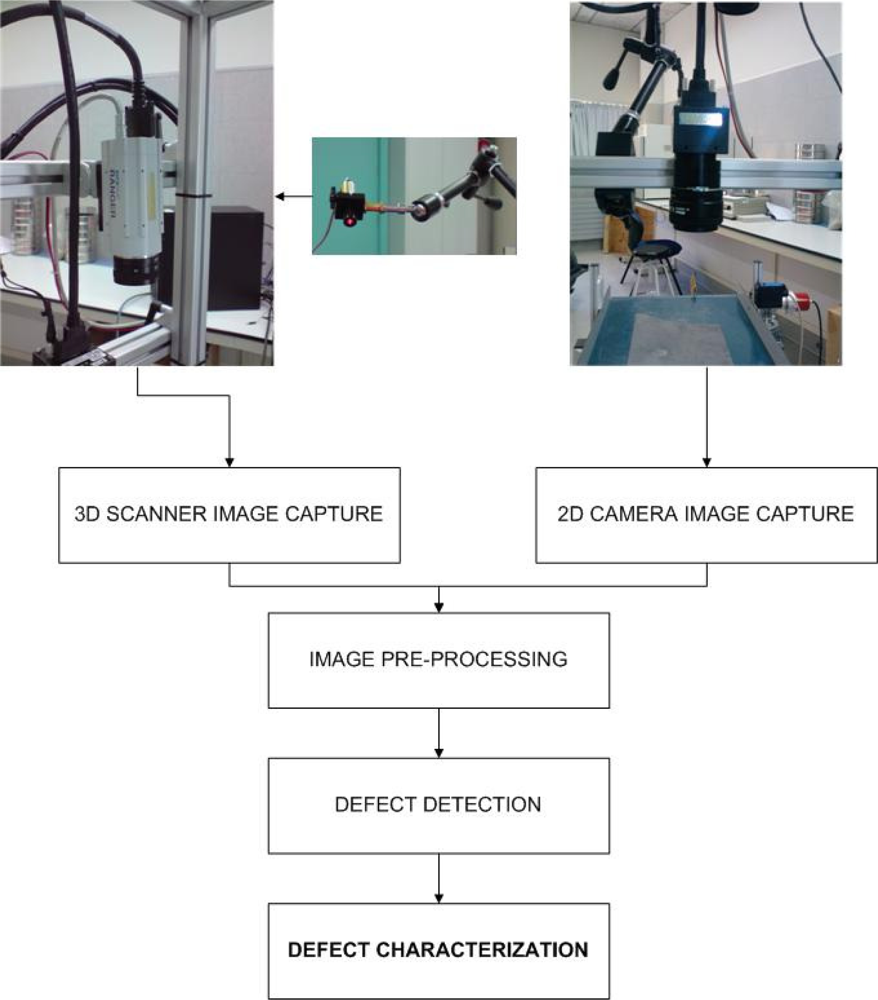
Figure 2 shows the 3D laser scanner (left) and the 2D linear camera (right) used for this study, along with a sample image for each. Lighting as a particularly important part of an artificial vision system was selected according to the imaging process:
A laser unit for the PowerLaser model for 3D.
A LED HLND red light unit for auxiliary illumination for the 2D linear camera.
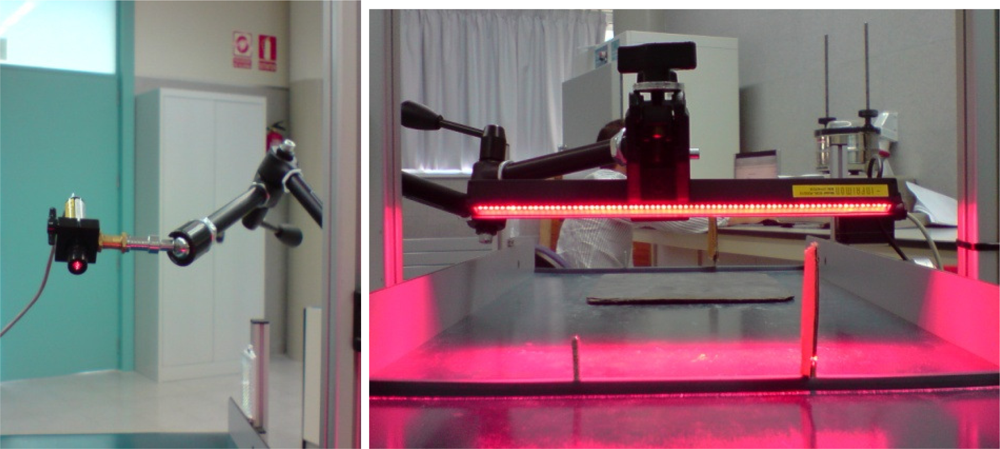
Figure 3 shows the lighting systems used for this study. To ensure that the processes did not interfere with each other, an order blocking filter (OBF) was used in the 3D sensor to cut specific wavelengths and so improve the robustness of the 3D system.
A flow chart illustrating the hybrid characterization system for slate slabs is depicted in Figure 4.
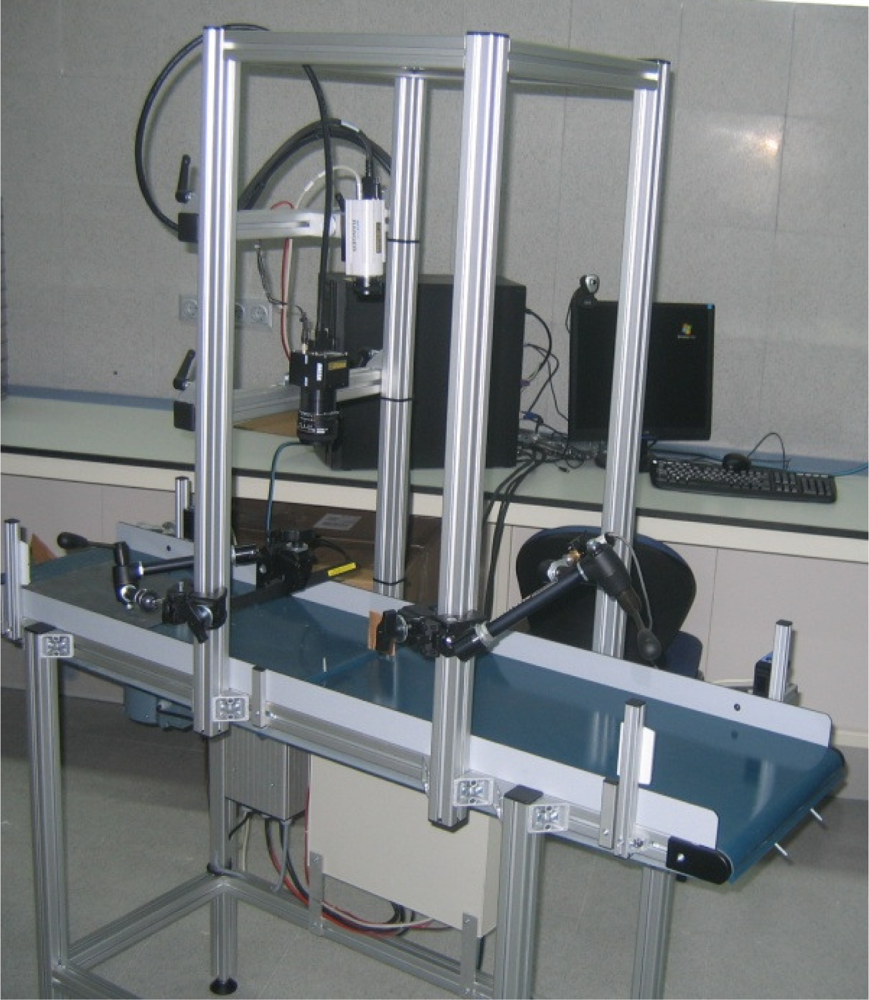
In terms of automating the entire process, a prototype was built that included a conveyor belt, 3D camera, 2D linear camera and lighting systems (Figure 5). The model was implemented in real time so as to be adaptable to the requirements of a future industrial application.
Images are captured in response to a command issued by a trigger that detects the passing of the slate. The conveyor belt is configured for a maximum speed of 30 metres/minute, and acceleration and deceleration ramps are also configurable so as to make the prototype as similar as possible to a future industrial application. The application is not affected by changes in speed thanks to an encoder, installed in the motorized conveyor belt roller, responsible for varying electric pulse frequency according to the speed of the belt.
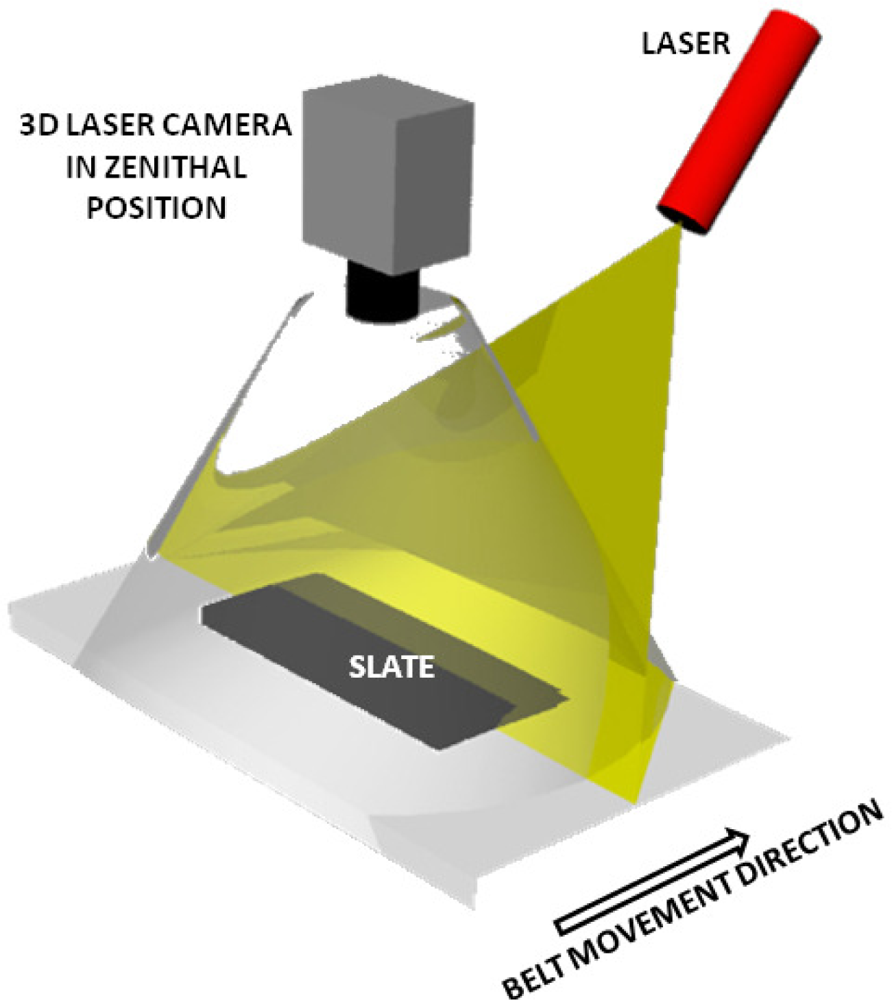
Figure 6 shows a diagram of the 3D sensing system, with the camera in the zenithal position, the laser plane requiring calibration, the direction of the conveyor belt and the slate slab in position on the belt.
2.2. Calibration Algorithm
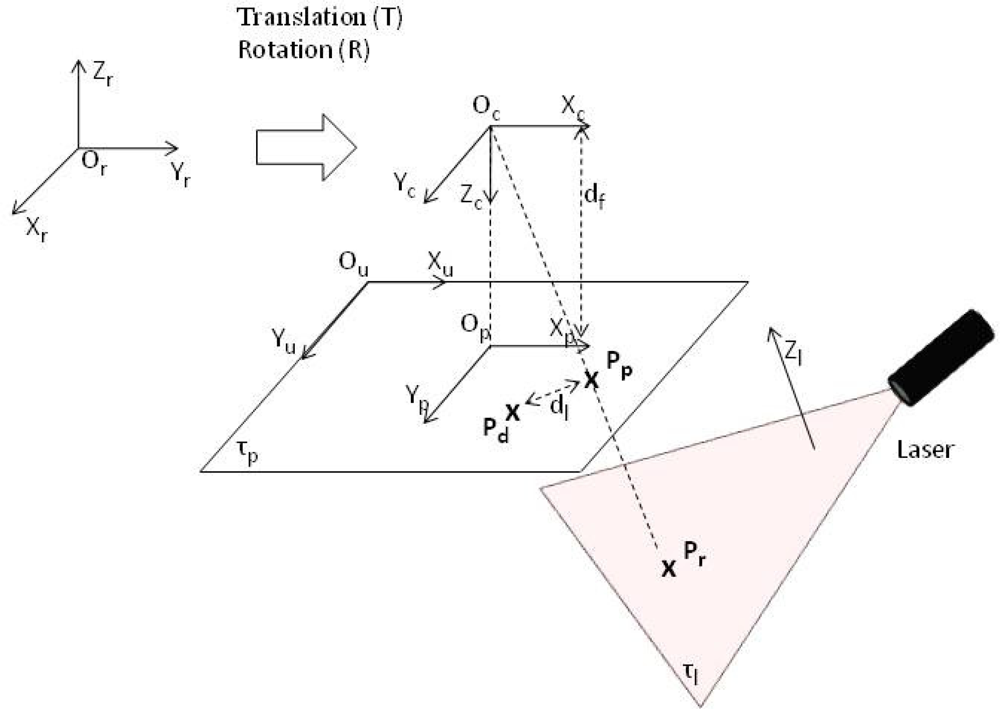
The camera calibration method described by Tsai [19] is the most frequently used for this kind of application. Because this system includes a 3D laser scanner, co-planar calibration is necessary and, consequently, the radial alignment proposed by Zexiao [20] is taken into account. Figure 7 depicts the camera and world coordinates relevant to the Tsai calibration process.
Let OrXrYrZr, OcXcYcZc, OpXpYpZp, OuXuYu be the reference systems for the real world, the camera (after translation T and rotation R), the projection plane τp (where df is the effective focal distance) and the sensor, respectively.
Let Pr = (xr, yr, zr) be a point in the real coordinates; projection of this point on the projection plane corresponds to Pp = (xp, yp), but, bearing in mind lens distortion, the projection corresponds to Pd = (xd, yd). Furthermore, let (xu, yu) be the coordinates for a point in the projection plane and xuop, yuop the coordinates for the point Op with respect to the system OuXuYu expressed in pixels.
Denoting the rotation matrix R = (r)ij and translation matrix T = (Tx,Ty,Tz) that intervene in the transformation of the reference system OcXcYcZc, we obtain the following calibration equations:
As with the camera and its projection plane, it is also necessary to calibrate the laser triangulation plane τ1 [21]. Let Alxc + Blyc + Clzc + Dl = 0 be the hyperplane equation referring to the system of coordinates OcXcYcZc. The following must be added to the calibration equations (1)–(2):
Hence, using the indicated notation, the system (1)-(2)-(3) corresponds to the system of Tsai calibration equations and the laser plane.
The following aspects need to be taken into account in the calibration process:
Measurement is made on a flat conveyor belt. However, even though the belt may have been precision-manufactured and moves over an absolutely flat surface, it is not possible to calibrate all the points of the belt, as the system occasionally stops for calibrations or other reasons while the belt keeps moving. Consequently it is not always possible to know which section of the belt is being scanned.
Although it is necessary to estimate the dimensions and texture features of the slate slab, the measurements do not need to be absolutely precise. In other words, a measurement error margin of 5% is admissible, given that the goal is inspection/detection.
Speed is important for slate characterization systems (the greatest number of slate measurements in the least possible time) as production line speed (30 metres/minute) is constant.
Bearing in mind these issues, we applied the following hypotheses to the Tsai calibration model so as to speed up processing time and reduce the number of variables:
The camera is in exact zenithal position and the sensor is also in exact zenithal position to ensure parallelism with the measurement plane; that is, R = I.
There is no radial distortion, hence, k1 = 0.
There is no difference between resolutions along different directions, hence, Nx = Ny.
The laser beam passes through the Yc axis, thus, Alxr + Clzr = 0.
Slabs have a small thickness relative to movement, hence, zr ⋘ Tz ⇒ zr + Tz ≃ Tz.
Bearing in mind the hypotheses in (1)-(2)-(3), the calibration problem is written as:
These hypotheses are entirely valid for the case of slate, as the loss of precision is offset by the simplicity of the process. Furthermore, for our industrial application, a small loss (of around 5%) in precision is acceptable. It should be borne in mind that calibration should be repeated periodically, given the nature of the slate processing industry (dirt, vibrations, etc.). Note that the calibration algorithm in (4)-(5)-(6) considerably reduces not only the cost of operations, but also the complexity, making it possible to use less expert staff.
3. Application and Results
3.1. Application
In order to study the application of the vision system to the characterization of slate, we used a sample of 75 slate slabs measuring approximately 320 × 220 mm. Only 10% of the slabs had none of the defects described above. This was so that the algorithm could be implemented with the largest possible number of defective slabs.
To detect the defects described above, we used several preprocessing procedures and artificial vision applications. For the Region of Interest (ROI):
Preprocessing: Algorithms implemented in a phase preliminary to the execution of the program,
○ Threshold. Binary filter where 1 and 0 are assigned to pixels above and below, respectively, a certain value.
○ Expand. Associates the pixel value with its neighbourhood.
○ Shrink. Eliminates pixels that can be rated as noise.
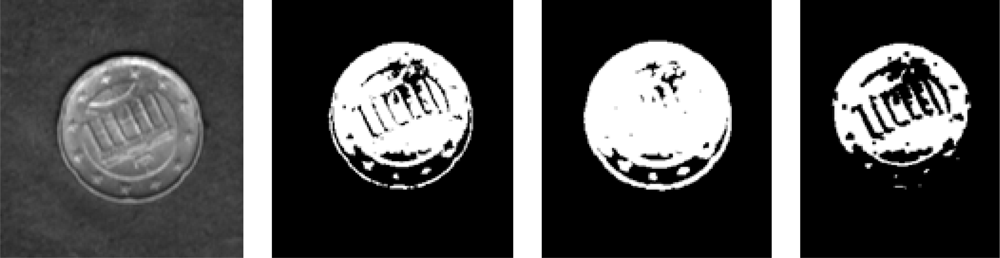
Figure 8 depicts an example of the different pre-processes used for the case of a coin placed on a slab. The image on the extreme left shows a real depiction of the coin, and the three remaining images, left to right, show the results for the threshold algorithm, the expand algorithm (taking into account neighbourhood values) and the shrink algorithm (ruling out possible noise).
Processing:
○ Connectivity. Identifies binary large objects (BLOB) by seeking associations between pixels with the same value in different neighbourhood directions.
○ Statistics. Conducts a routine statistical analysis (mean, mode, median, standard deviation, etc.) of the values of the pixels in the ROI.
○ Edge detection. Detects a pronounced slope between neighbourhood pixel values, indicating that there is an axis in the ROI.
○ HVLine. Slope algorithm that generates the possible vertical or horizontal line in the ROI.
Using artificial vision libraries and combining the preprocessing procedures and algorithms with algebraic operations, we implemented an application that was as parameterizable as possible and open to future updates.
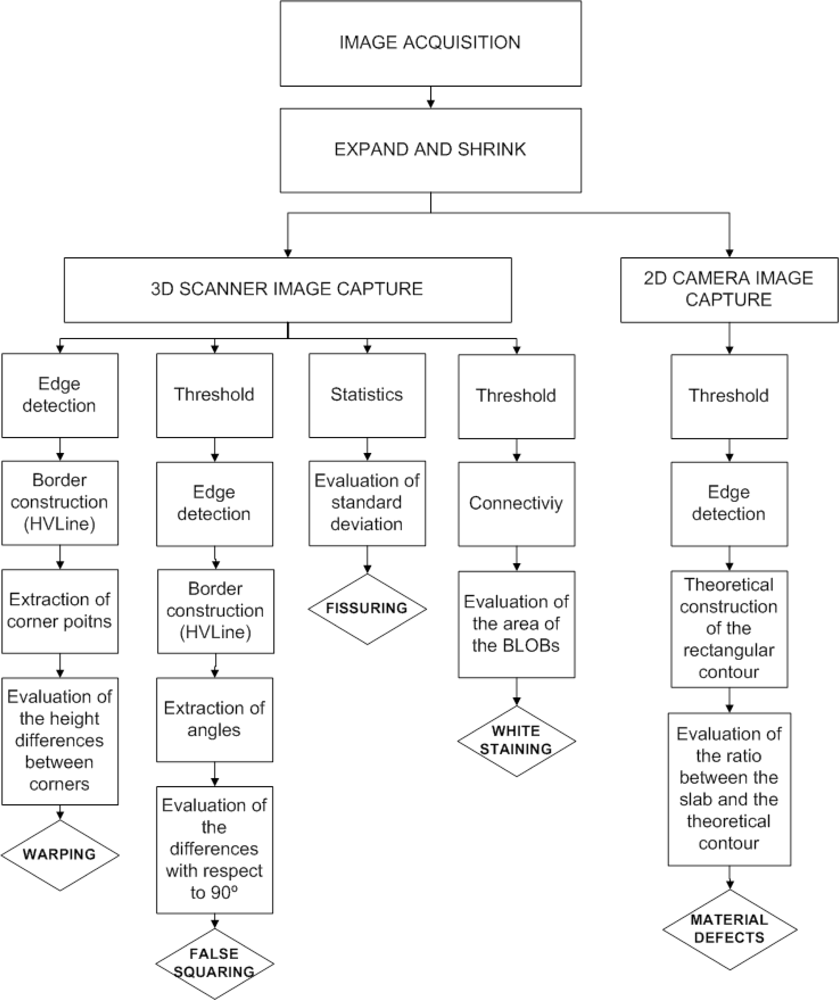
Figure 9 depicts a flow diagram of the algorithms used to detect each kind of defect. Table 2 shows, for our lighting conditions, the threshold values used for each defect if binarization proved necessary for detection.
3.2. Results
In order to test the proposed calibration algorithm (4)-(5)-(6), we compared it to the Tsai algorithm (1)-(2)-(3). From Table 3, which shows the results obtained for error (%) with respect to the transversal direction in the 2D case and with respect to slab thickness in the 3D case, it can be concluded that the proposed algorithm is suitable for the studied application, because, although it has errors higher than those of the Tsai algorithm, they remain below the maximums permitted by the standard. In comparing the two methods, the loss of precision is a small tradeoff for the savings in time and complexity.
Table 4 shows the main defects detected by the application and the detection rates.
4. Conclusions
We studied the feasibility of automating the quality control and classification process for slate slabs using images produced by a hybrid 3D-2D laser scanning system.
Slate classification to date has typically been performed manually by experts, which implies human subjectivity that can be aggravated by fatigue. In addition, slate experts need very specific and costly training.
The results of our study demonstrate that slate defects can be detected automatically using our hybrid 3D-2D laser scanning system. One important defect, the quartz filament, was excluded but will be studied in future research (in terms of identifying a trend line in the slate, typically a whitish tone). The model was tested in real time as a prototype.
As for the development of the system, we proposed an optimized calibration algorithm based on the Tsai algorithm. Comparing the results obtained for both, the proposed algorithm proved optimal for the application described, as it considerably simplified the calibration process, which is an aspect of crucial importance in an industrial setting.
A further line of research will be to examine the application of machine learning techniques (for example, support vector machines and neural networks) to slate slab classification on the basis of variables representing the information in the slate slabs.
Acknowledgments
J.M. Matías’s research is funded by the Spanish Ministry of Education and Science under Grant No. MTM2008-03010. J. Taboada’s research is funded by the Spanish Ministry of Education and Science under Grant No. BIA2007-66218.
References
- UNE-EN 12326-1:2005.; Productos de pizarras y piedra natural para tejados y revestimientos discontinuos. Parte 1: Especificación del producto; AENOR: Madrid, Spain, 2005.
- Rivas, T.; Matías, J.M.; Taboada, J.; Argüelles, A. Application of Bayesian networks to the evaluation of roofing slate quality. Eng. Geol 2007, 94, 27–37. [Google Scholar]
- Lombardero, M.; García-Guinea, J; Cárdenes, V. The geology of roofing slate. In Industrial Minerals and The Extractive Industry Geology; Scott, P.W., Bristow, C.M., Eds.; The Geological Society: London, UK, 2002; pp. 59–67. [Google Scholar]
- Salvi, J.; Pages, J.; Battle, J. Pattern codification strategies in structured light systems. Patt. Recog 2004, 37, 827–849. [Google Scholar]
- Fernández, C.; Fernández, J.; Aracil, R. Integral on-line machine vision inspection in the manufacturing process of ceramic tiles. Proceedings of SPIE 9th Annual Symposium on Electronic Imaging: Science and Technology, San Jose, CA, USA, 1998.
- Tobias, O.J.; Seara, R.; Soares, F.A.; Bermudez, J.C. Automated visual inspection using the co-occurrence approach. IEEE Midwest Symposium Circuits and Systems, Rio de Janeiro, Brazil, August 1995; pp. 154–157.
- Müller, S.; Nickolay, B. Morphological image processing for the recognition of surfaces defect. Proc. SPIE 1995, 2249, 231–262. [Google Scholar]
- Patek, D.; Goddard, J.; Karnowski, T.; Lamond, D.; Hawkins, T. Rule-based inspection of printed green ceramic tape. International Society for Optical Engineering. Photonics West Symposium on Electronic Imaging, San Jose, CA, USA, January 1998; pp. 22–30.
- Ojala, T.; Pietikäinen, M.; Harwood, D. A comparative study of texture measures based on feature distributions. Patt. Recog 1996, 29, 51–59. [Google Scholar]
- Ghita, O.; Whelan, P.F.; Carew, T.; Padmapriya, N. Quality grading of painted slates using texture analysis. Comput. Ind 2005, 56, 802–815. [Google Scholar]
- Smith, M.; Stamp, R. Automated inspection of textured ceramic tiles. Comput. Ind 43, 73–82.
- Ghita, O.; Carew, T.; Whelan, P. A vision-based system for inspecting painted slates. Sensors 2006, 26, 108–115. [Google Scholar]
- Peñaranda, J.; Briones, L.; Florenz, J. Colour machine vision system for process control in ceramics industry. Proc. SPIE 1997, 3101, 182–192. [Google Scholar]
- Boukouvalas, C.; Vernazza, G.; De Natale, F.; De Toni, G.; Kittler, J.; Marik, R.; Mirmehdi, M.; Petrou, M.; Le Roy, P.; Salgari, R. An integrated system for quality inspection of tiles. Proceedings of International Conference on Quality Control by Artificial Vision OCAV, Toulouse, France, May 1997; pp. 49–54.
- Batchelor, B.G.; Waltz, F.M. Intelligent Machine Vision: Techniques, Implementations and Applications; Springer: New York, NY, USA, 2001. [Google Scholar]
- Whelan, P.F. System engineering issues in industrial inspection. Proceedings of IEEE Colloquium on Industrial Ispection (Digest), London, UK, February 1997; pp. 1–6.
- López, M.; Vilán, J.A.; Casqueiro, C.; Matías, J.M. 3D Laser Scanner: A new method for estimating the dimensions of wood pulp chips. Nordic Pulp Paper Res. J 2006, 21, 342–348. [Google Scholar]
- Guzaitis, J.; Verikas, A. An efficient technique to detect visual defects in particleboards. Informatica 2008, 19, 363–376. [Google Scholar]
- Tsai, R.Y. Versatile camera calibration technique for high-accuracy 3D machine vision metrology using off-the-shelf TV cameras and lenses. IEEE J. Robotic. Autom 1987, 3, 323–344. [Google Scholar]
- Zexiao, X.; Jianguo, W.; Ming, J. Study on a full field of view laser scanning systems. Int. J. Mach. Tool. Manu 2007, 47, 33–43. [Google Scholar]
- Zhou, F.; Zhang, G. Complete calibration of a structured light stripe vision sensor through planar target of unknown orientations. Image Vision Comput 2005, 23, 59–67. [Google Scholar]


| Defect | Limit values |
|---|---|
| Material defects | 98.75% |
| False squaring | 5° |
| Warping | 1.5 mm |
| Homogeneity/fissuring | Std. Dev. = 8 mm |
| White staining | 1,000 mm2 |
| Defect | Threshold Binarization |
|---|---|
| Material defects | 5 |
| False squaring | 5 |
| Warping | N/A |
| Homogeneity/fissuring | N/A |
| White staining | 8 |
| Calibration method-Camera | Error (%) |
|---|---|
| Tsai method - 2D | 0.2 |
| Tsai method - 3D | 0.2 |
| Proposed method - 2D | 1.5 |
| Proposed method - 3D | 1.9 |
| Defect | Detection (%) |
|---|---|
| Material defects | 99.8 |
| False squaring | 99.7 |
| Warping | 99.5 |
| Homogeneity/fissuring | 99.5 |
| White staining | 99.8 |
© 2010 by the authors; licensee MDPI, Basel, Switzerland. This article is an open access article distributed under the terms and conditions of the Creative Commons Attribution license (http://creativecommons.org/licenses/by/3.0/).
Share and Cite
López, M.; Martínez, J.; Matías, J.M.; Vilán, J.A.; Taboada, J. Application of a Hybrid 3D-2D Laser Scanning System to the Characterization of Slate Slabs. Sensors 2010, 10, 5949-5961. https://doi.org/10.3390/s100605949
López M, Martínez J, Matías JM, Vilán JA, Taboada J. Application of a Hybrid 3D-2D Laser Scanning System to the Characterization of Slate Slabs. Sensors. 2010; 10(6):5949-5961. https://doi.org/10.3390/s100605949
Chicago/Turabian StyleLópez, Marcos, Javier Martínez, José María Matías, José Antonio Vilán, and Javier Taboada. 2010. "Application of a Hybrid 3D-2D Laser Scanning System to the Characterization of Slate Slabs" Sensors 10, no. 6: 5949-5961. https://doi.org/10.3390/s100605949