2.1. Spectral Shifts and Fluorescence Enhancement of ANS Probes by PAMAM Dendrimers
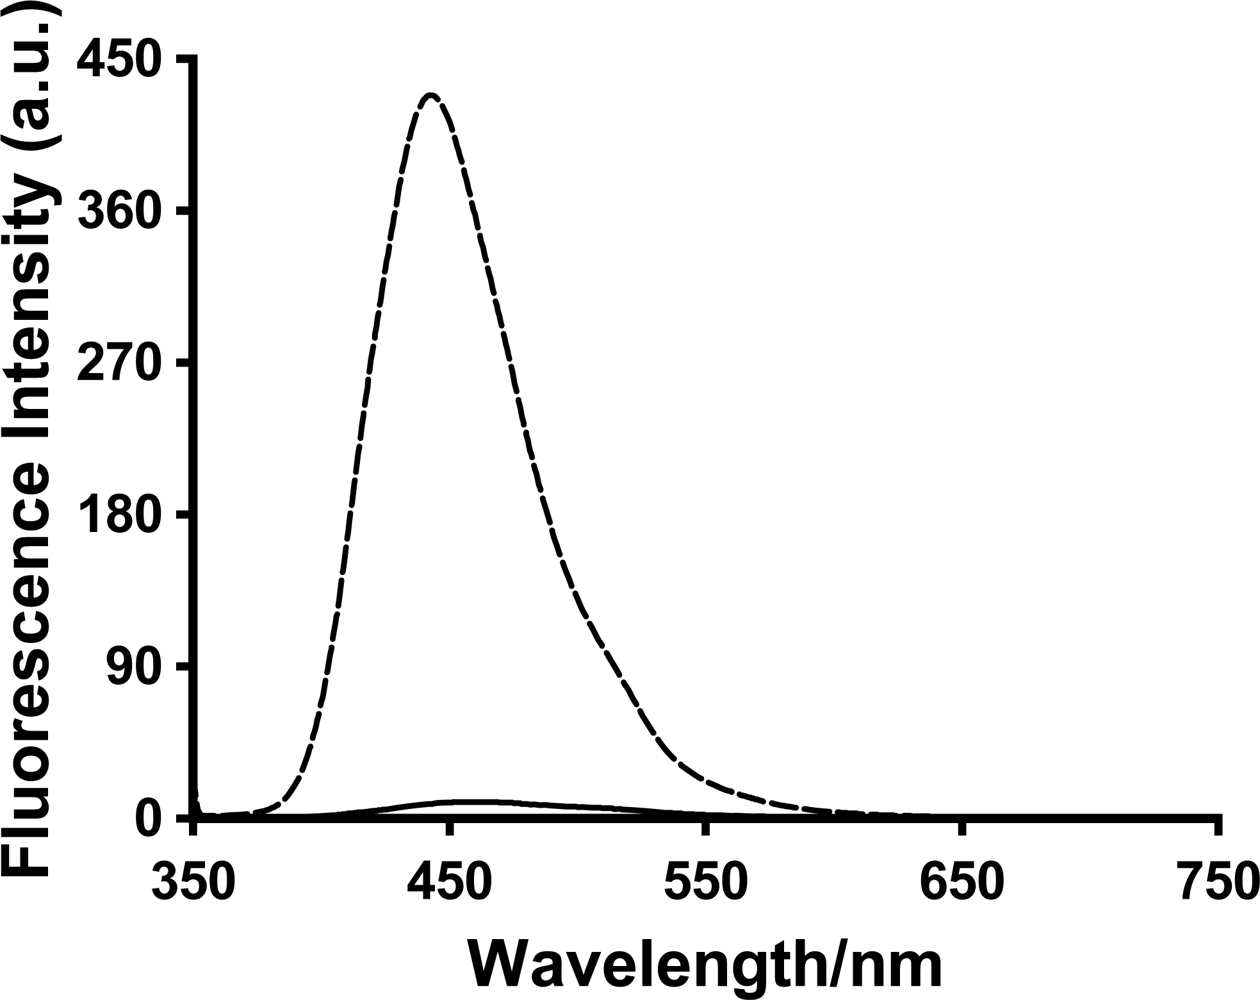
A large increase in the fluorescence intensity was observed for all three probes 1,8-ANS, 2,6-ANS and 2,6-TNS upon addition of the various generations of PAMAM dendrimers. The relative fluorescence spectrum of 2,6-ANS in the absence and presence of dendrimer G5 at 1 mM concentration is shown in
Figure 3.
The fluorescence enhancement can be quantified as F/F
o, the integrated fluorescence spectrum in the presence divided by the absence of host. F/F
o values at 1 mM dendrimer concentration for the three probes in the Generation 4, 5, and 6 dendrimers are listed in
Table 1. These large enhancements indicate that the probes are experiencing significantly reduced polarity environments in the presence of the dendrimer hosts, indicating they have become included within the host interior. The order of enhancement observed of 2,6-TNS > 1,8-ANS ≥ 2,6-ANS (the enhancement for 1,8-ANS is significantly larger than that for 2,6-ANS only in the case of PAMAM dendrimer G6) is a reflection of the differing polarity sensitivity of these three guests, as measured in our group using the Polarity Sensitivity Factor (PSF), which we defined as the ratio of the fluorescence of a probe in ethanol as compared to water [
32–
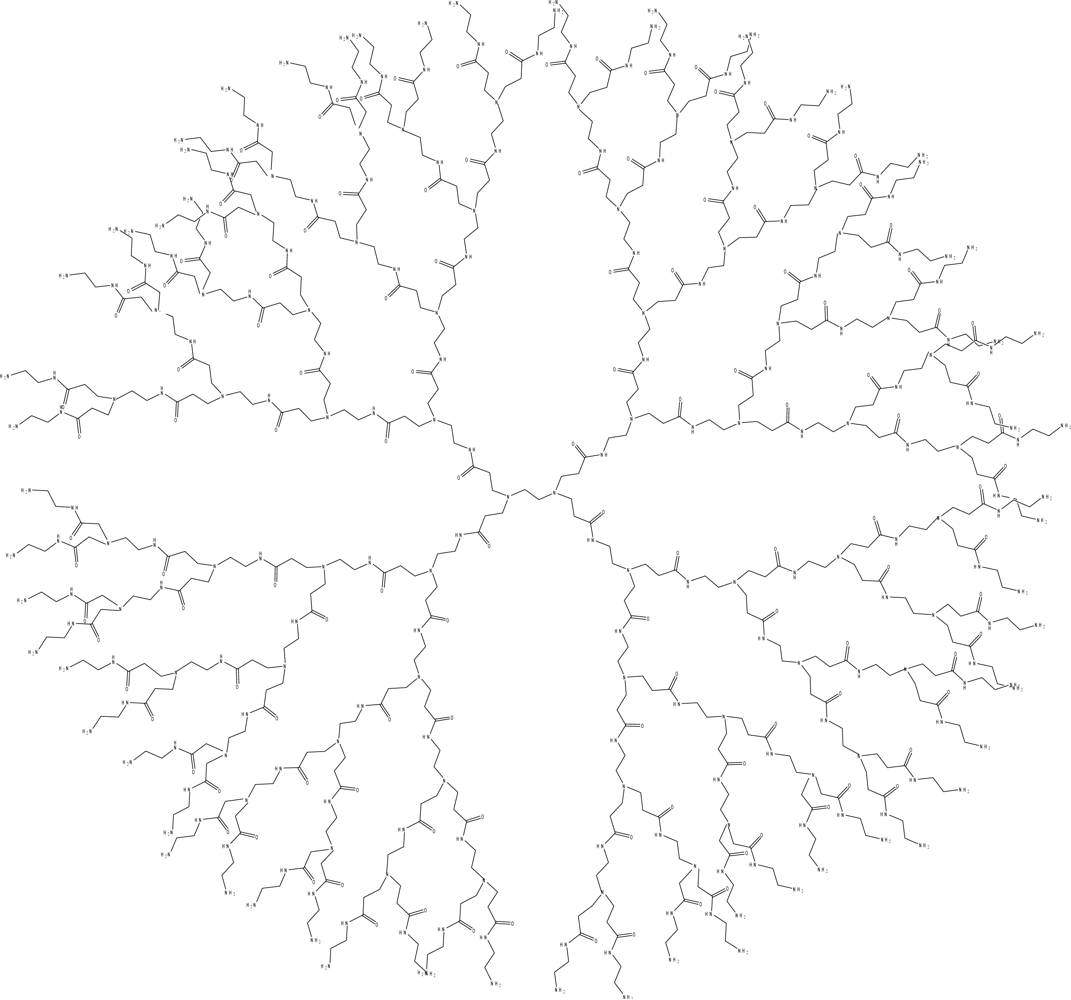
34]. We have measured the PSF to be in the same order of 2,6-TNS > 1,8-ANS > 2,6-ANS; thus the differences in enhancement observed is not a reflection of different polarity sites accessed by the three probes. There is also very little difference in the observed values of the enhancement for each probe as a function of Generation number. It can thus be concluded that even with the differences in cavity shape and size for PAMAM dendrimers of different generation number, the local polarity experienced by these guests is similar for each of the three hosts G4, G5 and G6. These hosts have very different diameters of 40, 52 and 67 Å for G4, G5 and G6, respectively [
35]. In comparison, 1,8-ANS has a maximum length of
ca. 11 Å, based on its crystal structure [
36], so that it is unlikely that it is fully included within the G4 dendrimer, as was pointed out by Bryszewska
et al. [
23]. The lack of dependence of the observed enhancement on generation number can thus either be a result of the fact that polarity of the cavities is similar for each generation number (since the chemical compositions are the same), or it may indicate a similar degree of encapsulation of the guests into the different generation dendrimer hosts, despite the large difference in host and cavity sizes. In either case, the hydrophobic interaction of the guest and host is seen to contribute to the host-guest inclusion process. In addition, electrostatic interactions between the sulfonate group and protonated terminal amines of the hosts also play a role in the host-guest interactions [
23].
There also was a significant blue-shifting of the spectrum of each of the three probes in the presence of all three dendrimers; again this indicates that the probes experience a significantly lower polarity local environment, indicative of inclusion within the host interior. Similarly to the enhancement results, the blue shifts seen for each probe were nearly independent of generation number: 1,8-ANS shifted from 516 nm in the absence of dendrimer to 480, 480 and 478 nm in the presence of 1 mM G4, G5 and G6, respectively; 2,6-ANS shifted from 461 to 444, 442, and 444 nm and 2,6-TNS shifted from 463 to 454, 454, and 453 nm under these same conditions. These results again indicate that similar environments are experienced by the three probes regardless of the generation number.
2.2. Comparative Binding of ANS Probes by PAMAM Dendrimers
The increase in the fluorescence intensity and blue shift in the spectra indicates the formation of the host-guest inclusion complexes of each of these three probes with each of the three dendrimers. Multiple single fluorescence titration experiments, the measurement of the fluorescence enhancement (F/F
o) as a function of host concentration, were performed for each of the 9 host-guest pairs. This data can then be used to extract the binding constant(s), based on a particular complexation model [
34]. In the case of simple 1:1 host: guest complexation (which is not expected for dendrimer inclusion, based on the work of Bryszewska
et al.), the following equation can be fit to extract the binding constant K [
37]:
A double reciprocal plot of 1/(F/F
o−1)
vs. [host] can be used to test for simple 1:1 complexation: this plot will be linear if only 1:1 complexation is occurring, but will be non-linear if any other stoichiometry or set of stoichiometries are being formed. As mentioned in the introduction, Bryszewska
et al. have reported the number of binding sites for 1,8-ANS complexed by PAMAM dendrimers as 0.31 for G4 [
23] and 0.5–0.7 for G5 [
26]. Thus, more than 1 host is involved in the complexation of a single 1,8-ANS in these two cases, which suggest that a 2:1 host: guest model would be more appropriate for G5 (and perhaps G4) binding of these probes. The following equation has been derived for the stepwise formation of a 1:1 followed by addition of a second host to form a final 2:1 complex [
38]:
In this equation, K
1 and K
2 are the equilibrium constants for the first then second host forming a complex with the guest; F
1/F
o is the enhancement when every guest is bound by 1 host, and F
2/F
o is the enhancement when every guest is bound by two hosts.
Figure 4 shows the fluorescence titration curves (based on the average of 3 to 4 individual trials) for the three probes in PAMAM dendrimer G4, with the fits to these two models using non-linear least squares fitting to
Equation 1 and
2.
The most interesting and surprising aspect of these titration curves shown in
Figure 4 is the anomalous narrow peak at very low [G4], which appears as a spike very close to the y-axis. This intriguing and important phenomenon will be discussed in detail in Section 2.3. It is clear that the entire titration curves, including the spikes at low dendrimer concentration, will not fit to the conventional 1:1 and 2:1 models described above. In order to obtain at least a qualitative indication of the comparative strength of the binding of each probe with G4, fits were therefore performed on the fluorescence titration data omitting the points in the low dendrimer concentration that define the peak. The results are indicated in
Figure 4 as solid lines (1:1 fit) and dashed lines (2:1 fit). Also shown is an example of the full double-reciprocal plot (for 1,8-ANS). It is clear from the 1:1 fit lines and the non-linear double reciprocal plot that the 1:1 model is inadequate for these complexes, even with the anomalous peak data omitted, as expected.
Figure 4 shows that the 2:1 model does provide a very good visual fit for all three probes in G4, with excellent agreement between the fit line and data points. This is equivalent to 0.5 binding sites per G4 host, compared to the results obtained by Bryszewska
et al. of 0.31 binding sites for G4 [
23]. However, the values of the 4 fit parameters for
Equation 2: F
1/F
o, K
1, F
2/F
o and K
2 were found to vary widely for the individual trials, and no consistent values could be obtained in order to do a quantitative comparison. This could be a result of a number of factors, including the additional complexity indicated by the peaks in the titration curves being manifested throughout the concentration range of the titration data, the lack of points at the important low dendrimer concentration (which were removed because of the spike), and the extremely strong binding, which makes extraction of the binding constants more difficult. Alternatively, this could indicate that simple 2:1 complex formation is not in fact occurring, and that the observed spike is indicative of a much more complex system. Thus, a quantitative comparative binding study could not be performed, but only a qualitative comparison can be made, based on the relative curvature of the titration plots themselves. This can be done by considering the binding constants obtained using the 1:1 model; although clearly being an insufficient fit model, it does provide a direct measure of the curvature of the plots. Relatively consistent results were obtained between trials, and the resulting average values of K can be used to give an indication of the relative binding of the three ANS guests. The results are shown in
Table 2; qualitatively at least, 2,6-ANS and 2,6-TNS bind more strongly than 1,8-ANS, indicating that the more streamlined 2,6-substituted guests are a better match for the size and shape of the G4 cavities.
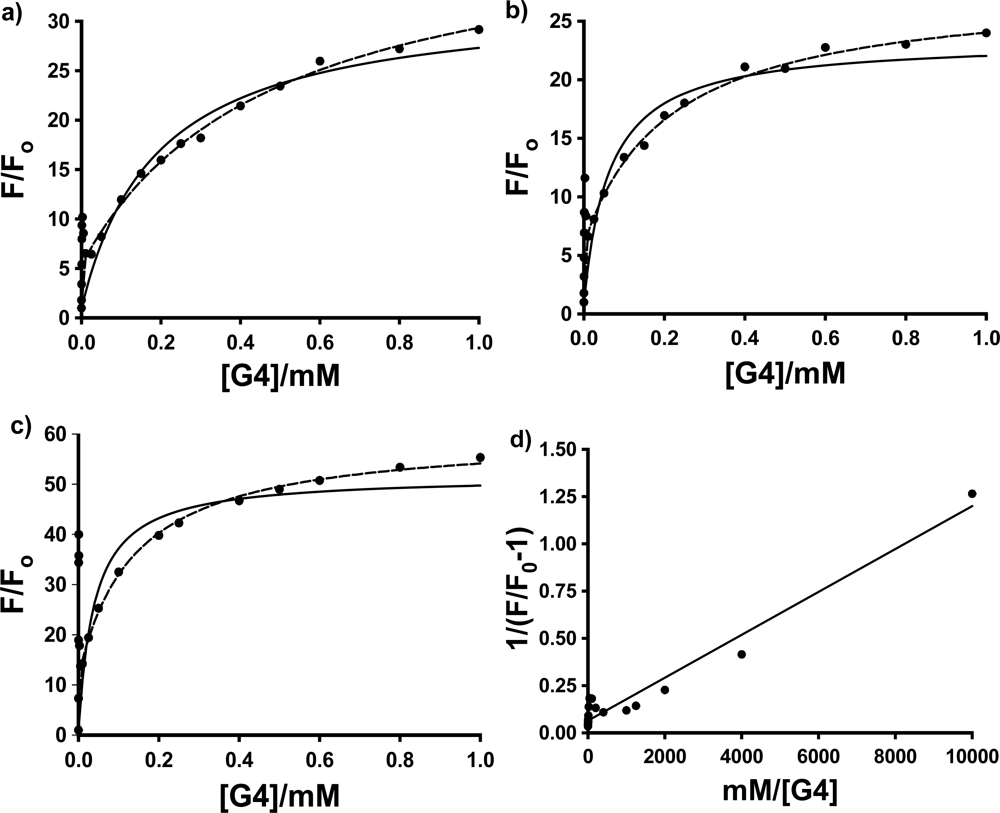
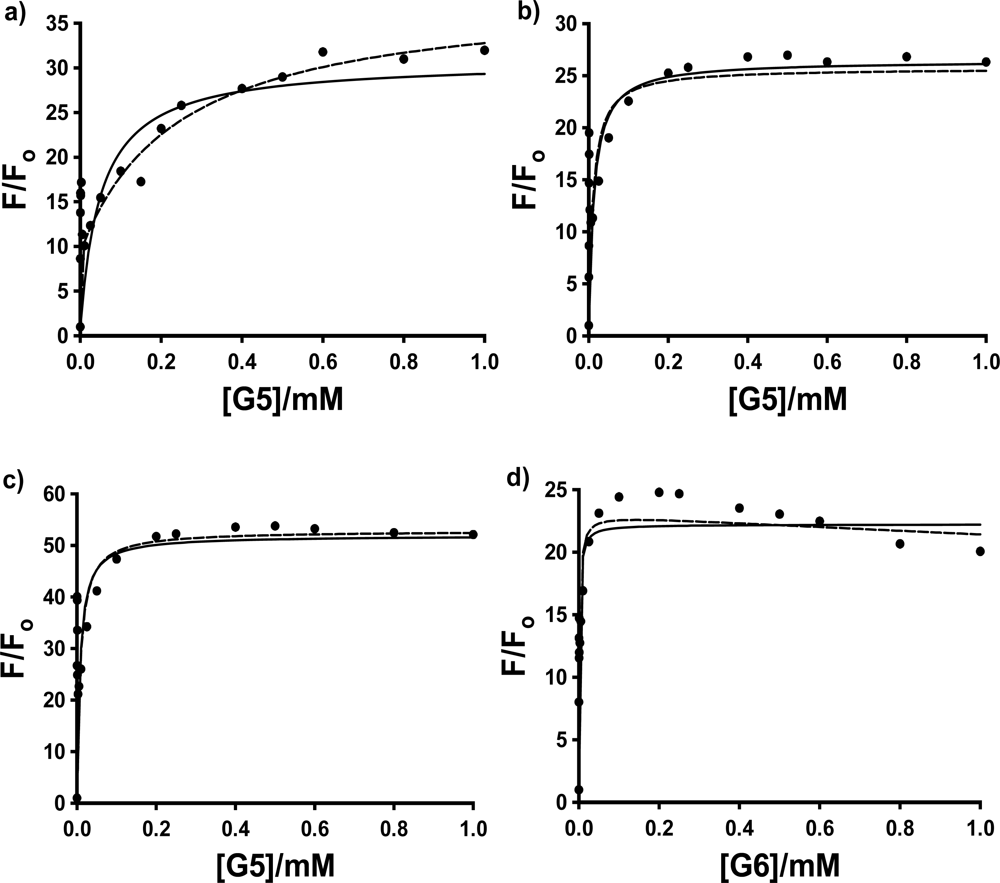
In the case of G5, shown in
Figure 5 a to c, the peak in the fluorescence titration data was again present for all three probes, while in the case of G6, the spike was observed consistently in the case of 2,6-ANS and 2,6-TNS, and in 3 of 5 trials in the case of 1,8-ANS. (We have no explanation at this time as to why the spike was not observed in the first two trials performed for 1,8-ANS in G6, especially since the same bottle of G6 dendrimer in methanol was used for the trials with 2,6-ANS and 2,6-TNS, all of which exhibited the anomalous spike.) In these cases, the 2:1 model provided a good visual fit to the titration data only in the case of 1,8-ANS in G5. While this is in agreement with the results of Bryszewska
et al. of approximately 0.5 binding sites per G5 host [
26], once again the fit values of K
1 and K
2 were not reproducible from trial to trial, and no quantitative results could be obtained. In the case of G5, the average results for the fits to the 1:1 model are given in
Table 1. Once again the 2,6 substituted guests bind much more strongly to G5 than does 1,8-ANS. In addition, 2,6-TNS was found to bind much more strongly than 2,6-ANS, indicating an effect of the methyl substitution on the electronic properties of the naphthalene moiety, and its interaction with the G5 host. In the case of G6, as shown by the representative sample of 2,6-ANS in
Figure 5d), not even qualitative comparisons could be made, due to the very steep rise in the titration curves in all three cases.
As a result of the lack of reproducible fit parameters of the fluorescence titration data for the three probes in the three PAMAM dendrimers with either a simple 1:1 or 2:1 host: guest inclusion model, the more complicated double fluorometric titration method used by Bryszeska
et al. for studying the binding of 1,8-ANS in PAMAM dendrimers [
23–
27] was undertaken for the three probes. A preliminary set of single trials was performed in G4 as a representative dendrimer host, to do the desired comparative binding study. This approach, as mentioned earlier, involves the measurement of a pair of fluorescence titration curves, one with fixed guest concentration and varying host concentration (equivalent to those shown in
Figures 4 and
5), and the other with fixed host concentration and varying guest concentration. In the present study, two separate sets of experiments were done, one with dendrimer concentrations fixed at a higher concentration above the anomalous spike (0.20 mM), and the other with the dendrimer concentration fixed at a low concentration at which the anomalous spike was observed (0.0025 mM). The results from the low dendrimer concentration study will be discussed in the next section.
In this technique, described in detail in the literature [
23–
27 and references therein,
39], the host titration allows for the determination of the fluorescence enhancement for the bound ANS guest. This value can then be used with the guest titration data to calculate the concentration of free and bound ANS based on the enhancement observed at each guest concentration. The following relationship between the bound and free guest ANS concentrations can then be used to determine the values of the binding constant K
b and the number of binding sites n [
23–
27,
39]:
Thus, a double-reciprocal plot of [host]/[guest]bound vs. 1/[guest]free should yield a straight line, with values of n and Kb obtainable from the y-intercept and the slope.
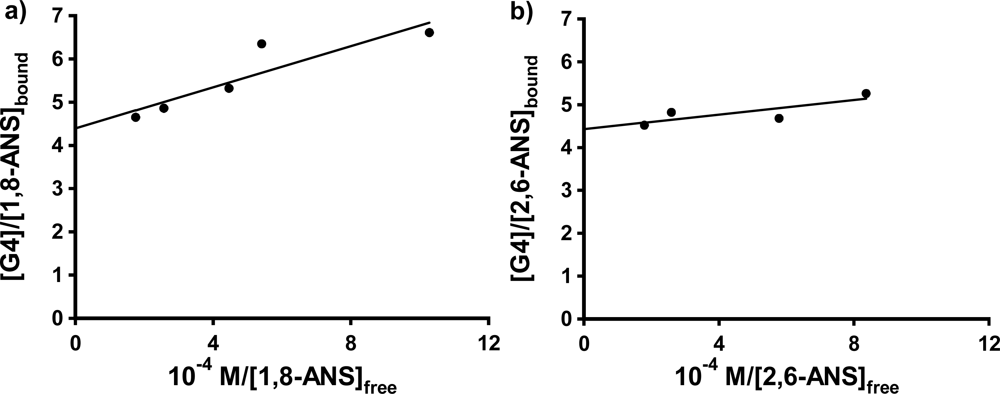
Figure 6a and b shows these plots for 1,8-ANS and 2,6-ANS in the presence 0.20 mM G4 dendrimer, respectively (well above the host concentration at which the anomalous spike was observed in each case). The results for the fits to
Equation 3 are shown in
Table 3. For 1,8-ANS with G4, Bryszewska
et al. reported K
b values of 5.6 × 10
4 M
−1 [
23], 2.6 × 10
5 M
−1 (low affinity binding centers) and 3.7 × 10
6 M
−1 (high affinity binding centers) [
25] and n values of 0.31 [
23], 0.60 (low affinity binding centers) and 0.34 (high affinity binding centers) [
25] in buffer solution. Our value of K
b of 1.8 ± 0.5 × 10
5 in nanopure water is in best agreement with that reported for the low affinity (surface) binding centers, however our value of n is slightly lower than that reported. For 2,6-ANS with G4, a higher constant was obtained than that for 1,8-ANS, in agreement with the qualitative results obtained from the 1:1 fits above that the more streamlined 2,6-ANS binds more strongly to G4 PAMAM dendrimers than does the comparatively bulky 1,8-ANS. In the case of 2,6-TNS in G4, the resulting double reciprocal plot was too highly scattered to allow for the determination of K
b and n.
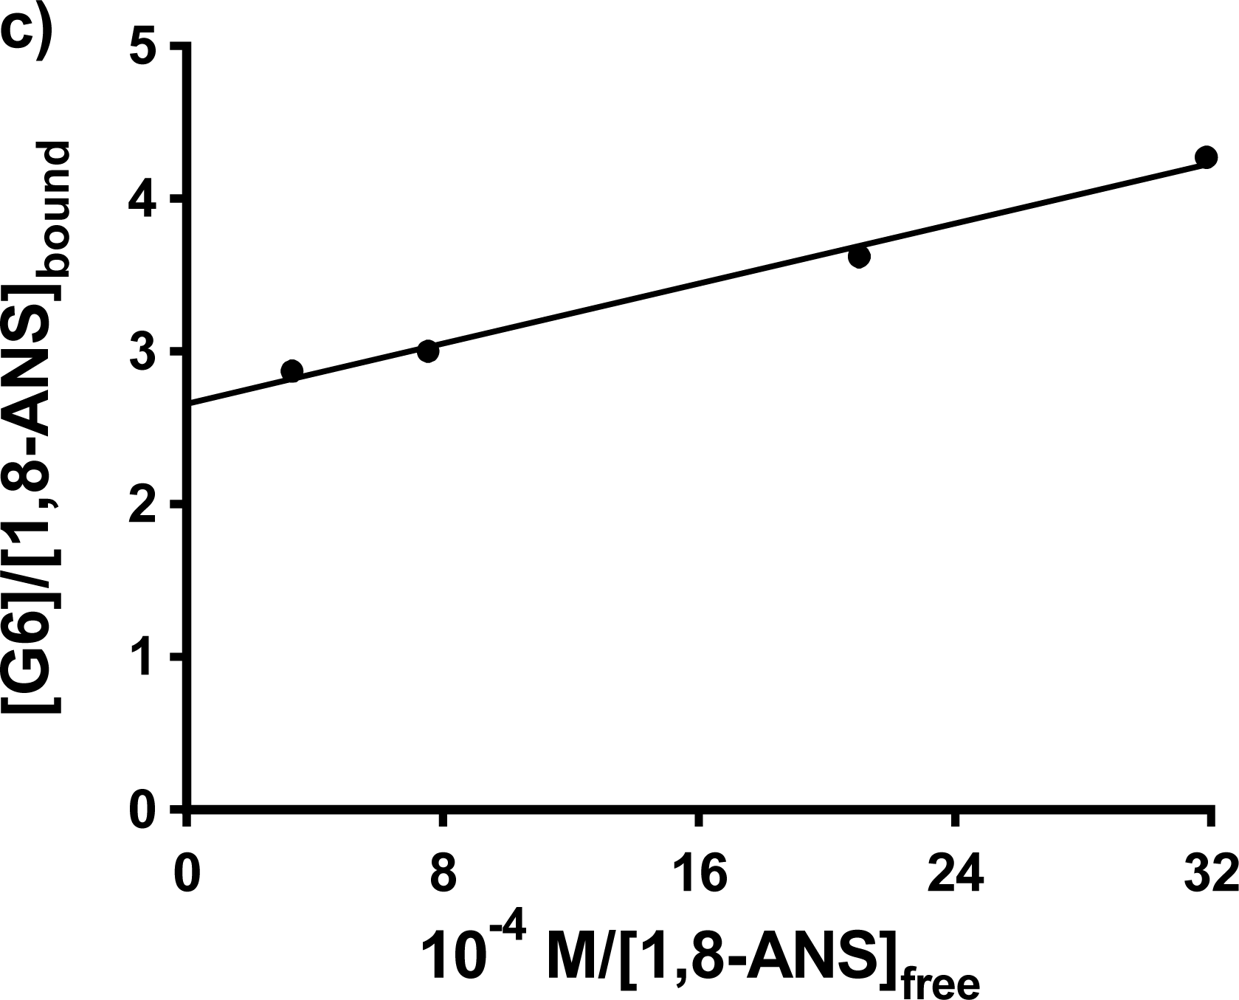
Single trial double fluorometric titrations were also carried out for 1,8-ANS in G5 and G6 at 0.20 mM host concentrations. In the case of G5, the resulting double reciprocal plot was found to be curved, so that the values of K
b and n could not be determined. In the case of 1,8-ANS in G6, the double reciprocal plot was linear, as shown in
Figure 6c); the fit results are listed in
Table 3. The value of K
b obtained falls between the two values reported for 1,8-ANS in G6 in buffer solution by Bryszewska
et al. [
25] for the low and high affinity binding centers. However the value of n obtained here is very small, and is expected to be much greater than 1 for this very large dendrimer [
25]. Future work will involve more double fluorescence titration experiments to further delineate the current results using 1,8-ANS, in addition to investigating the comparative binding of 2,6-ANS and 2,6-TNS in these hosts.
2.3. The Unusual Fluorescence Titration Behaviour at Low Dendrimer Concentration
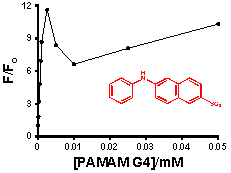
As was seen in
Figures 4 and
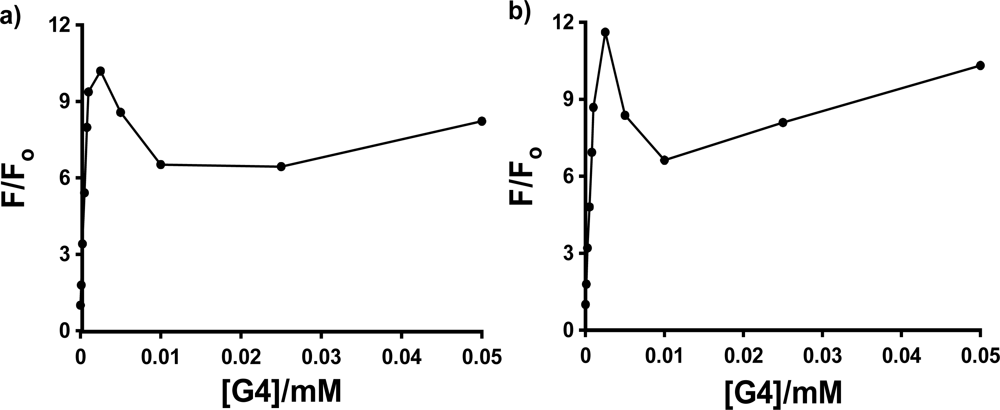
5, there is a sharp spike in the measured fluorescence enhancement in the host titration curves, followed by a more expected smooth increase in fluorescence with increasing concentration of the dendrimer host. This anomalous phenomenon was found to occur consistently for all three anilinonaphthalene sulfonate probes in all three PAMAM Generation 4–6 hosts, with the exception of 1,8-ANS in G6, in which case the spike was observed in three of five host fluorescence titration trials. The spike is more clearly shown in
Figure 7, which shows an expansion of the host titration curve at very low PAMAM dendrimer concentration for the case of 1,8-ANS and 2,6-ANS in G4 host. In all cases, there was no difference in the wavelength of maximum emission in the spectra at low concentration (where the spike was observed) compared to high concentration, which indicates that the guest experiences a similar environment at these two concentrations.
The enhancement of the peak at low host concentrations is quite significant in comparison to the enhancement at the higher host concentrations. This can be quantified as the ratio of the fluorescence enhancement F/Fo measured at the height of the low concentration peak to that measured at the highest dendrimer concentration (1 mM in all cases). In the case of G4 host, the fractional height of the peak was found to be 0.35, 0.48 and 0.72 for 1,8-ANS, 2,6-ANS and 2,6-TNS, respectively. A similar pattern of increasing relative size of the peak was also observed for the three probes in G5 (0.54, 0.74 and 0.77). In the case of G6, while the peak was not consistently observed for 1,8-ANS, a large peak was observed for 2,6-ANS (0.65), and the peak for 2,6-TNS was in fact observed to be larger than the enhancement at 1 mM, with a fractional size of 1.3. Thus, the formation of the anomalous peak is facilitated by the more streamlined shape of the 2,6-substituted guests.
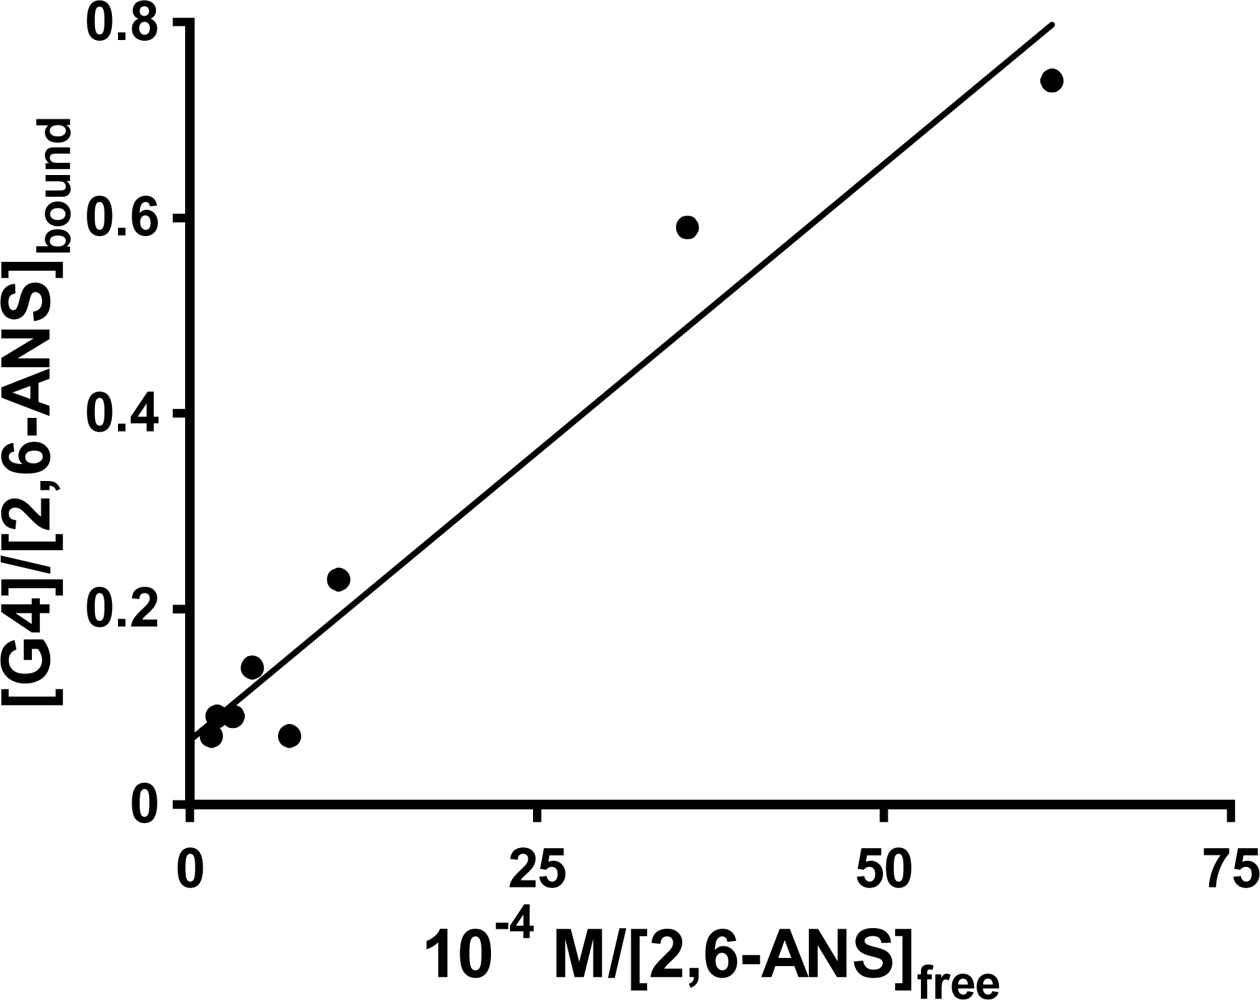
In order to further investigate the nature of the interactions between the ANS guests and the PAMAM dendrimers which results in these spikes in the host fluorescence titration plots, single trial double fluorometric titration studies were done for the three probes in G4, again as a representative dendrimer host for comparative binding studies, as well as for 1,8-ANS in G5 and G6. The guest fluorescence titration plot was carried out at the concentration of the maximum observed anomalous peak in the host fluorescence titration plot ([G4] = 0.0025 M in all cases). In the case of 1,8-ANS in both G4 and G5, the resulting double reciprocal plots yielded negative y-intercepts (but close to 0), which has no physical meaning (n, the number of binding sites, would be negative). In the case of both 2,6-TNS in G4 and 1,8-ANS in G6, the double reciprocal plot was highly scattered, preventing meaningful determination of n and K
b. However, in the case of 2,6-ANS, the double reciprocal plot was reasonably linear, as shown in
Figure 8, and gave a very small but positive y-intercept, allowing for the determination of n and K
b.; these are listed in
Table 3. The values of K
b = 5.9 ± 2.5 × 10
4 M
−1 and n = 15 ± 6 obtained at the spike region are very different from those described above for 2,6-ANS using guest fluorescent titration at a fixed [G4] = 0.20 M (well above the region of the spike) of K
b = 5.3 ± 2.7 × 10
5 M
−1 and n = 0.23 ± 0.01. These results indicate that at the [G4] concentration at which the spike occurs, the binding of 2,6-ANS is weaker, but many more guests are bound per G4 host, as compared to higher host concentrations. Thus, there is a significant change in the nature of the binding between the 2,6-guest and the G4 host in these two concentration regimes. However, it is unclear at this point how such a change in the nature of the binding of the host with the guest with changing host concentration would result in the observed spike in the fluorescence enhancement, particularly in light of the similar shape and position of the 2,6-ANS fluorescence spectrum at the various concentrations of host. Future work will be needed to explain the origin of the spike.
This anomalous spike in the host fluorescence titration curve is, to the best of our knowledge, unprecedented in the literature. The only similar report of a fluorescence titration in which an initial steep increase in fluorescence was followed by a sharp decline as a function of host concentration was reported for pyrene as a guest in G2 starburst polymer hosts [
6]. However, that fluorescence titration involved pyrene excimer fluorescence, and was explained as a result of the dependence of the formation of pyrene excimers in the host cavity (1:2 or 2:2 host: guest complexes) on host concentration. Excimer formation decreased as the host concentration increased, as inclusion of pyrene guest pairs gave way to inclusion of pyrene monomers. This scenario is not occurring in our ANS-PAMAM dendrimer systems, as these guests do not exhibit excimer fluorescence; the changes in fluorescence intensity are solely a result of the changes in binding and local environment on individual ANS guests.


