Real-time PCR Machine System Modeling and a Systematic Approach for the Robust Design of a Real-time PCR-on-a-Chip System

Abstract
:1. Introduction
2. Methods
2.1. Robust Design
2.2. Systematic Approach for the Robust Design of a Real-Time PCR-on-a-Chip System
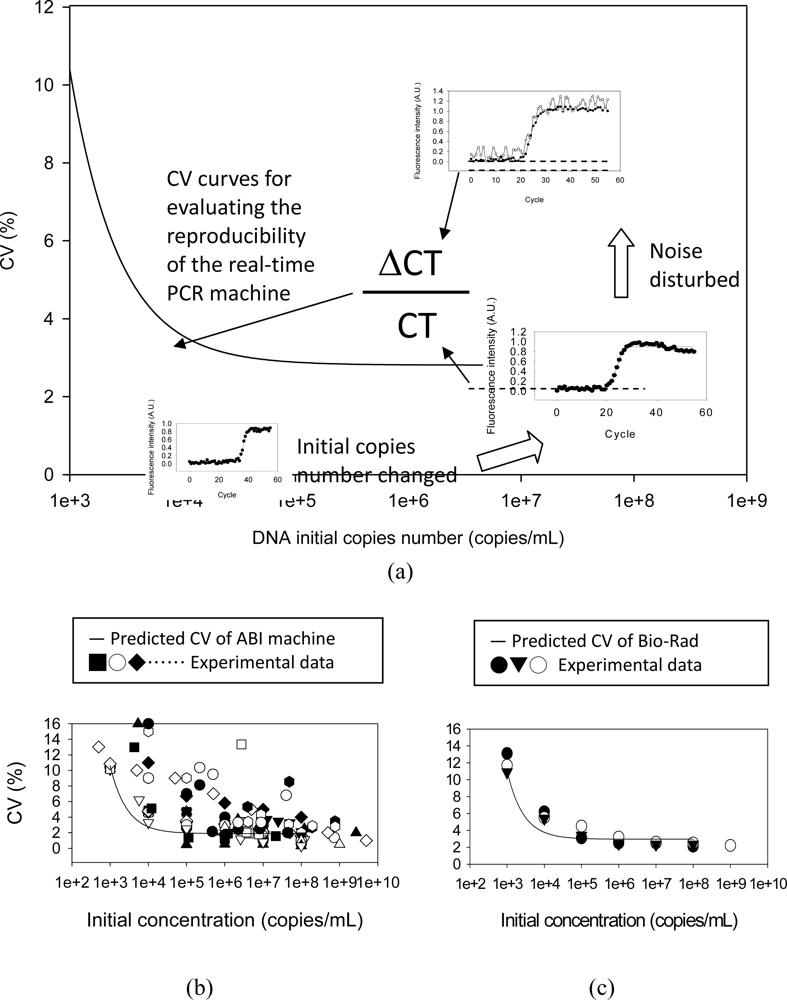
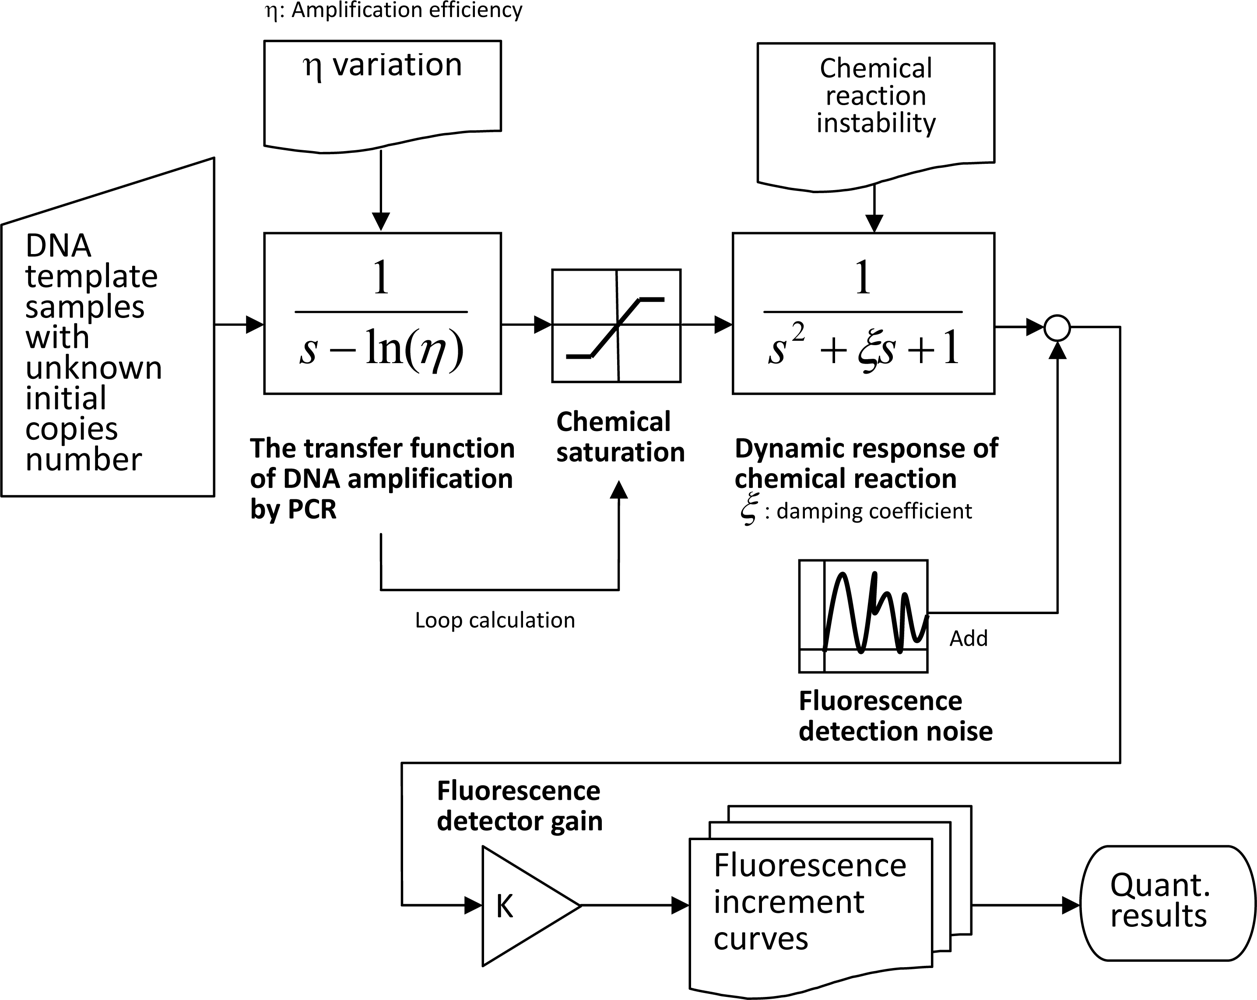
- The system identification model [13]: A system identification model was built as a guide for ideal function. This model specifies the signal factor of the real-time PCR machine: DNA template samples with an unknown initial number of copies, and the response of fluorescence incremental curves for DNA quantifications. The control factors were defined based on quantification experiments. The simulations in this study also considered noise factors, including DNA amplification efficiency variations and the chemical reaction instability.
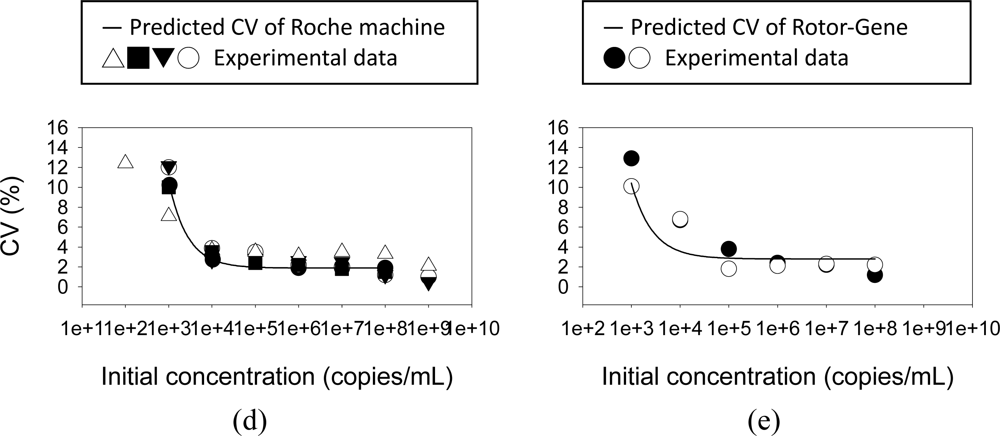
- Coefficient of variation (CV): The effectiveness of the model was verified using experimental data obtained from commercial real-time PCR machines. This study uses inter-assay CV instead of the quadratic loss function to quantify the performance deviation. The coefficient of variation, CV, with the percentage unit is usually employed as an index for DNA quantification. It is defined as:where ui denotes the initial number of copies of the test samples, the suffix M indicates the measured results of the number of DNA fragments in the test sample. The suffix s indicates the correct DNA amount known from the standard sample, collecting n-times measurement, and checking with the correct value. The degree of uncertainty of DNA quantification can be evaluated.
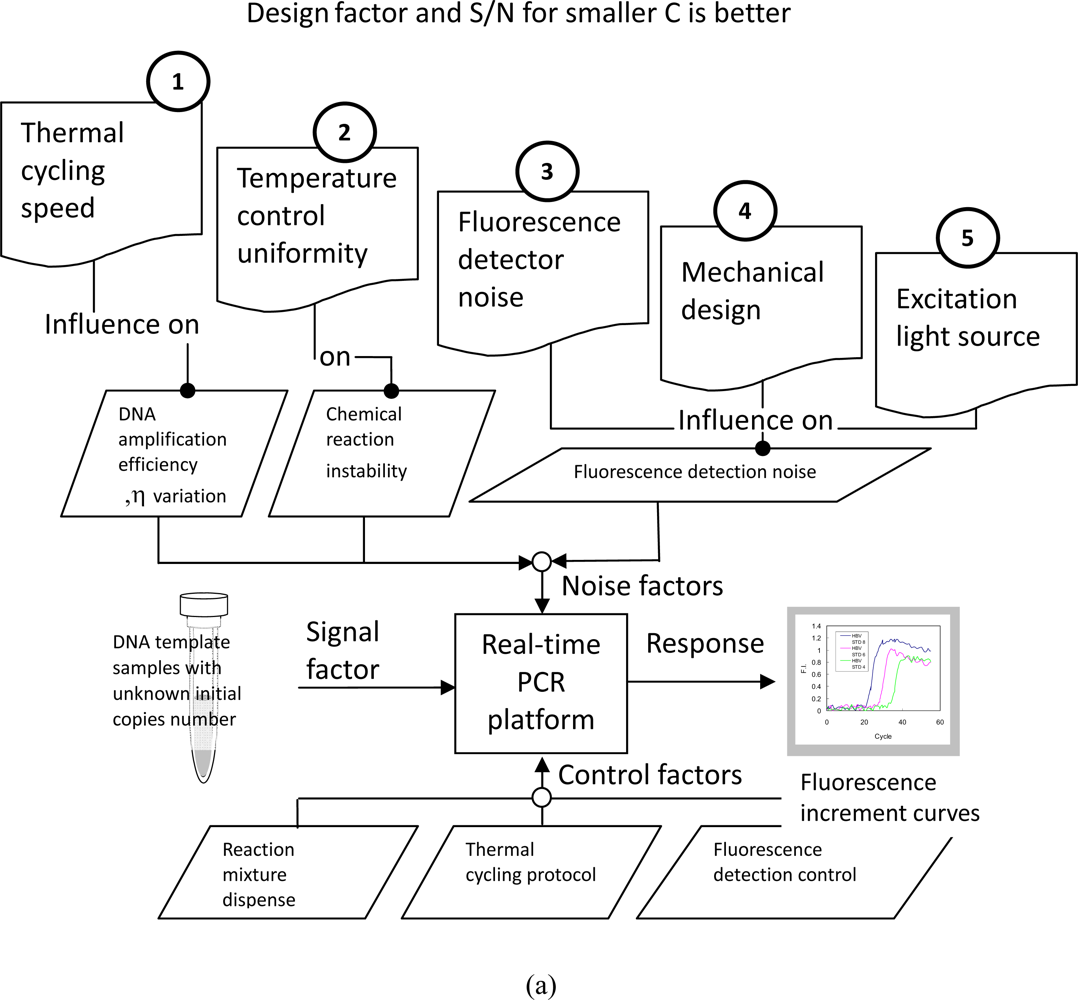
- Parameter diagram (P-diagram): The P-diagram was developed to classify all variables and determine the influential factors based on the numerical model.
- S/N ratio calculation for the smaller the better CV: Taguchi's S/N ratio for the smaller the better CV was implemented to quantify the influences of design factors and analyze the chip design to achieve high reliability. The goal of DNS quantification is to make the CV as low as possible. The S/N ratio can be calculated by:This equation indicates that the S/N ratio can be determined by comparing the log of the summation of the CV values with the instrument arrangements.
- Orthogonal arrays: The orthogonal arrays suggested by Taguchi’s method provide a set of minimum experiments for determining the influential factor for the real-time PCR on-a-chip design.
3. Experimental Apparatus
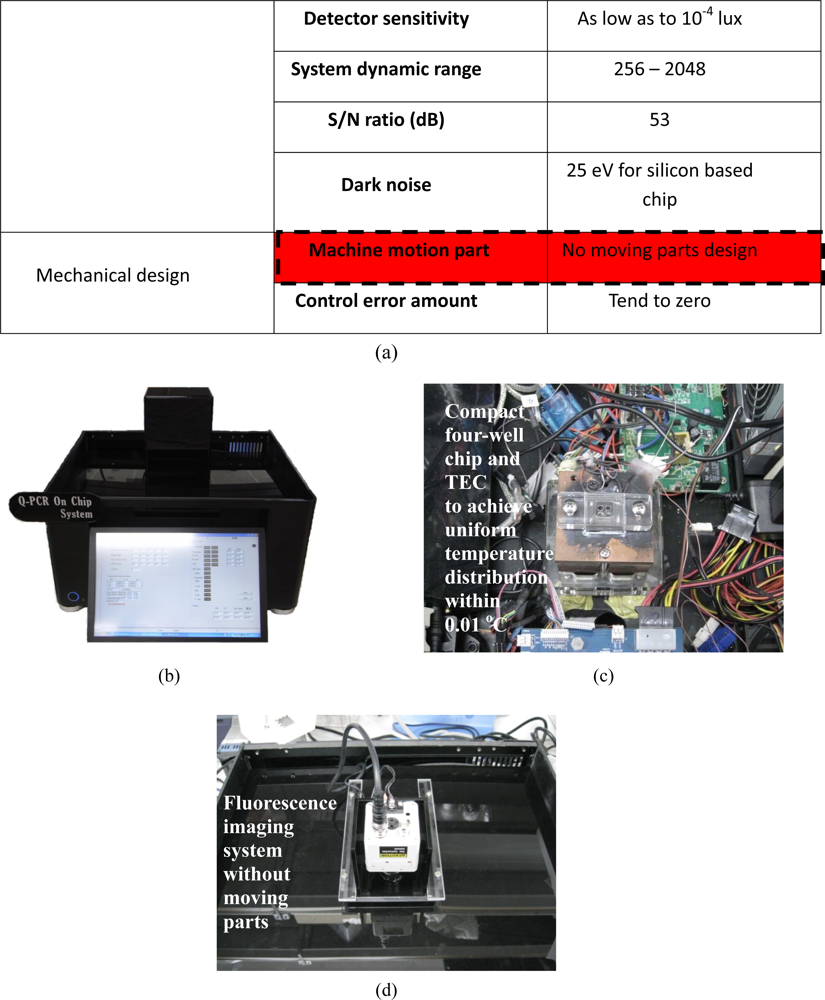
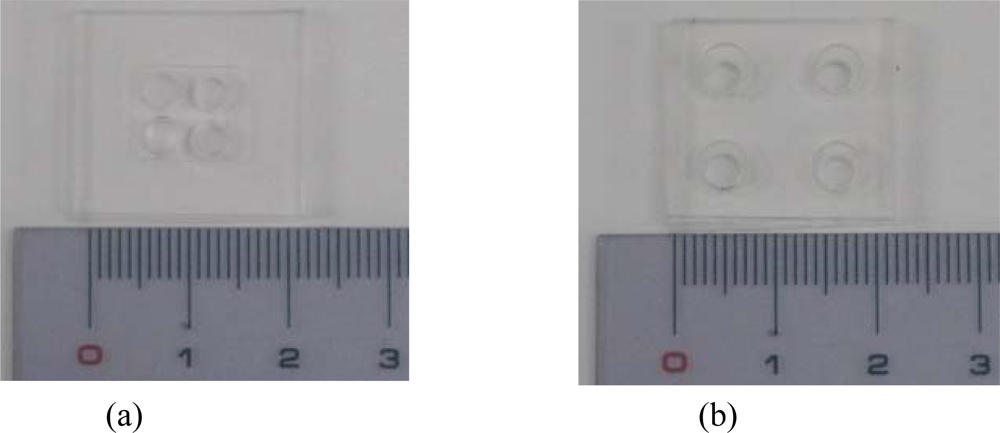
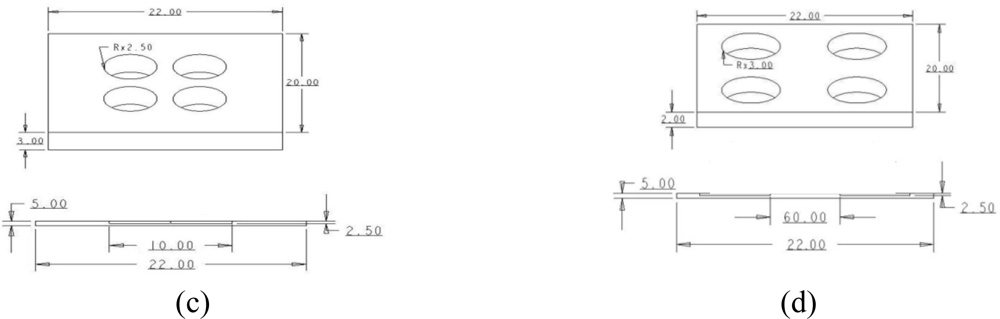
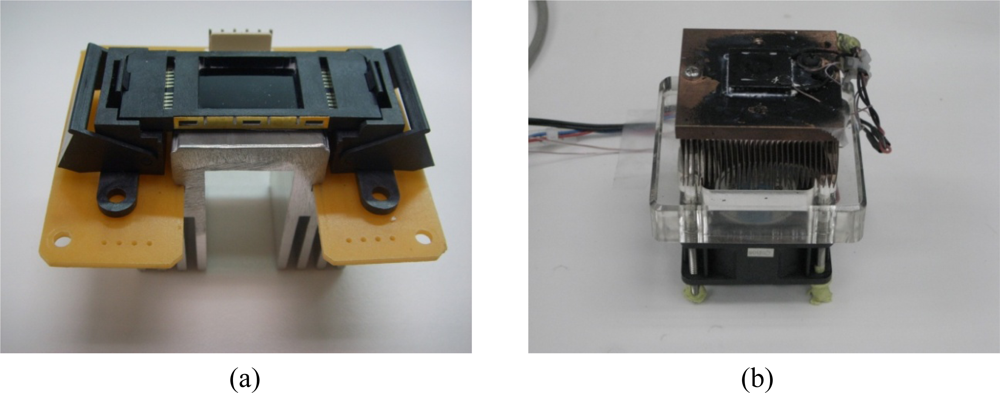
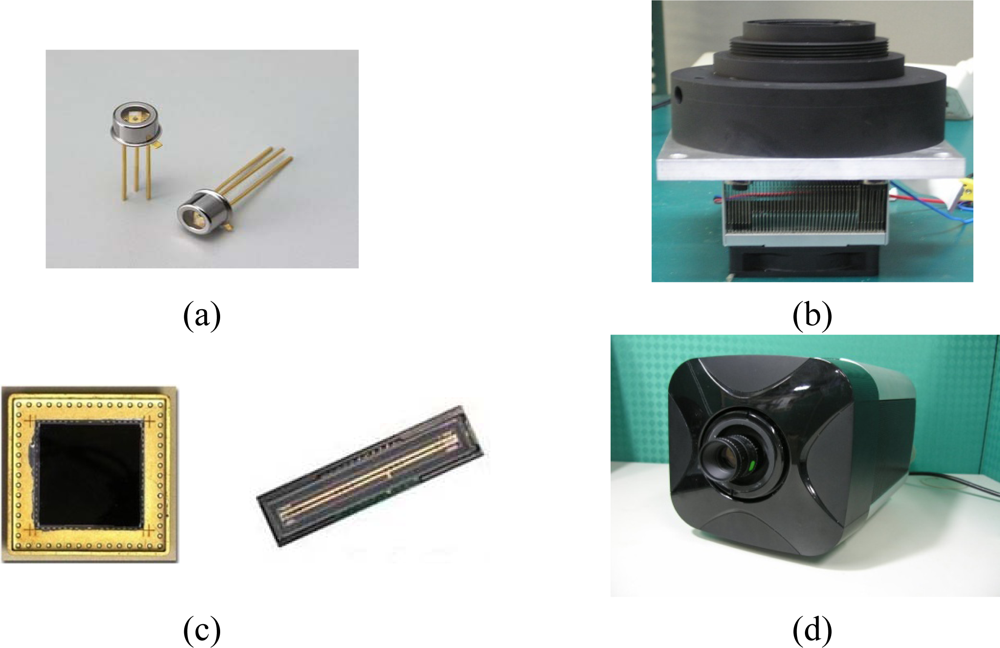
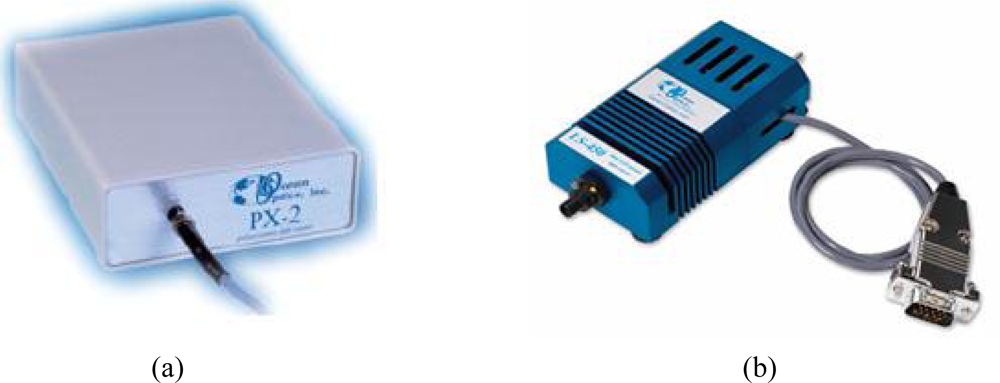
3.1. The Real-Time PCR-on-a-chip System
3.2. DNA Quantification Experiments
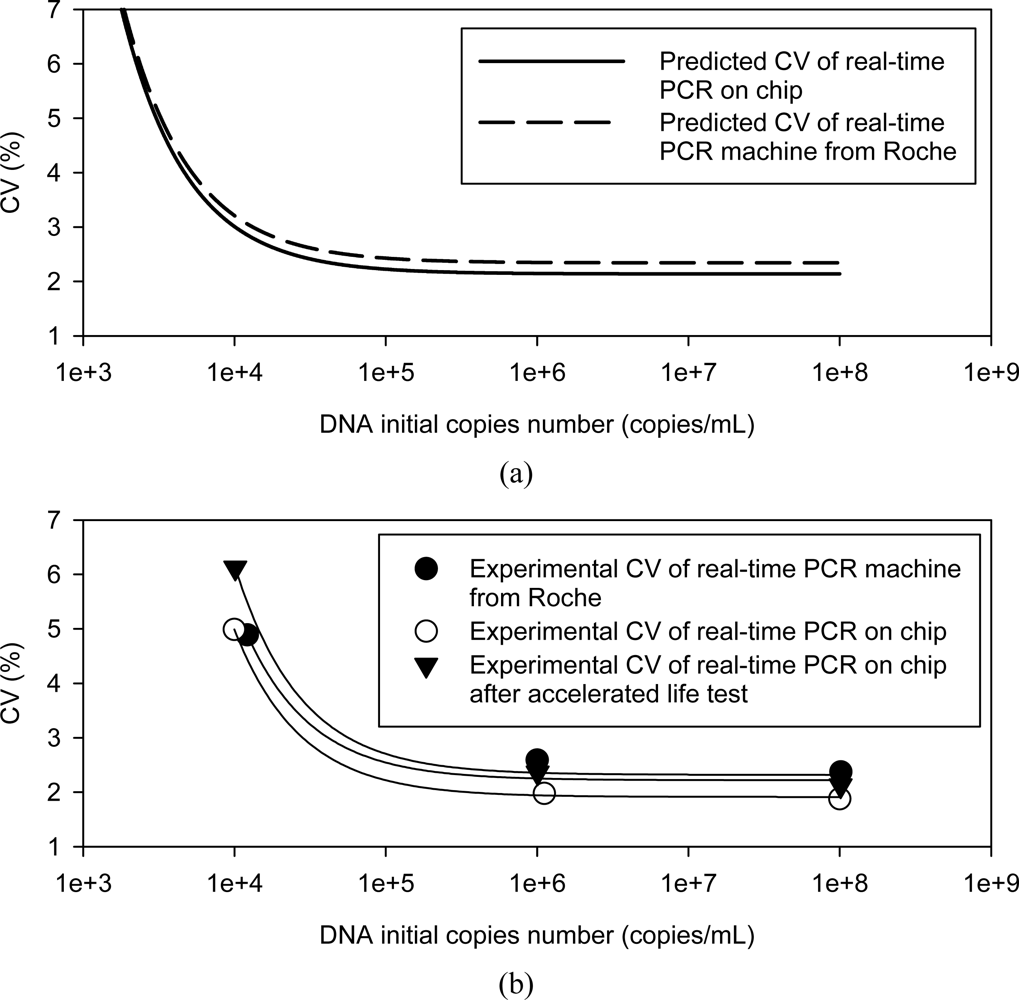
3.3. Accelerated Life Test
4. Results and Discussion
5. Conclusions
Acknowledgments
References
- Wittwer, C.T.; Herrmann, M.G.; Moss, A.A.; Rasmussen, R.P. Continuous fluorescence monitoring of rapid cycle DNA amplification. BioTechniques 1997, 22, 130–138. [Google Scholar]
- Wittwer, C.T.; Ririe, K.M.; Andrew, R.V.; David, D.A.; Gundry, R.A.; Balis, U.J. The LightCycler: a microvolume multisample fluorimeter with rapid temperature control. Bio. Techniques 1997, 22, 176–181. [Google Scholar]
- Kubista, M.; Andrade, J.M.; Bengtsson, M.; Forootan, A.; Jonák, J.; Lind, K.; Sindelka, R.; Sjoback, R.; Sjogreen, B.; Strombom, L.; Stahlberg, A.; Zoric, N. The real-time polymerase chain reaction. Mol. Aspects. Med 2006, 27, 95–125. [Google Scholar]
- Lee, D.S.; Chen, C.S. Development of a temperature sensor array chip and a chip-based real-time PCR machine for DNA amplification efficiency-based quantification. Biosens. Bioelectron 2008, 23, 971–979. [Google Scholar]
- Cho, Y.K.; Kim, J.; Lee, Y.; Kim, Y.A.; Namkoong, K.; Lim, H.; Oh, K.W.; Kim, S.; Han, J.; Park, C.; Pak, Y.E.; Ki, C.S.; Choi, J.R.; Myeong, H.K.; Ko, C. Clinical evaluation of micro-scale chip-based PCR system for rapid detection of hepatitis B virus. Biosens. Bioelectron 2006, 21, 2161–2169. [Google Scholar]
- Xiang, Q.; Xu, B.; Li, D. Miniature real time PCR on chip with multi-channel fiber optical fluorescence detection module. Biomed. Microdevices 2009, 9, 443–449. [Google Scholar]
- Yu, H.; Zhou, G.; Chau, F.S.; Wang, S.; Lee, F. Novel polydimethylsiloxane (PDMS) based microchannel fabrication method for lab-on-a-chip application. Sens. Actuat. B Chem 2009, 137, 754–761. [Google Scholar]
- Csordasa, A.T.; Delwichea, M.J.; Barakb, J.D. Nucleic acid sensor and fluid handling for detection of bacterial pathogens. Sens. Actuators B Chem 2008, 134, 1–8. [Google Scholar]
- Elsholz, B.; Nitsche, A.; Achenbach, J.; Ellerbrok, H.; Blohm, L.; Albers, J.; Pauli, G.; Hintsche, R.; Wörl, R. Electrical microarrays for highly sensitive detection of multiplex PCR products from biological agents. Biosens. Bioelectron 2009, 24, 1737–1743. [Google Scholar]
- Fang, T.H.; Ramalingama, N.; Xian-Dui, D.; Ngin, T.S.; Xianting, Z.; Kuan, A.T.L.; Huat, E.Y.P.; Hai-Qing, G. Real-time PCR microfluidic devices with concurrent electrochemical detection. Biosens. Bioelectron 2009, 11, 2134–2136. [Google Scholar]
- Peng, H.; Zhang, L.; Soeller, C.; Travas-Sejdic, J. Conducting polymers for electrochemical DNA sensing. Biomaterials 2009, 30, 2132–2148. [Google Scholar]
- Taguchi, G. System of Experimental Design; Don, C., Ed.; UNIPUB/Krass International Publications: New York, NY, USA, 1987. [Google Scholar]
- System Identification Toolbox 7.3. Create linear and nonlinear dynamic models from measured input-output data. Available online: http://www.mathworks.com/products/sysid/ (accessed on 16 December 2009).
- Lee, D.S.; Wu, M.H.; Ramesh, U.; Lin, C.W.; Lee, T.M.; Chen, P.H. A novel real-time PCR machine with a miniature spectrometer for fluorescence sensing in a micro liter volume glass capillary. Sens. Actuat. B Chem 2004, 100, 401–410. [Google Scholar]
- ReliaSoft Corporation. 1998–2007. Available online: http://www.weibull.com/AccelTestWeb/acceltestweb.htm (accessed on 16 December 2009).
- The MathWorks experts. Available online: http://www.mathworks.com/programs/techkits/product_demo.html?eventid_online=523217001&eventid_live=523217024&s_cid=HP_FR_demos_scheduled/ (accessed on 16 December 2009).
- Director-Myska, A.E.; Pogozelski, W.K.; Lofts, R.S; Prasanna, P.G.S.; Hamel, C.J.C.; Blakely, W.F. Quantitative plasmid mixture analysis using the fluorogenic 5′-nuclease polymerase chain reaction assay. Environ. Mol. Mutagen 2001, 37, 147–154. [Google Scholar]
- Bubner, B.; Gase, K.; Baldwin, I.T. Two-fold differences are the detection limit for determining transgene copy numbers in plants by real-time PCR. BMC Biotechnol 2004. [Google Scholar] [CrossRef]
- Burns, M.J.; Valdivia, H.; Harris, N. Analysis and interpretation of data from real-time PCR trace detection methods using quantitation of GM soya as a model system. Anal. Bioanal. Chem 2004, 378, 1616–1623. [Google Scholar]
- Rutherford, G.; Tanurdzic, M.; Hasebe, M.; Banks, J.A. A systemic gene silencing method suitable for high throughput, reverse genetic analyses of gene function in fern gametophytes. BMC Plant Biol 2004, 4, 6. [Google Scholar]
- Toplak, N.; Okrslar, V.; Stani-Racman, D.; Gruden, K.; Zel, J. A high-throughput method for quantifying transgene expression in transformed plants with real-time PCR analysis. Plant Mol. Biol. Rep 2004, 22, 237–250. [Google Scholar]
- Weksberg, R.; Hughes, S.; Moldovan, L.; Bassett, A.S.; Chow, E.WC; Squire, J.A. A method for accurate detection of genomic microdeletions using real-time quantitative PCR. BMC Genomics 2005, 6, 180. [Google Scholar]
- Cankar, K.; Štebih, D.; Dreo, T.; Žel, J.; Gruden, K. Critical points of DNA quantification by real-time PCR–effects of DNA extraction method and sample matrix on quantification of genetically modified organisms. BMC Biotechnol 2006, 6, 37. [Google Scholar]
- Griffiths, M.L.; Barbagallo, R.P.; Keer, J.T. Multiple and simultaneous fluorophore detection using fluorescence spectrometry and partial least-squares regression with sample-specific confidence intervals. Anal. Chem 2006, 78, 513–523. [Google Scholar]
- Vandesompele, J.; Preter, K.D.; Pattyn, F.; Poppe, B.; Roy, N.V.; Paepe, A.D.; Speleman, F. Accurate normalization of real-time quantitative RT-PCR data by geometric averaging of multiple internal control genes. Genome Biol 2002, 3, 0034.1–0034.11. [Google Scholar]
- Ellison, S.L.R.; English, C.A.; Burns, M.J.; Keer, J.T. Routes to improving the reliability of low level DNA analysis using real-time PCR. BMC Biotechnol 2006, 6. [Google Scholar]
- Foti, N.; Onori, R.; Donnarumma, E.; Santis, B.D.; Miraglia, M. Real-time PCR multiplex method for the quantification of Roundup Ready soybean in raw material and processed food. Eur. Food Res. Technol 2006, 222, 209–216. [Google Scholar]
- Mendy, M.E.; Kaye, S.; Sande, M. v.d.; Rayco-Solon, P.; Waight, P.A.; Shipton, D.; Awi, D.; Snell, P.; Whittle, H.; McConkey, S.J. Application of real-time PCR to quantify hepatitis B virus DNA in chronic carriers in the Gambia. Virol. J 2006, 3, 23. [Google Scholar]
- Qin, L.X.; Beyer, R.P.; Hudson, F.N.; Linford, N.J.; Morris, D.E.; Kerr, K.F. Evaluation of methods for oligonucleotide array data via quantitative real-time PCR. BMC Bioinformatics 2006, 7, 23. [Google Scholar]
- Ben-Dov, E.; Brenner, A.; Kushmaro, A. Quantification of sulfate-reducing bacteria in industrial wastewater by real-time PCR using dsrA and apsA genes. Microb. Ecol 2007, 54, 439–451. [Google Scholar]
- Burns, M.J.; Valdivia, H. A procedural approach for the identification of sources of uncertainty associated with GM quantification and real-time quantitative PCR measurements. Eur. Food Res. Technol 2007, 226, 7–18. [Google Scholar]
- Geets, J.; Cooman, Md.; Wittebolle, L.; Heylen, K.; Vanparys, B.; Vos, P.D.; Verstraete, W.; Boon, N. Real-time PCR assay for the simultaneous quantification of nitrifying and denitrifying bacteria in activated sludge. Appl. Microbiol. Biotechnol 2007, 75, 211–221. [Google Scholar]
- Karlen, Y.; McNair, A.; Perseguers, S.; Mazza, C.; Mermod, N. Statistical significance of quantitative PCR. BMC Bioinformatics 2007, 8, 131. [Google Scholar]
- Smith, M.V.; Miller, C.R.; Kohn, M.; Walker, N.J.; Portier, C.J. Absolute estimation of initial concentrations of amplicon in a real-time RT-PCR process. BMC Bioinformatics 2007, 8, 409. [Google Scholar]
- Sivaganesan, M.; Seifring, S.; Varma, M.; Haugland, R.A.; Shanks, O.C. A Bayesian method for calculation real-time quantitative PCR calibration curves using absolute plasmid DNA standards. BMC Bioinformatics 2008, 9, 120. [Google Scholar]
- Mygind, T.; Birkelund, S.; Birkebæk, N.H.; Østergaard, L.; Jensen, J.S.; Christiansen, G. Detemination of PCR efficiency in chelex-100 purified clinical samples and comparison of real-time quantitative PCR and conventional PCR for detection of Chlamydia pneumonia. BMC Microbiol 2002, 2, 17. [Google Scholar]
- Perreard, L.; Fan, C.; Quackenbush, J.F. J; Mullins, M.; Gauthier, N.P.; Nelson, E.; Mone, M.; Hansen, H.; Buys, S.S.; Rasmussen, K.; Orrico, A.R.; Dreher, D.; Walters, R.; Parker, J.; Hu, Z.; He, X.; Palazzo, J.P.; Olopade, O.I.; Szabo, A.; Perou, C.M.; Bernard, P.S. Classification and risk stratification of invasive breast carcinomas using a real-time quantitative RT-PCR assay. Breast Cancer Res 2006, 8, 23. [Google Scholar]
- Tichopad, A.; Dzidic, A.; Pfaffl, M.W. Improving quantitative real-time RT-PCR reproducibility by boosting primer-linked amplification efficiency. Biotechnol. Lett 2002, 24, 2053–2056. [Google Scholar]
- Batsch, A.; Noetel, A.; Fork, C.; Urban, A.; Lazic, D.; Lucas, T.; Pietsch, J.; Lazar, A.; Schömig, E.; Gründemann, D. Simultaneous fitting of real-time PCR data with efficiency of amplification modeled as Gaussian function of target fluorescence. BMC Bioinformatics 2008, 9, 95. [Google Scholar]
- Safeukui, I.; Millet, P.; Boucher, S.; Melinard, L.; Fregeville, F.; Receveur, M.C.; Pistone, T.; Fialon, P.; Vincendeau, P.; Fleury, H.; Malvy, D. Evaluation of FRET real-time PCR assay for rapid detection and differentiation of Plasmodium species in returning travellers and migrants. Malar. J 2008, 7, 70. [Google Scholar]
- Spiess, A.N.; Feig, C.; Ritz, C. Highly accurate sigmoidal fitting of real-time PCR data by introducing a parameter for asymmetry. BMC Bioinformatics 2008, 9, 221. [Google Scholar]
- Takano, E.A.; Mitchell, G.; Fox, S.B.; Dobrovic, A. Rapid detection of carriers with BRCA1 and BRCA2 mutations using high resolution melting analysis. BMC Cancer 2008, 8, 59. [Google Scholar]
- Harms, G.; Layton, A.; Dionisi, H.; Gregory, I.; Garrett, V.; Hawkins, S.; Robinson, K.; Sayler, G. Real-time PCR quantification of nitrifying bacteria in a municipal wastewater treatment plant. Environ. Sci. Technol 2003, 37, 343–351. [Google Scholar]
- Alvarez, M.J.; Vila-Ortiz, G.J.; Salibe, M.C.; Podhajcer, O.L.; Pitossi, F.J. Model based analysis of real-time PCR data from DNA binding dye protocols. BMC Bioinformatics 2007, 8, 85. [Google Scholar]
- Chang, H.W.; Cheng, C.A.; Gu, D.L.; Chang, C.C.; Su, S.H.; Wen, C.H.; Chou, Y.C.; Chou, T.C.; Yao, C.T.; Tsai, C.L.; Cheng, C.C. High-throughput avian molecular sexing by SYBR green-based real-time PCR combined with melting curve analysis. BMC Biotechnol 2008, 8, 12. [Google Scholar]
- Mamo, S.; Gal, A.B.; Bodo, S.; Dinnyes, A. Quantitative evaluation and selection of reference genes in mouse oocytes and embryos cultured in vivo and in vitro. BMC Dev. Biol 2007, 7, 14. [Google Scholar]
- Köppel, R.; Ruf, J.; Zimmerli, F.; Breitenmoser, A. Multiplex real-time PCR for the detection and quantification of DNA from beef, pork, chicken and turkey. Eur. Food Res. Technol 2008, 227, 1199–1203. [Google Scholar]
- Pitfalls in transfer of diagnostic duplex PCR assays between technical platforms. The PCR reference. Artus Gmbh: Hamburg, Germany, 2007.


| System schematic drawing | Instrument model | ||||
|---|---|---|---|---|---|
| ABI PRISM 7000/7700/7900 | Bio-Rad iCycler series | Roche Light-Cycler Ver. 1/2 | Rotor-Gen 3000 | ||
| Thermal cycler | |||||
| Control scheme | Heating block | Heating block | Air cycling | Air cycling | |
| Max. Heating/Cooling rate (°C/sec) | 1.5/ 1.5 | 3.3/ 2.0 | Ver.1 3.7 / 2.3 | Ver.2 3.3 / 3.0 | 2.5/ 2.5 |
| Temp. control Accuracy (°C) | ±0.25 | ±0.3 | ±0.3 | ±0.3 | ±0.25 |
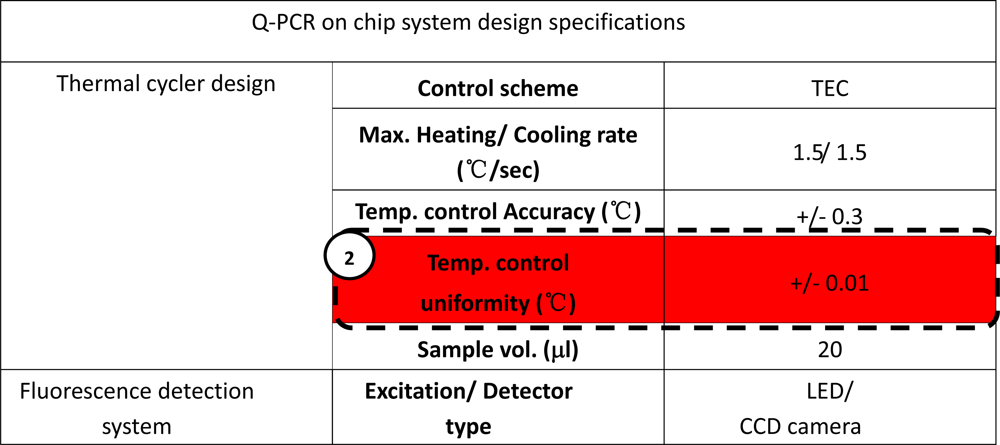
| Temp. control uniformity (°C) | ±0.5 | ±0.4 | ±0.2 | ±0.15 | ±0.01 |
| Sample vol. (μL) | 20–100 | 10–200 | 20 | 10–100 | 10–100 |
| Fluorescence detection system | |||||
| Excitation/Detector type | White light lamp/ CCD camera | LED/ Array CCD | LED/ Photo-diode | LED/ PMT | |
| Detector sensitivity | As low as to 10−4 lux | As low as to 10−4 lux | 100 photons | Q.E to 30% | |
| S/N ratio (dB) | 53 | 50 | 32 | 60 | |
| Dark noise | 25 eV for silicon based chip | 25 eV for silicon based chip | 65 eV for silicon base device | 1–3 eV | |
| Mechanical design | |||||
| Machine motion part | Sliding filters holder | Sliding filters holder | Carousel sample holder | Carousel sample holder | |
| Control error amount | 0.01 deg back slash | 0.01 deg back slash | 0.1 deg position error | 0.1 deg position error | |
| 1 | 2 | 3 | 4 | 5 | |||||
|---|---|---|---|---|---|---|---|---|---|
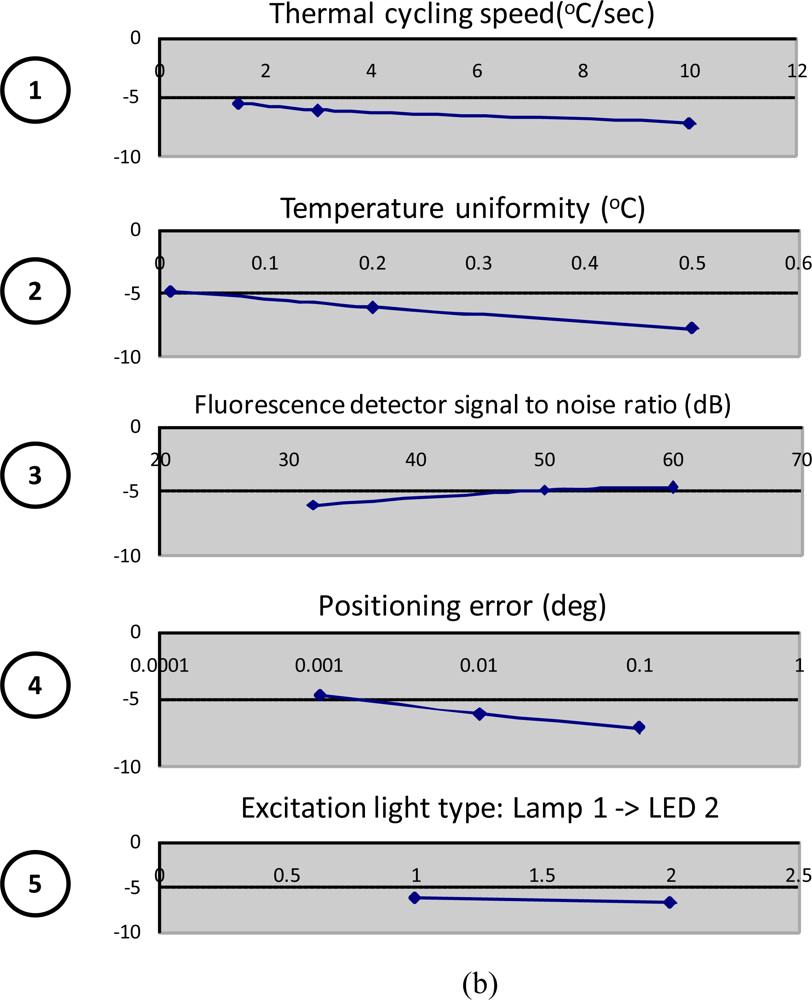
| Design factors | Thermal cycling speed (Max heating/ cooling rate) | Temperature control uniformity | Fluorescence detector noises | Optical/ mechanic interferences | Excitation light variation | ||||
| Influence on noise terms | DNA amplification efficiency, η | Chemical reaction instability, ζ | Fluorescence detection noise | ||||||
| Design spec. | 20/10 °C/sec (Micro heater chip) 1.5/ 1.5 °C/sec (ABI spec) 3.3/ 2.0 °C /sec (Bio-Rad) 3.3/ 3.0 °C /sec (Roche) 2.5/ 2.5 °C /sec (Rotor-Gene) | 0.01 °C (TEC can achieve this limit and it is also the Rotor-Gene spec) 0.15–0.2 °C (Roche spec) 0.4 °C (Bio-Rad) 0.5 °C (ABI) | 32 dB Photodiode (Roche spec) 50 dB CCD (Bio-Rad) 53 dB CCD camera, (ABI) 60 dB PMT (Rotor-Gene) | 0.001 No moving part design (on chip system) 0.01 (Sliding filters, ABI, Bio-Rad) 0.1 (Carousel type sample holder, Roche, Rotor-Gene) | 3% (Lamp by ABI) 5% (LED by Bio-Rad, Roche and Rotor-Gene) | ||||
| The induced noise levels | Amplification efficiency variation | Corresponding Design Spec | Damping coefficient change | Spec | Noise level | Spec | Noise level | Spec | Noise level |
| ∼ 0.98 ± 0.1 | 20/ 10 °C /sec | ζ ∼ 2 ± 0.01 | 0.01 °C | Base line | 32 dB detector | X 0.01 | No moving parts | +0% LED | |
| ∼ 0.97 ± 0.2 | 3.3/ 3.0 °C /sec | ζ ∼ 2 ± 0.2 | 0.2 °C | −5 dB | 50 dB detector | X 0.1 | Sliding filter | −2% Lamp | |
| ∼ 0.96 ± 0.3 | 1.5/ 1.5 °C /sec | ζ ∼ 2 ± 0.5 | 0.5 °C | −13 dB | 60 dB detector | X 1 | Carousel sample holder | ||
©2010 by the authors; licensee Molecular Diversity Preservation International, Basel, Switzerland. This article is an open access article distributed under the terms and conditions of the Creative Commons Attribution license (http://creativecommons.org/licenses/by/3.0/)
Share and Cite
Lee, D.-S. Real-time PCR Machine System Modeling and a Systematic Approach for the Robust Design of a Real-time PCR-on-a-Chip System. Sensors 2010, 10, 697-718. https://doi.org/10.3390/s100100697
Lee D-S. Real-time PCR Machine System Modeling and a Systematic Approach for the Robust Design of a Real-time PCR-on-a-Chip System. Sensors. 2010; 10(1):697-718. https://doi.org/10.3390/s100100697
Chicago/Turabian StyleLee, Da-Sheng. 2010. "Real-time PCR Machine System Modeling and a Systematic Approach for the Robust Design of a Real-time PCR-on-a-Chip System" Sensors 10, no. 1: 697-718. https://doi.org/10.3390/s100100697