Article

Why Did the Bear Cross the Road? Comparing the Performance of Multiple Resistance Surfaces and Connectivity Modeling Methods

1
US Forest Service, Rocky Mountain Research Station, 2500 S Pine Knoll Dr, Flagstaff, AZ 86001, USA
2
Department of Fish, Wildlife, and Conservation Biology, Colorado State University, Fort Collins, CO 80523-1474, USA
3
Division of Biological Science, University of Montana, Missoula, MT 59801, USA
*
Author to whom correspondence should be addressed.
These authors contributed equally to this work.
Diversity 2014, 6(4), 844-854; https://doi.org/10.3390/d6040844
Submission received: 7 November 2014 / Revised: 8 December 2014 / Accepted: 15 December 2014 / Published: 18 December 2014
(This article belongs to the Special Issue Biodiversity Loss & Habitat Fragmentation)

Abstract

:
There have been few assessments of the performance of alternative resistance surfaces, and little is known about how connectivity modeling approaches differ in their ability to predict organism movements. In this paper, we evaluate the performance of four connectivity modeling approaches applied to two resistance surfaces in predicting the locations of highway crossings by American black bears in the northern Rocky Mountains, USA. We found that a resistance surface derived directly from movement data greatly outperformed a resistance surface produced from analysis of genetic differentiation, despite their heuristic similarities. Our analysis also suggested differences in the performance of different connectivity modeling approaches. Factorial least cost paths appeared to slightly outperform other methods on the movement-derived resistance surface, but had very poor performance on the resistance surface obtained from multi-model landscape genetic analysis. Cumulative resistant kernels appeared to offer the best combination of high predictive performance and sensitivity to differences in resistance surface parameterization. Our analysis highlights that even when two resistance surfaces include the same variables and have a high spatial correlation of resistance values, they may perform very differently in predicting animal movement and population connectivity.

1. Introduction

As organisms move through landscapes, they respond to biotic and abiotic factors to maximize access to resources and mates, while minimizing fitness costs. The structure of the landscape will interact with the movement response of organisms to affect connectivity [1,2]. The connectivity of populations is critical, both for maintaining regional populations and for species to shift their geographic range in response to climate change [3]. Increasing recognition of the importance of connectivity to population persistence, combined with the development of new algorithms, fast computers and user-friendly software [4], has led to a proliferation of research on population connectivity [5] and conservation actions applying this knowledge across broad landscapes [6,7].
The Greek word, συνοπτικός (synopticos), means seeing everything together. A synoptic view is one that simultaneously integrates all elements. Most past applications of population connectivity modeling have been based on assessments of movement cost or corridor routes between a few select locations [6,7]. For example, least cost path modeling identifies the single, lowest cost route through a landscape between two points [8]. However, effective conservation often depends on understanding the connectivity of every location simultaneously to all other locations, in a synoptic view.
There is obvious advantage in adopting synoptic perspectives on population connectivity, but how can they be achieved? Factorial least cost path analysis [9] is a spatially synoptic form of least cost path analysis in which least cost paths are calculated for thousands or millions of combinations of locations across the landscape. These paths are then summed to show the density of least cost crossing any point in the study area. A second synoptic approach to landscape connectivity is cumulative resistant kernel modeling [10], which calculates the expected density of dispersing individuals in each pixel in the landscape.
These synoptic connectivity modeling approaches have several advantages in assessing population connectivity. First, they provide prediction and mapping of expected functional connectivity for every pixel in the study area, rather than only for a few selected ‘linkage zones’ or source locations [11]. Second, factorial least cost path and resistant kernel analysis can evaluate how different population sizes, dispersal abilities and vagilities will affect connectivity through the specification of dispersal thresholds [12]. However, despite their theoretical advantages, synoptic approaches have not been widely used, in part because these new methods are substantially more computationally intensive than traditional approaches. In addition, little is known about how well synoptic methods perform in predicting organism movement.
Most assessments of population connectivity are based on applying connectivity models, synoptic or otherwise, to resistance surfaces [5,6,7,13]. Resistance surfaces depict the unit cost of traversing each location on the map. The spatial pattern of resistance determines the location of least cost paths, corridors and the extent of resistant kernels. Therefore, an essential part of assessing the performance of different connectivity modeling approaches would include evaluation of how well alternative resistance surfaces reflect the functional cost of movement for an organism of interest. The vast majority of published resistance surfaces used in connectivity assessments have been derived from unvalidated expert opinion [5], and there have been few assessments of the performance of resistance surfaces in predicting organism movement with data independent of that used in parameterizing them (see [14,15,16]).
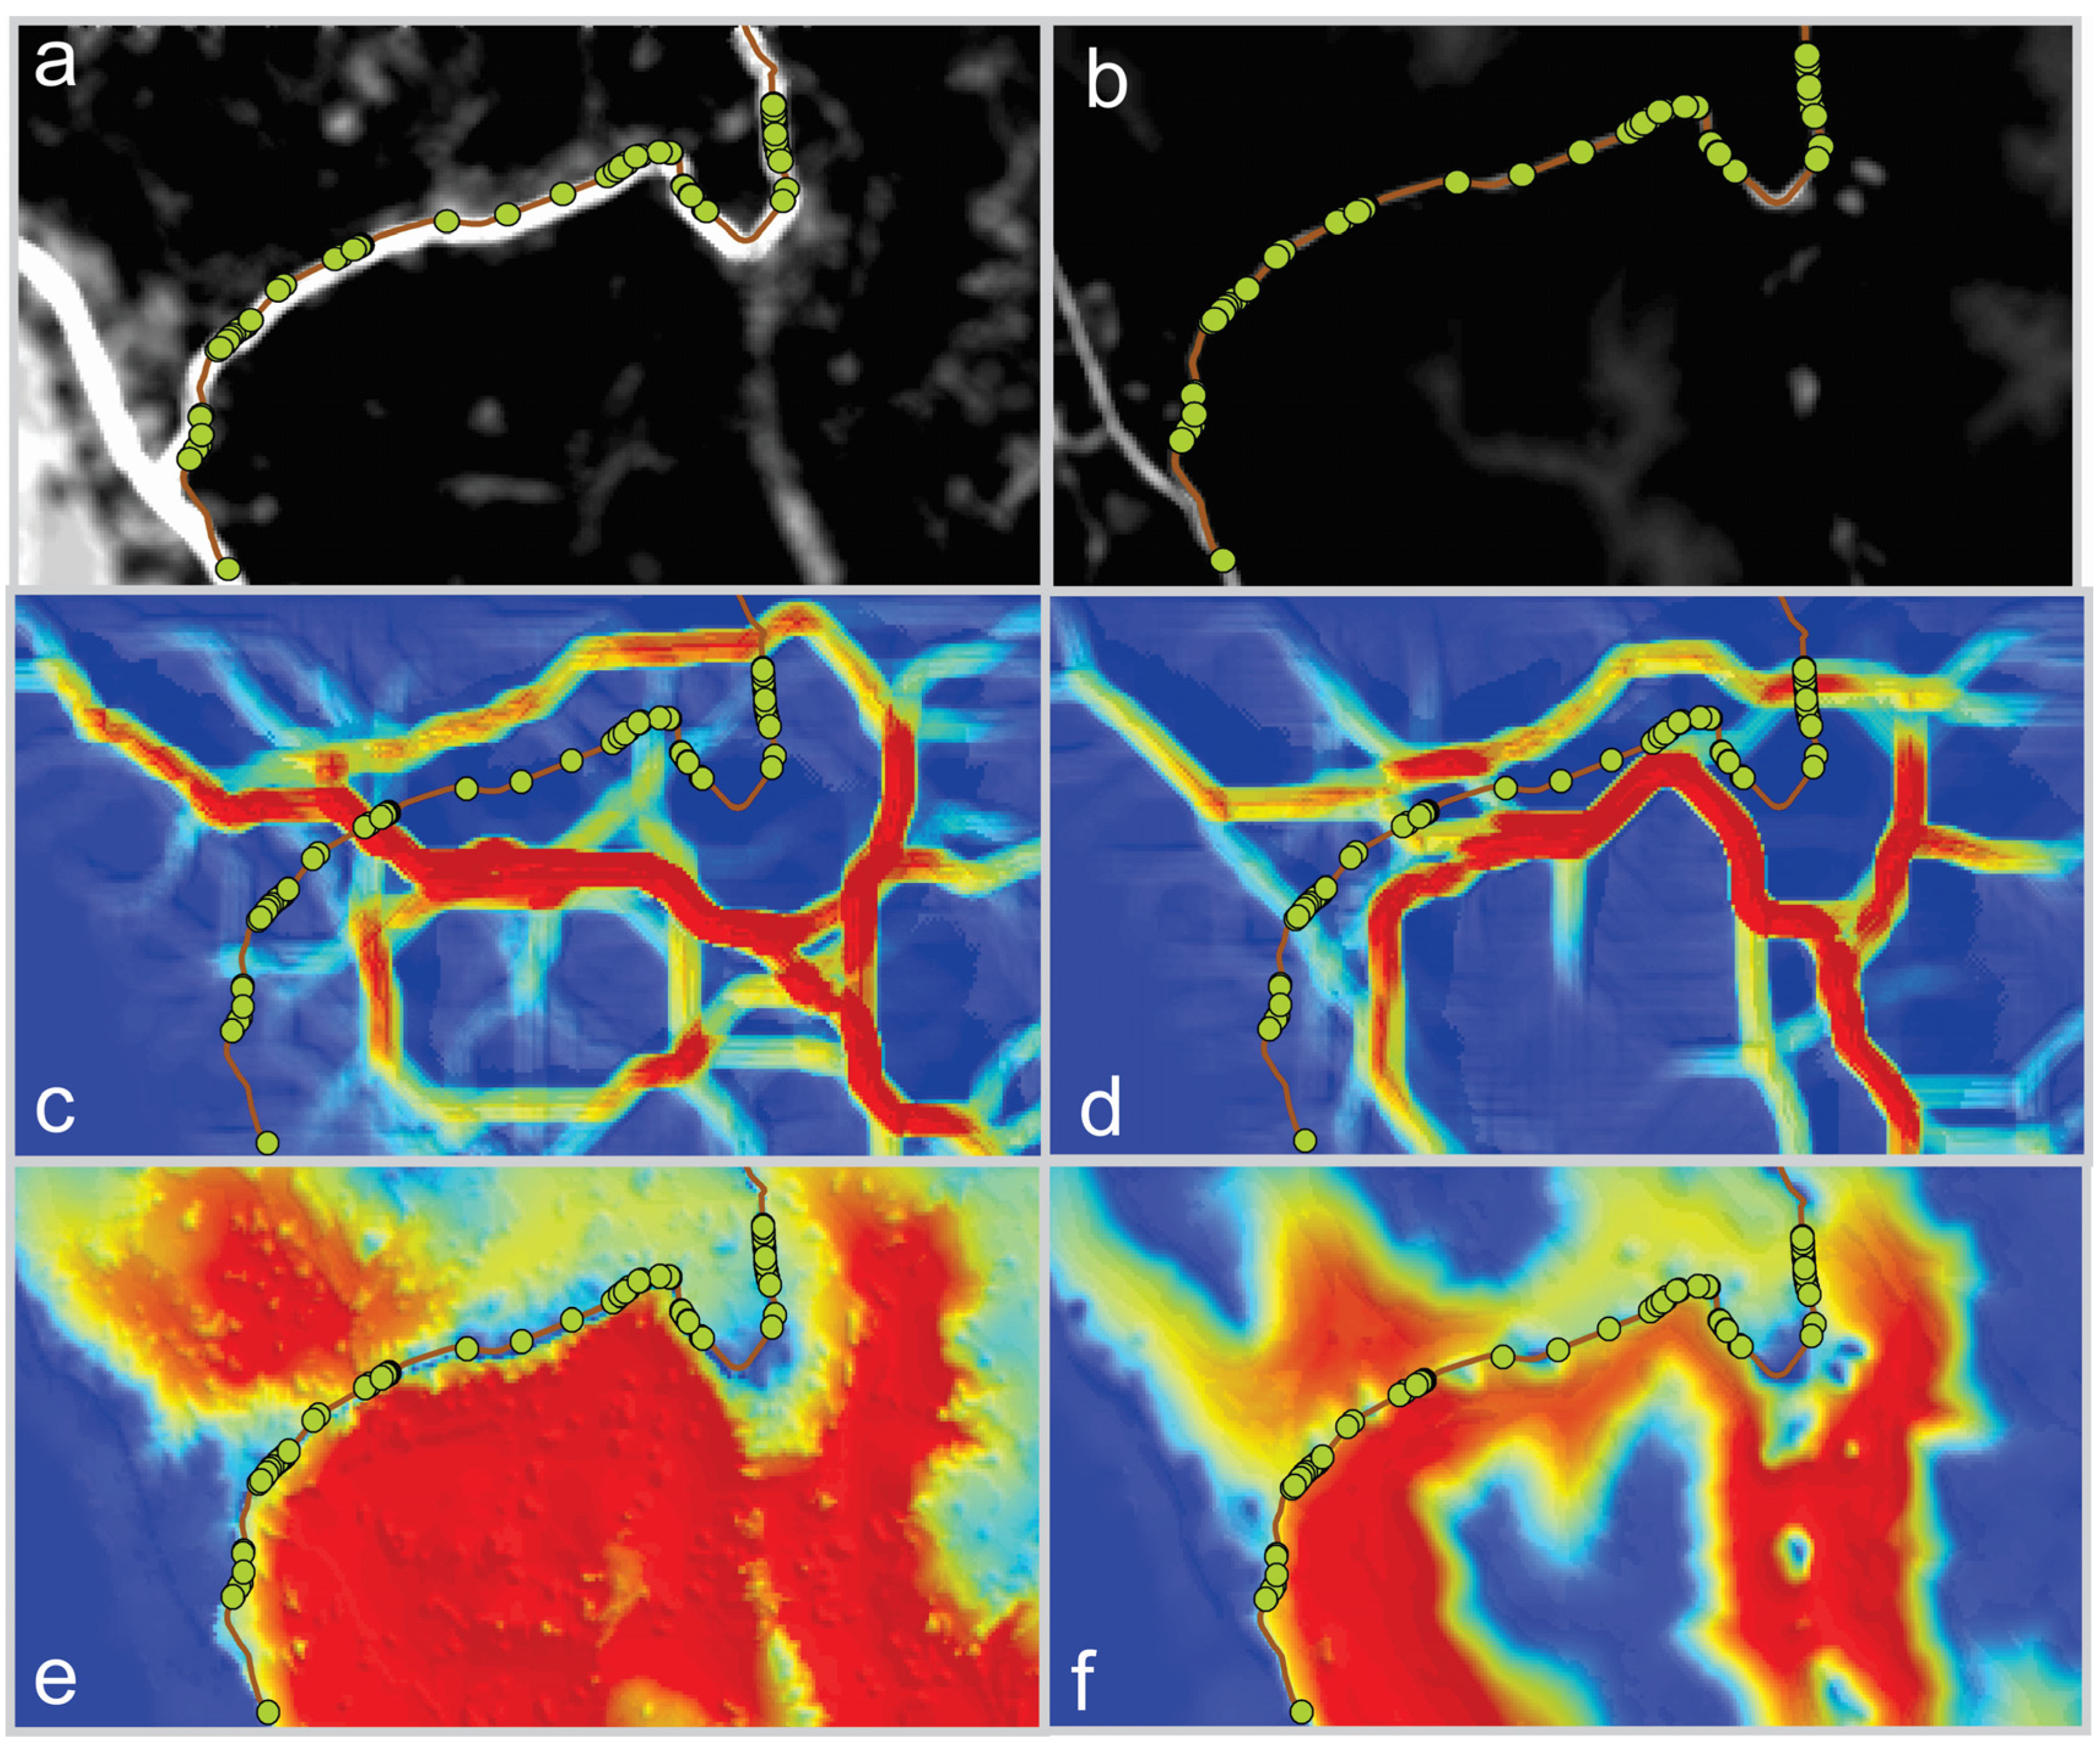
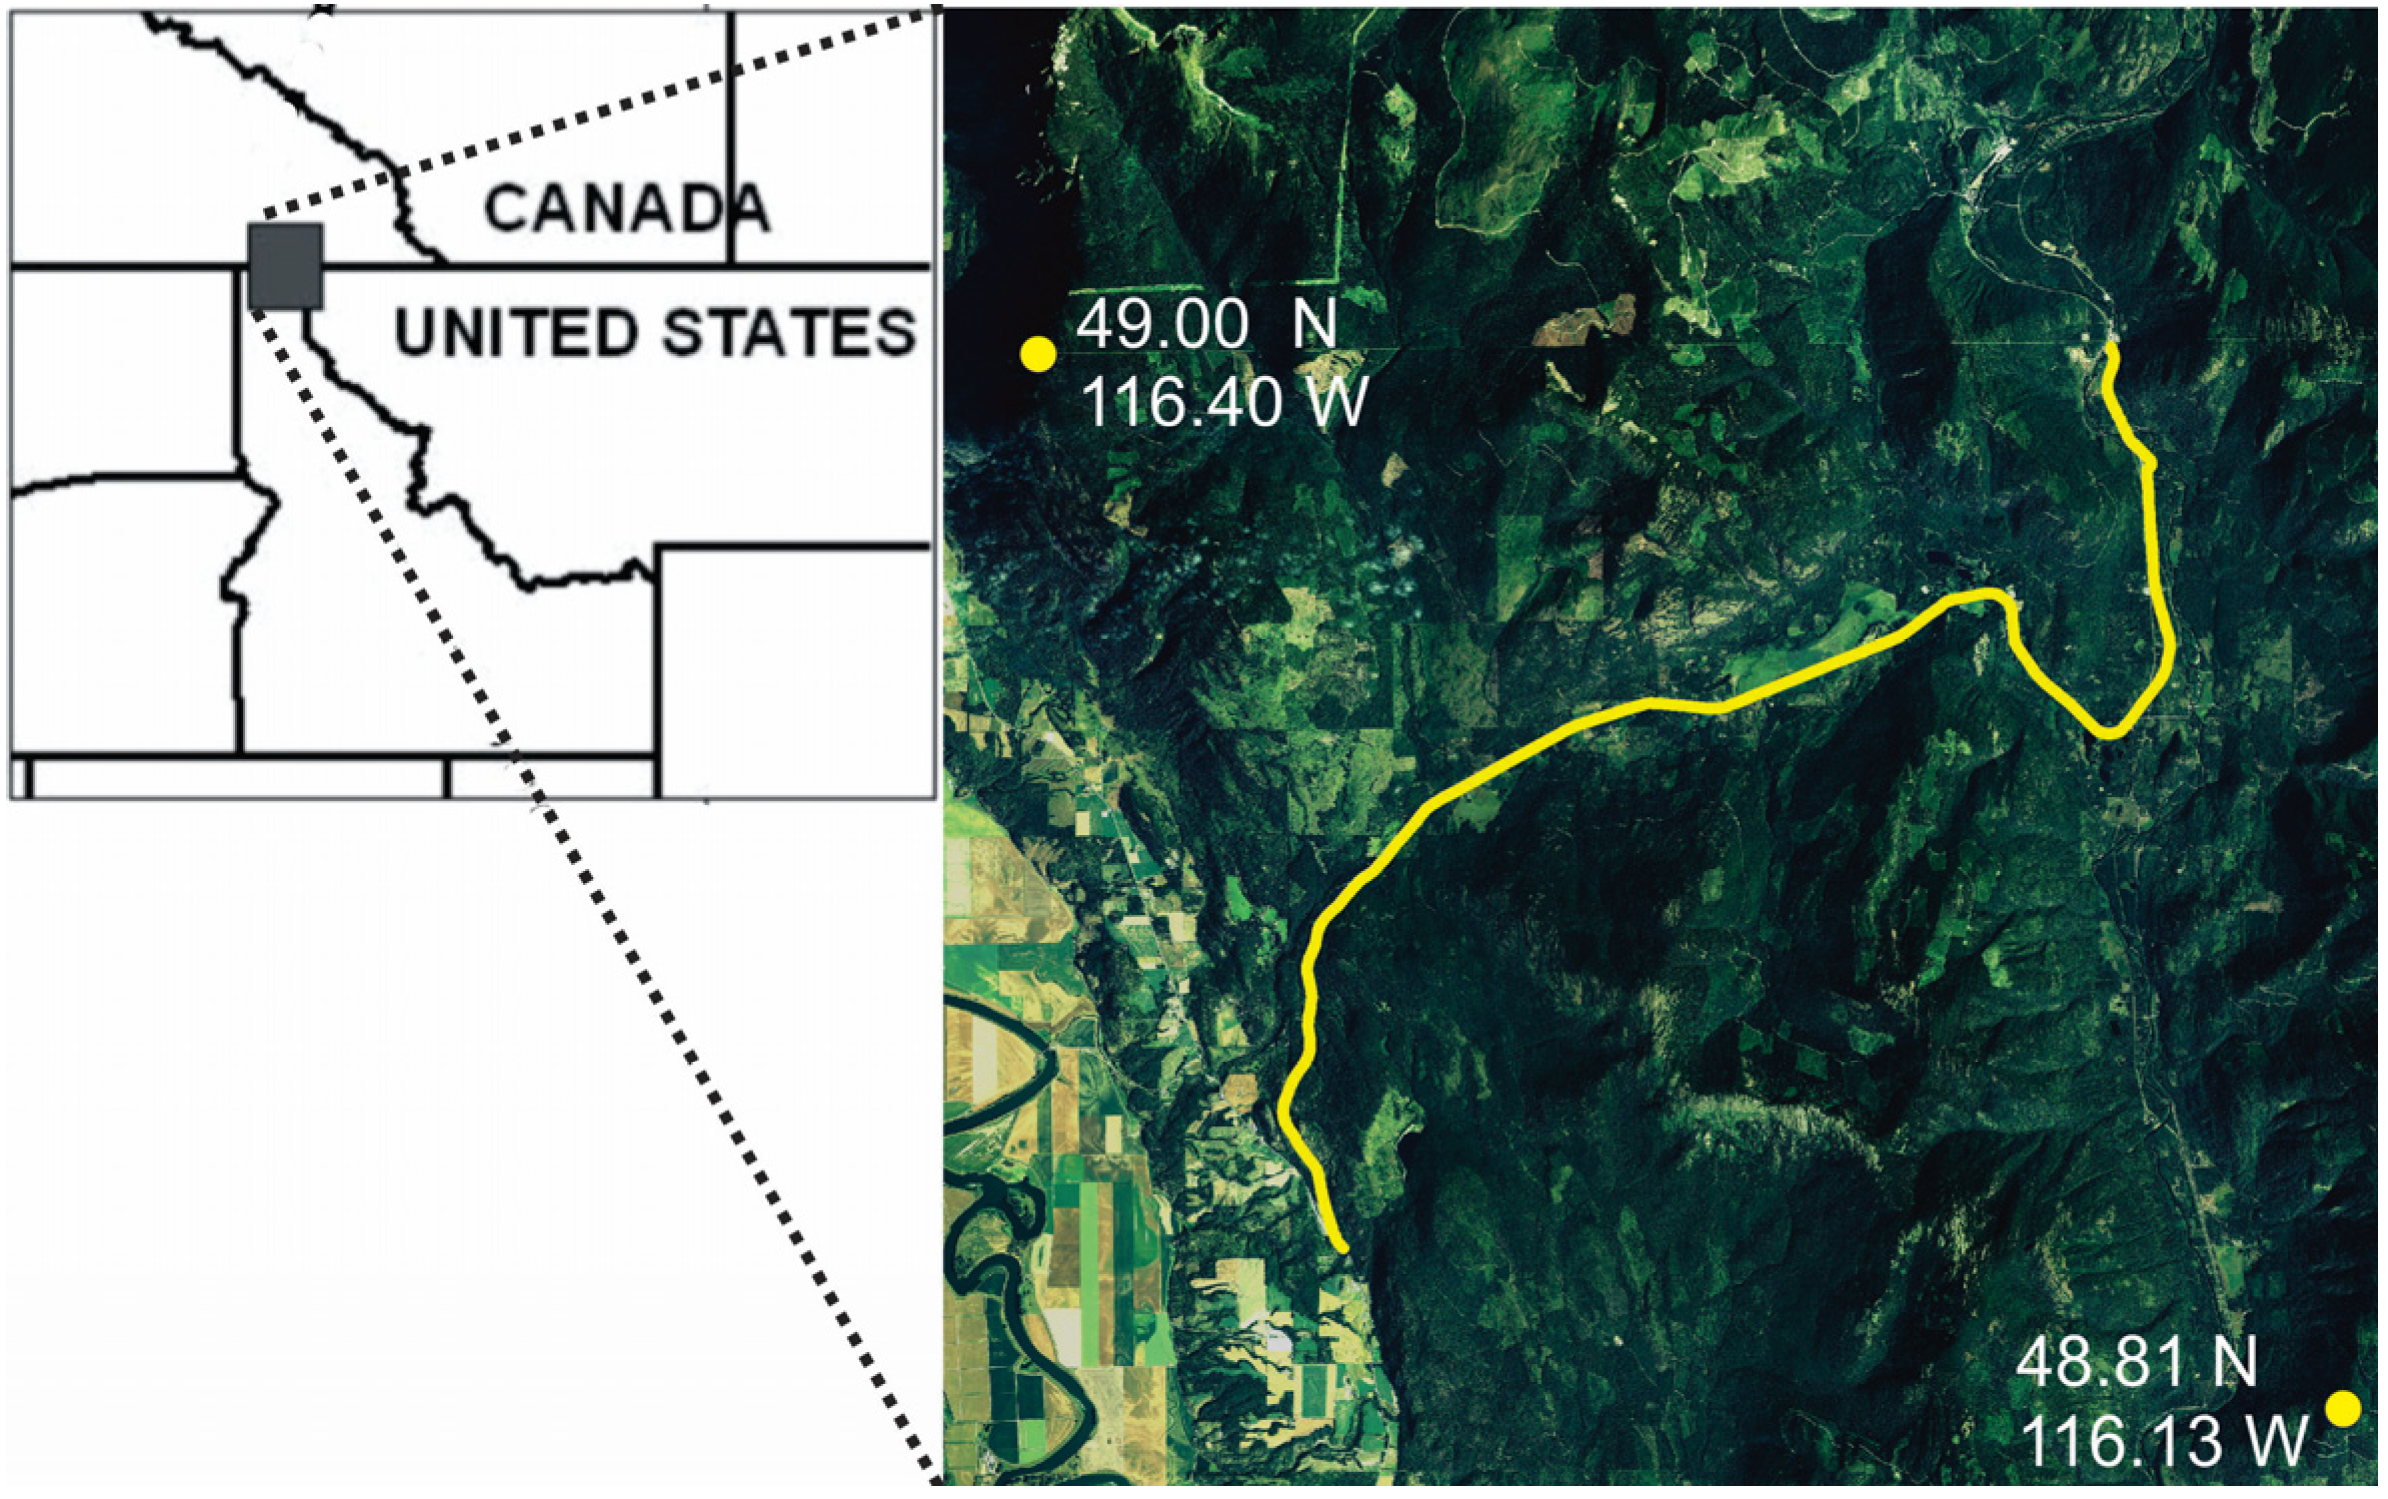
In this paper, we evaluate the performance of synoptic connectivity modeling approaches and alternative resistance models in predicting highway crossing locations of American black bear (Ursus americanus) in northern Idaho, USA. Our specific goals are to: (1) evaluate the relative performance of resistance surfaces derived from (a) individual-based landscape genetic modeling and (b) path-level modeling of landscape resistance based on GPS movement data; and (2) evaluate the relative performance of one local (neighborhood average landscape resistance) and two synoptic (factorial least cost path, resistant kernel) approaches to predicting connectivity across these two resistance surfaces. We hypothesize that (H1) the resistance surface derived from movement data will outperform the surface derived from gene flow in predicting bear highway crossings, that (H2) synoptic measures of connectivity would perform better than local landscape resistance and (H3) that the resistant kernel would be less sensitive to differences between resistance surfaces than factorial least cost paths.

2. Experimental Section

2.1. Study Area

The study area consists of approximately 1500 km2 in the Purcell Mountains of northern Idaho, USA (Figure 1). The topography is mountainous, with steep ridges and narrow valleys. Elevation ranges from 700 m to 2400 m. The area is heavily forested, with Abies lasiocarpa (subalpine fir) and Picea engelmannii (Engelmann spruce) codominant above 1300 m and a diverse mixed conifer forest dominating below 1300 m. For a further description of the study area, see [17].
Figure 1. Study area orientation map. The study area is approximately 1,500 square kilometers in the Purcell Mountains of northern Idaho. This study focuses on the section of U.S. Highway 95 from the junction of Highway 1 in Idaho to the Canadian border (yellow line).
Diversity 06 00844 g001

2.2. Bear Highway Crossing Data

Bears were trapped from June to mid-August in 2004–2006 in the Purcell Mountain range of northern Idaho and fitted with Lotek 3300L GPS programmed to record the location every 20 min from April (den emergence) to November (den entrance; Lewis et al. 2011). The Brownian bridge movement model [18] was used to identify 56 highway crossing events for black bears along U.S. Highway 95 [17].

2.3. Resistance Models

2.3.1. Resistance Model 1, Derived from Landscape Genetic Analysis

Cushman et al. [19] evaluated 110 hypotheses concerning landscape resistance to gene flow for American black bears in the study area. They found that gene flow of black bears is facilitated by high forest cover at middle elevations, with avoidance of non-forest, agriculture and residential development and equivocal response to crossing roads. The landscape resistance model produced by [19] was used in this study as one of the two resistance models selected for comparison (Figure 2b).
Figure 2. The six connectivity analyses comprised of a factorial combination of the type of resistance map used (genetic based, down the first column; or movement based, down the second column) and the type of connectivity model (average neighborhood resistance, across first row; factorial least cost paths, across second row; cumulative resistant kernels, across third row). Green dots are the locations of 56 highway crossings by black bear.
Diversity 06 00844 g002

2.3.2. Resistance Model 2, Derived from Path-Selection Function Modeling

The second resistance model was produced by applying path selection functions to evaluate the degree of selection or avoidance of landscape features [15] (Figure 2a). Cushman and Lewis [15] used conditional logistic regression [20] to evaluate 15 landscape resistance models, ranked these models by AICc (Akaike information criterion corrected for small sample size) and used model averaging based on AICc weights to produce a final model. They found that spring (March through July) movement path selection was strongly facilitated by forest cover at middle elevations and resisted by roads and human development. We use their spring season model as the second resistance surface evaluated in this analysis.

2.4. Connectivity Modeling Approaches

We predicted landscape connectivity for each of the two resistance models above with the following three connectivity approaches.

2.4.1. Connectivity Approach 1, Neighborhood Average Landscape Resistance

Our first connectivity modeling approach is based on the hypothesis that animal movement is primarily driven by local resistance of the landscape and is not strongly affected by the broader pattern of resistance in the landscape. To implement this approach, we calculated the focal mean of landscape resistance for each of the two alternative resistance surfaces within a 500-m radius circle centered on the highway. This produced focal average resistance values along the highway that were then compared with the locations of actual bear crossing points (Figure 2a,b).

2.4.2. Connectivity Approach 2, Factorial Least Cost Path Modeling

The second connectivity modeling method is factorial least cost path modeling [9]. We modeled movement from 1082 source locations distributed at 1-km spacings across all forested areas in the study area. We used the landscape connectivity modeling software UNICOR [4] to compute the least cost paths among all pairs of source points (584,821 individual least cost paths). We applied a 1-km width Gaussian smoothing kernel [4] and summed the smoothed paths to produce a raster grid in which the cell values represent the number of cost paths traversing that cell, which is an indication of “corridor strength” [11] (Figure 2c,d).

2.4.3. Connectivity Approach 3, Cumulative Resistant Kernel Modeling

The final connectivity modeling approach is cumulative resistant kernel modeling [10]. The resistant kernel approach to connectivity modeling is based on least cost dispersal from a set of source locations, in our case, the 1,082 points at 1-km spacings within forested areas, as described above. The model calculates the expected density of dispersing individuals in each pixel of the landscape, given the dispersal ability of the species, the nature of the dispersal function and the resistance of the landscape [10]. We used the range of significant genetic autocorrelation of the bear population [19] as the kernel width. We used UNICOR [4] to calculate the resistant kernels for each source point and to sum them to give the total expected density at each pixel. The values in the resulting surface reflect the expected density of dispersing organisms at any location in the landscape [11] (Figure 2e,f).

2.5. Evaluating Congruence between Predicted and Observed Bear Crossing Points

We used a spatial randomization testing procedure to evaluate the congruence between the locations where bears were observed to cross the highway and predicted connectivity in each combination of the resistance surface and connectivity model. Spatial randomization testing of this kind is recommended in cases such as this, where there is spatial dependence among observations, and produces an unbiased estimate of the probability of the observed outcome given the data [21].
The analysis compares the median value of predicted connectivity for the 56 actual bear crossing locations with the distribution of median values of 1 × 10⁷ random samples of 56 locations along the highway within the study area. For each combination resistance surface and connectivity modeling approach, we calculated the ranking of the median of observed values within the distribution of the medians of the 1 × 10⁷ random samples. This ranking produces the probability of the outcome, given the data, and provides a non-parametric test of the hypothesis that actual highway crossing locations are unrelated to the predicted connectivity for each combination of resistance surface and modeling approach.

3. Results

Consistent with our first hypothesis, we found that the resistance map produced from the movement data of black bears in this study area [15] greatly outperformed the resistance map produced from the analysis of genetic differentiation [19] across all methods of connectivity modeling (Table 1). Specifically, for each of the connectivity modeling methods, predicted connectivity based on the Cushman and Lewis [15] resistance model was higher at the locations of actual bear highway crossings than at randomly selected locations along the highway. In contrast, connectivity predictions based on landscape genetic analysis [19] were not significantly associated with bear crossing locations in any of the methods.
Table 1. Proportion of instances, of 1 × 10⁻⁷ random samples, where a random draw of 56 locations along U.S. Highway 95 in the study area produced a median connectivity value higher than the median connectivity value of the 56 actual black bear crossing locations for the two resistance maps across the three connectivity modeling approaches. The connectivity maps are a combination of the type of resistance surface (genetic based or movement based) and the type of connectivity modeling approach (average neighborhood resistance, factorial least cost path and resistant kernel).
Connectivity ApproachGeneticMovement
Average Neighborhood Resistance0.2155.63 × 10−5
Factorial Least Cost Paths0.9993 × 10−7
Resistant Kernel0.3732.5 × 10−6
Consistent with our second hypothesis, the synoptic methods, factorial least cost paths and cumulative resistant kernels performed best at predicting the location of actual highway crossing events (Table 1). For the movement-derived resistance surface, 3, 25 and 563 of the 1 × 10⁷ random samples produced a median connectivity value as high as observed for the actual crossing locations in the factorial least cost path, resistant kernel and local landscape resistance connectivity methods, respectively. This indicates that the factorial least cost path approach had 8.3-times and 187.7-times fewer permutations with a median value less than the observed median in the kernel and local resistance and circuit approaches, respectively, for the movement-derived resistance surface. Conversely, for the genetics-derived resistance surface, 99.9%, 37.3% and 21.5% of the random samples had a median connectivity value higher than the actual crossing locations in the least cost path, kernel and focal resistance methods, respectively.
We produced a measure of sensitivity to the differences between resistance surfaces by calculating the proportional change in the number of permutations producing a median value greater than that observed in the actual crossing locations between the two resistance surfaces for each method. Based on this, and consistent with Hypothesis 3, we found that the factorial least cost path was very highly sensitive to differences between resistance surfaces (change from 3 × 10⁻⁷ to 99% of permutations less than the median resistance of actual crossings) and that local landscape resistance and resistant kernels were relatively insensitive to differences between the two resistance surfaces.

4. Discussion

Our analysis is among the first to simultaneously evaluate the performance of multiple resistance surfaces and connectivity modeling approaches in predicting independent animal movement data. Our first hypothesis was that a resistance surface derived directly from movement data would outperform a resistance surface produced from the analysis of genetic differentiation. We based this on the expectation that the landscape factors that govern movement may differ to some degree from those that govern gene flow. Gene flow in animals, such as the black bear, is effected through mating and dispersal events, which are related to movement, but are particular and rare kinds of movement. Thus, a resistance model optimizing the factors related to gene flow [19] may not ideally reflect the factors that drive the behavioral decisions of individuals in selecting crossing locations. Conversely, resistance surfaces derived directly from movement data [15] may be expected to more effectively predict the specific movement decisions made by individual bears. Our results dramatically demonstrate this, with extremely high performance of all four connectivity modeling methods when applied to the movement data-derived resistance surface and universally poor performance when applied to the landscape genetic-derived surface.
Cushman and Lewis [15] compared these two resistance surfaces and noted that they are heuristically similar, containing the same factors with the same qualitative relationships between landscape features and resistance. They further noted a high correlation between the pixel values of the two surfaces and argued that movement data and genetic differentiation both supported the conclusion that landscape resistance for American black bears in the Rocky Mountains is facilitated by middle elevation forest and resisted by roads and human land uses. Our analysis, in contrast, suggested that these surfaces in fact differ substantially in terms of their predictions of functional connectivity across the study area in each of three connectivity modeling approaches. This suggests that even when two resistance surfaces include the same variables and have a high spatial correlation of resistance values, they may perform very differently in predicting animal movement and population connectivity.
Our second hypothesis proposed that synoptic connectivity modeling approaches, such as factorial least cost paths and resistant kernels, would outperform a local measure of population connectivity based on the average landscape resistance within a local neighborhood. We based this expectation on the idea that the movement path choices of individual bears, including where they cross a highway, would be influenced by the synoptic pattern of connectivity across a broad landscape and not just by the local landscape resistance at a crossing location. Consistent with this expectation, for the movement-derived resistance surface, two of the synoptic methods (cumulative factorial least cost path and cumulative resistant kernel) outperformed local landscape resistance, with factorial least cost paths apparently performing best. This is an important finding, as most applications of connectivity modeling in conservation biology have used local information or non-synoptic connectivity methods to predict movement corridors [6,11]. Our results suggest that synoptic methods (such as factorial paths and kernels) are best able to predict actual organism movement, since population connectivity is an emergent phenomenon driven by the cumulative influences of landscape structure throughout the population. Furthermore, factorial least cost path modeling best predicted crossing locations, likely because this method emphasizes optimal movement routes, and animals choosing locations to cross a potentially dangerous obstacle, such as a highway, are likely to select the routes that minimize risk. Consistent with this conclusion, Lewis et al. [17] evaluated movement data from GPS-collared black bears and found that bears selected for areas of forest on the landscape and away from human development along the road when crossing Highway 95.
We interpret the high performance of all connectivity modeling methods when applied to the movement-derived resistance map and low performance when applied to the genetics-derived map to indicate that the movement-derived resistance map is a close match to the factors that the bears were responding to, and the genetics-based map was a relatively poor match. Given this, we evaluated the sensitivity of the methods to the misspecification of the resistance surface. Ideally, one should use a method that is moderately sensitive to differences between resistance surfaces, such that the implications of landscape change in a single landscape or differences in habitat extent and fragmentation in different landscapes for connectivity can be quantified, but not so sensitive that the method fails to predict connectivity well when the resistance surface is approximately, but not ideally, parameterized. Our third hypothesis was intended to evaluate the performance of these methods based on these criteria. As expected, we found that the factorial least cost path method was extremely sensitive to the difference between the two resistance surfaces (more than 22-times more sensitive than the resistant kernel method). We expected this method to be most sensitive given that least cost path locations are spatially constrained to optimal narrow routes, and small changes in overall landscape resistance across the landscape may completely shift those paths. Cumulative resistant kernel methods had moderate sensitivity to differences in resistance between the two surfaces, which might provide sufficient sensitivity to evaluate different landscapes, while enough stability to obtain reliable predictions of the patterns and relative strength of connectivity across the landscape. Our results suggest that cumulative resistant appeared to offer the best combination of high predictive performance and sensitivity to differences in resistance surface parameterization. Specifically, resistant kernels appear to be the preferred choice when the goal is quantifying differences in connectivity between different landscapes or overtime, while factorial least cost paths would be best suited for the analysis of resistance maps where there is high certainty in resistance values and where researchers wish to localize predictions to prioritize specific locations for protection rather than evaluating landscape-wide patterns of connectivity. It would be interesting to compare the methods tested here with other spatial methods to identify where animals cross highways (e.g., [22,23,24,25])

Acknowledgments

We thank J.L. Rachlow, W.L. Wakkinen, J. Hayden, P. Zager, the Idaho Transportation Department, the University of Idaho and the Idaho Department of Fish and Game for support, guidance and assistance in collecting movement data for black bears. The U.S. Forest Service Rocky Mountain Research Station supported Cushman’s salary in this work.

Author Contributions

Cushman developed the research idea and conducted the primary analyses presented in this paper, as well as leading the writing and editing of this manuscript. Lewis led the field work that gathered the data, contributed ideas for the analysis and contributed substantially to the writing of the manuscript. Landguth developed the analytical tools used in the analysis and assisted in implementing the analyses and writing the paper.

Conflicts of Interest

The authors declare no conflict of interest

References

  1. Taylor, P.D.; Fahrig, L.; Henein, K.; Merriam, G. Connectivity is a vital element of landscape structure. Oikos 1993, 68, 571–573. [Google Scholar]
  2. Fahrig, L.; Nuttle, W.K. Population ecology in spatially heterogeneous environments. In Ecosystem Function in Heterogeneous Landscape; Springer: New York, NY, USA, 2005; pp. 95–118. [Google Scholar]
  3. Heller, N.E.; Zavaleta, E.S. Biodiversity management in the face of climate change: a review of 22 years of recommendations. Biol. Conservat. 2009, 142, 14–32. [Google Scholar] [CrossRef]
  4. Landguth, E.L.; Hand, B.K.; Glassy, J.M.; Cushman, S.A. UNICOR: a species corridor and connectivity network simulator. Ecography 2012, 12, 9–14. [Google Scholar] [CrossRef]
  5. Zeller, K.A.; McGarigal, K.; Whiteley, A.R. Estimating landscape resistance to movement: a review. Landsc. Ecol. 2012, 27, 777–797. [Google Scholar] [CrossRef]
  6. Rudnick, D.A.; Beier, P.; Cushman, S.A.; Dieffenbach, F.; Epps, C.W.; Gerber, L.R.; Hartter, J.; Jenness, J.S.; Kintsch, J.; Merenlender, A.M.; Perkl, R.M.; Preziosi, D.V.; Trombulak, S.C. The role of landscape connectivity in planning and implementing conservation and restoration priorities. Available online: http://www.esa.org/esa/wp-content/uploads/2013/03/issuesinecology16.pdf (accessed on 12 December 2014).
  7. Cushman, S.A.; McRae, B.; Adriansen, F.; Beier, P.; Shirley, M.; Zeller, K.A. Biological corridors and connectivity. In Key Topics in Conservation Biology 2; MacDonald, D.W., Willis, K.J., Eds.; Wiley-Blackwell: Hoboken, NJ, USA, 2013; pp. 384–404. [Google Scholar]
  8. Adriansen, F.; Chardon, J.P.; Blust, G.D.; Swinnen, E.; Villalba, S.; Gulinck, H.; Matthysen, E. The application of least-cost modelling as a functional landscape model. Landsc. Urban. Plann. 2003, 64, 233–247. [Google Scholar] [CrossRef]
  9. Cushman, S.A.; McKelvey, K.S.; Schwartz, M.K. Use of empirically derived source-destination models to map regional conservation corridors. Conservat. Biol. 2009, 23, 368–376. [Google Scholar] [CrossRef]
  10. Compton, B.; McGarigal, K.; Cushman, S.A.; Gamble, L. A resistant kernel model of connectivity for vernal pool breeding amphibians. Conservat. Biol. 2007, 21, 788–799. [Google Scholar] [CrossRef]
  11. Cushman, S.A.; Lewis, J.S.; Landguth, E.L. Evaluating the intersection of a regional wildlife connectivity network with highways. Mov. Ecol. 2013. [Google Scholar] [CrossRef]
  12. Cushman, S.A.; Landguth, E.L.; Flather, C.H. Evaluating the sufficiency of protected lands for maintaining wildlife population connectivity in the U.S. northern Rocky Mountains. Divers. Distrib. 2012. [Google Scholar] [CrossRef]
  13. Spear, S.F.; Balkenhol, N.; Fortin, M.-J.; McRae, B.K.; Scribner, K. Use of resistance surfaces for landscape genetic studies: Considerations for parameterization and analysis. Mol. Ecol. 2010, 19, 3576–3591. [Google Scholar] [CrossRef] [PubMed]
  14. Stevens, V.M.; Verkenne, C.; Vandewoestijne, S.; Wesselingh, R.A.; Baguette, M. Gene flow and functional connectivity in the natterjack toad. Mol. Ecol. 2006, 15, 2333–2344. [Google Scholar] [CrossRef] [PubMed]
  15. Cushman, S.A.; Lewis, J.S. Movement behavior explains genetic differentiation in American black bear. Landsc. Ecol. 2010, 25, 1613–1625. [Google Scholar] [CrossRef]
  16. Hagerty, B.E.; Nussear, K.E.; Esque, T.C.; Tracy, C.R. Making molehills out of mountains: Landscape genetics of the Mojave desert tortoise. Landsc. Ecol. 2011, 26, 267–280. [Google Scholar] [CrossRef]
  17. Lewis, J.S.; Rachlow, J.L.; Horne, J.S.; Garton, E.O.; Wakkinen, W.L.; Hayden, J.; Zager, P. Identifying habitat characteristics to predict highway crossing areas for black bears in a human-modified landscape. Landsc. Urban Plann. 2011, 101, 99–107. [Google Scholar] [CrossRef]
  18. Horne, J.S.; Garton, E.O.; Krone, S.M.; Lewis, J.S. Analyzing animal movements using Brownian bridges. Ecology 2007, 88, 2354–2363. [Google Scholar] [PubMed]
  19. Cushman, S.A.; Schwartz, M.K.; Hayden, J.; McKelvey, K.S. Gene flow in complex landscapes: Testing multiple hypotheses with causal modeling. Am. Nat. 2006, 168, 486–499. [Google Scholar] [CrossRef] [PubMed]
  20. Hegel, T.M.; Cushman, S.A.; Evans, J.; Huettmann, F. Current state of the art for statistical modelling of species distributions. In Spatial Complexity, Informatics and Wildlife Conservation; Cushman, S.A., Huettman, F., Eds.; Springer: Tokyo, Japan, 2010; pp. 273–312. [Google Scholar]
  21. Fortin, M.-J.; Dale, M.R.T. Spatial Analysis: A Guide for Ecologists; Cambridge University Press: Cambridge, UK, 2005. [Google Scholar]
  22. Downs, J.A.; Horner, M.W. Enhancing habitat connectivity in fragmented landscapes: Spatial modeling of wildlife crossing structures in transportation networks. Ann. Am. Geogr. 2012, 102, 17–34. [Google Scholar] [CrossRef]
  23. Downs, J.A.; Horner, M.W.; Loramm, R.; Anderson, J.; Kim, H.; Onorato, D. Strategically locating wildlife crossing structures for Florida panthers using maximal covering approaches. Trans. GIS 2014, 18, 46–65. [Google Scholar] [CrossRef]
  24. Wall, J.; Wittemeyer, G.; LeMay, V.; Douglas-Hamilton, I.; Klinkenberg, B. Elliptical time-density model to estimate wildlife utilization distributions. Meth. Ecol. Evol. 2014, 5, 780–790. [Google Scholar] [CrossRef]
  25. Downs, J.A. Time-geography density estimation for moving point objects. In Geographic Information Science; Springer: Berlin & Heidelberg, Germany, 2010; pp. 16–26. [Google Scholar]

