Variations of Bacterial Community Structure and Composition in Mangrove Sediment at Different Depths in Southeastern Brazil

Abstract
:1. Introduction
2. Methods
2.1. Sampling
2.2. Sediment Chemical and Physical Analysis
2.3. DNA Extraction and T-RFLP Analysis
2.4. Pyrosequencing Analysis of the Bacterial 16S rRNA Gene
3. Results and Discussion

| Point 1 | Point 2 | Point 3 | ||||||||||
|---|---|---|---|---|---|---|---|---|---|---|---|---|
| A | 10 cm | 20 cm | 30 cm | 40 cm | 10 cm | 20 cm | 30 cm | 40 cm | 10 cm | 20 cm | 30 cm | 40 cm |
| pH (CaCl2) | 6.1 | 6.6 | 6.6 | 5.7 | 6.3 | 6.7 | 6.5 | 5.7 | 5.4 | 6.4 | 6.1 | 6.2 |
| OM (g·dm−3) | 94 | 124 | 88 | 40 | 122 | 91 | 100 | 54 | 51 | 98 | 109 | 46 |
| P (mg·dm−3) | 12 | 8 | 7 | 3 | 6 | 8 | 7 | 4 | 2 | 6 | 4 | 3 |
| K (mmol·dm−3) | 2.3 | 1.7 | 1.7 | 1.1 | 2.6 | 2.1 | 1.8 | 1.4 | 1.1 | 1.8 | 1.8 | 1.4 |
| Ca (mmol·dm−3) | 49 | 47 | 43 | 21 | 45 | 49 | 29 | 18 | 16 | 37 | 28 | 19 |
| Mg (mmol·dm−3) | 55 | 55 | 51 | 38 | 18 | 15 | 15 | 18 | 20 | 15 | 18 | 13 |
| B (mg·dm−3) | 0.1 | 0.05 | 0.04 | 0.02 | 0.1 | 0.06 | 0.05 | 0.01 | 0.12 | 0.05 | 0.05 | 0.02 |
| Cu (mg·dm−3) | 0.2 | 0.07 | 0.06 | 0.02 | 0.19 | 0.08 | 0.06 | 0.02 | 0.2 | 0.07 | 0.06 | 0.01 |
| Fe (mg·dm−3) | 281 | 59.1 | 55.1 | 53 | 260 | 53.2 | 40.1 | 47.8 | 280 | 70.3 | 59.8 | 54 |
| Mn (mg·dm−3) | 2.92 | 1.08 | 0.96 | 0.96 | 1.98 | 1.00 | 0.80 | 0.91 | 2.40 | 1.10 | 0.85 | 0.70 |
| Zn (mg·dm−3) | 0.6 | 0.05 | 0.06 | 0.06 | 0.6 | 0.06 | 0.06 | 0.05 | 0.5 | 0.05 | 0.04 | 0.05 |
| B | Point 1 | Point 2 | Point 3 | |||||||||
| Sand (%) | 22 | 82 | 78 | |||||||||
| Silt (%) | 26 | 6 | 12 | |||||||||
| Clay (%) | 52 | 12 | 10 | |||||||||
| Temperature (°C) | 12.5 | 13.3 | 13.7 | |||||||||
| Humidity (%) | 69.9 | 40.8 | 49.2 | |||||||||
| Total carbon (%) | 13.9 | 5.1 | 7.0 | |||||||||
| Organic carbon (%) | 12.2 | 3.0 | 3.5 | |||||||||
| Total nitrogen (%) | 0.7 | 0.2 | 0.2 | |||||||||
| Total sulphur (%) | 0.2 | 0.1 | 0.1 | |||||||||
| Condutivity (mS) | 20.8 | 11.4 | 3.5 | |||||||||
| Salinity (%) | 1.3 | 0.7 | 0.2 | |||||||||
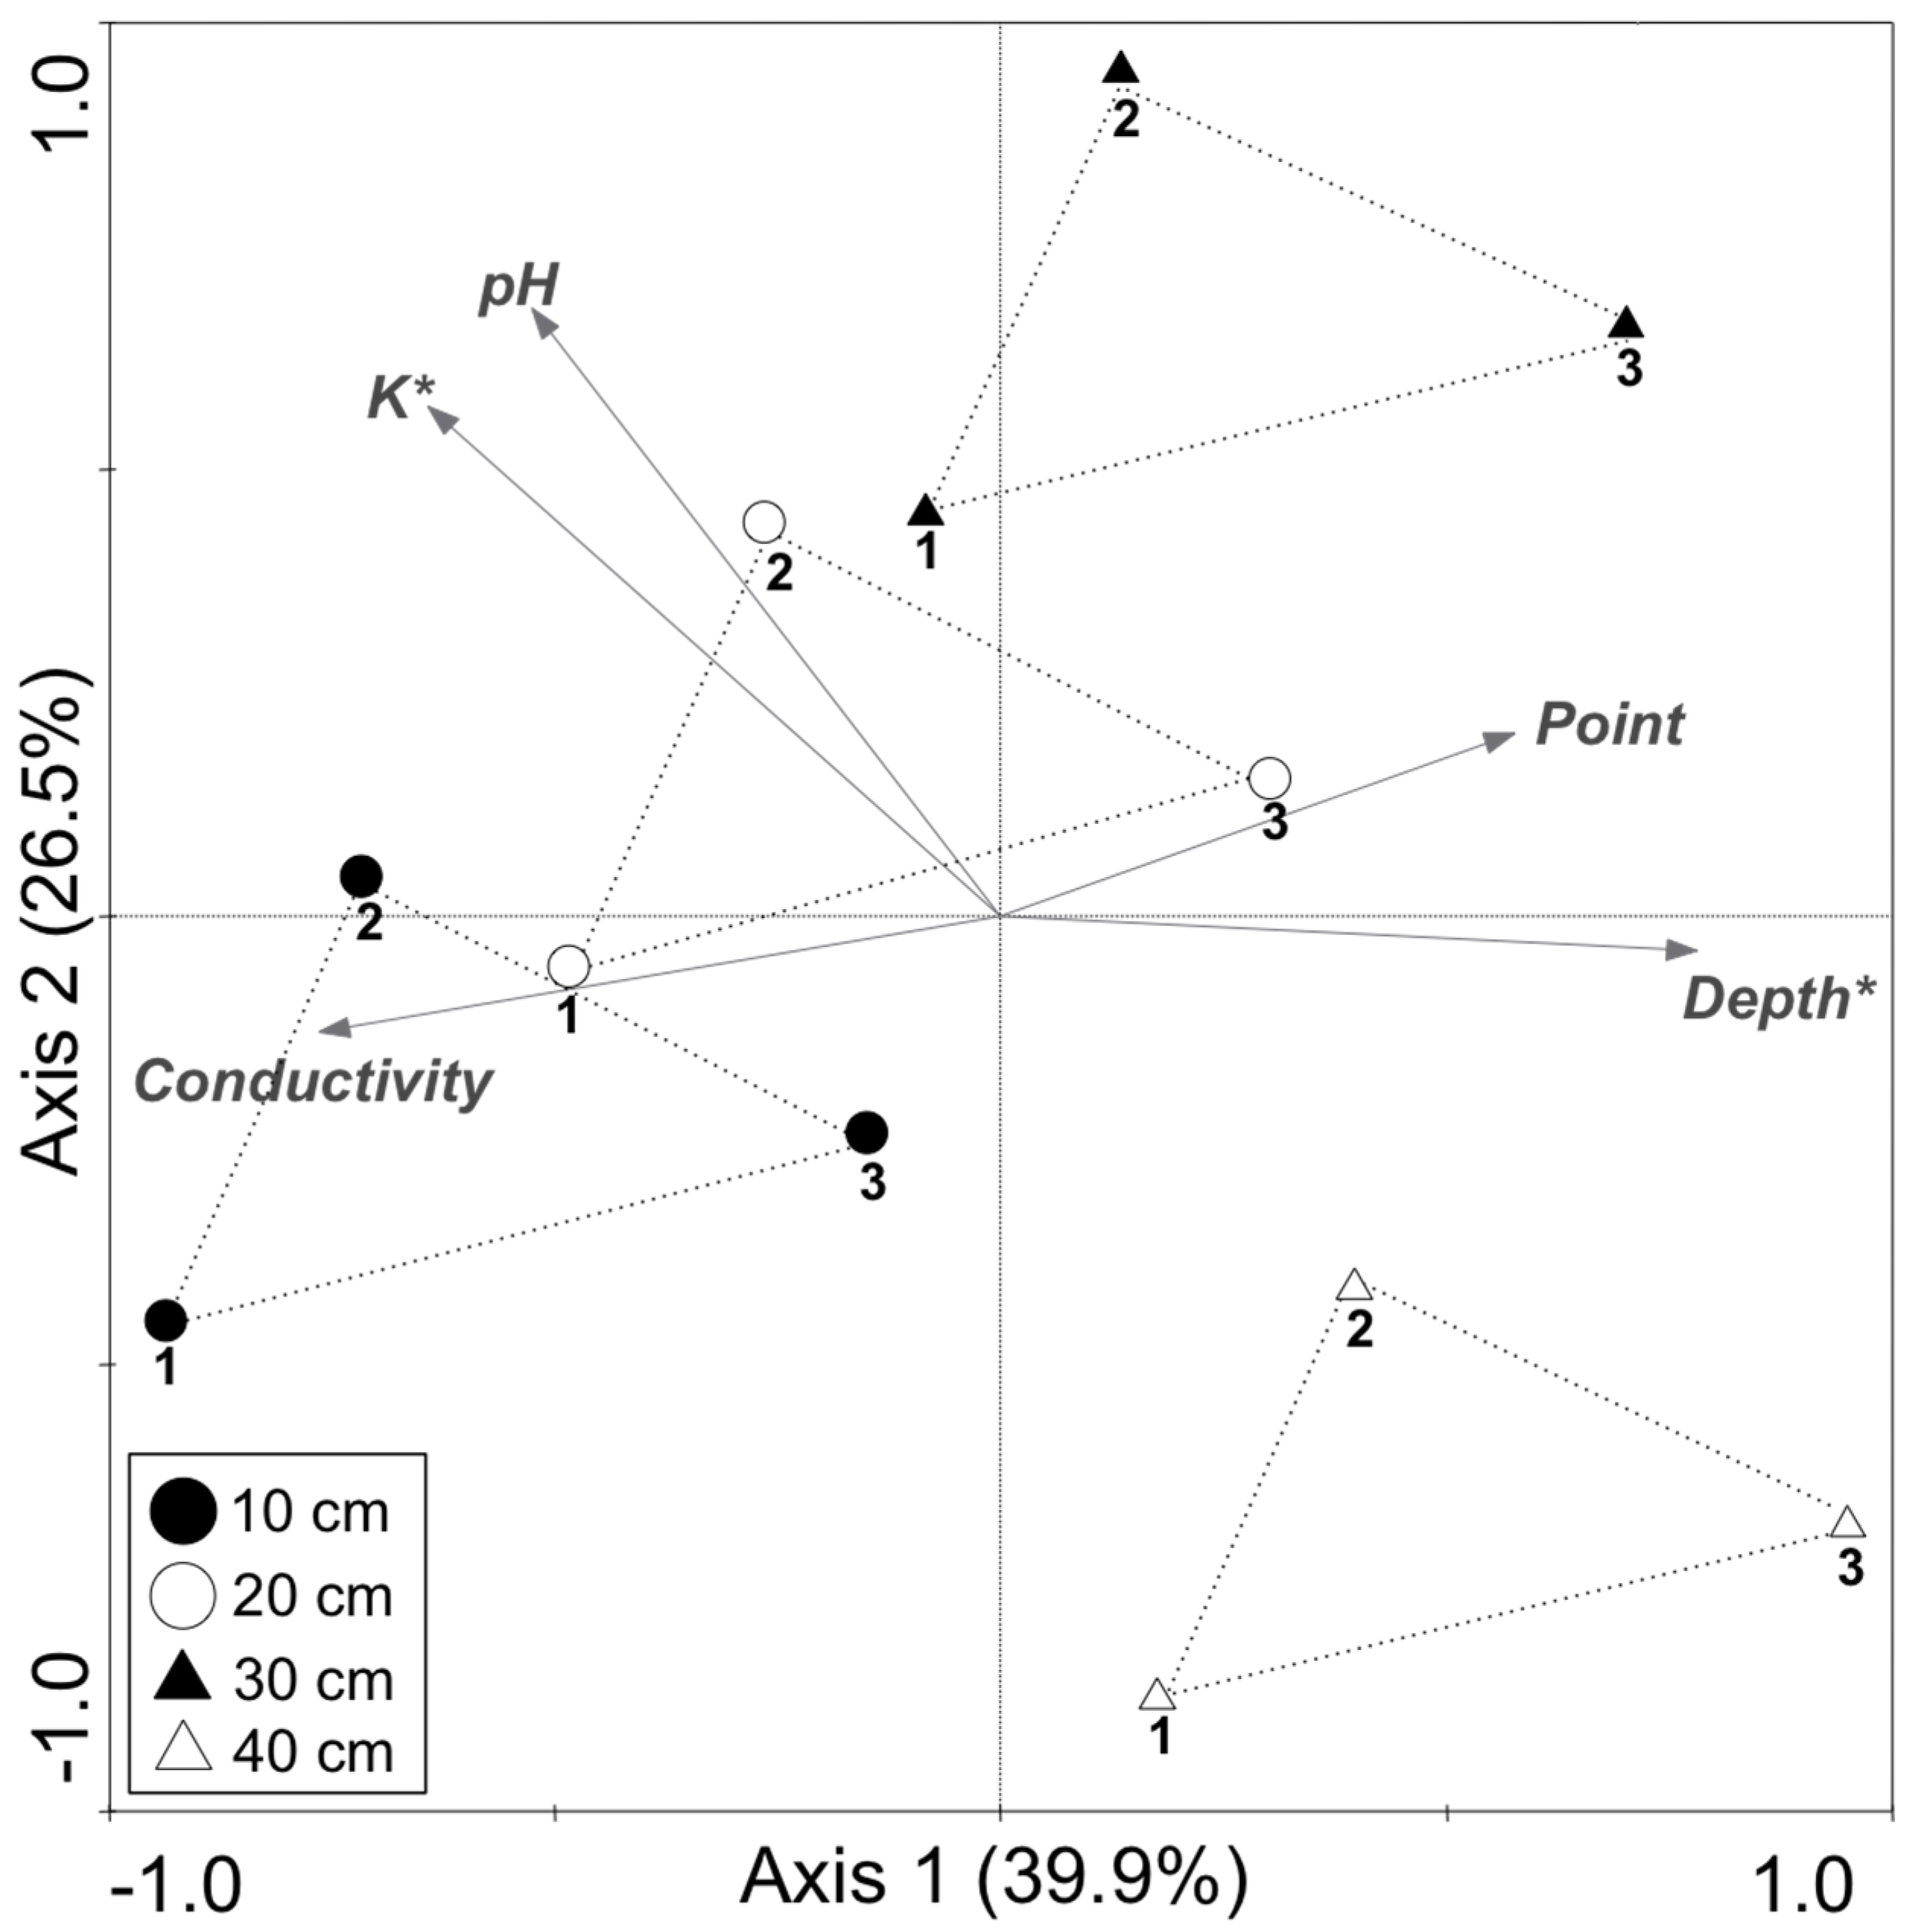
| Variable | Lambda1 | p Value |
|---|---|---|
| K | 0.25 | 0.044 |
| Depth | 0.22 | 0.035 |
| Conductivity | 0.16 | 0.064 |
| Point | 0.03 | 0.474 |
| pH | 0.01 | 0.967 |


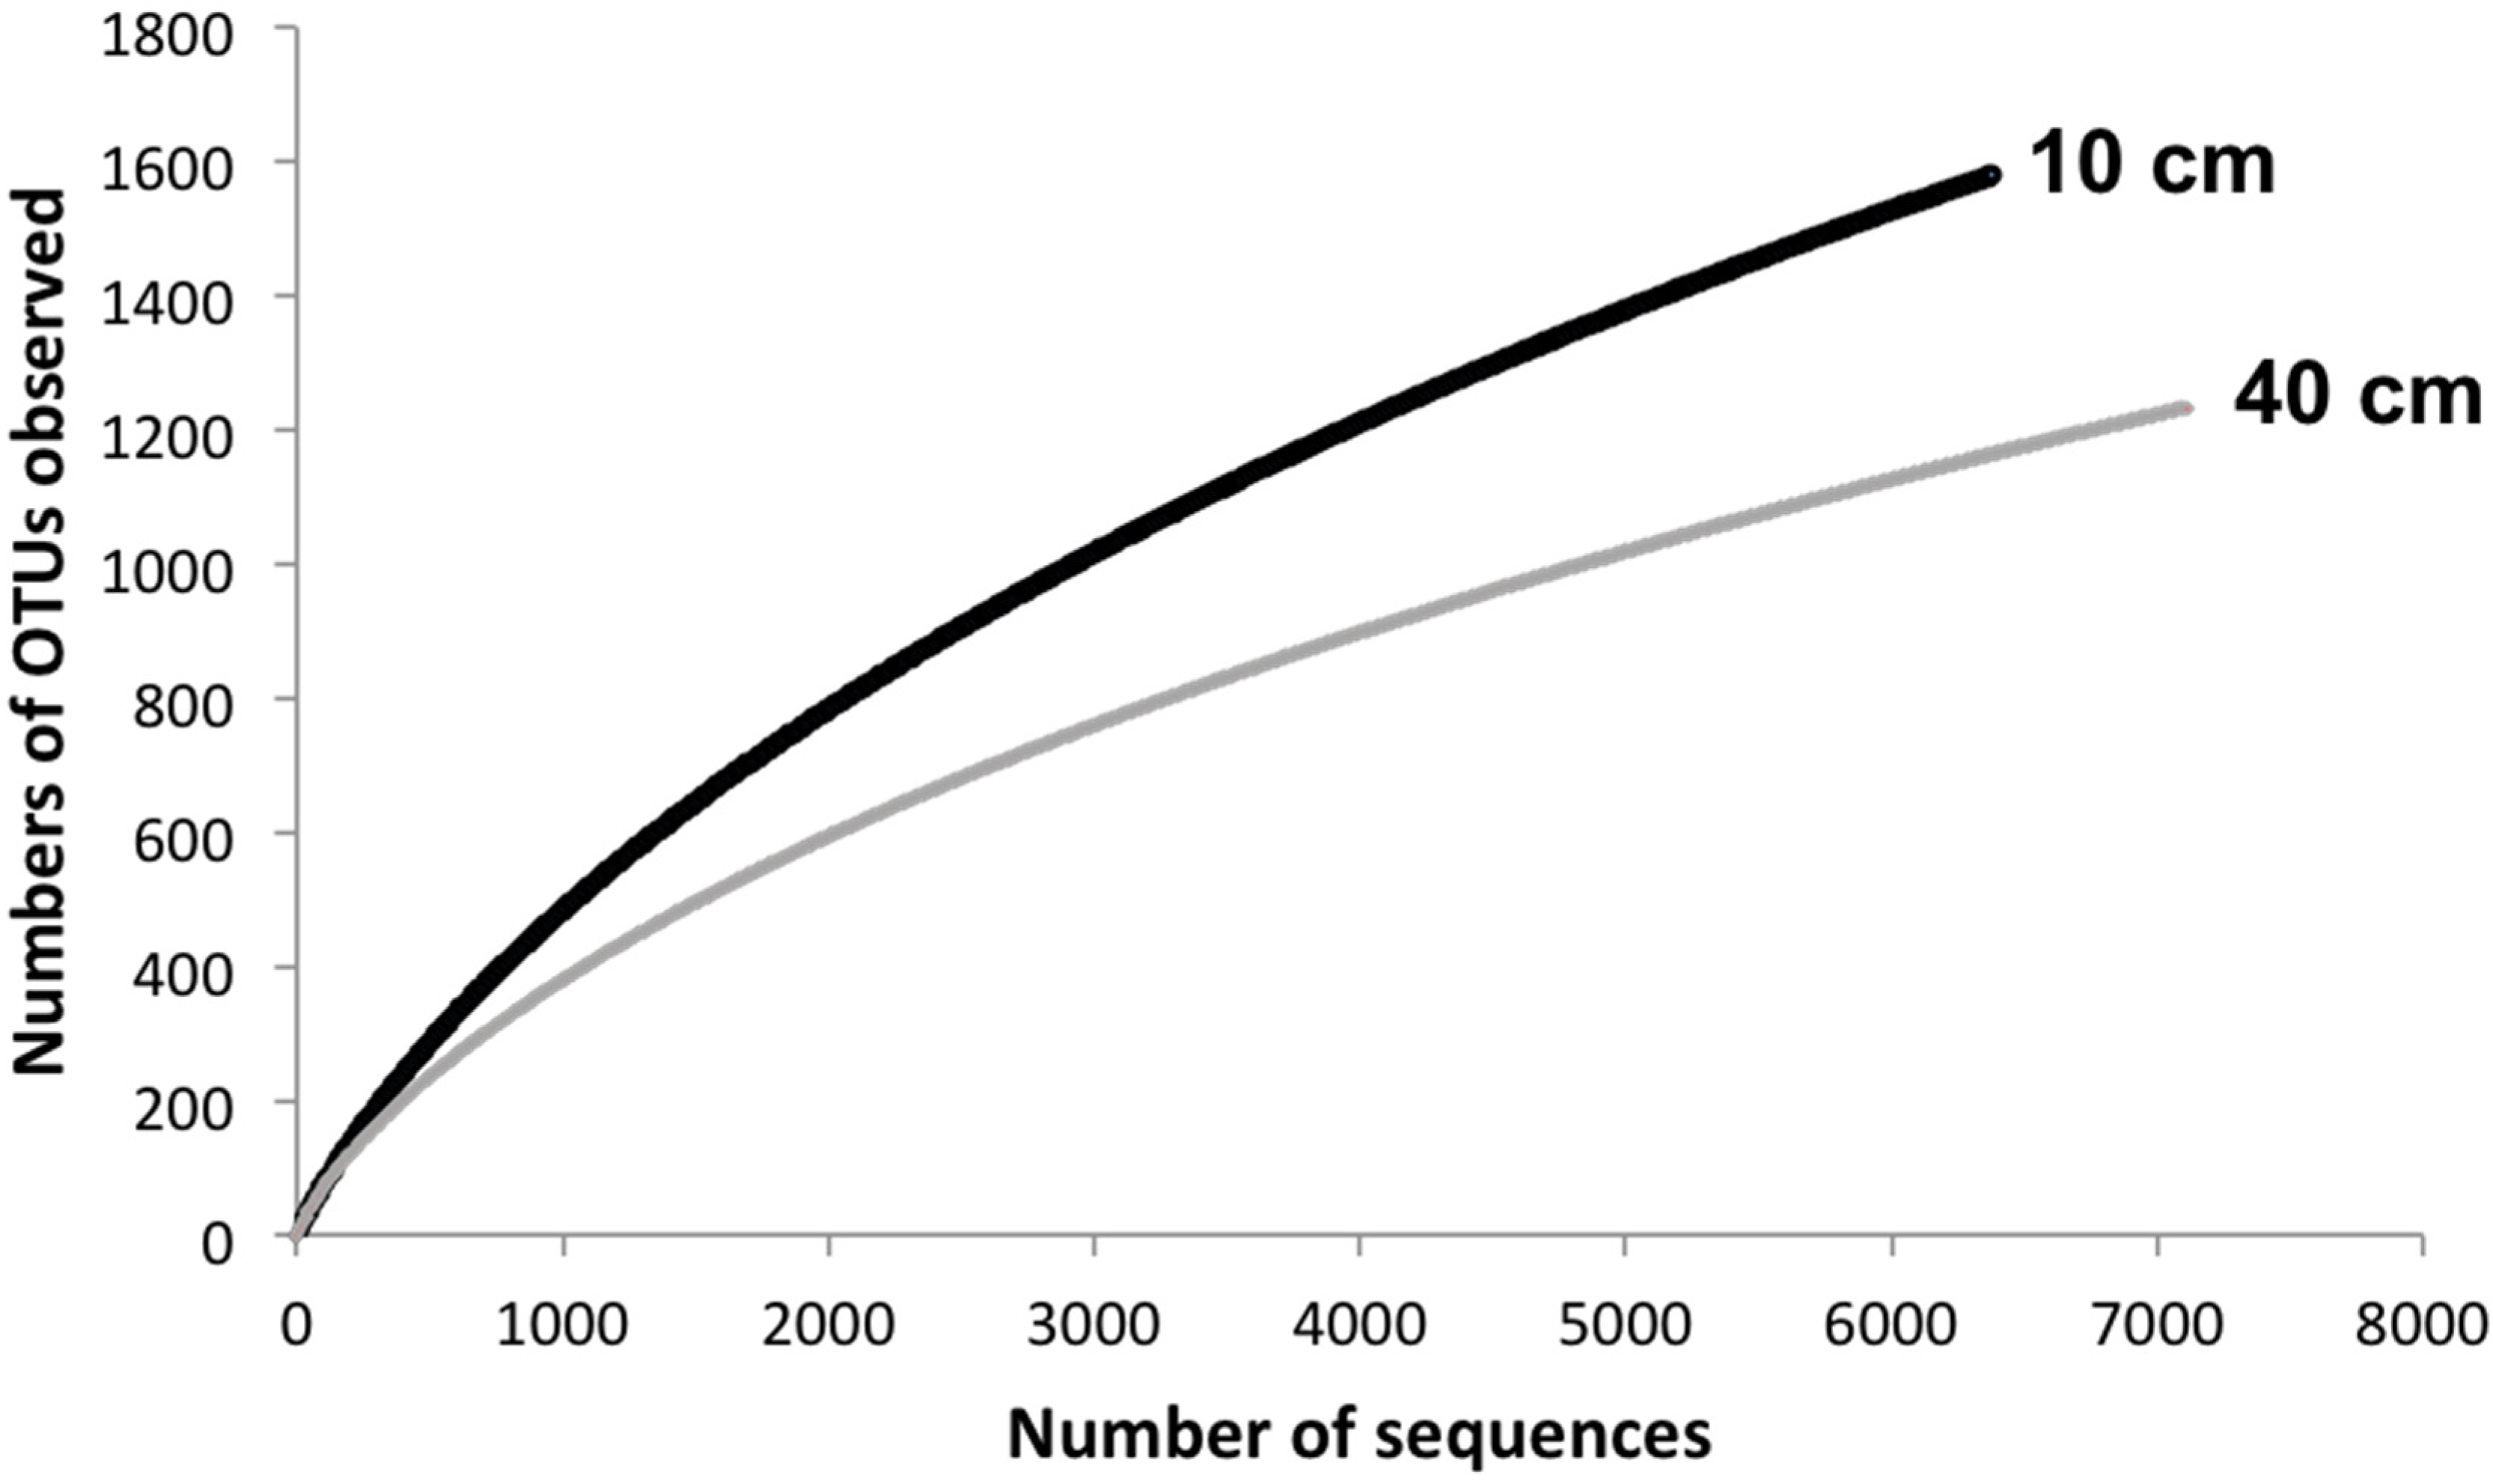
| Depth | Reads | OTU a | Chao1 b | Shannon | Good |
|---|---|---|---|---|---|
| 10 cm | 6382 | 1580 | 2840.65 | 5.97 | 81.1 |
| 40 cm | 7117 | 1234 | 2285.88 | 5.62 | 79.0 |

4. Conclusions
Acknowledgments
Author Contributions
Conflicts of Interest
References
- Nedwell, D.B.; Blackurn, T.H.; Wiebe, W.J. Dynamic nature of turnover of organic carbon, nitrogen and sulphur in the sediments of a Jamaican mangrove forest. Mar. Ecol.: Prog. Ser. 1994, 110, 203–212. [Google Scholar] [CrossRef]
- Yan, B.; Hong, K.; Yu, Z.N. Archaeal communities in mangrove soil characterized by 16S rRNA gene clones. J. Microbiol. 2006, 44, 566–571. [Google Scholar]
- Lyimo, T.J.; Pol, A.; Jetten, M.S.M.; den Camp, H.J. Diversity of methanogenic Archaea in a mangrove sediment and isolation of a new Methanococcoides strain. FEMS Microbiol. Lett. 2009, 291, 247–253. [Google Scholar] [CrossRef]
- Walsh, G.E. Mangroves: A review. In Ecology of Halophytes; Reinold, R.J., Queen, W.H., Eds.; Academic Press: New York, NY, USA, 1974; pp. 51–154. [Google Scholar]
- Getter, C.D.; Cintron, G.; Dicks, B.; Lewis, R.R.; Seneca, E.D. The recovery and restoration of salt marshes and mangrove following an oil spill. In Restoration of Habitats Impacted by Oil Spills; Cairns, J., Buikema, A.L., Eds.; Butterworth: Boston, MA, USA, 1984; pp. 65–113. [Google Scholar]
- Duke, N.C.; Meynecke, O.; Dittmann, S.; Ellison, A.M.; Anger, K.; Berger, U.; Cannicci, S.; Diele, K.; Ewel, K.C.; Field, C.D.; et al. A world without mangroves? Sci. Lett. 2007, 317, 41–42. [Google Scholar]
- Holguin, G.; Vazquez, P.; Bashan, Y. The role of sediment microorganisms in the productivity, conservation, and rehabilitation of mangrove ecosystems; an overview. Biol. Fertil. Soils 2001, 33, 265–278. [Google Scholar] [CrossRef]
- Andreote, F.D.; Jiménez, D.J.; Chaves, D.; Dias, A.C.F.; Luvizotto, D.M.; Dini-Andreote, F.; Fasanella, C.C.; Lopez, M.V.; Baena, S.; Taketani, R.G.; et al. The microbiome of Brazilian mangrove sediments as revealed by metagenomics. PLoS One 2012, 7, e38600. [Google Scholar] [CrossRef] [Green Version]
- Dias, A.C.F.; Andreote, F.D.; Rigonato, J.; Fiore, M.F.; Melo, I.S.; Araújo, W.L. The bacterial diversity in a Brazilian non-disturbed mangrove sediment. Antonie Van Leeuwenhoek 2010, 98, 541–551. [Google Scholar] [CrossRef]
- Dias, A.C.F.; Dini-Andreote, F.; Taketani, R.G.; Tsai, S.M.; Azevedo, J.L.; Melo, I.S.; Andreote, F.D. Archaeal communities in the sediments of three contrasting mangroves. J. Soils Sediments 2011, 11, 1466–1476. [Google Scholar] [CrossRef]
- Mendes, L.W.; Taketani, R.G.; Navarrete, A.A.; Tsai, S.M. Shifts in phylogenetic diversity of archaeal communities in mangrove sediments at different sites and depths in southeastern Brazil. Res. Microbiol. 2012, 163, 366–377. [Google Scholar] [CrossRef]
- Sá, A.L.B.; Dias, A.C.F.; Qecine, M.C.; Cotta, S.R.; Fasanella, C.C.; Andreote, F.D.; Melo, I.S. Screening of endoglucanase-producing bacteria in the saline rhizosphere of Rhizophora mangle. Braz. J. Microbiol. 2014, 45, 193–197. [Google Scholar] [CrossRef]
- Gomes, N.C.; Borges, L.R.; Paranhos, R.; Pinto, F.N.; Mendonca-Hagler, L.C.S.; Smalla, K. Exploring the diversity of bacterial communities in sediments of urban mangrove forests. FEMS Microbiol. Ecol. 2008, 66, 96–109. [Google Scholar] [CrossRef]
- Taketani, R.G.; Franco, N.O.; Rosado, A.S.; van Elsas, J.D. Microbial community response to a simulated hydrocarbon spill in mangrove sediments. J. Microbiol. 2010, 48, 7–15. [Google Scholar] [CrossRef]
- Sousa, O.V.; Macrae, A.; Menezes, F.G.; Gomes, N.C.; Vieira, R.H.; Mendonça-Hagler, L.C.S. The impact of shrimp farming effluent on bacterial communities in mangrove waters, Ceará, Brazil. Mar. Pollut. Bull. 2006, 52, 1725–1734. [Google Scholar] [CrossRef]
- Margulies, M.; Egholm, M.; Altman, W.E.; Attiya, S.; Bader, J.S.; Bemben, L.A.; Berka, J.; Braverman, M.S.; Chen, Y.-J.; Chen, Z. Nature 2005, 437, 376–380.
- Van Raij, B.; Cantarella, H.; Andrade, J.C.; Quaggio, J.A. Análise Química Para Avaliação da Fertilidade de Solos Tropicais; Instituto Agronômico: Campinas, Brazil, 2001; p. 285. [Google Scholar]
- Brody, J.R.; Kern, S.E. Sodium boric acid: Atriz-less, cooler conductive medium for DNA electrophoresis. Biotechniques 2004, 36, 214–216. [Google Scholar]
- Amann, R.I.; Ludwig, W.; Schleifer, K.H. Phylogenetic identification and in situ detection of individual microbial cells without cultivation. Microbiol. Rev. 1995, 59, 143–169. [Google Scholar]
- Culman, S.W.; Bukowski, R.; Gauch, H.G.; Cadillo-Quiroz, H.; Buckley, D.H. T-REX: Software for the processing and analysis of T-RFLP data. BMC Bioinforma. 2009, 10, 171. [Google Scholar] [CrossRef]
- Culman, S.W.; Gauch, H.G.; Blackwood, C.B.; Thies, J.E. Analysis of T-RFLP data using analysis of variance and ordination methods: A comparative study. J. Microbiol. Methods 2008, 75, 55–63. [Google Scholar] [CrossRef]
- Hammer, Ø.; Harper, D.A.T.; Ryan, P.D. PAST: Paleontological statistics software package for education and data analysis. Palaeontol. Electron. 2001, 4, 9. [Google Scholar]
- Sul, W.J.; Cole, J.R.; Jesus, E.D.C.; Wang, Q.; Farris, R.J.; Fish, J.A.; Tiedje, J.M. Bacterial community comparisons by taxonomy-supervised analysis independent of sequence alignment and clustering. Proc. Natl. Acad. Sci. USA 2011, 108, 14637–14642. [Google Scholar] [CrossRef]
- DeSantis, T.Z.; Hugenholtz, P.; Larsen, N.; Rojas, M.; Brodie, E.L.; Keller, K.; Huber, T.; Dalevi, D.; Hu, P.; Andersen, G.L. Greengenes, a chimera-checked 16S rRNA gene database and workbench compatible with ARB. Appl. Environ. Microbiol. 2006, 72, 5069–5072. [Google Scholar] [CrossRef] [Green Version]
- Schloss, P.D.; Westcott, S.L.; Ryabin, T.; Hall, J.R.; Hartmann, M.; Hollister, E.B.; Lesniewski, R.A.; Oakley, B.B.; Parks, D.H.; Robinson, C.J.; et al. Introducing mothur: Open-source, platform-independent, community-supported software for describing and comparing microbial communities. Appl. Environ. Microbiol. 2009, 75, 7537–7541. [Google Scholar] [CrossRef]
- Schloss, P.D.; Larget, B.R.; Handelsman, J. Integration of Microb Ecol statistics: A test to compare gene libraries. Appl. Environ. Microbiol. 2004, 70, 5485–5492. [Google Scholar] [CrossRef]
- Varon-Lopez, M.; Dias, A.C.F.; Fasanella, C.C.; Durrer, A.; Melo, I.S.; Kuramae, E.E.; Andreote, F.D. Suplhur-oxidizing and sulfate-reducing communities in Brazilian mangrove sediments. Environ. Microbiol. 2014, 16, 845–855. [Google Scholar] [CrossRef]
- Alongi, D.M. Bacterial productivity and microbial biomass in tropical mangrove sediments. Microb. Ecol. 1988, 15, 59–79. [Google Scholar] [CrossRef]
- Holguin, G.; Zamorano, P.G.; Bashan, L.E.D.; Mendoza, R.; Amador, E.; Bashan, Y. Mangrove health in an arid envi-ronment encroached by urban development—A case study. Sci. Total Environ. 2006, 363, 260–274. [Google Scholar] [CrossRef]
- Fierer, N.; Jackson, R.B. The diversity and biogeography of soil bacterial communities. Proc. Natl. Acad. Sci. USA 2006, 103, 626–631. [Google Scholar] [CrossRef]
- Jesus, E.D.; Marsh, T.L.; Tiedje, J.M.; Moreira, F.M.D. Changes in land use alter the structure of bacterial communities in Western Amazon soils. ISME J. 2009, 3, 1004–1011. [Google Scholar] [CrossRef]
- Nielsen, U.N.; Osler, G.H.R.; Campbell, C.D.; Burslem, D.F.R.P.; van der Wal, R. The influence of vegetation type, soil properties and precipitation on the composition of soil mite and microbial communities at the landscape scale. J. Biogeogr. 2010, 37, 1317–1328. [Google Scholar] [CrossRef]
- Hu, Y.J.; Xiang, D.; Veresoglou, S.D.; Chen, F.L.; Chen, Y.L.; Hao, Z.P.; Zhang, X.; Chen, B.D. Soil organic carbon and soil structure are driving microbial abundance and community composition across the arid and semi-arid grassland in northern China. Soil Biol. Biochem. 2014, 77, 51–57. [Google Scholar] [CrossRef]
- Parmar, P.; Sindhu, S.S. Potassium solubilization by rhizosphere bacteria: Influence of nutritional and environmental conditions. J. Microbiol. Res. 2013, 3, 25–31. [Google Scholar]
- Richards, J.E.; Bates, T.E. Studies on the potassium-supplying capacities of southern Ontario soil. III. Measurement of available K. Can. J. Soil Sci. 1989, 69, 597–610. [Google Scholar] [CrossRef]
- Basak, B.B.; Biswas, D.R. Influence of potassium solubilizing microorganism (Bacillus mucilaginosus) and waste mica on potassium uptake dynamics by sudan grass (Sorghun vulgare Pers.) grown under two Alfisols. Plant Soil 2009, 317, 235–255. [Google Scholar] [CrossRef]
- Belay, A.; Claassens, A.S.; Wehner, F.C. Effect of direct nitrogen and potassium and residual phosphorus fertilizers on soil chemical properties, microbial components and maize yield under long-term crop rotation. Biol. Fertil. Soils 2002, 35, 420–427. [Google Scholar] [CrossRef]
- Pan, Y.; Cassman, N.; Hollander, M.; Mendes, L.W.; Korevaar, H.; Geerts, R.H.E.M.; van Veen, J.A.; Kuramae, E.E. Impact of long-term N, P, K, and NPK fertilization on the composition and potential functions of the bacterial community in grassland soil. FEMS Microbiol. Ecol. 2014, 90, 195–205. [Google Scholar] [CrossRef]
- Fierer, N.; Schimel, J.P.; Holden, P.A. Variations in microbial community composition through two soil depth profiles. Soil Biol. Biochem. 2003, 35, 167–176. [Google Scholar] [CrossRef]
- Wilms, R.; Kopke, B.; Sass, H.; Chang, T.S.; Cypionka, H.; Engelen, B. Deep biosphere-related bacteria within the subsurface of tidal flat sediments. Environ. Microbiol. 2006, 8, 709–719. [Google Scholar] [CrossRef]
- Pazinato, J.M.; Paulo, E.N.; Mendes, L.W.; Vazoller, R.F.; Tsai, S.M. Amazonian wetland soil and culture-dependent isolation of methanogenic Archaea. Diversity 2010, 2, 1026–1047. [Google Scholar] [CrossRef]
- Li, N.; Yao, S.H.; You, M.Y.; Zhang, Y.L.; Qiao, Y.F.; Zou, W.X.; Han, X.Z.; Zhang, B. Contrasting development of soil microbial community structure under no-tilled perennial and tilled cropping during early pedogenesis of a Mollisol. Soil Biol. Biochem. 2014, 77, 221–232. [Google Scholar] [CrossRef]
- Uroz, S.; Buée, M.; Murat, C.; Frey-klett, P.; Martin, F. Pyrosequencing reveals a contrasted bacterial diversity between oak rhizosphere and surrounding soil. Environ. Microbiol. Rep. 2010, 2, 281–288. [Google Scholar] [CrossRef]
- Lemos, L.; Fulthorpe, R.; Triplett, E.W.; Roesch, L.F. Rethinking microbial diversity analysis in the high troughput sequencing era. J. Microbiol. Methods 2011, 86, 42–51. [Google Scholar]
- Ghosh, A.; Dey, N.; Bera, A.; Tiwari, A.; Sathyaniranjan, K.B.; Chakrabarti, K.; Chattopadhyay, D. Culture independent molecular analysis of bacterial communities in the mangrove sediment of Sudarban, India. Saline Syst. 2010, 6, 1. [Google Scholar] [CrossRef]
- Gyaneshwar, P.; Hirsch, A.M.; Moulin, L.; Chen, W.M.; Elliott, G.N.; Bontemps, C.; Estrada-de los Santos, P.; Gross, E.; dos Reis, F.B.; Sprent, J.I.; et al. Legume-nodulating betaproteobacteria: Diversity, host range, and future prospects. Mol. Plant–Microbe Interact. 2011, 24, 1276–1288. [Google Scholar] [CrossRef]
- Foti, M.; Sorokin, D.Y.; Lomans, B.; Mussman, M.; Zacharova, E.E.; Pimenov, N.V.; Kuenen, J.G.; Muyzer, G. Diversity, activity, and abundance of sulfate-reducing bacteria in saline and hypersaline Soda Lakes. Appl. Environ. Microbiol. 2007, 73, 2093–2100. [Google Scholar] [CrossRef]
- Hori, T.; Muller, A.; Igarashi, Y.; Conrad, R.; Friedrich, M.W. Identification of iron-reducing microorganisms in anoxic rice paddy soil by 13C-acetate probing. ISME J. 2010, 4, 267–278. [Google Scholar] [CrossRef]
- Dos Santos, H.F.; Cury, J.C.; do Carmo, F.L.; dos Santos, A.L.; Tiedje, J.M.; van Elsas, J.D.; Rosado, A.S.; Peixoto, R.S. Mangrove bacterial diversity and the impact of oil contamination revealed by pyrosequencing: Bacterial proxies for oil pollution. PLoS One 2011, 6, e16943. [Google Scholar] [CrossRef]
- Takai, K.; Campbell, B.J.; Cary, S.C.; Suzuki, M.; Oida, H.; Nunoura, T.; Hirayama, H.; Nakagawa, S.; Suzuki, Y.; Inagaki, F.; et al. Enzymatic and genetic characterization of carbon and energy metabolisms by deep-sea hydrothermal chemolithoautotrophic isolates of Epsilonproteobacteria. Appl. Environ. Microbiol. 2005, 71, 7310–7320. [Google Scholar] [CrossRef]
- Lyimo, T.J.; Pol, A.; Op den Camp, H.J.M. Sulfate reduction and methanogenesis in sediments of Mtoni mangrove forest, Tanzania. AMBIO 2002, 31, 614–616. [Google Scholar]
- Dar, S.A.; Kleerebezem, R.; Stams, A.J.M.; Kuenen, J.G.; Muyzer, G. Competition and coexistence of sulfate-reducing bacteria, acetogens and methanogens in a lab-scale anaerobic bioreactor as affected by changing substrate to sulfate ratio. Appl. Environ. Microbiol. 2008, 78, 1045–1055. [Google Scholar]
- Kowalchuk, G.A.; Stephen, J.R. Ammonia-oxidizing bacteria: A model for molecular microbial ecology. Annu. Rev. Microbiol. 2001, 55, 485–529. [Google Scholar] [CrossRef]
- Das, K.; Mukherjee, A.K. Crude petroleum-oil biodegradation efficiency of Bacillus subtilis and Pseudomonas aeroginosa strains isolated from a petroleum-oil contaminated soil from North-East India. Bioresour. Technol. 2007, 98, 1339–1345. [Google Scholar] [CrossRef]
- Chow, M.L.; Radomski, C.C.; McDermott, J.M.; Davies, J.; Axelrood, P.E. Molecular characterization of bacterial diversity in Lodgepole pine (Pinus contorta) rhizosphere soils from British Columbia forest soils differing in disturbance and geographic source. FEMS Microbiol. Ecol. 2002, 42, 347–357. [Google Scholar] [CrossRef]
- Dunfield, P.F.; Yuryev, A.; Senin, P.; Smirnova, A.V.; Stott, M.B.; Hou, S.; Ly, B.; Saw, J.H.; Zhou, Z.; Ren, Y.; et al. Methane oxidation by an extremely acidophilic bacterium of the phylum Verrucomicrobia. Nature 2007, 450, 879–882. [Google Scholar] [CrossRef]
- Yamada, T.; Sekiguchi, Y.; Imachi, H.; Kamagata, Y.; Ohashi, A.; Harada, H. Diversity localization, and physiological properties of filamentous microbes belonging to Chloroflexi sub phylum in mesophilic and thermophilic methanogenic sludge granules. Appl. Environ. Microbiol. 2005, 71, 7493–7503. [Google Scholar] [CrossRef]
- Wilms, R.; Sass, H.; Kopke, B.; Cypionka, H.; Engelen, B. Methane and sulfate profiles within the subsurface of a tidal flat are reflected by the distribution of sulfate-reducing bacteria and methanogenic archaea. FEMS Microbiol. Ecol. 2007, 59, 611–621. [Google Scholar] [CrossRef]
- Bagwel, C.E.; Formolo, M.; Ye, Q.; Yeger, C.M.; Lyons, T.W.; Zhang, C.L. Direct analysis of sulfate reducing bacterial communities in gas hydrate-impacted marine sediments by PCR-DGGE. J. Basic Microbiol. 2009, 49, 87–92. [Google Scholar] [CrossRef]
© 2014 by the authors; licensee MDPI, Basel, Switzerland. This article is an open access article distributed under the terms and conditions of the Creative Commons Attribution license (http://creativecommons.org/licenses/by/4.0/).
Share and Cite
Mendes, L.W.; Tsai, S.M. Variations of Bacterial Community Structure and Composition in Mangrove Sediment at Different Depths in Southeastern Brazil. Diversity 2014, 6, 827-843. https://doi.org/10.3390/d6040827
Mendes LW, Tsai SM. Variations of Bacterial Community Structure and Composition in Mangrove Sediment at Different Depths in Southeastern Brazil. Diversity. 2014; 6(4):827-843. https://doi.org/10.3390/d6040827
Chicago/Turabian StyleMendes, Lucas William, and Siu Mui Tsai. 2014. "Variations of Bacterial Community Structure and Composition in Mangrove Sediment at Different Depths in Southeastern Brazil" Diversity 6, no. 4: 827-843. https://doi.org/10.3390/d6040827
APA StyleMendes, L. W., & Tsai, S. M. (2014). Variations of Bacterial Community Structure and Composition in Mangrove Sediment at Different Depths in Southeastern Brazil. Diversity, 6(4), 827-843. https://doi.org/10.3390/d6040827