
Exploring the Role of Different Neonatal Nutrition Regimens during the First Week of Life by Urinary GC-MS Metabolomics

 , ,
, , 
Abstract
:
1. Introduction
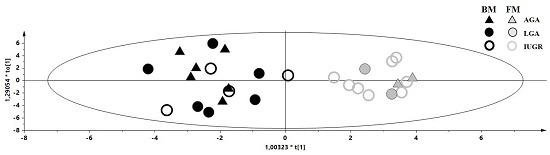
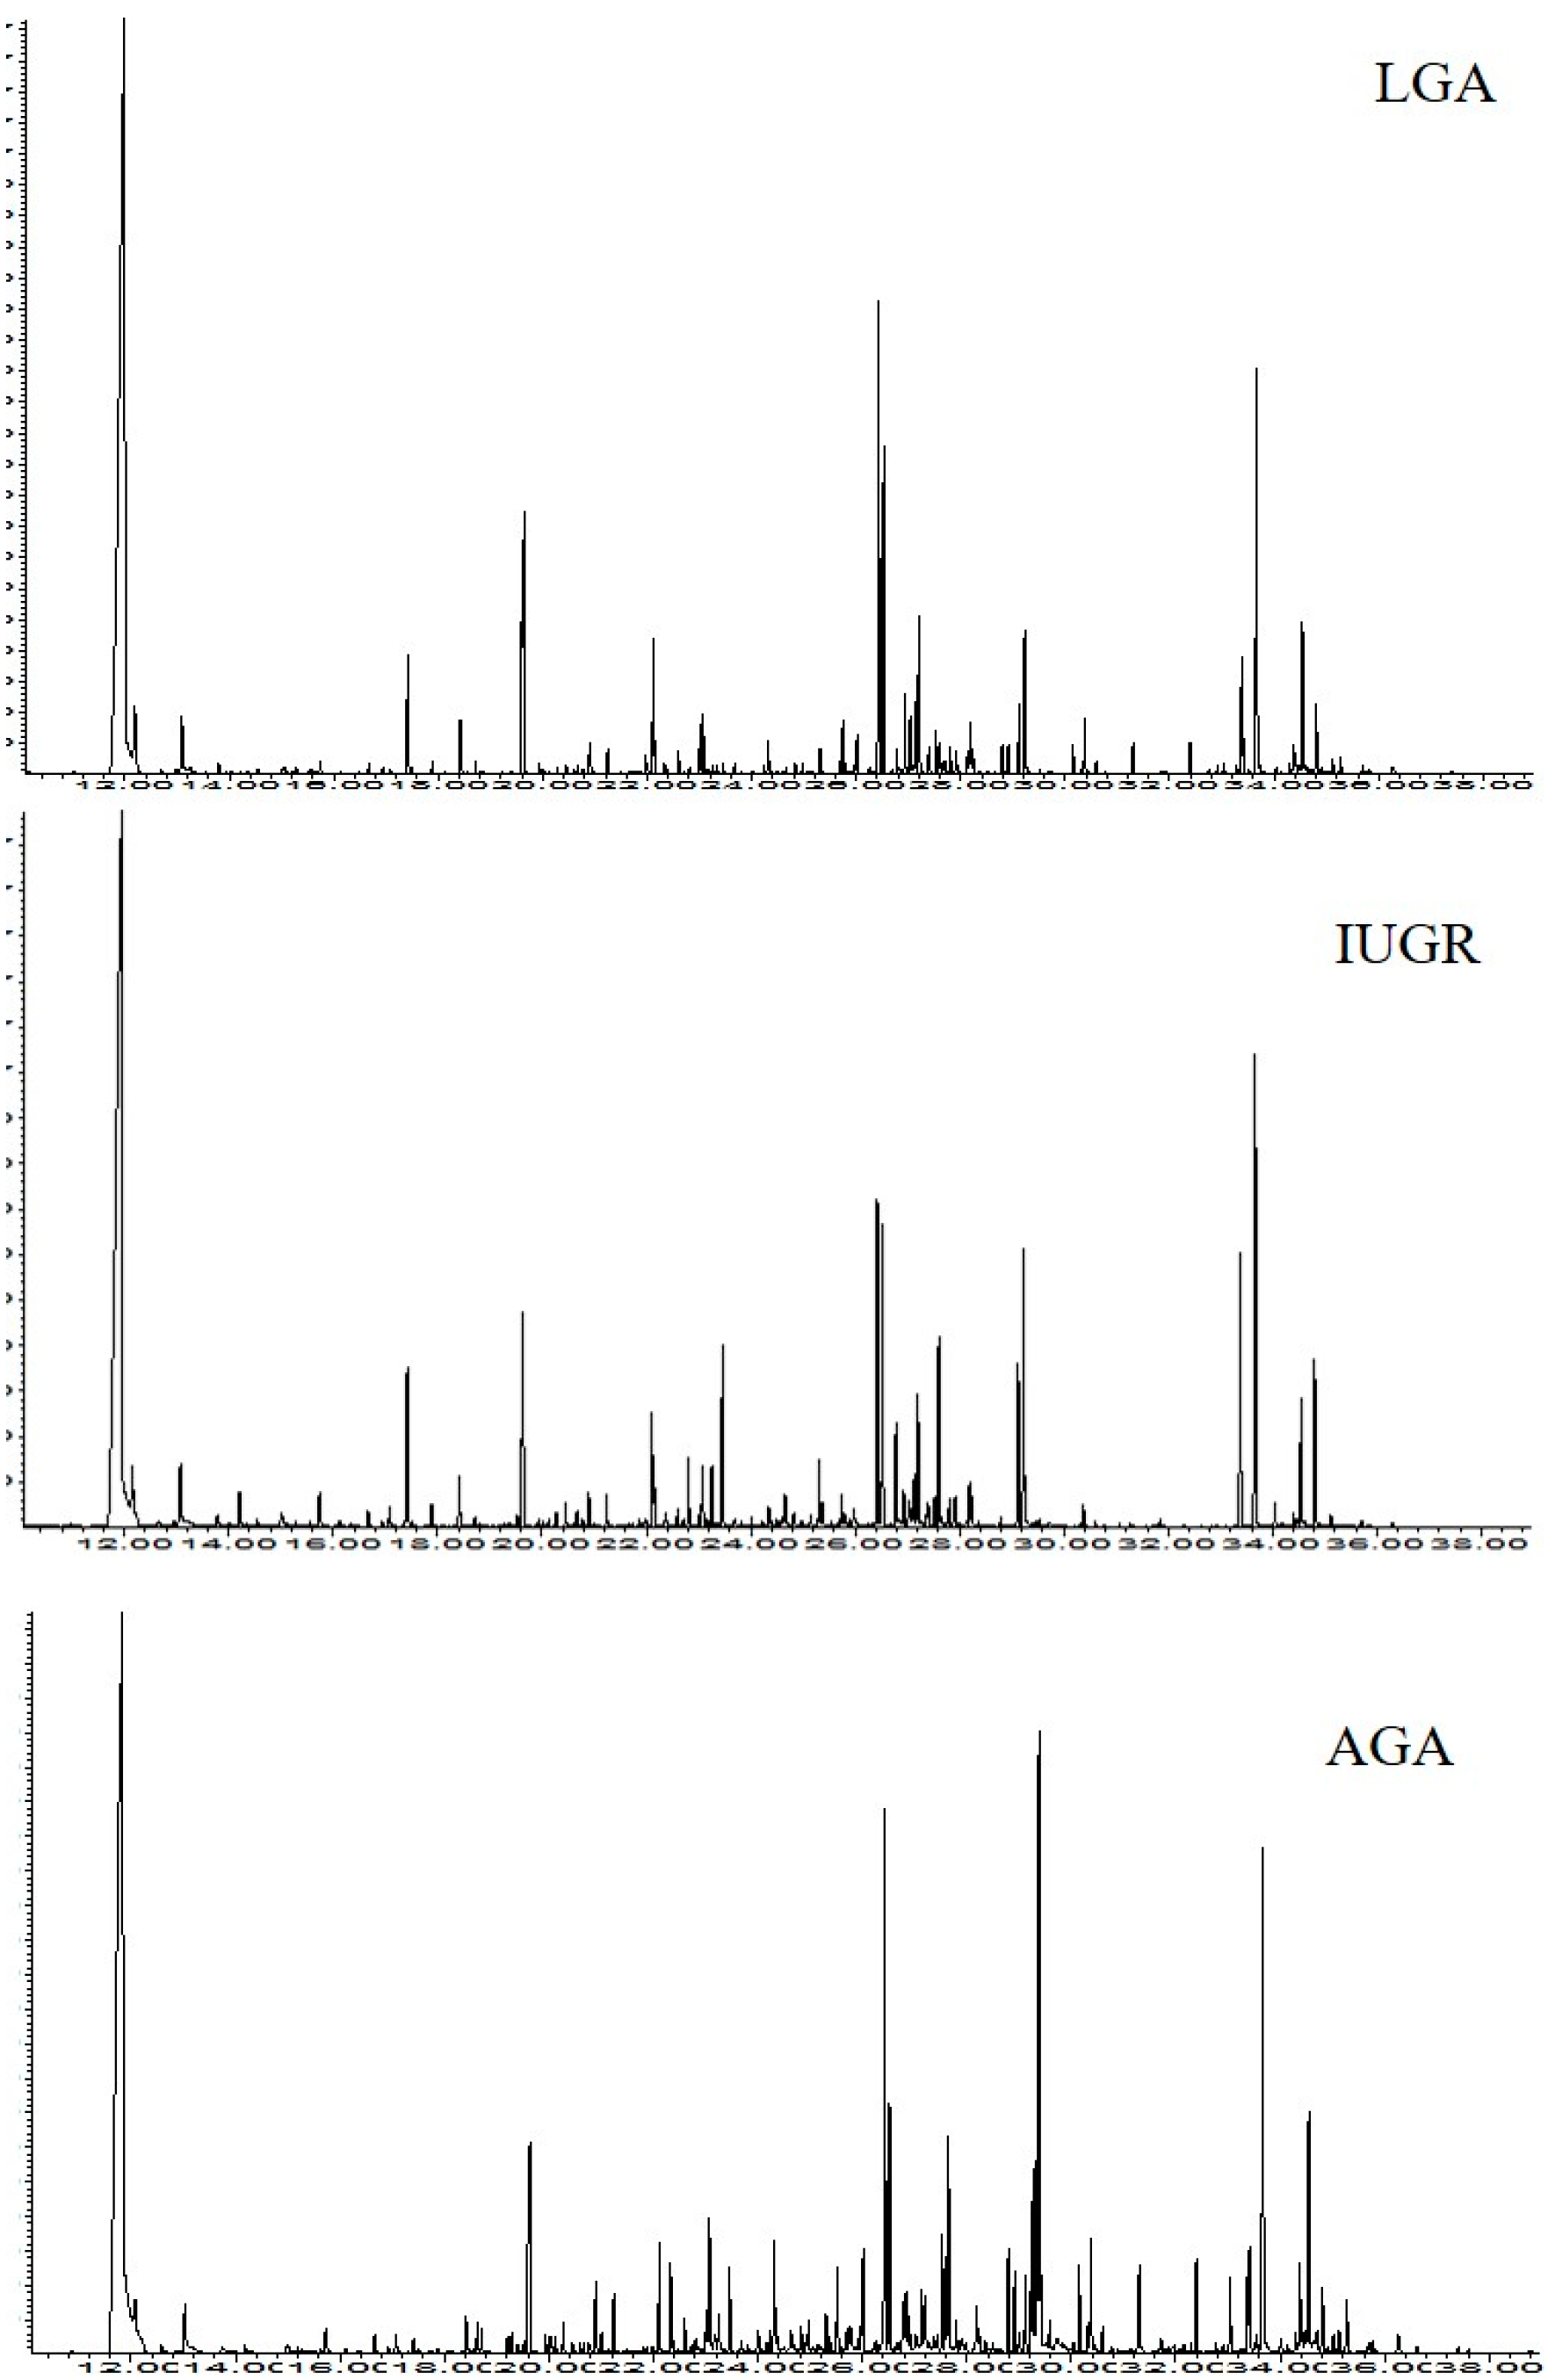
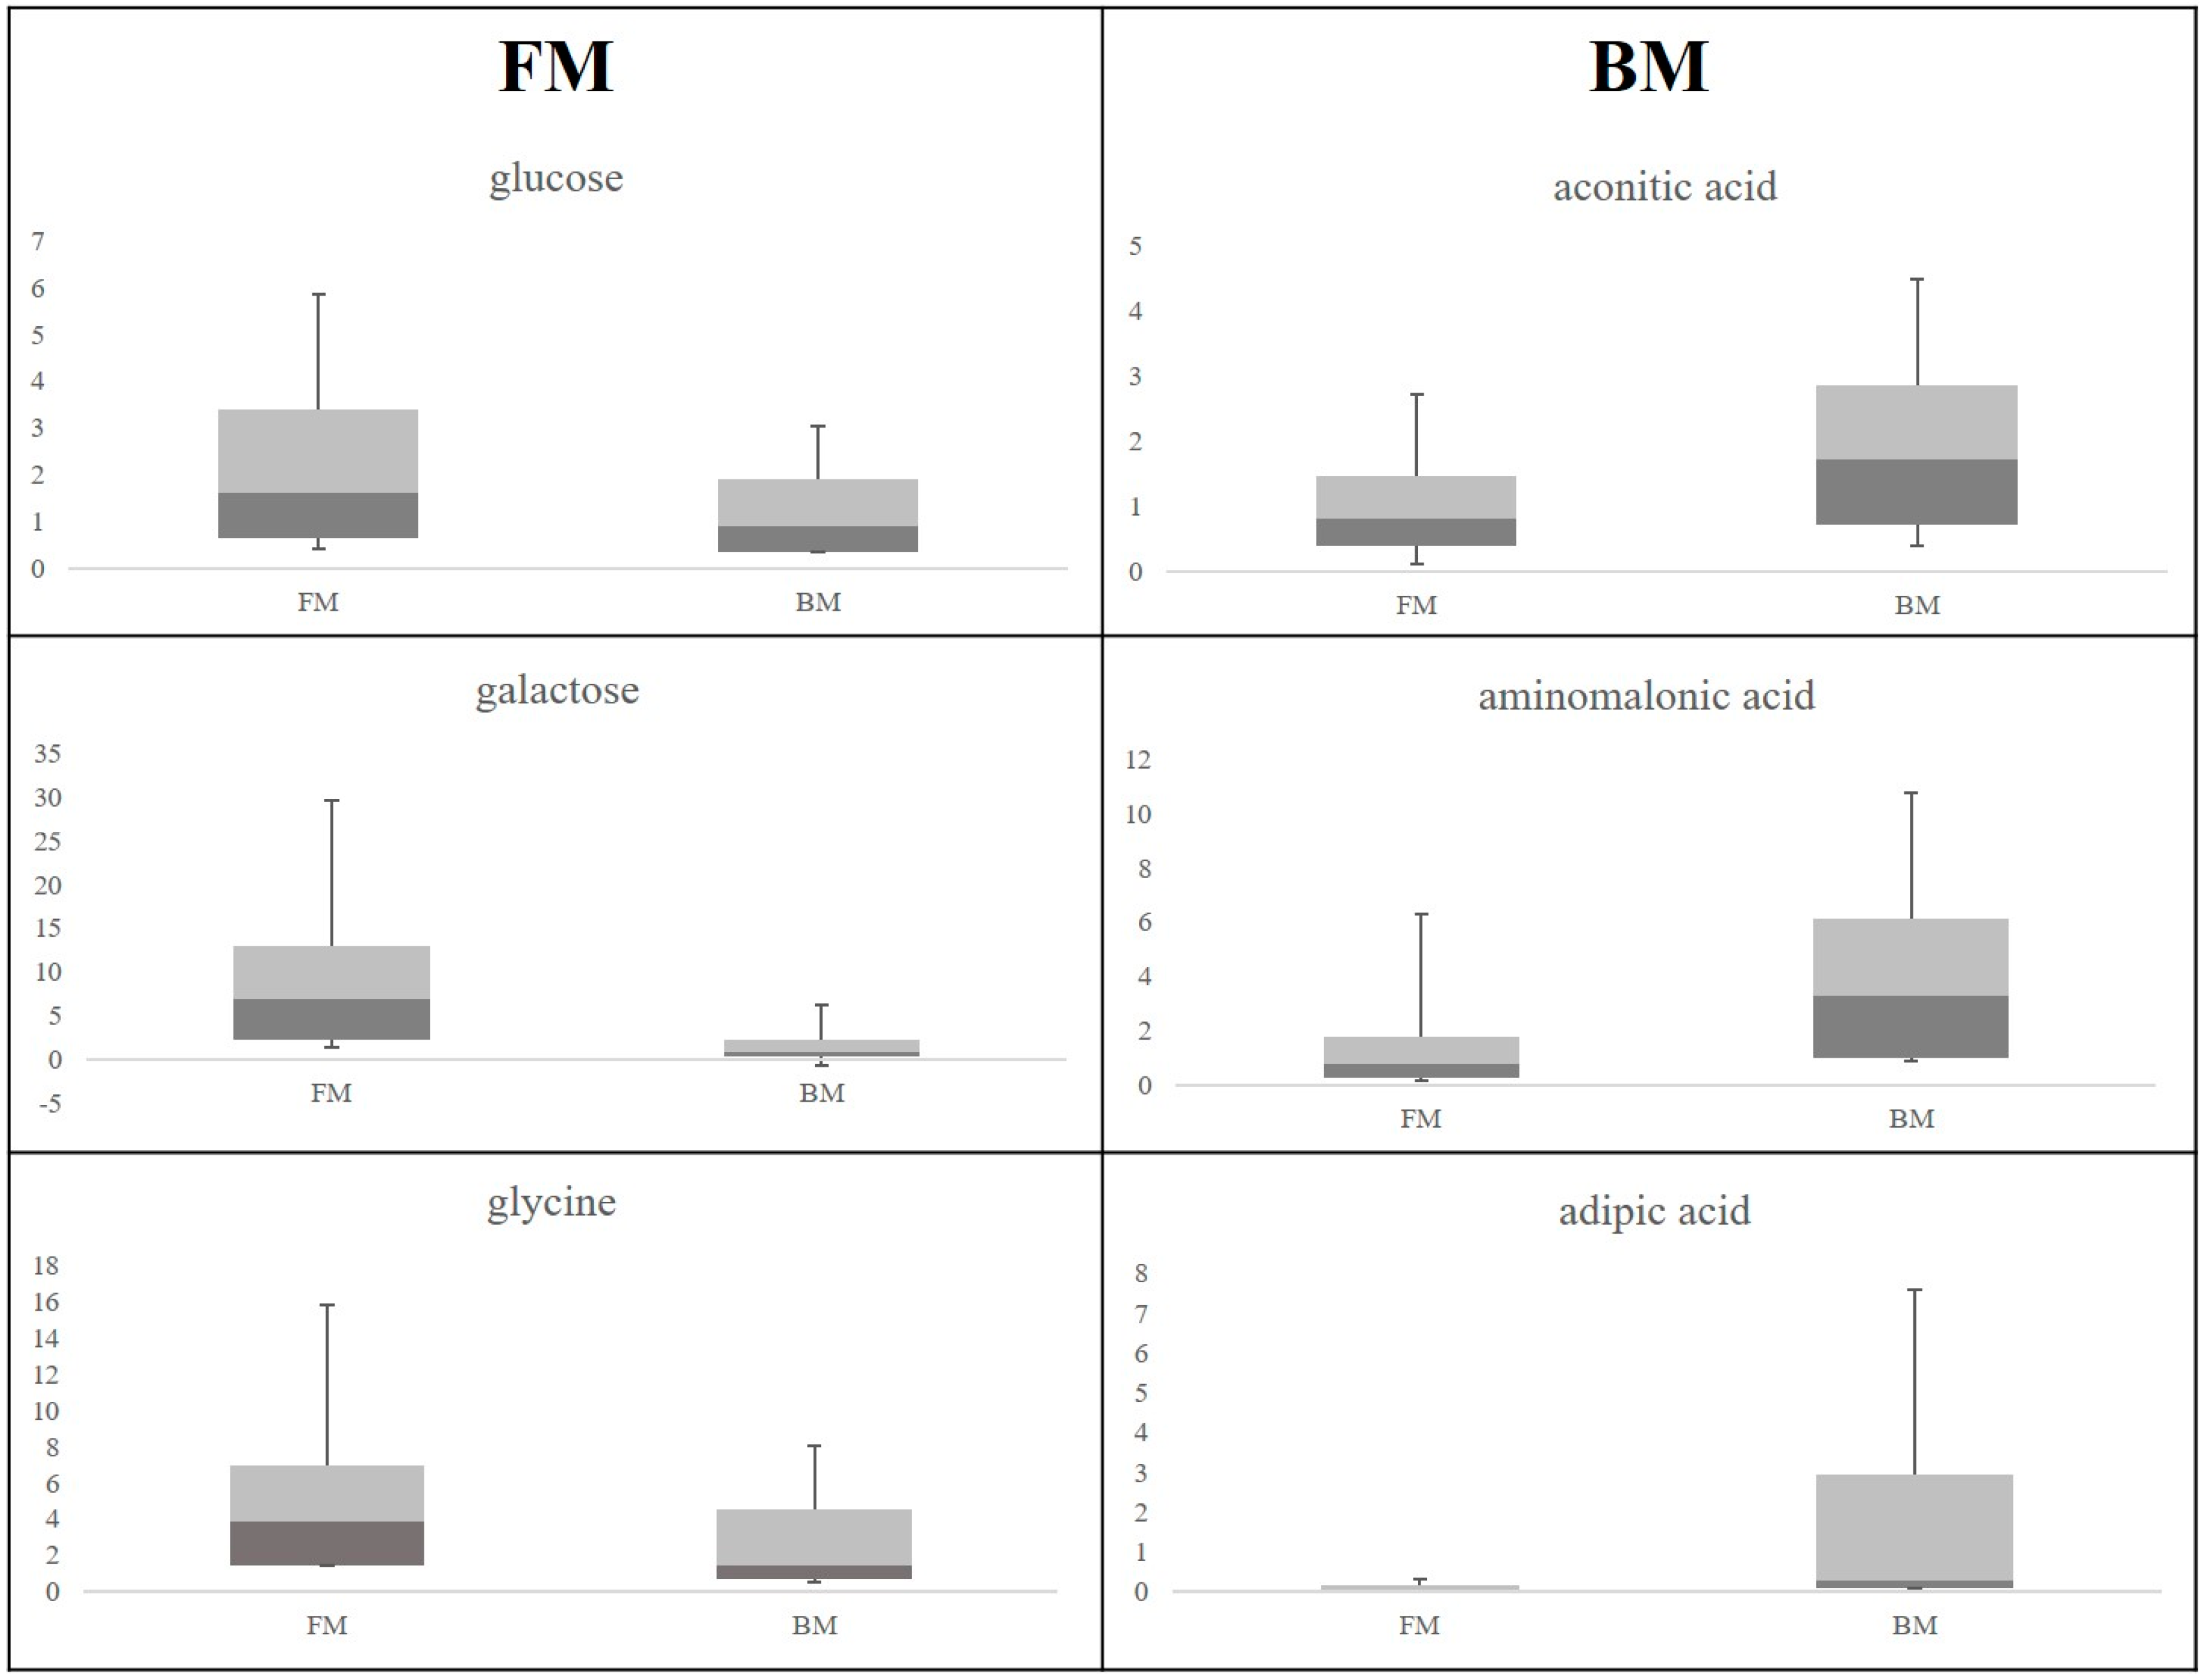
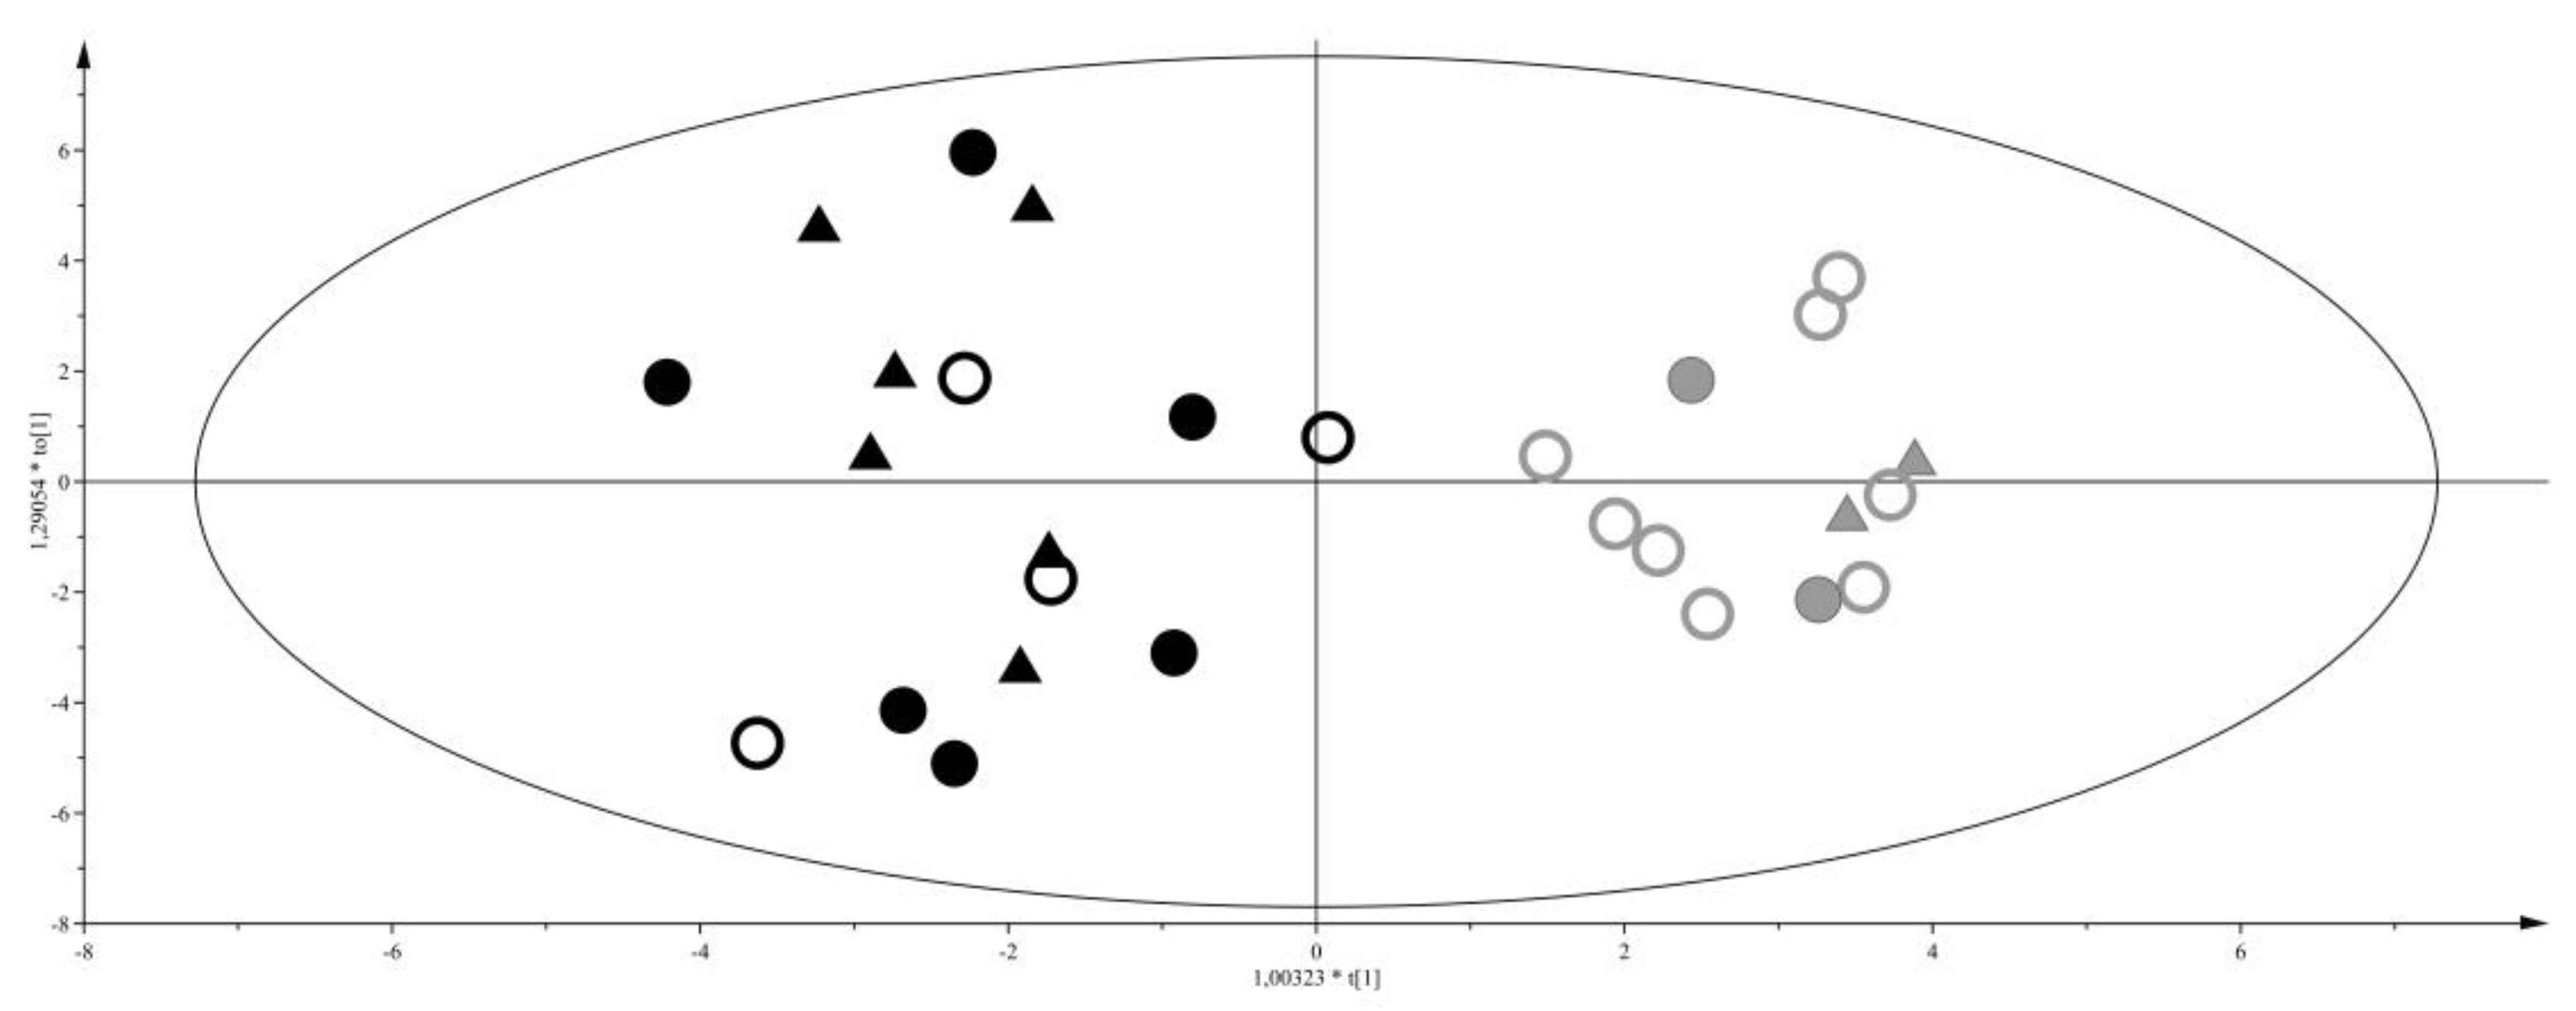
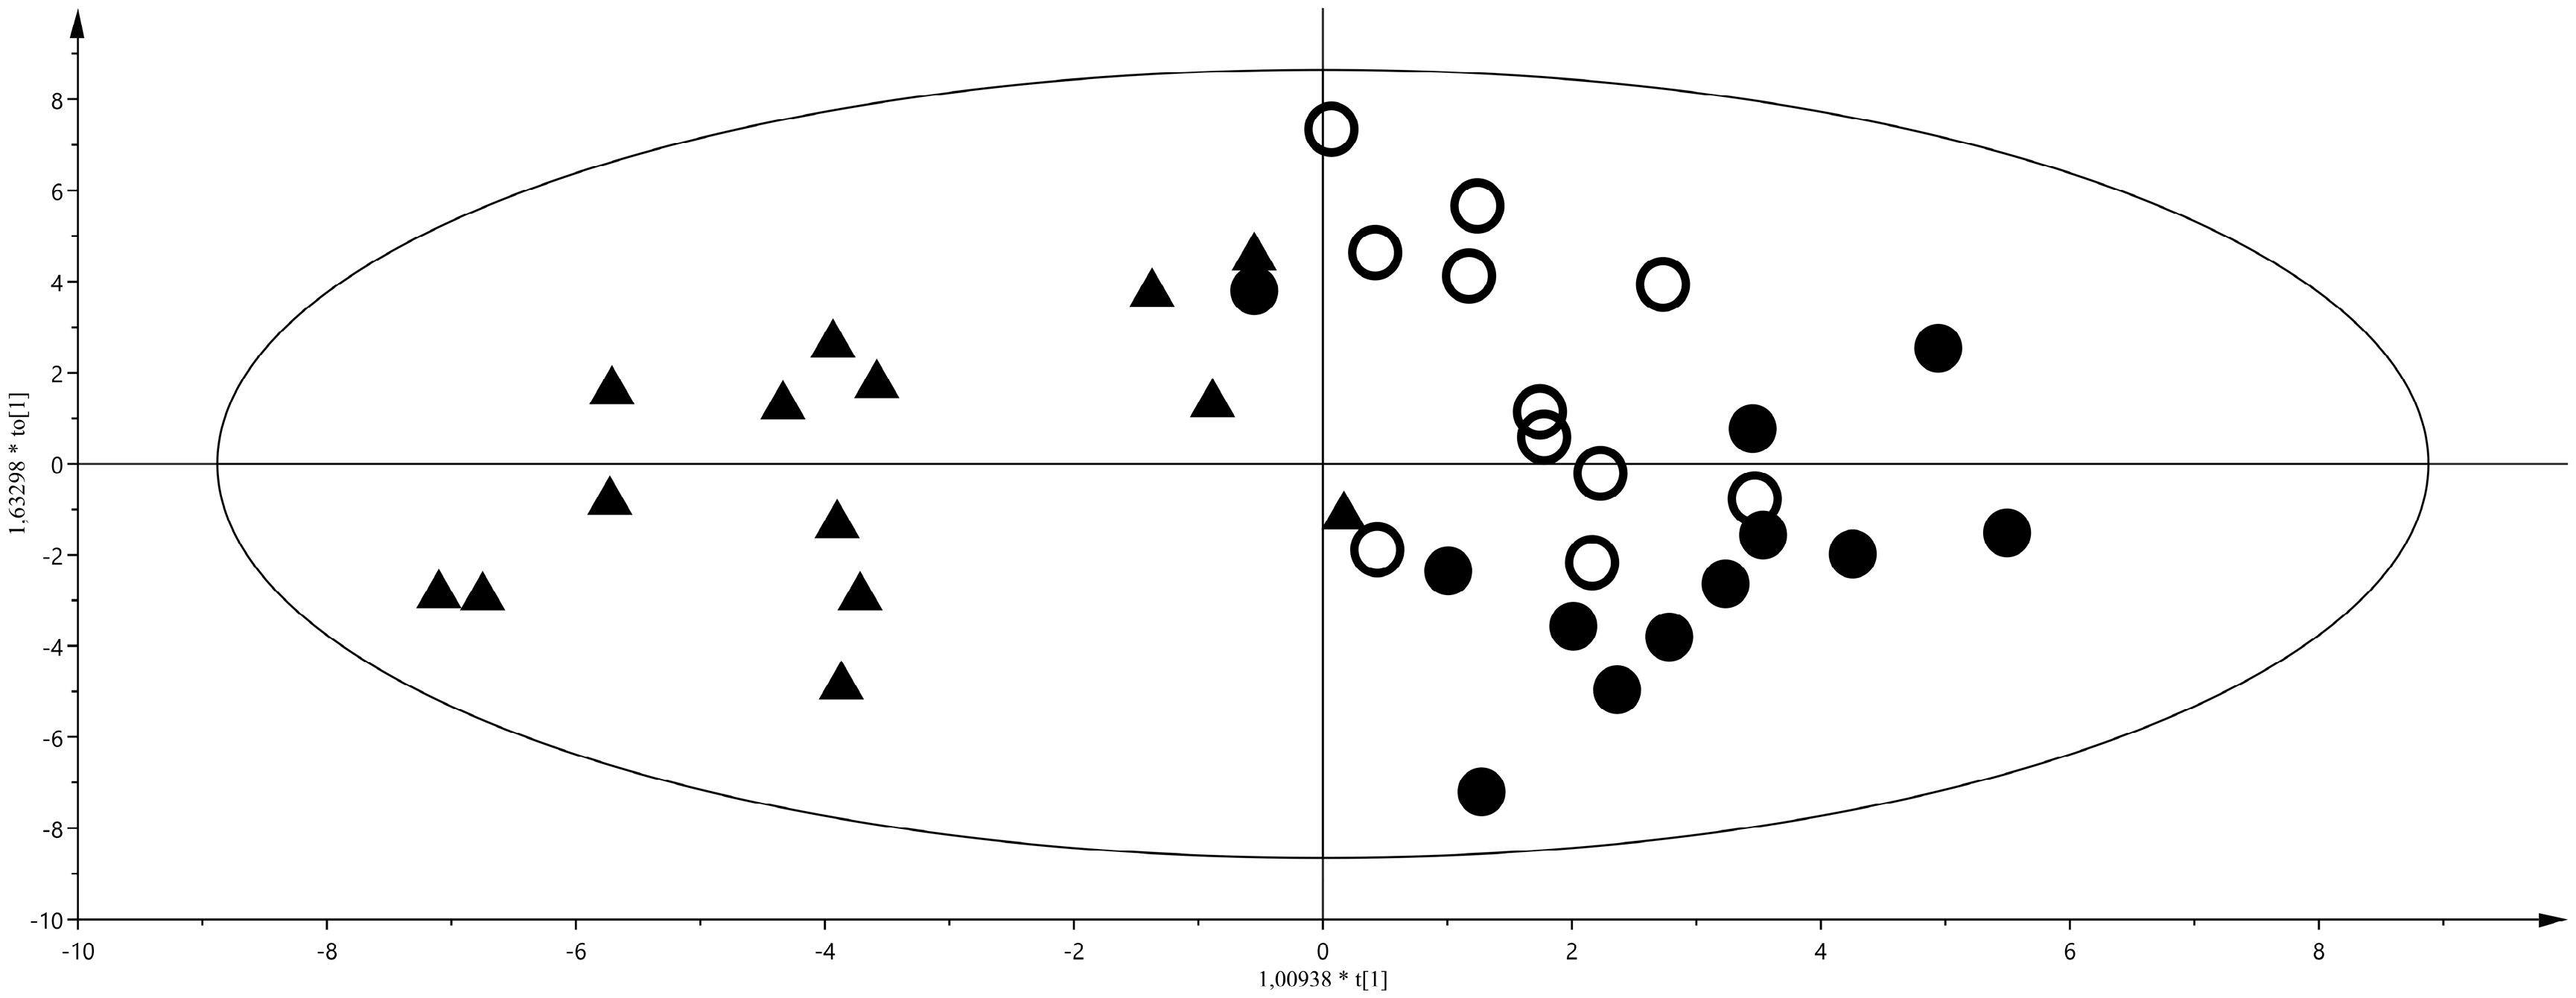
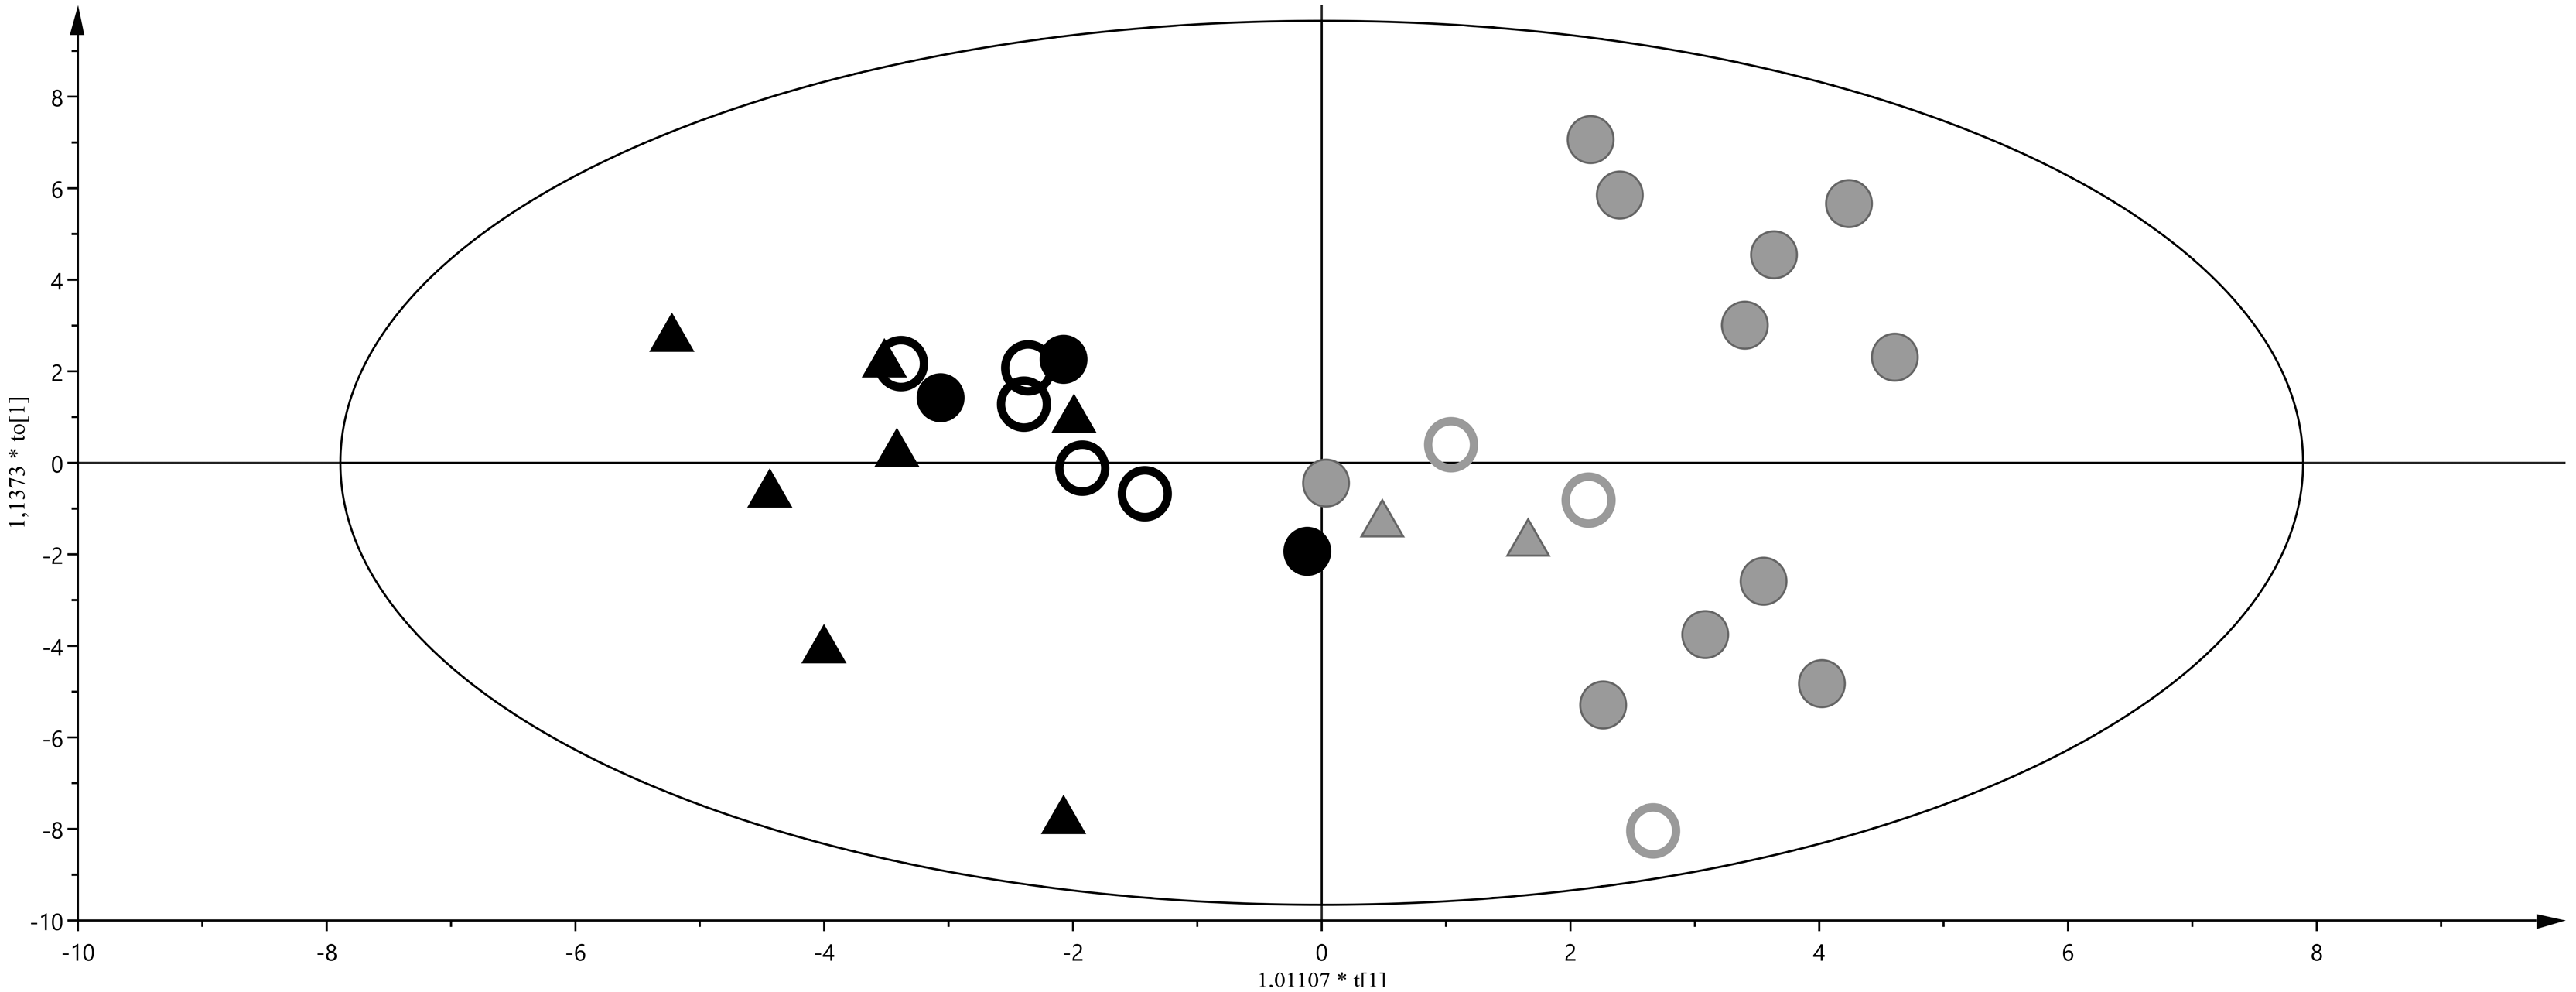
2. Results
3. Discussion
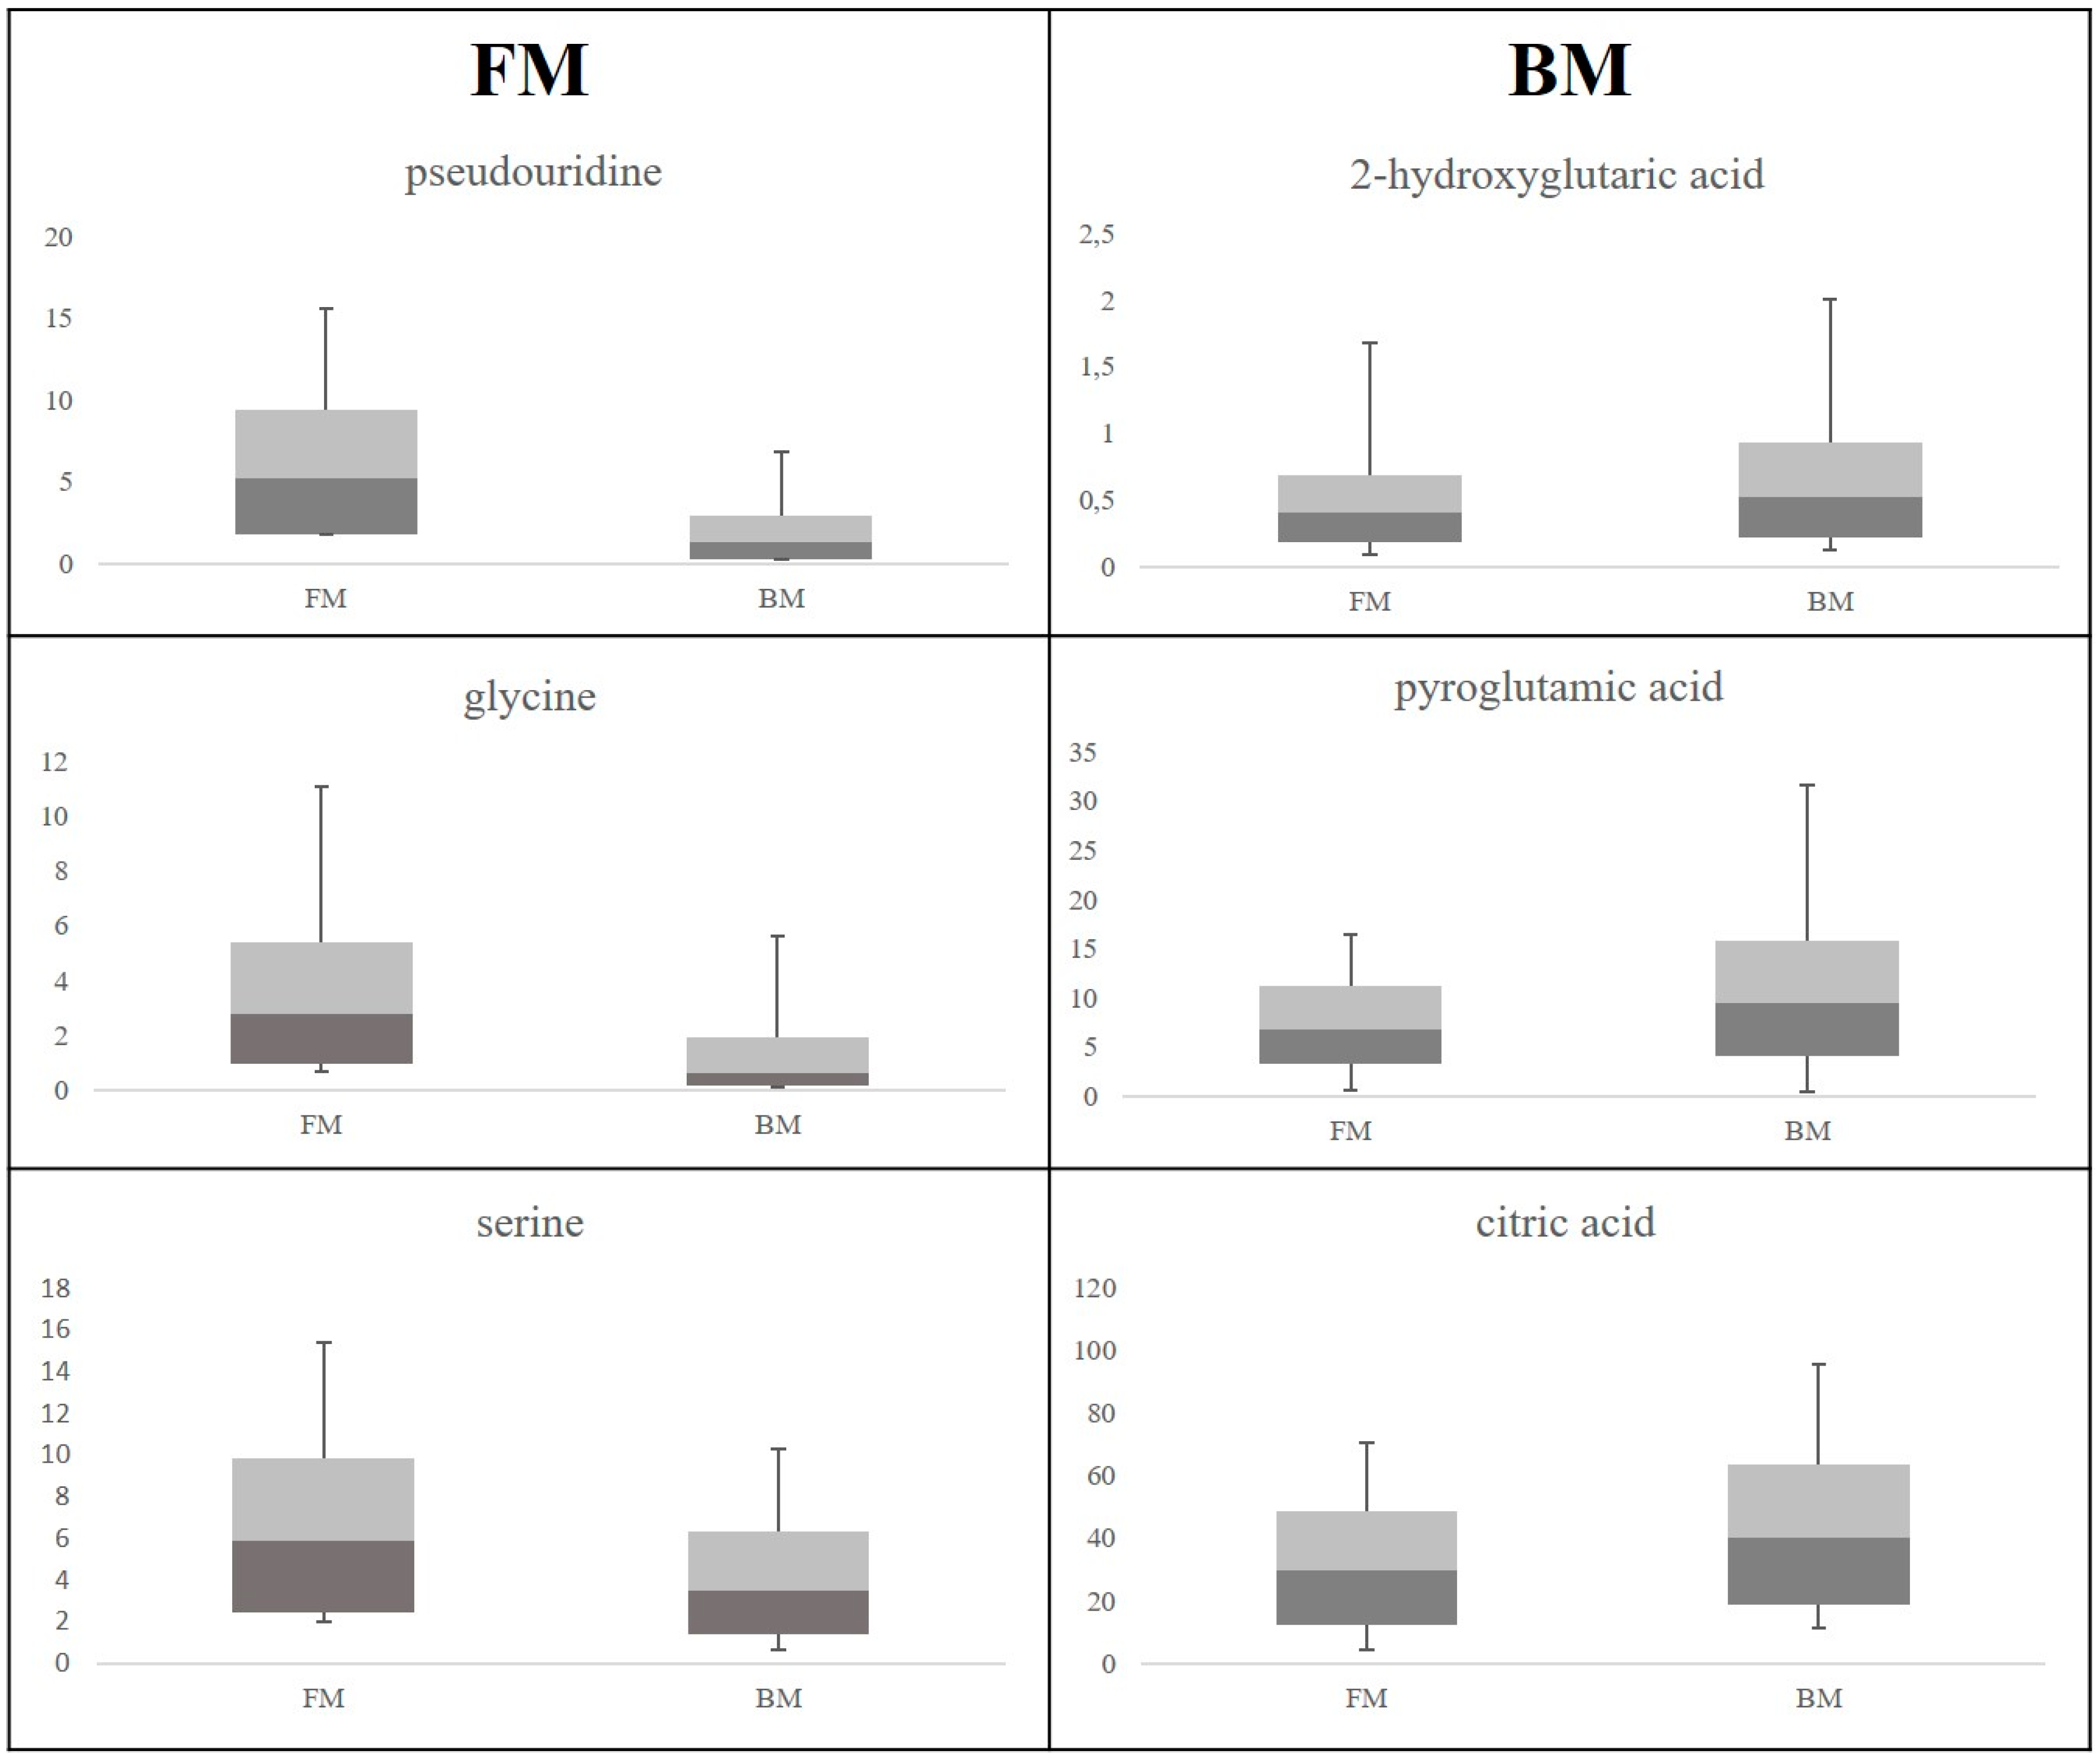
3.1. Discriminant Metabolites for the Different Feeding Regimes
3.2. Maternal Malnutrition and Consequences on Neonates’ Health
4. Experimental Section
4.1. Subjects
4.2. Chemicals
4.3. Urine Samples Collection and Preparation
4.4. GC-MS Analysis
4.5. Multivariate Data Analysis
5. Conclusions
Author Contributions
Conflicts of Interest
References
- Barker, D.J. Fetal origins of coronary heart disease. BMJ 1995, 311, 171–174. [Google Scholar] [CrossRef] [PubMed]
- Dessì, A.; Puddu, M.; Ottonello, G.; Fanos, V. Metabolomics and fetal-neonatal nutrition: Between “not enough” and “too much”. Molecules 2013, 18, 11724–11732. [Google Scholar] [CrossRef] [PubMed] [Green Version]
- Hales, C.N.; Barker, D.J. Type 2 (non-insulin-dependent) diabetes mellitus: The thrifty phenotype hypothesis. Diabetologia 1992, 35, 595–601. [Google Scholar] [CrossRef] [PubMed]
- Committee on Practice Bulletins Gynecology; American College of Obstetricians and Gynecologists. Intrauterine growth restriction. Clinical management guidelines for obstetrician-gynecologists. Int. J. Gynaecol. Obstet. 2001, 72, 85–96. [Google Scholar]
- Nicholson, J.K.; Connelly, J.; Lindon, J.C.; Holmes, E. Metabonomics: A platform for studying drug toxicity and gene function. Nat. Rev. Drug Discov. 2002, 1, 153–161. [Google Scholar] [CrossRef] [PubMed]
- Dessì, A.; Pravettoni, C.; Cesare Marincola, F.; Schirru, A.; Fanos, V. The biomarkers of fetal growth in intrauterine growth retardation and large for gestational age cases: From adipocytokines to a metabolomic all-in-one tool. Expert Rev. Proteom. 2015, 12, 309–316. [Google Scholar] [CrossRef] [PubMed]
- Dessì, A.; Cesare Marincola, F.; Masili, A.; Gazzolo, D.; Fanos, V. Clinical metabolomics and nutrition: The new frontier in neonatology and pediatrics. BioMed Res. Int. 2014, 2014, 981219. [Google Scholar] [CrossRef] [PubMed]
- Marincola, F.C.; Noto, A.; Caboni, P.; Reali, A.; Barberini, L.; Lussu, M.; Murgia, F.; Santoru, M.L.; Atzori, L.; Fanos, V. Metabolomic study of preterm human and formula milk by high resolution NMR and GC/MS analysis: Preliminary results. J. Matern. Fetal Neonatal Med. 2012, 25, 62–67. [Google Scholar] [CrossRef] [PubMed]
- Dessì, A.; Atzori, L.; Noto, A.; Visser, G.H.A.; Gazzolo, D.; Zanardo, V.; Barberini, L.; Puddu, M.; Ottonello, G.; Atzei, A.; et al. Metabolomics in newborns with intrauterine growth retardation (IUGR): Urine reveals markers of metabolic syndrome. J. Matern. Fetal Neonatal Med. 2011, 2, 35–39. [Google Scholar] [CrossRef] [PubMed]
- Horgan, R.P.; Broadhurst, D.I.; Dunn, W.B.; Brown, M.; Heazell, A.E.P.; Kell, D.B.; Baker, P.N.; Kenny, L.C. Changes in the metabolic footprint of placental explant-conditioned medium cultured in different oxygen tensions from placentas of small for gestational age and normal pregnancies. Placenta 2010, 31, 893–901. [Google Scholar] [CrossRef] [PubMed]
- Logan, K.M.; Wijeyesekera, A.D.; Perez, I.G.; Hyde, M.J.; Romero, M.G.; Jeffries, S.; Andreas, N.; Gale, C.; Holmes, E.; Modi, N. Infants of Mothers with Diabetes Have Altered Urinary Metabolic Profile at Birth. In Proceedings of the Neonatal Society 2012 Summer Meeting, Canterbury, UK, 21–22 June 2012.
- Favretto, D.; Cosmi, E.; Ragazzi, E.; Visentin, S.; Tucci, M.; Fais, P.; Cecchetto, G.; Zanardo, V.; Viel, G.; Ferrara, S.D. Cord blood metabolomic profiling in intrauterine growth restriction. Anal. Bioanal. Chem. 2012, 402, 1109–1121. [Google Scholar] [CrossRef] [PubMed]
- Dessì, A.; Marincola, F.C.; Fanos, V. Metabolomics and the great obstetrical syndromes—GDM, PET, and IUGR. Best Pract. Res. Clin. Obstet. Gynaecol. 2015, 2, 156–164. [Google Scholar] [CrossRef] [PubMed]
- Taylor, S.N.; Basile, L.A.; Ebeling, M.; Wagner, C.L. Intestinal permeability in preterm infants by feeding type: Mother’s milk versus formula. Breastfeed. Med. 2009, 4, 11–15. [Google Scholar] [CrossRef] [PubMed]
- Alm, J.; Hagenfeldt, L.; Larsson, A. Concentrations of organic acids in the urine of healthy newborn children. Ann. Clin. Biochem. 1978, 15, 245–249. [Google Scholar] [CrossRef] [PubMed]
- Gregersen, N.; Ingerslev, J.; Rasmussen, K. Low molecular weight organic acids in the urine of the newborn. Acta Paediatr. Scand. 1977, 66, 85–89. [Google Scholar] [CrossRef] [PubMed]
- Ibarra, R.; Dazard, J.E.; Sandlers, Y.; Rehman, F.; Abbas, R.; Kombu, R.; Zhang, G.F.; Brunengraber, H.; Sanabria, J. Metabolomic analysis of liver tissue from the VX2 rabbit model of secondary liver tumors. HPB Surg. 2014, 2014, 310372. [Google Scholar] [CrossRef] [PubMed]
- Gates, S.C.; Sweeley, C.C.; KrIvIt, W.; DeWitt, D.; Blaisdell, B.E. Automated metabolic profiling of organic acids in human urine. II. Analysis of urine samples from “healthy” adults, sick children, and children with neuroblastoma. Clin. Chem. 1978, 24, 1680–1689. [Google Scholar] [PubMed]
- Marincola, F.C.; Dessì, A.; Corbu, S.; Reali, A.; Fanos, V. Clinical impact of human breast milk metabolomics. Clin. Chim. Acta 2015, 451, 28–34. [Google Scholar] [CrossRef] [PubMed]
- Labbok, M.H. Effects of breastfeeding on the mother. Pediatr. Clin. N. Am. 2001, 48, 143–158. [Google Scholar] [CrossRef]
- Friesen, R.W.; Novak, E.M.; Hasman, D.; Innis, S.M. Relationship of dimethylglycine, choline, and betaine with oxoproline in plasma of pregnant women and their newborn infants. J. Nutr. 2007, 137, 2641–2646. [Google Scholar] [PubMed]
- Martin, R.M.; Gunnell, D.; Smith, G.D. Breastfeeding in infancy and blood pressure in later life: Systematic review and meta-analysis. Am. J. Epidemiol. 2005, 161, 15–26. [Google Scholar] [CrossRef] [PubMed]
- Jackson, A.A.; Persaud, C.; Hall, M.; Smith, S. Urinary excretion of 5-l-oxoproline (pyroglutamic acid) during early life in term and preterm infants. Arch. Dis. Child. Fetal Neonatal Ed. 1997, 3, 152–157. [Google Scholar] [CrossRef]
- Fanos, V.; Puddu, M.; Reali, A.; Atzei, A.; Zaffanello, M. Perinatal nutrient restriction reduces nephron endowment increasing renal morbidity in adulthood: A review. Early Hum. Dev. 2010, 86, 37–42. [Google Scholar] [CrossRef] [PubMed]
- Dessì, A.; Ottonello, G.; Fanos, V. Physiopathology of intrauterine growth retardation: From classic data to metabolomics. J. Matern. Fetal Neonatal Med. 2012, 5, 13–18. [Google Scholar] [CrossRef] [PubMed]
- Ju, H.; Chadha, Y.; Donovan, T.; O’Rourke, P. Fetal Macrosomia and pregnancy outcomes. J. Obstet. Gynaecol. 2009, 49, 504–509. [Google Scholar] [CrossRef] [PubMed]
- Lawson, A.M.; Chalmers, R.A.; Watts, R.W. Urinary organic acids in man. I. Normal patterns. Clin. Chem. 1976, 22, 1283–1287. [Google Scholar] [PubMed]
- Su, T.; Xin, L.; He, Y.G.; Wei, Y.; Song, Y.X.; Li, W.W.; Wang, X.M.; He, R.Q. The abnormally high level of uric d-ribose for type-2 diabetics. Prog. Biochem. Biophys. 2013, 40, 816–825. [Google Scholar] [CrossRef]
- Fitzhardinge, P.M.; Steven, E.M. The small for date infant. II. Neurological and intellectual sequelae. Pediatrics 1972, 50, 50–57. [Google Scholar] [CrossRef] [PubMed]
- Hadders-Agra, M.; Huisjes, H.J.; Touwen, B.C. Preterm or small for gestational age infants. Neurological and behavioural development at the age of 6 years. Eur. J. Pediatr. 1988, 147, 460–467. [Google Scholar] [CrossRef]
- Barberini, L.; Noto, A.; Fattuoni, C.; Grapov, D.; Casanova, A.; Fenu, G.; Gaviano, M.; Carboni, R.; Ottonello, G.; Crisafulli, M.; et al. Urinary metabolomics (GC-MS) reveals that low and high birth weight infants share elevated inositol concentrations at birth. J. Matern. Fetal Neonatal Med. 2014, 2, 20–26. [Google Scholar] [CrossRef] [PubMed] [Green Version]
- Dessì, A.; Marincola, F.C.; Pattumelli, M.G.; Ciccarelli, S.; Corbu, S.; Ossicini, C.; Fanos, V.; Agostino, R. Investigation of the ¹H-NMR based urine metabolomic profiles of IUGR, LGA and AGA newborns on the first day of life. J. Matern. Fetal Neonatal Med. 2014, 2, 13–19. [Google Scholar] [CrossRef] [PubMed]
- Dessì, A.; Fanos, V. Myoinositol: A new marker of intrauterine growth restriction? J. Obstet. Gynaecol. 2013, 8, 776–780. [Google Scholar] [CrossRef] [PubMed]
- Neuberger, A. The metabolism of glycine and serine. Comp. Biochem. 1981, 19, 257–303. [Google Scholar]
- Gannon, M.C.; Nuttall, J.A.; Nuttall, F.Q. The metabolic response to ingested glycine. Am. J. Clin. Nutr. 2002, 6, 1302–1307. [Google Scholar]
- O'Donovan, D.J.; Fernandes, C.J. Free radicals and diseases in premature infants. Antioxid. Redox Signal. 2004, 1, 169–176. [Google Scholar] [CrossRef] [PubMed]
- Saugstad, O.D. Bronchopulmonary dysplasia-oxidative stress and antioxidants. Semin. Neonatol. 2003, 1, 39–49. [Google Scholar] [CrossRef]
- Dani, C.; Cecchi, A.; Bertini, G. Role of oxidative stress as physiopathologic factor in the preterm infant. Minerva Pediatr. 2004, 4, 381–394. [Google Scholar]
- Njålsson, R.; Norgren, S. Physiological and pathological aspects of GSH metabolism. Acta Paediatr. 2005, 2, 132–137. [Google Scholar] [CrossRef]
- Jain, A.; Mehta, T.; Auld, P.A.; Rodrigues, J. Glutathione metabolism in newborns: Evidence for glutathione deficiency in plasma bronchoaveolar lavage fluid, and lymphocytes in prematures. Pediatr. Pulmonol. 1995, 20, 160–166. [Google Scholar] [CrossRef] [PubMed]
- Mabrouk, G.M.; Jois, M.; Brosnan, J.T. Cell signalling and the hormonal stimulation of the hepatic glycine cleavage enzyme system by glucagon. Biochem. J. 1998, 330, 759–763. [Google Scholar] [CrossRef] [PubMed]
- Yu, Y.M.; Ryan, C.M.; Fei, Z.W.; Lu, X.M.; Castillo, L.; Schultz, J.T.; Tompkins, R.G.; Young, V.R. Plasma l-5-oxoproline kinetics and whole blood glutathione synthesis rates in severely burned adult humans. Am. J. Physiol. Endocrinol. Metab. 2002, 282, 247–258. [Google Scholar] [CrossRef] [PubMed]
- Persaud, C.; Forrester, T.; Jackson, A. Urinary excretion of 5-l-oxoproline (pyroglutamic acid) is increased during recovery from severe childhood malnutrition and responds to supplemental glycine. J. Nutr. 1996, 126, 2823–2830. [Google Scholar] [PubMed]
- Topp, H.; Fusch, G.; Schöch, G.; Fusch, C. Noninvasive markers of oxidative DNA stress, RNA degradation and protein degradation are differentially correlated with resting metabolic rate and energy intake in children and adolescents. Pediatr. Res. 2008, 64, 246–250. [Google Scholar] [CrossRef] [PubMed]
- Dzúrik, R.; Spustová, V.; Lajdová, I. Inhibition of glucose utilization in isolated rat soleus muscle by pseudouridine: Implications for renal failure. Nephron 1993, 65, 108–110. [Google Scholar] [PubMed]
- Eriksson, L.; Johansson, E.; Kettaneh-Wold, N.; Trygg, J.; Wikström, C.; Wold, S. Multi- and Megavariate Data Analysis; Umetrics Academy: Umeå, Sweden, 2013. [Google Scholar]


| Compound | Rt (min) | EI-MS, m/z (amu) (% Relative Abundance) | Trivial Name | Abbr |
|---|---|---|---|---|
| Alanine | 16.72 | 116 (100), 73 (50), 147 (30) | alanine | ALA |
| Glycine (2 TMS) | 17.14 | 102 (100), 73 (50), 147 (45) | glycine (2 TMS) | GLY2 |
| Oxalic acid | 17.48 | 147 (100), 73 (80), 133 (50) | oxalic acid | OXA |
| 3-Hydroxybutanoic acid | 17.86 | 147 (100), 73 (50), 117 (45) | 3-hydroxybutyric acid | 3HBA |
| Benzoic acid | 19.36 | 179 (100), 105 (64), 135 (55) | benzoic acid | BA |
| Glycine (3 TMS) | 20.23 | 174 (100), 73 (50), 248 (47) | glycine (3 TMS) | GLY3 |
| Butanedioic acid | 20.37 | 147 (100), 73 (50), 247 (45) | succinic acid | BUA |
| 2,3-Dihydroxypropanoic acid | 20.54 | 171 (100), 100 (50), 292 (45) | glyceric acid | GLYA |
| 2,3-Dihydroxybutanoic acid | 20.72 | 73 (100), 292 (50), 147 (45) | 2,3-dihydroxybutyric acid | DHB |
| Serine | 20.99 | 204 (100), 73 (70), 218 (65) | serine | SER |
| Threonine | 21.33 | 73 (100), 218 (94), 291 (50) | threonine | THR |
| Unknown 1 | 21.70 | 103 (100), 73 (90), 219 (60) | U1 | |
| 3,4-Dihydroxybutanoic acid | 21.97 | 73 (100), 233 (60), 147 (50) | 2-deoxytetronic acid | DOT A |
| Homoserine | 22.21 | 218 (100), 73 (50), 128 (50) | homoserine | HOMO |
| Aminomalonic acid | 22.49 | 147 (100), 73 (95), 218 (90) | aminomalonic acid | AMIN A |
| Unknown 2 | 22.57 | 158 (100), 68 (50), 147 (45) | U2 | |
| Unknown 3 | 22.92 | 73 (100), 217 (90), 147 (80) | U3 | |
| Hexanedioic acid | 22.99 | 73 (100), 111 (68), 147 (50) | adipic acid | HA |
| Aspartic acid | 23.12 | 232 (100), 73 (90), 100 (40) | aspartic acid | ASP A |
| 5-Oxo-1-proline | 23.19 | 156 (100), 73 (50), 147(40) | pyroglutamic acid | PYR A |
| 2,3,4-Trihydroxybutanoic acid | 23.39 | 73 (100), 292 (90), 147 (50) | threonic acid | THR A |
| 2-Hydroxypentanedioic acid | 23.80 | 129 (100), 147 (90), 247 (80) | 2-hydroxyglutaric acid | HGLU A |
| Unknown 4 | 24.34 | 73 (100), 231 (90), 147 (43) | U4 | |
| Phenylalanine | 24.46 | 333 (100), 73 (80), 218 (40) | phenylalanine | PHEN |
| Unknown 5 | 24.50 | 73 (100), 200 (80), 267 (70) | U5 | |
| Unknown 6 | 24.79 | 73 (100), 103 (60), 217 (50) | U6 | |
| Ribose | 24.94 | 73 (100), 205 (50), 147 (40) | ribose | RIB |
| Unknown 7 | 25.08 | 73 (100), 147 (90), 247 (70) | U7 | |
| Xylitol | 25.44 | 73 (100), 217 (90), 307 (55) | xylitol | XYL |
| Fucose | 25.5 | 117 (100), 73 (90), 217 (76) | fucose | FUC |
| Unknown 8 | 25.67 | 73 (100), 117 (90), 160 (30) | U8 | |
| 1-Propene-1,2,3-tricarboxylic acid | 25.83 | 73 (100), 147 (90), 229 (50) | aconitic acid | ACO A |
| Unknown 9 | 25.93 | 73 (100), 292 (70), 357 (40) | U9 | |
| 1,2,3-Propanetricarboxylic acid | 26.58 | 273 (100), 147 (60), 73 (60) | citric acid | CIT A |
| Unknown 10 | 26.93 | 73 (100), 217 (92), 147 (70) | U10 | |
| Galactose | 27.29 | 73 (100), 319 (90), 205 (60) | galactose | GAL |
| Glucose | 27.52 | 73 (100), 319 (72), 205 (54) | glucose | GLU |
| Unknown 11 | 27.75 | 333 (100), 73 (58), 160 (43) | U11 | |
| Unknown 12 | 28.04 | 373 (100), 73 (90), 358 (70) | U12 | |
| Hexadecanoic acid | 28.95 | 313 (100), 117 (90), 73 (90) | palmitic acid | HEX A |
| Unknown 13 | 29.16 | 73 (100), 103 (43), 244 (28) | U13 | |
| Myo-inositol | 29.29 | 305 (100), 217 (90), 73 (53) | myoinositol | MYO |
| Octadecanoic acid | 30.75 | 341 (100), 205 (98), 117 (76) | stearic acid | OCT A |
| Pseudouridine | 31.43 | 217 (100), 73 (50), 357 (40) | pseudouridine | PURID |
| Unknonwn 14 | 31.87 | 73 (100), 217 (50), 246 (49) | U14 | |
| Unknonwn 15 | 32.01 | 217 (100), 73 (55), 147 (40) | U15 | |
| Unknonwn 16 | 32.44 | 285 (100), 73 (55), 186 (40) | U16 | |
| 2,3-Dihydroxy hexadecanoic acid | 33.52 | 371 (100), 73 (40), 147 (40) | 2,3-dihydroxyhexadecanoic acid | DHH A |
| Glucopyranoside | 33.82 | 217 (100), 73 (90), 147 (60) | glucopyranoside | GPYR |
| Unknonwn 17 | 34.21 | 204 (100), 73 (90), 361 (80) | U17 | |
| Unknonwn 18 | 34.33 | 204 (100), 73 (90), 361 (80) | U18 | |
| Unknonwn 19 | 34.71 | 204 (100), 73 (70), 361 (62) | U19 | |
| 2,3-Dihydroxy octadecanoic acid | 34.95 | 73 (100), 191 (90), 361 (70) | 2,3-dihydroxy octadecanoic acid | DHO A |
© 2016 by the authors; licensee MDPI, Basel, Switzerland. This article is an open access article distributed under the terms and conditions of the Creative Commons by Attribution (CC-BY) license (http://creativecommons.org/licenses/by/4.0/).
Share and Cite
Dessì, A.; Murgia, A.; Agostino, R.; Pattumelli, M.G.; Schirru, A.; Scano, P.; Fanos, V.; Caboni, P. Exploring the Role of Different Neonatal Nutrition Regimens during the First Week of Life by Urinary GC-MS Metabolomics. Int. J. Mol. Sci. 2016, 17, 265. https://doi.org/10.3390/ijms17020265
Dessì A, Murgia A, Agostino R, Pattumelli MG, Schirru A, Scano P, Fanos V, Caboni P. Exploring the Role of Different Neonatal Nutrition Regimens during the First Week of Life by Urinary GC-MS Metabolomics. International Journal of Molecular Sciences. 2016; 17(2):265. https://doi.org/10.3390/ijms17020265
Chicago/Turabian StyleDessì, Angelica, Antonio Murgia, Rocco Agostino, Maria Grazia Pattumelli, Andrea Schirru, Paola Scano, Vassilios Fanos, and Pierluigi Caboni. 2016. "Exploring the Role of Different Neonatal Nutrition Regimens during the First Week of Life by Urinary GC-MS Metabolomics" International Journal of Molecular Sciences 17, no. 2: 265. https://doi.org/10.3390/ijms17020265