2.1. Generation Transgenic Mice
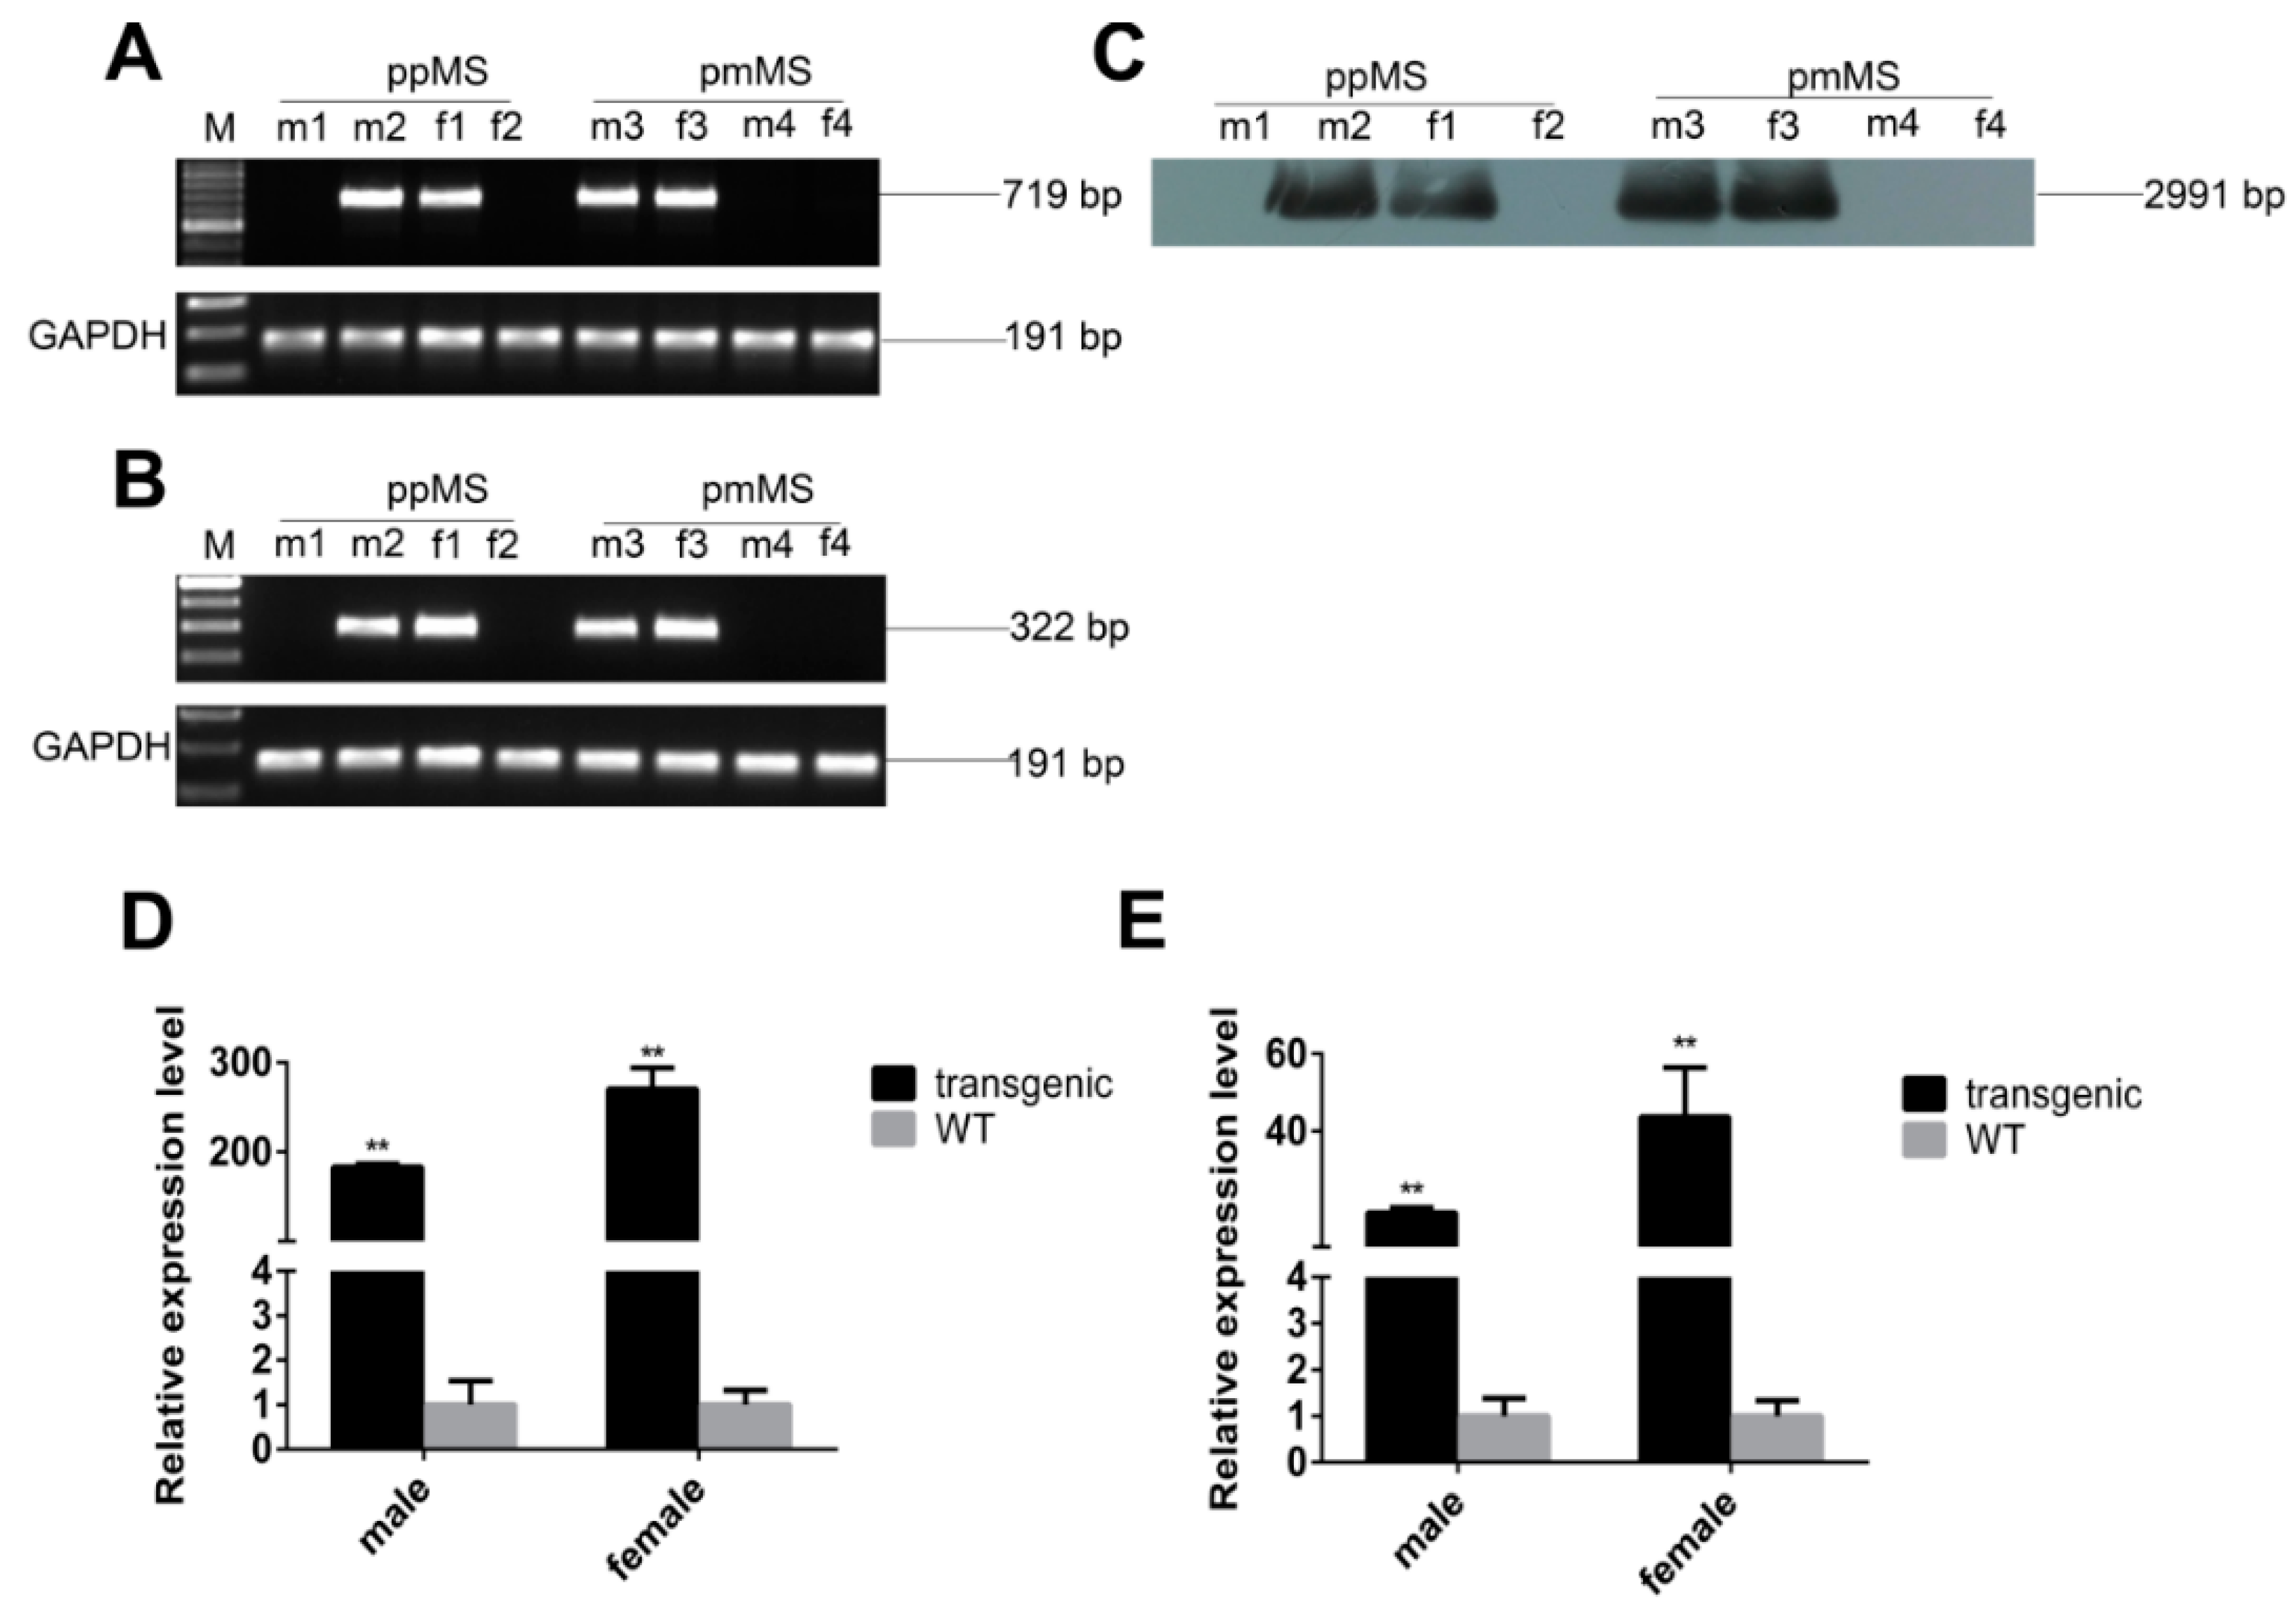
Both types of transgenic mice were confirmed by PCR and Southern blot (
Figure 1A,C). Since there is a difference in gene sequence between C57 BL/6 mice and porcine myostatin, we used reverse transcription PCR by designing primers that only amplify exogenous porcine myostatin to identify the genotype of transgenic mice at the RNA level (
Figure 1B). Based on the real-time quantitative PCR (RT-PCR) results, the mRNA expression level of total myostatin, which contains both exogenous porcine and murine endogenous myostatin, was much higher in transgenic mice than in wild-type (WT) mice (
Figure 1D,E). Our data confirm that both types of transgenic mice were successfully generated.
Figure 1.
Identification and expression of pmMS and ppMS transgenes in mice. (A) Identification of transgenic mice by PCR; (B) Identification of transgenic mice by RT-PCR; (C) Identification of transgenic mice by Southern blot; (D) The mRNA expression level of exogenous pmMS and endogenous myostatin and (E) The mRNA expression level of exogenous ppMS and endogenous myostatin. There were five transgenic mice and six WT (wild type) mice in each group. M, marker; ppMS, wild-type porcine myostatin propeptide; pmMS, porcine myostatin missense mutant; m1, WT male mice; m2, transgenic male mice expressing ppMS; f1, transgenic female mice expressing ppMS; f2, WT female mice; m3, transgenic male mice expressing pmMS; m4, WT male mice; f3, transgenic female mice expressing pmMS; f4, WT female mice. ** p < 0.01.
2.2. Phenotype and Characterization of Transgenic Mice
To determine whether the expression of pmMS or ppMS in transgenic mice has any effect on muscle growth, we dissected the skeletal muscle of the hind limb that contains the gastrocnemius, rectusfemoris, tibialis anterior (TA), and pectoralis, and measured each muscle’s weight, respectively. The average body weight increased by 6.54% and 9.48% in pmMS and ppMS transgenic female mice, respectively, compared to WT mice (
Table 1). The average weight of each individual muscle increased by 17.46%, 32.36%, 35.75%, and 22.16% in pmMS transgenic female mice, and 32.06%, 58.84%, 38.41%, and 41.79% in ppMS transgenic female mice, respectively, compared to WT mice (
Table 1). However, the muscle mass weight did not change in pmMS transgenic male mice, while it increased by 31.74%, 52.71%, 49.64%, and 37.61% in ppMS transgenic male mice compared with WT mice (
Table 1).
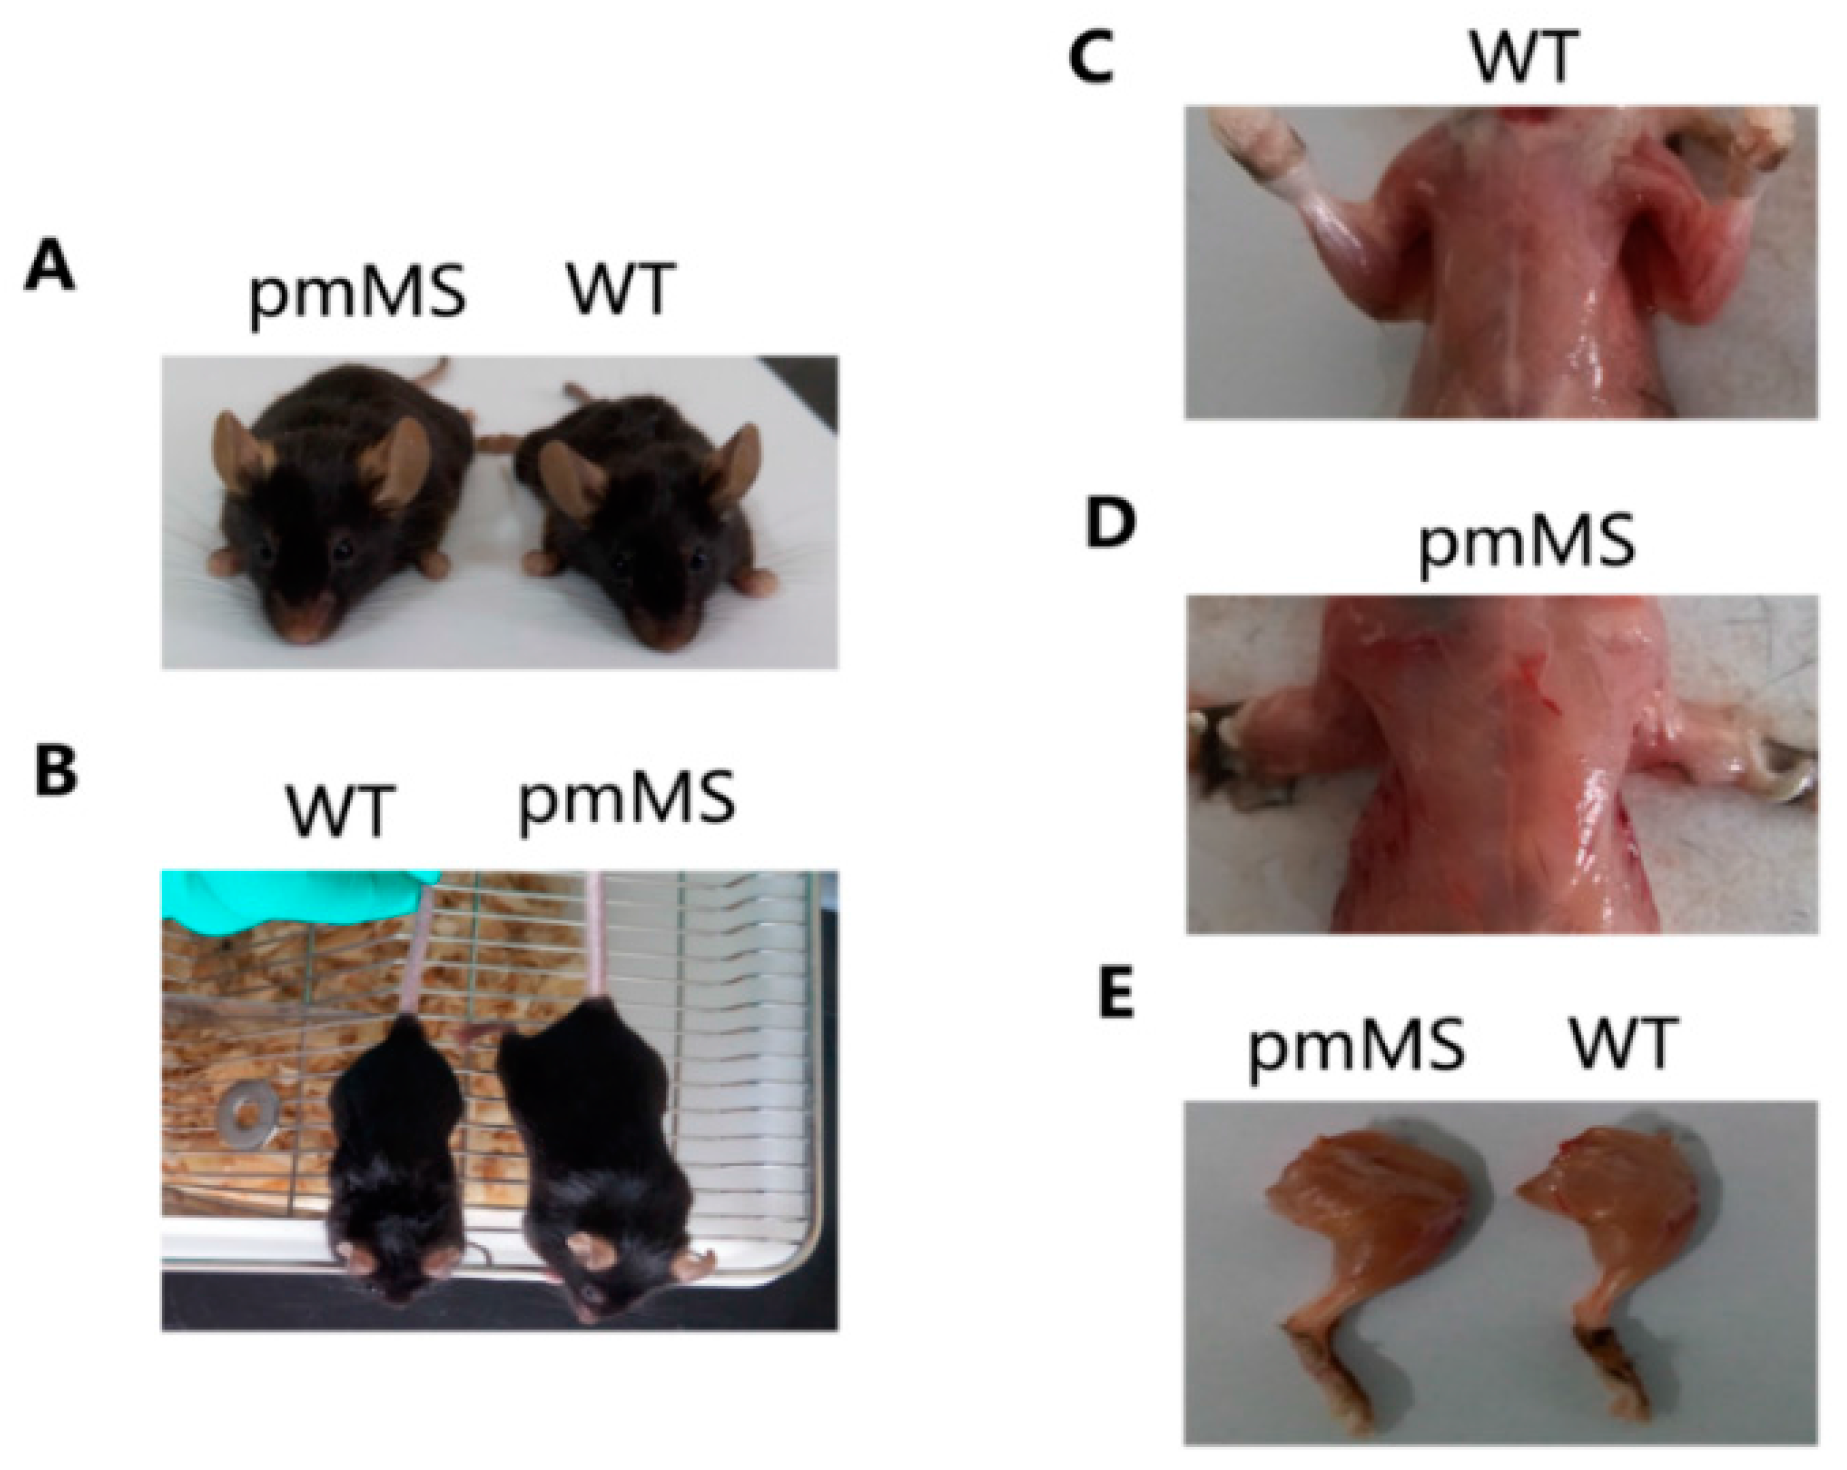
Figure 2A,B show pictures of a representative WT female mouse and a representative pmMS female mouse.
Figure 2C–E show the hind limb and pectoralis from a pmMS transgenic female mouse and a WT female mouse, respectively. It is clear that the transgenic pmMS female mouse looks more muscular than the WT mouse. The weight of viscus did not change in both types of transgenic mice compared with WT mice (data not shown).
Table 1.
Body and muscle weights (g) of pmMS and ppMS transgenic mice.
Table 1.
Body and muscle weights (g) of pmMS and ppMS transgenic mice.
| Offspring | Sex | n | Body Weight | Gastrocnemius | Rectusfemoris | TA | Pectoralis |
|---|
| pmMS | male | 5 | 35.3 ± 3.2 | 0.1936 ± 0.0114 | 0.1717 ± 0.0385 | 0.0708 ± 0.0074 | 0.3325 ± 0.0396 |
| ppMS | male | 5 | 36.7 ± 2.0 * | 0.2536 ± 0.0433 ** | 0.2286 ± 0.0174 ** | 0.1040 ± 0.0140 ** | 0.4427 ± 0.0803 ** |
| controls | male | 8 | 34.2 ± 2.0 | 0.1925 ± 0.0217 | 0.1497 ± 0.0282 | 0.0695 ± 0.0114 | 0.3217 ± 0.0477 |
| pmMS | female | 5 | 32.6 ± 1.4 * | 0.1843 ± 0.0091 ** | 0.1714 ± 0.0253 * | 0.0767 ± 0.0065 ** | 0.2833 ± 0.0145 ** |
| ppMS | female | 5 | 33.5 ± 2.0 * | 0.2072 ± 0.0286 ** | 0.2057 ± 0.0342 ** | 0.0782 ± 0.0156 * | 0.3288 ± 0.0547 ** |
| controls | female | 7 | 30.6 ± 1.3 | 0.1569 ± 0.0109 | 0.1295 ± 0.0265 | 0.0565 ± 0.0080 | 0.2319 ± 0.0273 |
Figure 2.
Increased body mass and skeletal muscle weight of pmMS transgenic female mice compared with wild-type mice. (A,B): Increased body mass in pmMS transgenic female mice, pictures taken from different angles; (C–E): Increased muscling in pmMS transgenic female mice. WT, wild type.
Figure 2.
Increased body mass and skeletal muscle weight of pmMS transgenic female mice compared with wild-type mice. (A,B): Increased body mass in pmMS transgenic female mice, pictures taken from different angles; (C–E): Increased muscling in pmMS transgenic female mice. WT, wild type.
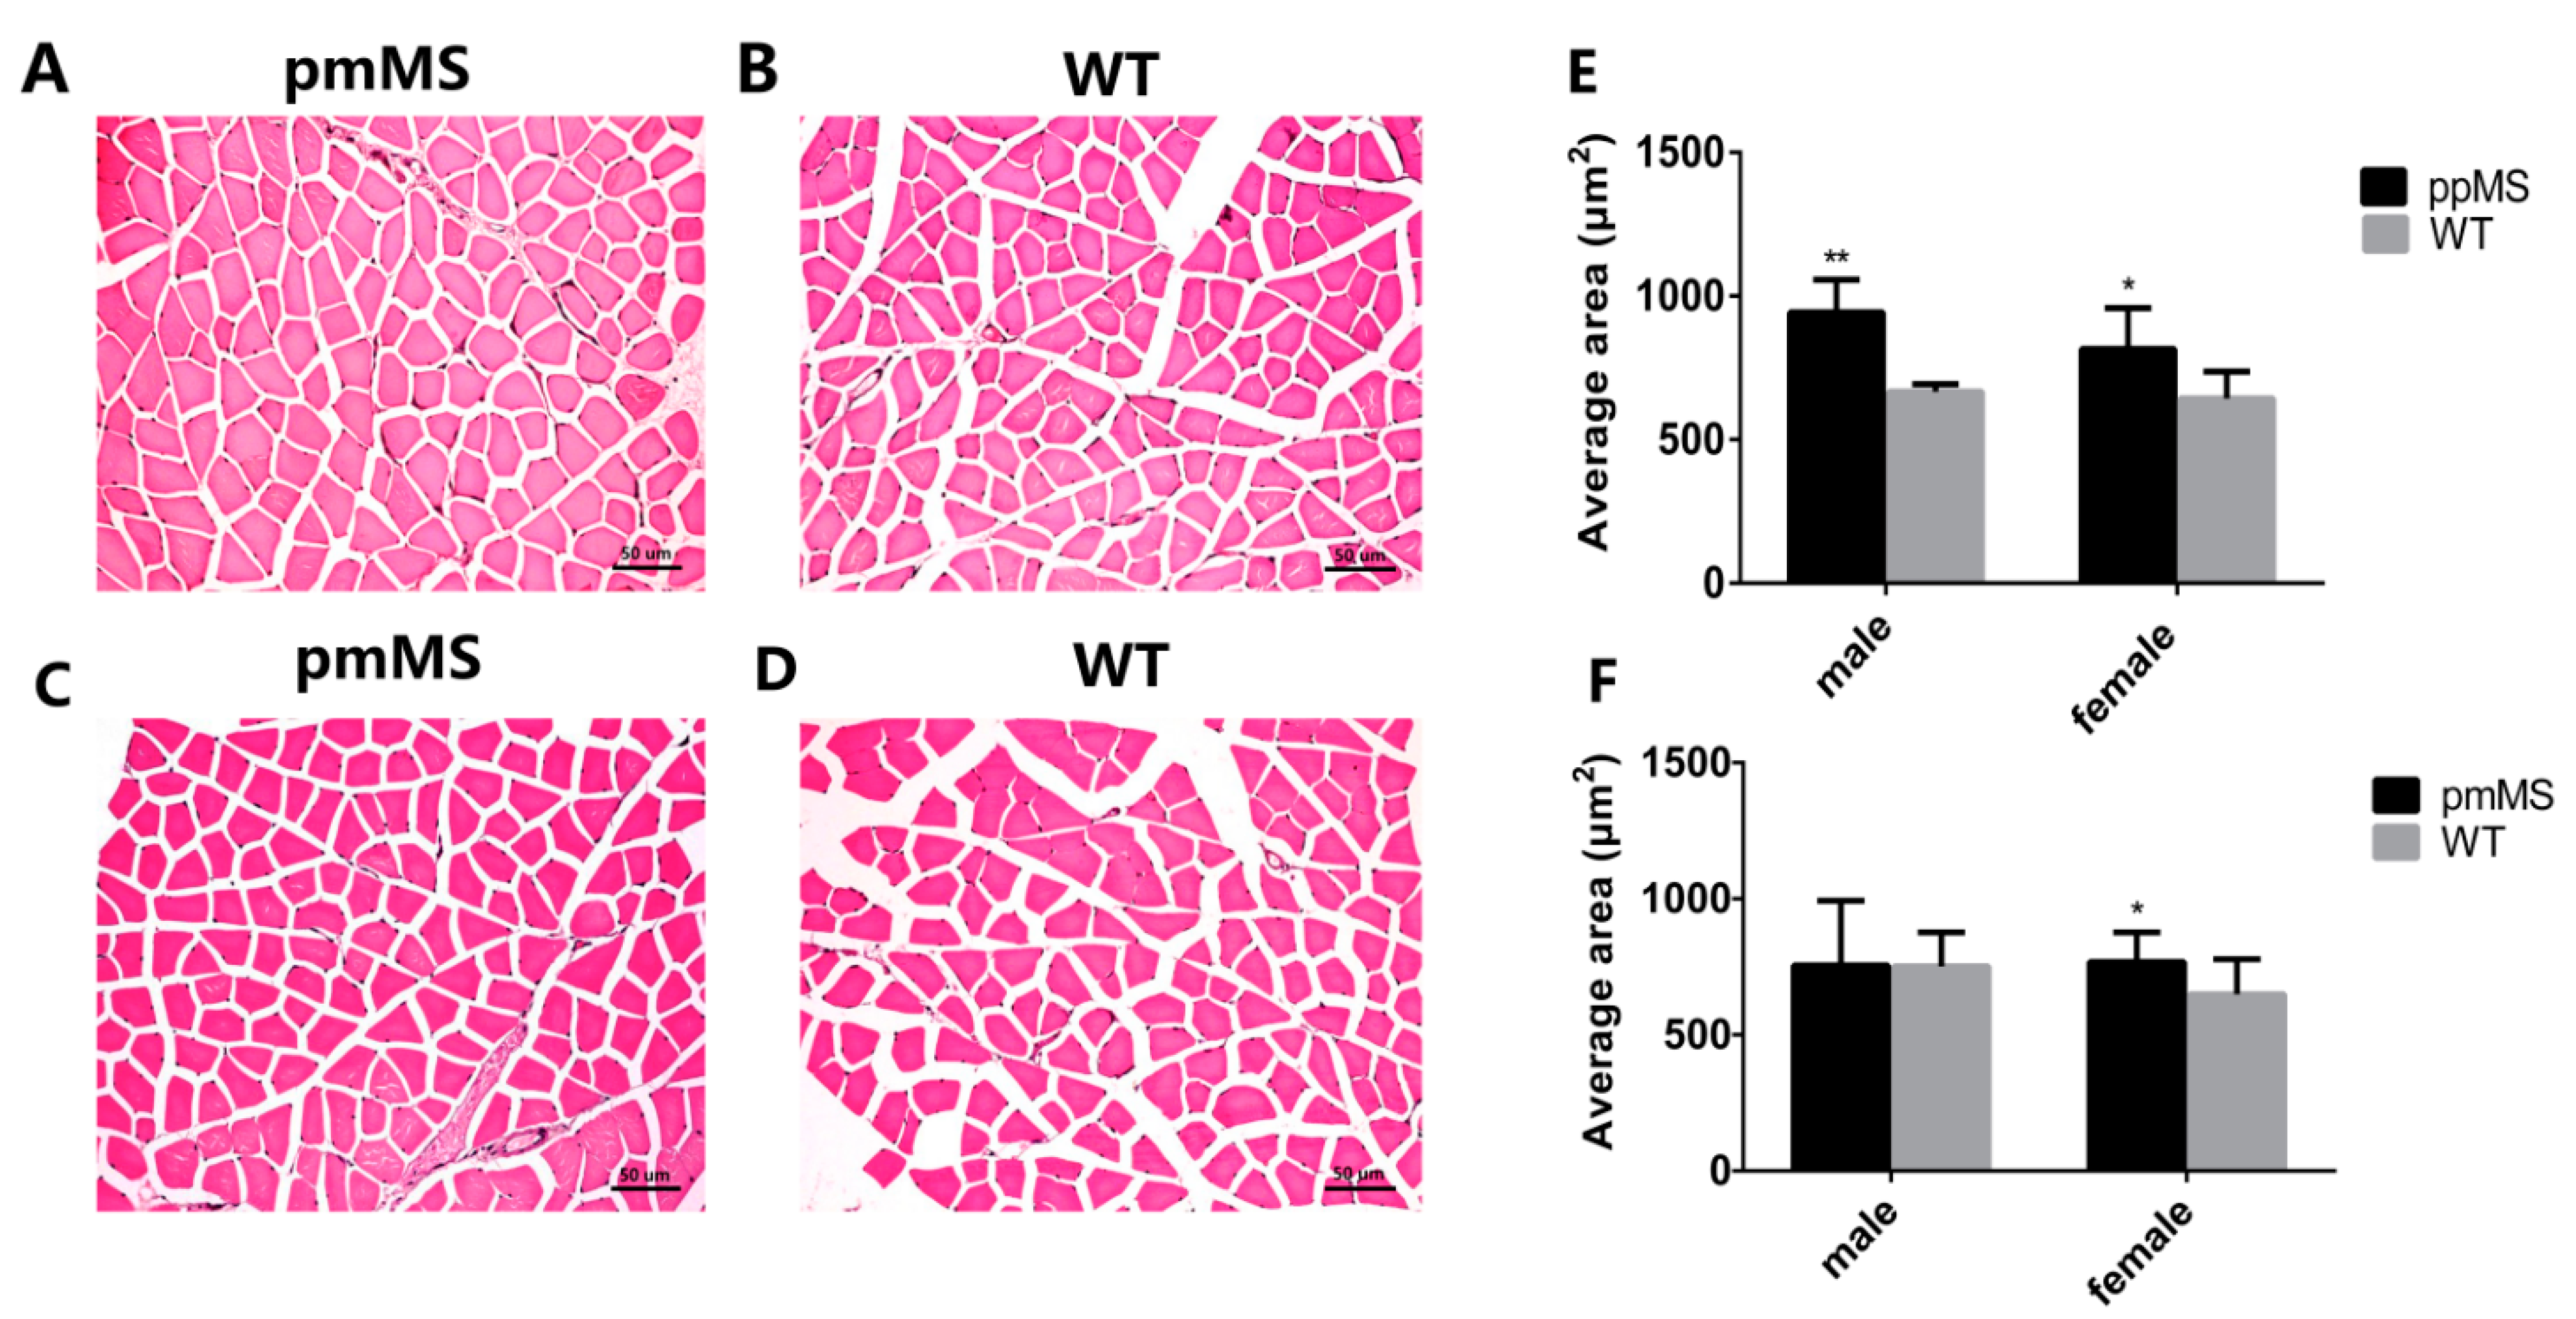
Next, we measured the myofiber size in the gastrocnemius by hematoxylin and eosin and the results show that the mean gastrocnemius fiber size increased by 18.27% and 26.77%, respectively, in pmMS and ppMS transgenic female mice compared with WT mice (
Figure 3A,B,E,F). However, compared with WT male mice, the mean gastrocnemius fiber size in pmMS transgenic male mice did not change, but it increased 41.39% in ppMS transgenic male mice (
Figure 3C–F).
Figure 3.
Analysis of myofiber cell size of gastrocnemius from transgenic and WT mice at the age of 30 weeks. (A) Muscle cross-sections from pmMS transgenic female mice; (B) Muscle cross-sections from WT female mice; (C) Muscle cross-sections from pmMS transgenic male mice; (D) Muscle cross-sections from WT male mice; (E) Comparsion of average muscle size between ppMS transgenic mice (male: n = 5; female: n = 5) and WT mice (male: n = 8; female: n = 6) and (F) Comparsion of average muscle size between pmMS transgenic mice (male: n = 5; female: n = 5) and WT mice (male: n = 8; female: n = 6). Scale bars = 50 μm; * p < 0.05,** p < 0.01.
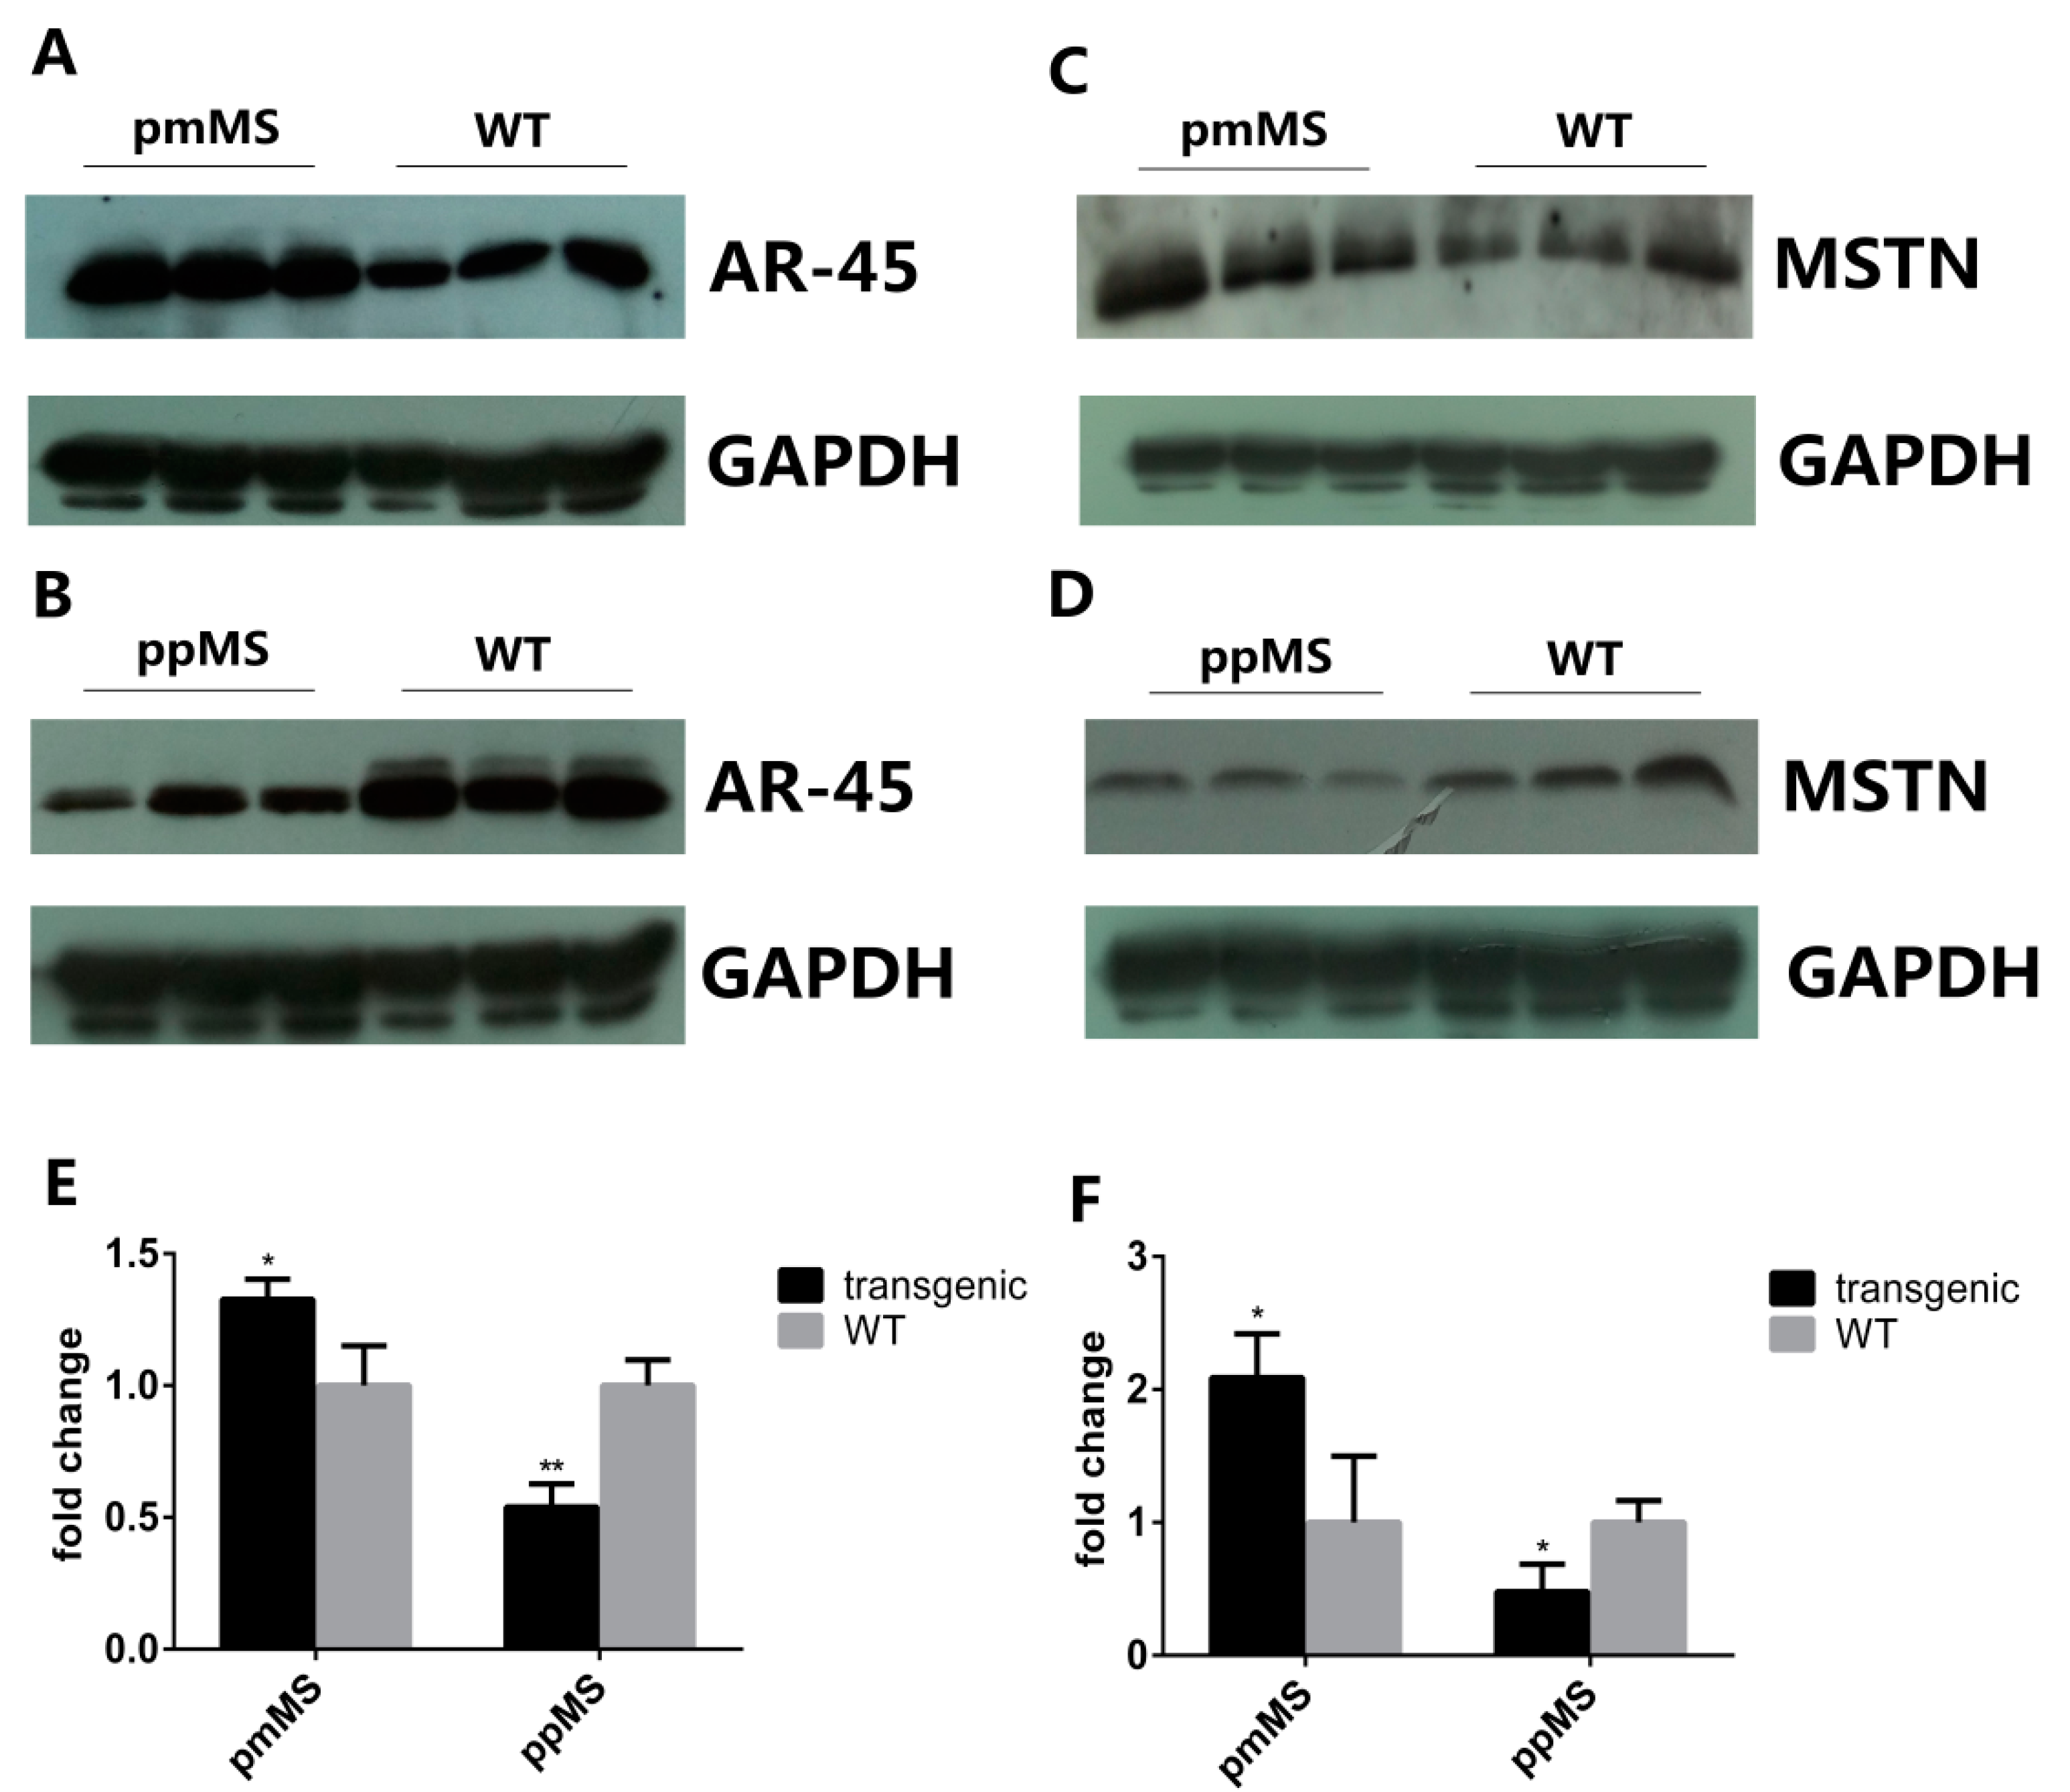
To explore why there is such a huge difference in muscle growth and fiber size between pmMS and ppMS transgenic male mice, the AR45 protein level was analyzed by Western blot. The intensity of the AR45 protein band in each genotype of male mice was measured by densitometry using Image J 1.48u (NIH, Bethesda, MD, USA). Results indicated that compared with WT male mice, the level of AR45 protein increased 32.65% in pmMS transgenic male mice but decreased 46.07% in ppMS transgenic male mice (
Figure 4A,B,E). On the other hand, the AR45 level is only slightly higher in pmMS female mice than in wild-type female mice (
Figure 5A); the difference in the AR45 level between pmMS female mice and wild-type female mice is not significant.
Figure 4.
Protein expression level of AR45 and myostatin in the gastrocnemius of transgenic male mice and WT male mice by Western blot. (A) Protein expression level of AR45 (67 kDa) in pmMS transgenic male and WT male mice; (B) Protein expression level of AR45 (67 kDa) in ppMS transgenic male and WT male mice; (C) Protein expression level of myostatin (26 kDa) in pmMS transgenic male and WT male mice; (D) Protein expression level of myostatin (26 kDa) in ppMS transgenic male and WT male mice. In panels (A–D), each lane contains a sample from one individual mouse; (E) Quantitation of AR45 protein band intensity by densitometry using image J software and (F) Quantitation of myostatin protein band intensity by densitometry using image J software (NIH, Bethesda, MD, USA). GAPDH was used as an internal reference. MSTN, myostatin; * p < 0.05, ** p < 0.01.
Results of the Western blot for mature myostatin (MSTN) indicated that the level of total mature myostatin peptides that include endogenous murine MSTN and exogenous C313Y mutated porcine MSTN (molecular weight of homodimer of mature myostatin peptide is about 26 kDa under non-reducing condition) is 108.81% higher in pmMS transgenic male mice and 52.03% lower in ppMS transgenic male mice than in WT male mice, respectively (
Figure 4C,D,F). Please note that in pmMS transgenic mice, since both endogenous murine MSTN and exogenous C313Y mutated porcine MSTN are expressed, and the anti-MSTN antibody used in Western blot detection is specific for total mature MSTN, the native murine and mutated porcine MSTN cannot be distinguished. Therefore, as expected and shown in
Figure 4C and
Figure 5A, pmMS transgenic mice contain much higher total MSTN levels than the corresponding wild-type mice. We also performed a Western blot with crude extracts from gastrocnemius of a representative pmMS male mouse and and a WT male mouse under non-reduced condition and our results show that pro-myostatin and mature myostastin protein bands were detected (
Figure S1).
Theoretically speaking, as has been demonstrated in Piedmontese cattle [
12], it is expected that exogenous C313Y mutated MSTN can inhibit active endogenous murine MSTN function and thus can enhance muscle growth and lead to an increase in muscle mass. However, enhanced muscle growth was only observed in pmMS female mice, but not in pmMS male mice. Based on results of total mature MSTN and AR45 expression levels in pmMS male and female mice, along with AR45 data from ppMS male mice, we speculate that the increased level of C313Y mutated MSTN and its binding to the MSTN receptor led to a significantly increased AR45 expression level through a different signaling pathway. However, further investigation is required to confirm this idea.
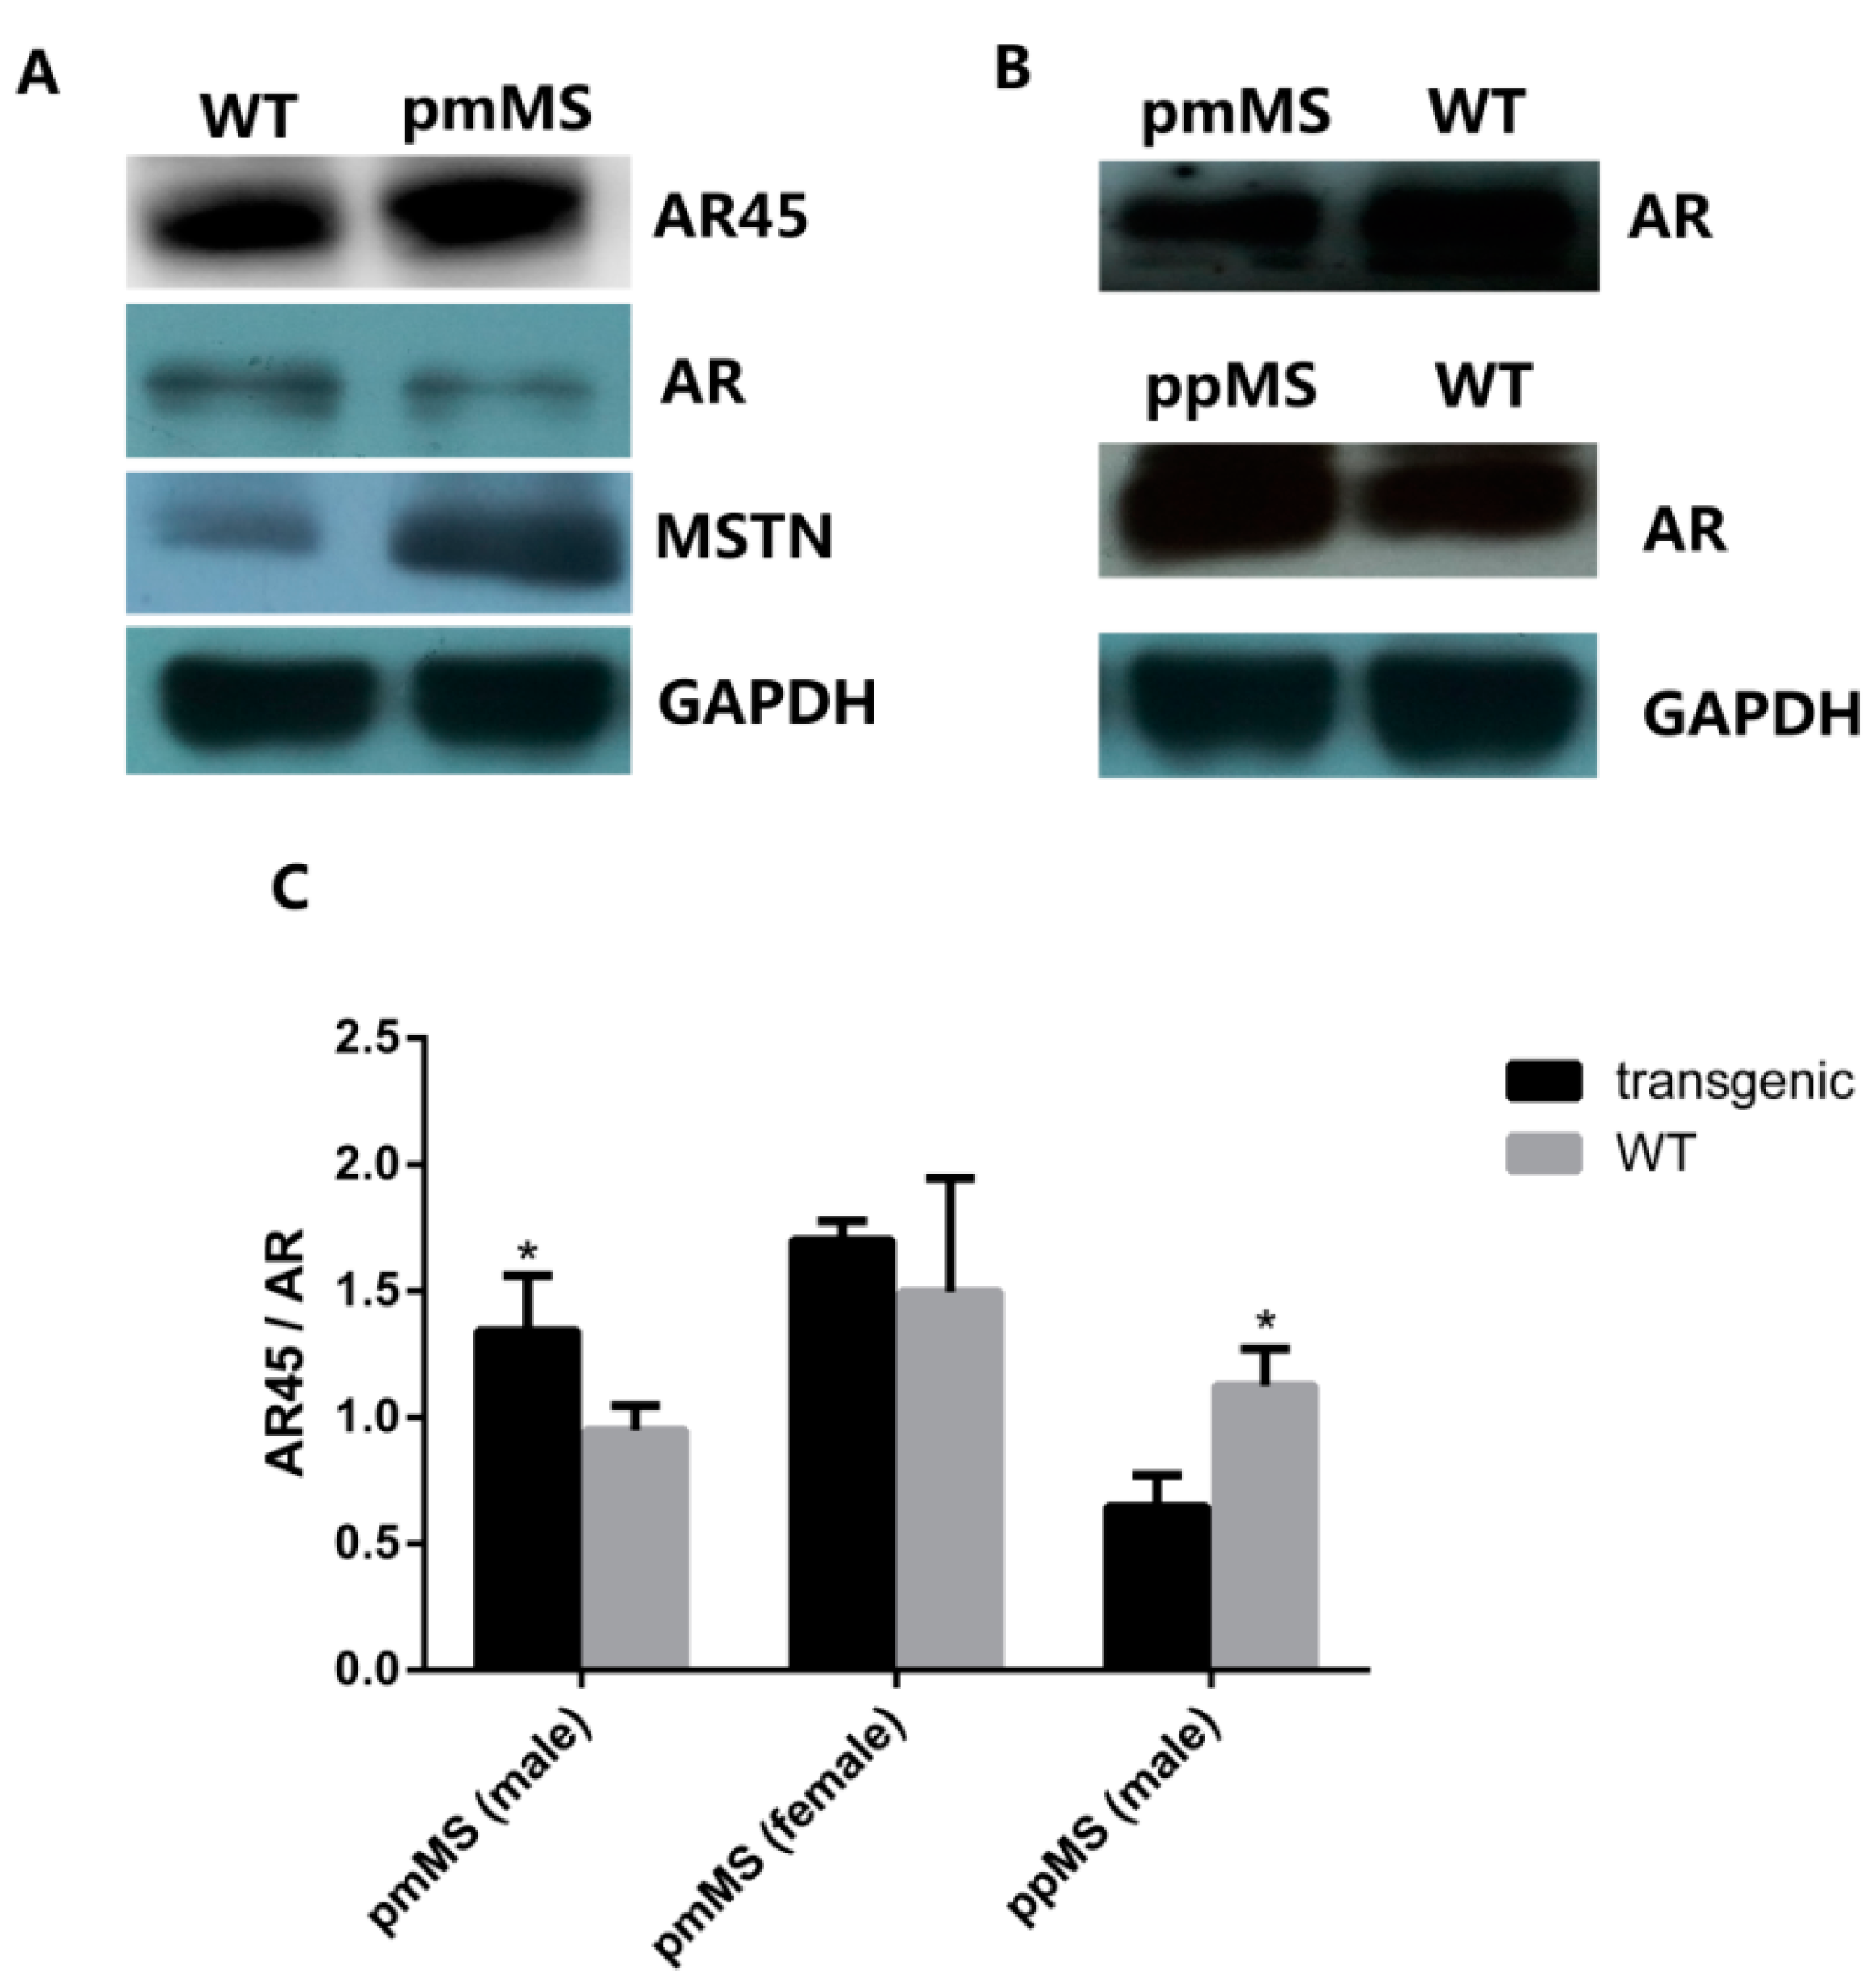
Figure 5.
Protein expression level of AR45, AR, and myostatin in the gastrocnemius of two lines of transgenic mice and WT male mice by Western blot. (A) Protein expression of AR (110 kDa), AR45 (67 kDa), and myostatin (26 kDa) in pmMS transgenic female and WT female mice; (B) Protein expression of AR (110 kDa) in pmMS and ppMS transgenic male and WT male mice and (C) AR45/AR ratios calculated by densitometry using image J software. AR, androgen receptor. * p <0.05.
We also performed an AR Western blot (
Figure 5). As expected, female mice express a lower level of AR than male mice. The AR level decreased in both pmMS female and male mice, but the decrease was not significant for pmMS female mice, while it was significant for pmMS male mice (
Figure 5A,B). It is interesting to note that the AR level increased in ppMS male mice. The calculation of AR45/AR ratios from density data of AR and AR45 bands showed there is not a significant (
p > 0.05) difference between pmMS female mice and wild-type female mice, but there is a significant difference between pmMS male mice and wild-type male mice (
p < 0.05) (
Figure 5C). These data further suggest that the increased level in total MSTN led to an increase in the AR45 level and a decrease in the AR level in pmMS male mice. The non-significant change in the AR45/AR ratio in pmMS female mice may explain why there is a MSTN mutant-induced increase in muscle mass.
Additionally, as a comparison, we performed an AR Western blot for samples from ppMS male mice. Data indicated that the AR level increased in ppMS male mice compared to wild-type male mice, and a significant difference was seen in the AR45/AR ratio between ppMS male mice and wild-type male mice (
Figure 5B,C). The result of the AR45/AR ratio in ppMS male mice is just the opposite to what was observed in pmMS male mice, and it provides additional evidence to support our speculation that higher-mutated MSTN levels in pmMS male mice result in higher levels of AR45, which in turn may reverse the increase in muscle mass induced by mutated MSTN as observed in female pmMS mice.


