2. Results and Discussion
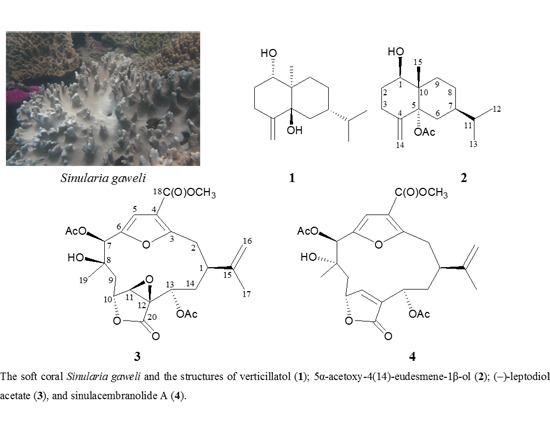
A known eudesmane sesquiterpenoid, verticillatol (
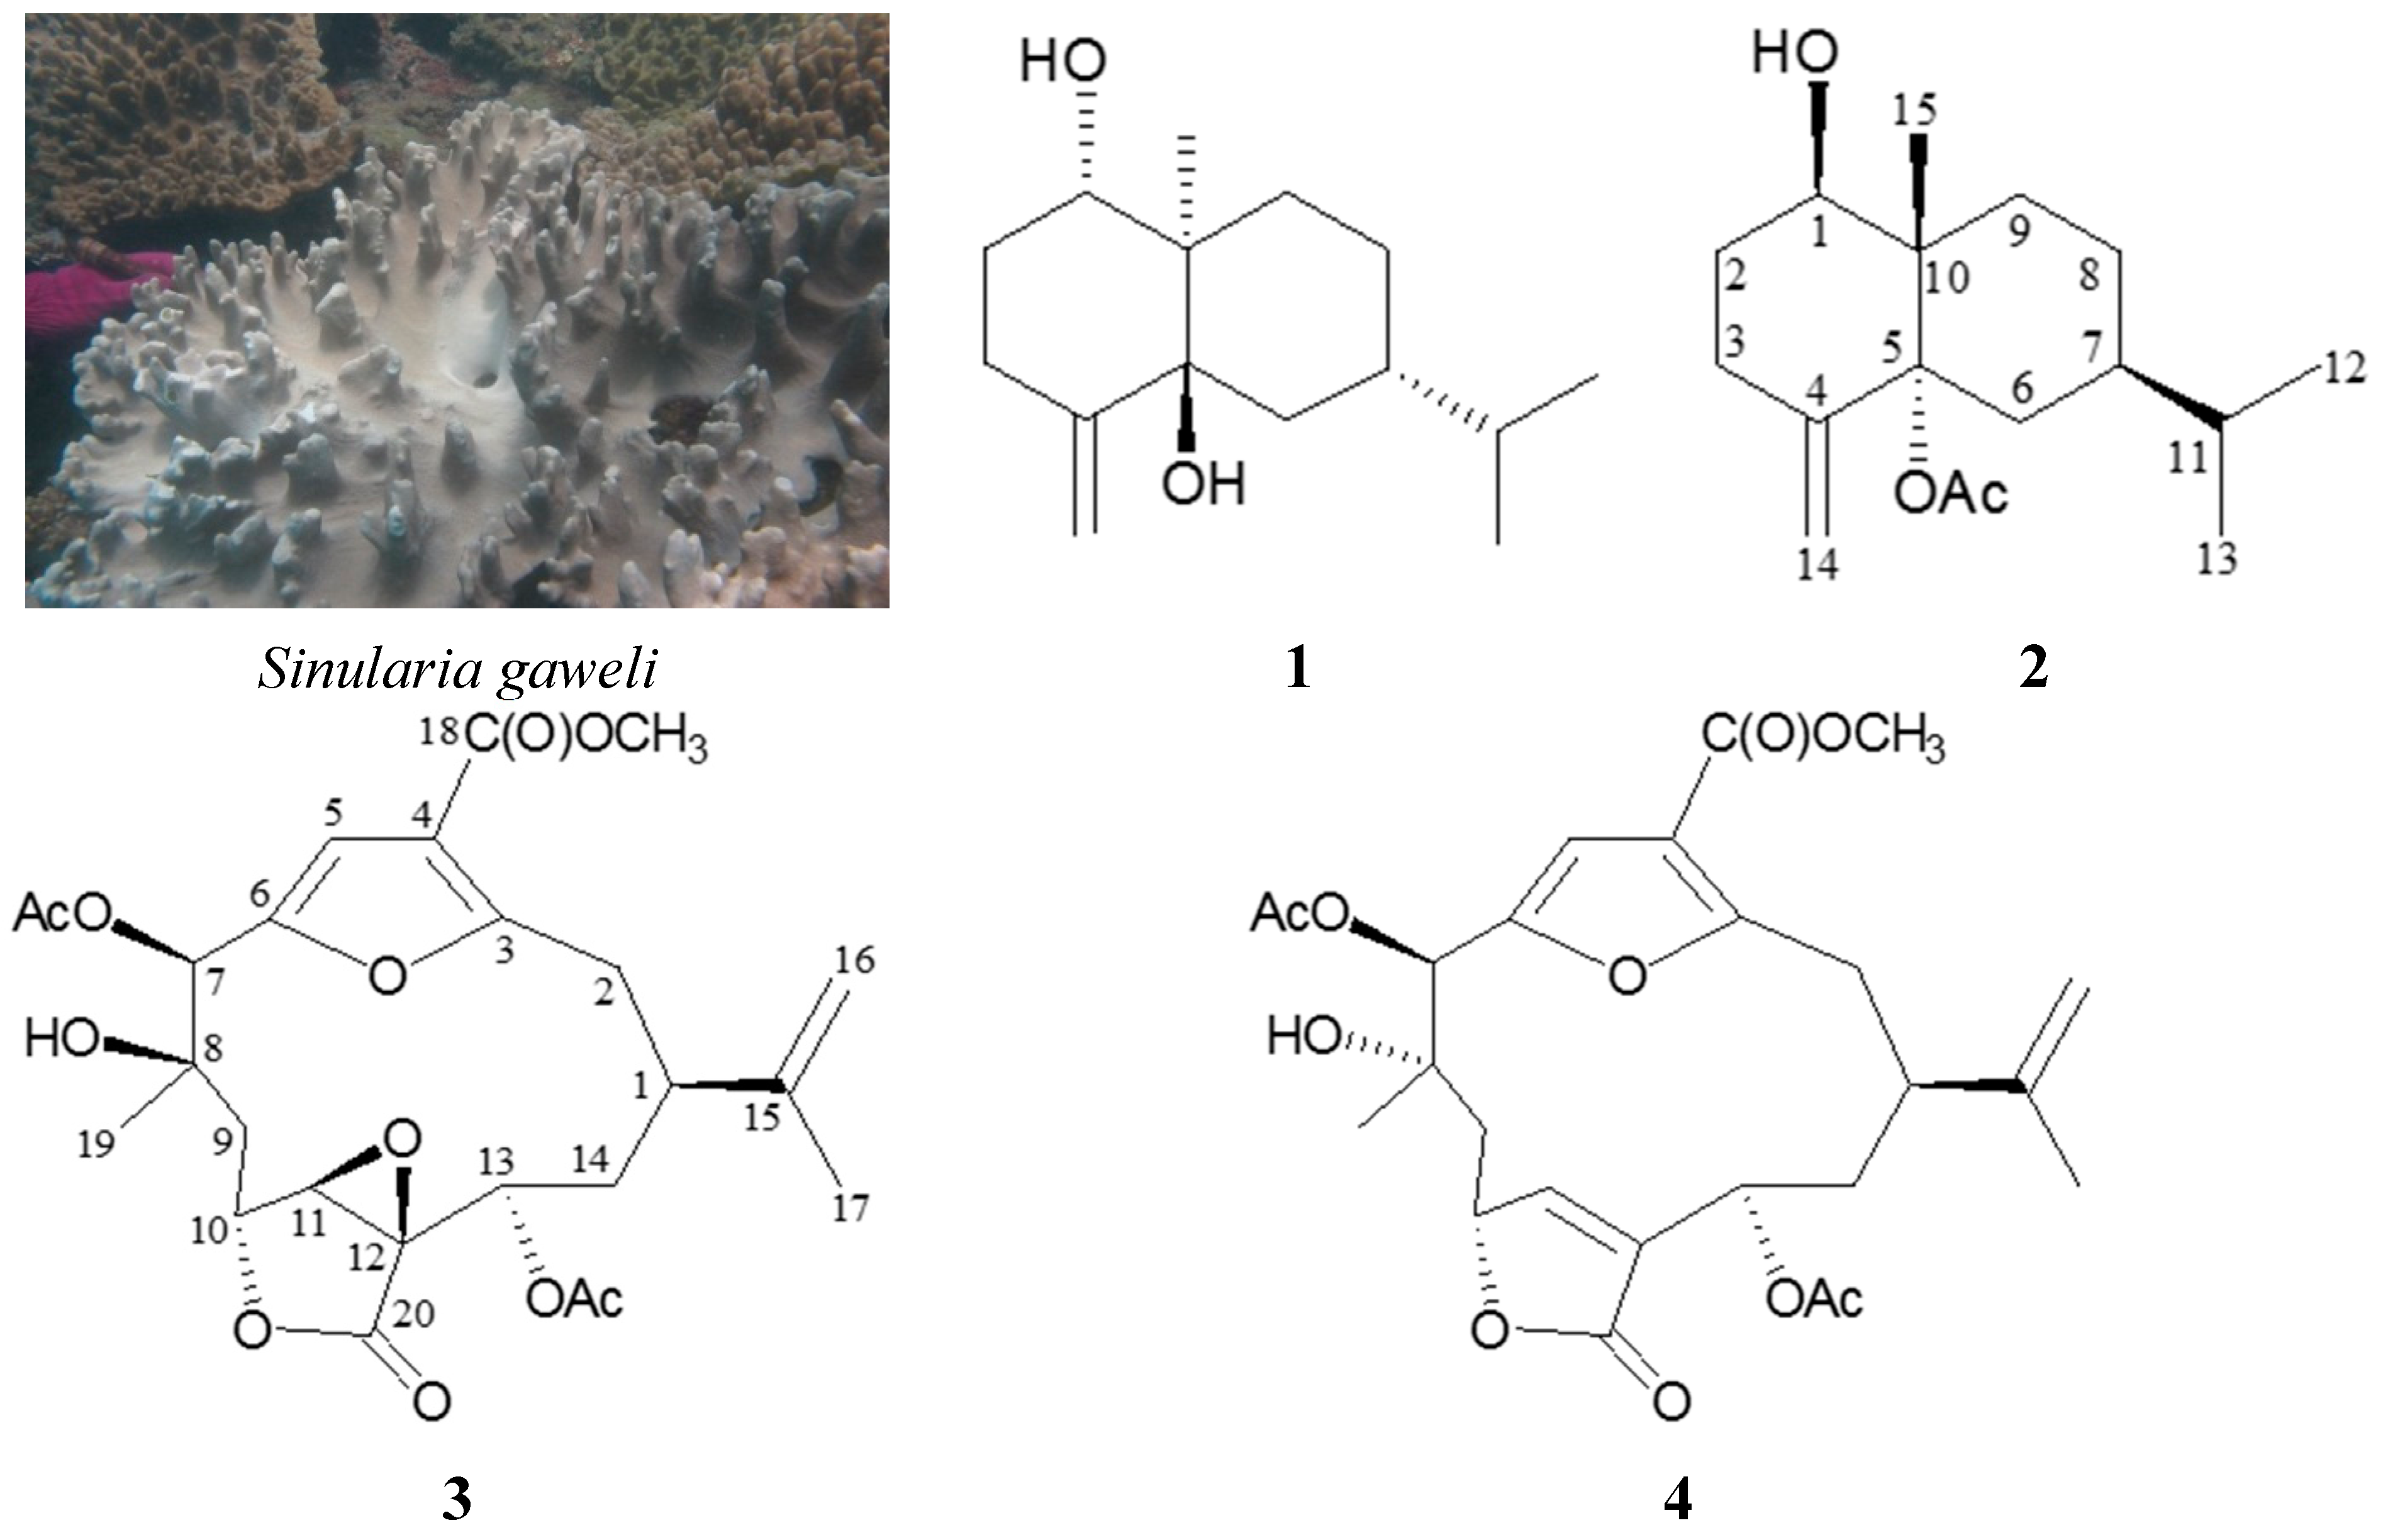
1), was obtained in this study. This compound had been obtained from a Vietnam plant
Litsea verticullata [
6]. The NMR data and rotation value of
1 were identical to those of verticillatol described previously.
5α-Acetoxy-4(14)-eudesmene-1β-ol (
2) was isolated as a colorless oil and the molecular formula for this compound was determined to be C
17H
28O
3 (four units of unsaturation) using HRESIMS (C
17H
28O
3 + Na,
m/
z 303.19293, calculated 303.19307). Comparison of the
13C NMR and distortionless enhancement by polarization transfer (DEPT) data with the molecular formula indicated that there was an exchangeable proton, which required the presence of a hydroxy group. This deduction was supported by a broad absorption in the IR spectrum at 3465 cm
–1. The IR spectrum also showed a strong band at 1735 cm
–1, consistent with the presence of an ester group. From the
1H and
13C NMR spectra (
Table 1),
2 was found to possess an acetoxy group (δ
H 2.03, 3H, s; δ
C 168.9, C; 21.8, CH
3). An additional unsaturated functionality was indicated by
13C resonances at δ
C 111.6 (CH
2-14) and 145.1 (C-4), suggesting the presence of an exocyclic carbon-carbon double bond. Thus, the proposed skeleton of
2 was suggested to be a bicyclosesquiterpenoid.
Table 1.
1H (400 MHz, CDCl3) and 13C (100 MHz, CDCl3) NMR data, 1H–1H COSY and HMBC correlations for sesquiterpenoid 2.
Table 1.
1H (400 MHz, CDCl3) and 13C (100 MHz, CDCl3) NMR data, 1H–1H COSY and HMBC correlations for sesquiterpenoid 2.
| Position | δH Multiplicity (J in Hz) | δC, Multiplicity | 1H–1H COSY | HMBC |
|---|
| 1 | 4.00 dd (12.0, 4.8) | 72.9, CH | H2-2 | C-2, -10, -15 |
| 2α | 1.85 m | 30.9, CH2 | H-1, H-2β, H2-3 | n. o. |
| β | 1.55 m | – | H-1, H-2α, H2-3 | C-1, -3 |
| 3α | 2.22 m | 30.2, CH2 | H2-2, H-3β | C-1, -2, -4, -5, -14 |
| β | 1.26 m | – | H2-2, H-3α | n. o. |
| 4 | – | 145.1, C | – | – |
| 5 | – | 87.3, C | – | – |
| 6α | 2.61 br d (14.4) | 28.5, CH2 | H-6β | C-5, -10 |
| β | 1.41 dd (14.4, 12.4) | | H-6α, H-7 | C-7, -8 |
| 7 | 1.26 m | 38.6, CH | H2-6, H2-8, H-11 | C-9 |
| 8α | 1.22 m | 23.6, CH2 | H-7, H-8β, H2-9 | C-7, -9 |
| β | 1.59 m | – | H-7, H-8α, H2-9 | n. o. |
| 9 | 1.70 m | 30.4, CH2 | H2-8 | C-7, -8, -15 |
| 10 | – | 43.3, C | – | – |
| 11 | 1.47 m | 32.5, CH | H-7, H3-12, H3-13 | C-8 |
| 12 | 0.90 d (6.8) | 19.6, CH3 | H-11 | C-7, -11, -13 |
| 13 | 0.89 d (6.8) | 19.9, CH3 | H-11 | C-7, -11, -12 |
| 14a | 5.05 s | 111.6, CH2 | H-14b | C-3, -5 |
| b | 4.90 s | – | H-14a | C-3, -4, -5 |
| 15 | 0.79 s | 12.3, CH3 | – | C-1, -5, -9, -10 |
| 5-OAc (5a) (the C=O) | – | 168.9, C | – | – |
| 5-OAc (5b) (the Me) | 2.03 s | 21.8, CH3 | – | C-5a |
From the
1H-
1H COSY and HMBC spectrum of
2 (
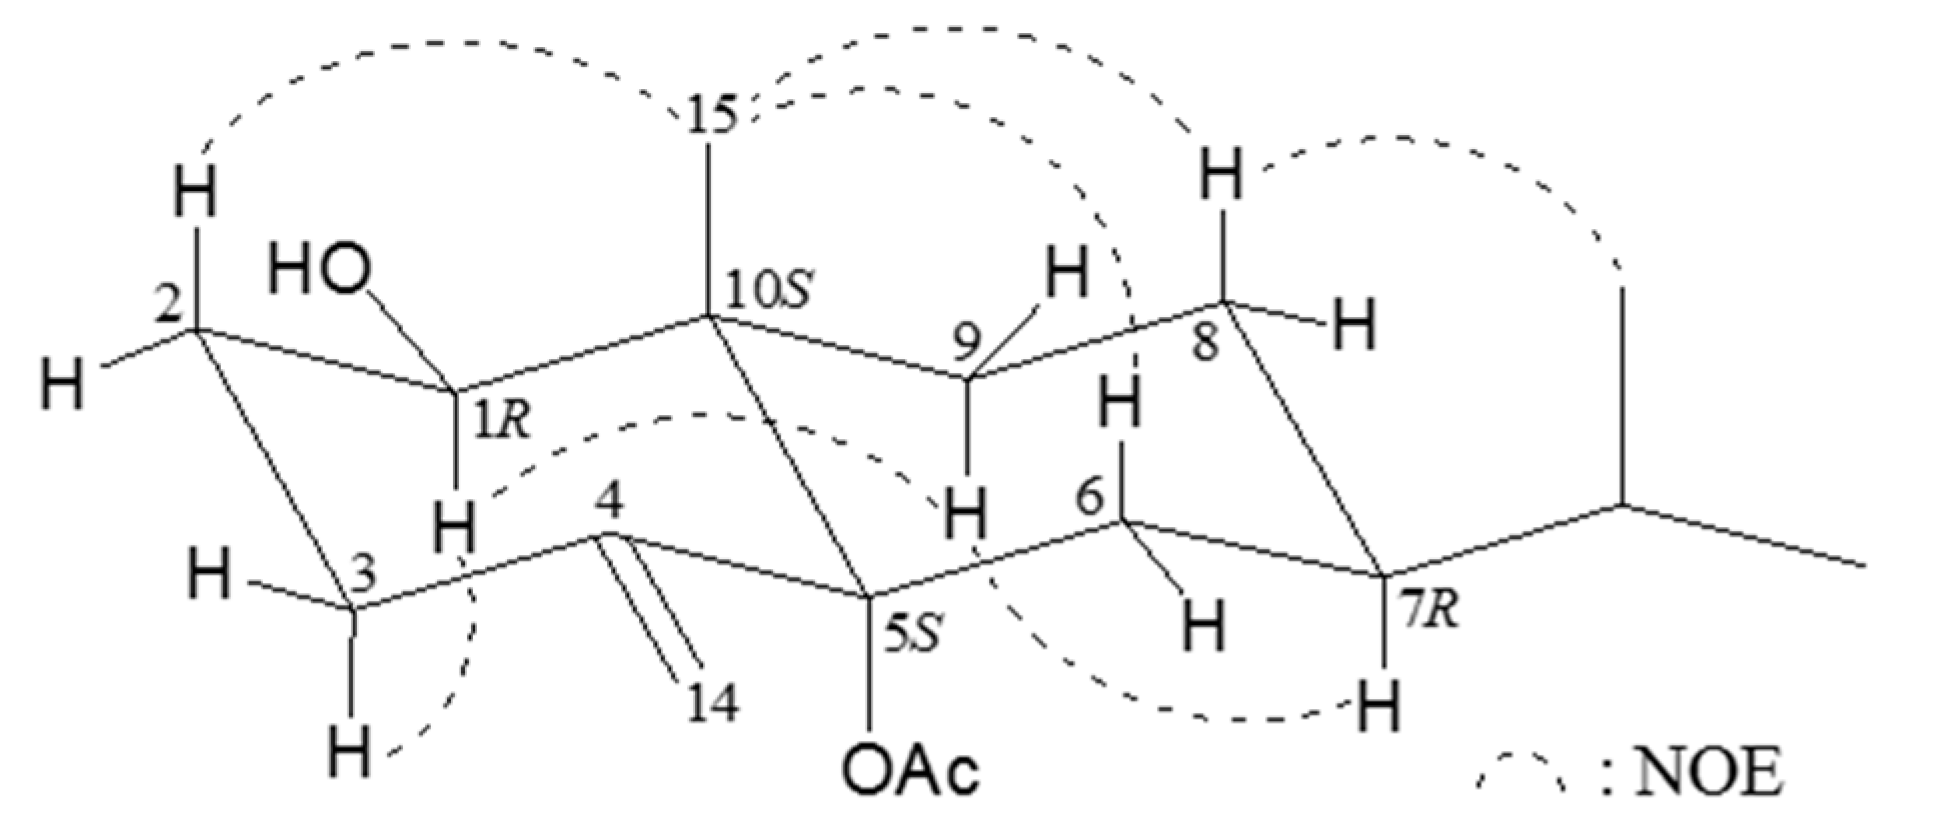
Table 1), permitted elucidation of the main eudesmane carbon skeleton. The relative configuration of
2 was elucidated by means of a NOESY (nuclear overhauser effect spectroscopy) experiment (
Figure 2). The NOEs of H-9α to H-1 and H-7α revealed the hydroxy group at C-1 and isopropyl group at C-7 to be β-oriented. The NOEs between H
3-15/H-2β, H
3-15/H-6β, and H
3-15/H-8β assigned the methyl group at C-10 as β. By comparison of the rotation value of compound
2 (
+75 (
c 0.93, MeOH);
+25 (
c 0.93, CHCl
3)) with those of
1 (verticillatol) (
−41.2 (
c 0.13, CHCl
3)) [
6] and the enantiomer of
1, 4(15)-eudesmene-1β,5α-diol (
+108 (
c 0.8, MeOH)) [
7] (In this reference, the alphabetical orders for C-14 and C-15 in this compound should be exchanged from the IUPAC recommendation), suggested that the acetoxy group at C-5 should be α-oriented. Since the absolute configuration of 4(15)-eudesmene-1β, 5α-diol had been determined by modified Mosher’s method [
7], we were able to assign the absolute configurations of all the chiral centers of
2 as 1
R, 5
S, 7
R, 10
S. Based on the above findings, the structure of
2 was, therefore, determined to be 5α-acetoxy-4(14)-eudesmene-1β-ol.
Figure 2.
Important nuclear overhauser effect spectroscopy (NOESY) correlations for compound 2.
Figure 2.
Important nuclear overhauser effect spectroscopy (NOESY) correlations for compound 2.
The spectral (
1H,
13C NMR and IR) data of
3 were in full agreement with those of a known cembrane analogue, leptodiol acetate, which was isolated from a Panama gorgonian coral identified as
Leptogorgia sp. [
8]. However, the optical rotation value of
3 (
−24 (
c 0.33, CHCl
3);
−10 (
c 0.33, CH
2Cl
2)) was substantially different from that of leptodiol acetate (
+27 (
c 0.49, CH
2Cl
2)); indicating that cembranoid
3 is an enantiomer of leptodiol acetate and assigned as (−)-leptodiol acetate.
The molecular formula for cembranoid
4 (sinulacembranolide A) was determined to be C
25H
30O
10 (11 units of unsaturation) using HRESIMS (C
25H
30O
10 + Na,
m/
z 513.17338, calcd. 513.17312). Absorption for hydroxy and carbonyl groups at 3481, 1756, and 1721 cm
–1 were observed in the IR spectrum. The
13C NMR and DEPT spectra of
4 (
Table 2) showed the presence of 25 carbon signals assigned to 5 × CH
3 (one methoxy group, two from acetyl groups), 4 × CH
2 (one olefinic), 6 × CH (two olefinics and three oxymethines) and 10 quaternary carbons (four carbonyls and five olefinics).
1H and
13C NMR data of
4 (
Table 2) were similar with those of
3, particularly the chemical shifts for 11,12-epoxy group in
3 (δ
H 4.10, 1H, br s, H-11; δ
C 63.0, CH-11; 59.0, C-12) were replaced by a carbon-carbon double bond (δ
H 6.16, 1H, d,
J = 1.2 Hz, H-11; δ
C 154.0, CH-11; 129.8, C-12) for molecule
4. Connectivity information obtained from 2D NMR, including
1H–
1H COSY and HMBC experiments, unambiguously determined the planar structure of
4 (
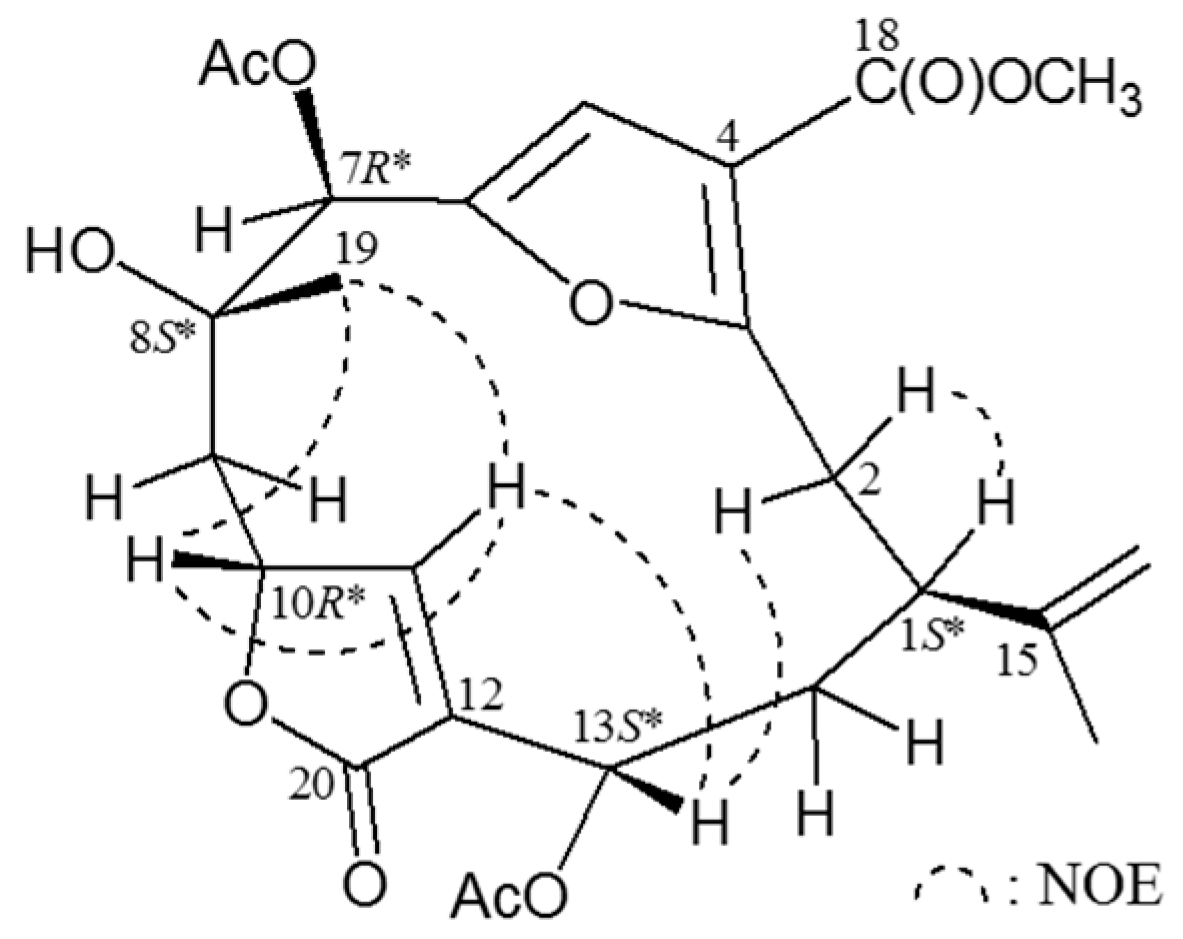
Table 2). The relative configuration of
4 was elucidated from NOESY correlations (
Figure 3). In the NOESY experiment for
4, it was found that one of the methylene protons at C-2 (δ
H 2.82) exhibited a correlation with H-1, but not with H-13 and, therefore, it was assigned as H-2α, and the other C-2 proton (δ
H 3.57) as H-2β. H-13 showed correlations with H-2β and H-11, but not with H-1, and H-11 showed a correlation with H-10, as well as a small coupling (
J = 1.2 Hz) detected between H-10 and H-11, indicating the dihedral angle between H-10 and H-11 is approximately 90° and the geometry of the C-11/12 carbon-carbon double bond was
Z form and C-10 possessing an relative configuration
R*-form. H
3-19 correlated with H-10 and H-11, but not with H-7, indicating that Me-19 and H-7 were β- and α-oriented at C-8 and C-7, respectively. From the above evidence, the relative configuration of chiral carbons of
4 were assumed to be 1
S*, 7
R*, 8
S*, 10
R*, and 13
S*.
To the best of our knowledge, the C-7, C-8 vicinal diol-based cembranoid analogues are rarely found [
9]. In previous studies on
S. gaweli had afforded an interesting norcembranoid, sinulanorcembranolide A [
3], and the biosynthetic pathway for sinulanorcembranolide A was proposed in a later study [
10]. This observation is in agreement with the observation that cembrane diterpenoids from Alcyonacea have opposite configuration at C-1 compared to those obtained from Gorgonacea [
11].
Table 2.
1H (400 MHz, CDCl3) and 13C (100 MHz, CDCl3) NMR data, 1H–1H COSY and HMBC correlations for cembrane 4.
Table 2.
1H (400 MHz, CDCl3) and 13C (100 MHz, CDCl3) NMR data, 1H–1H COSY and HMBC correlations for cembrane 4.
| Position | δH Multiplicity (J in Hz) | δC, Multiplicity | 1H–1H COSY | HMBC |
|---|
| 1 | 2.32 ddd (10.8, 10.8, 3.2) | 41.5, CH | H2-2, H2-14 | C-17 |
| 2α | 2.82 d (15.2) | 31.9, CH2 | H-2β | C-1, -3, -4, -14, -15 |
| β | 3.57 dd (15.2, 10.8) | – | H-1, H-2α | C-1, -14 |
| 3 | – | 160.9, C | – | – |
| 4 | | 115.5, C | – | – |
| 5 | 6.65 d (0.8) | 109.1, CH | H-7 | C-3, -4, -6 |
| 6 | – | 149.2, C | – | – |
| 7 | 5.54 br s | 76.1, CH | H-5 | C-5, -6, -8, -9, -19, -7a |
| 8 | – | 72.6, C | – | – |
| 9α | 1.91 dd (14.8, 11.2) | 42.9, CH2 | H-9β, H-10 | C-7, -8, -10 |
| β | 2.67 dd (14.8, 5.6) | – | H-9α, H-10 | C-7, -8, -10, -11 |
| 10 | 4.95 ddd (11.2, 5.6, 1.2) | 77.6, CH | H2-9, H-11 | C-9, -11, -12 |
| 11 | 6.16 d (1.2) | 154.0, CH | H-10 | C-10, -12, -13, -20 |
| 12 | – | 129.8, C | – | – |
| 13 | 5.52 dd (11.2, 4.8) | 66.7, CH | H2-14 | C-11, -12, -14, -13a |
| 14α | 2.63 ddd (11.2, 11.2, 3.2) | 36.1, CH2 | H-1, H-13, H-14β | n. o. |
| β | 1.90 ddd (11.2, 10.8, 4.8) | – | H-1, H-13, H-14α | C-1, -2, -12, -13 |
| 15 | – | 148.4, C | – | – |
| 16 | 4.82 br s | 110.6, CH2 | H3-17 | C-1, -15, -17 |
| 17 | 1.81 s | 20.7, CH3 | H2-16 | C-1, -15, -16 |
| 18 | – | 163.5, C | – | – |
| 19 | 1.47 s | 20.1, CH3 | – | C-7, -8, -9 |
| 20 | – | 169.5, C | – | – |
| 7-OAc (7a) (the C = O) | – | 169.6, C | – | – |
| 7-OAc (7b) (the Me) | 2.17 s | 20.9, CH3 | – | C-7a |
| 13-OAc (13a) (the C = O) | – | 170.3, C | – | – |
| 13-OAc (13b) (the Me) | 1.99 s | 21.0, CH3 | – | C-13a |
| 18-OCH3 | 3.88 s | 51.9, CH3 | – | C-18 |
Figure 3.
NOESY (nuclear overhauser effect spectroscopy) correlations of compound 4.
Figure 3.
NOESY (nuclear overhauser effect spectroscopy) correlations of compound 4.
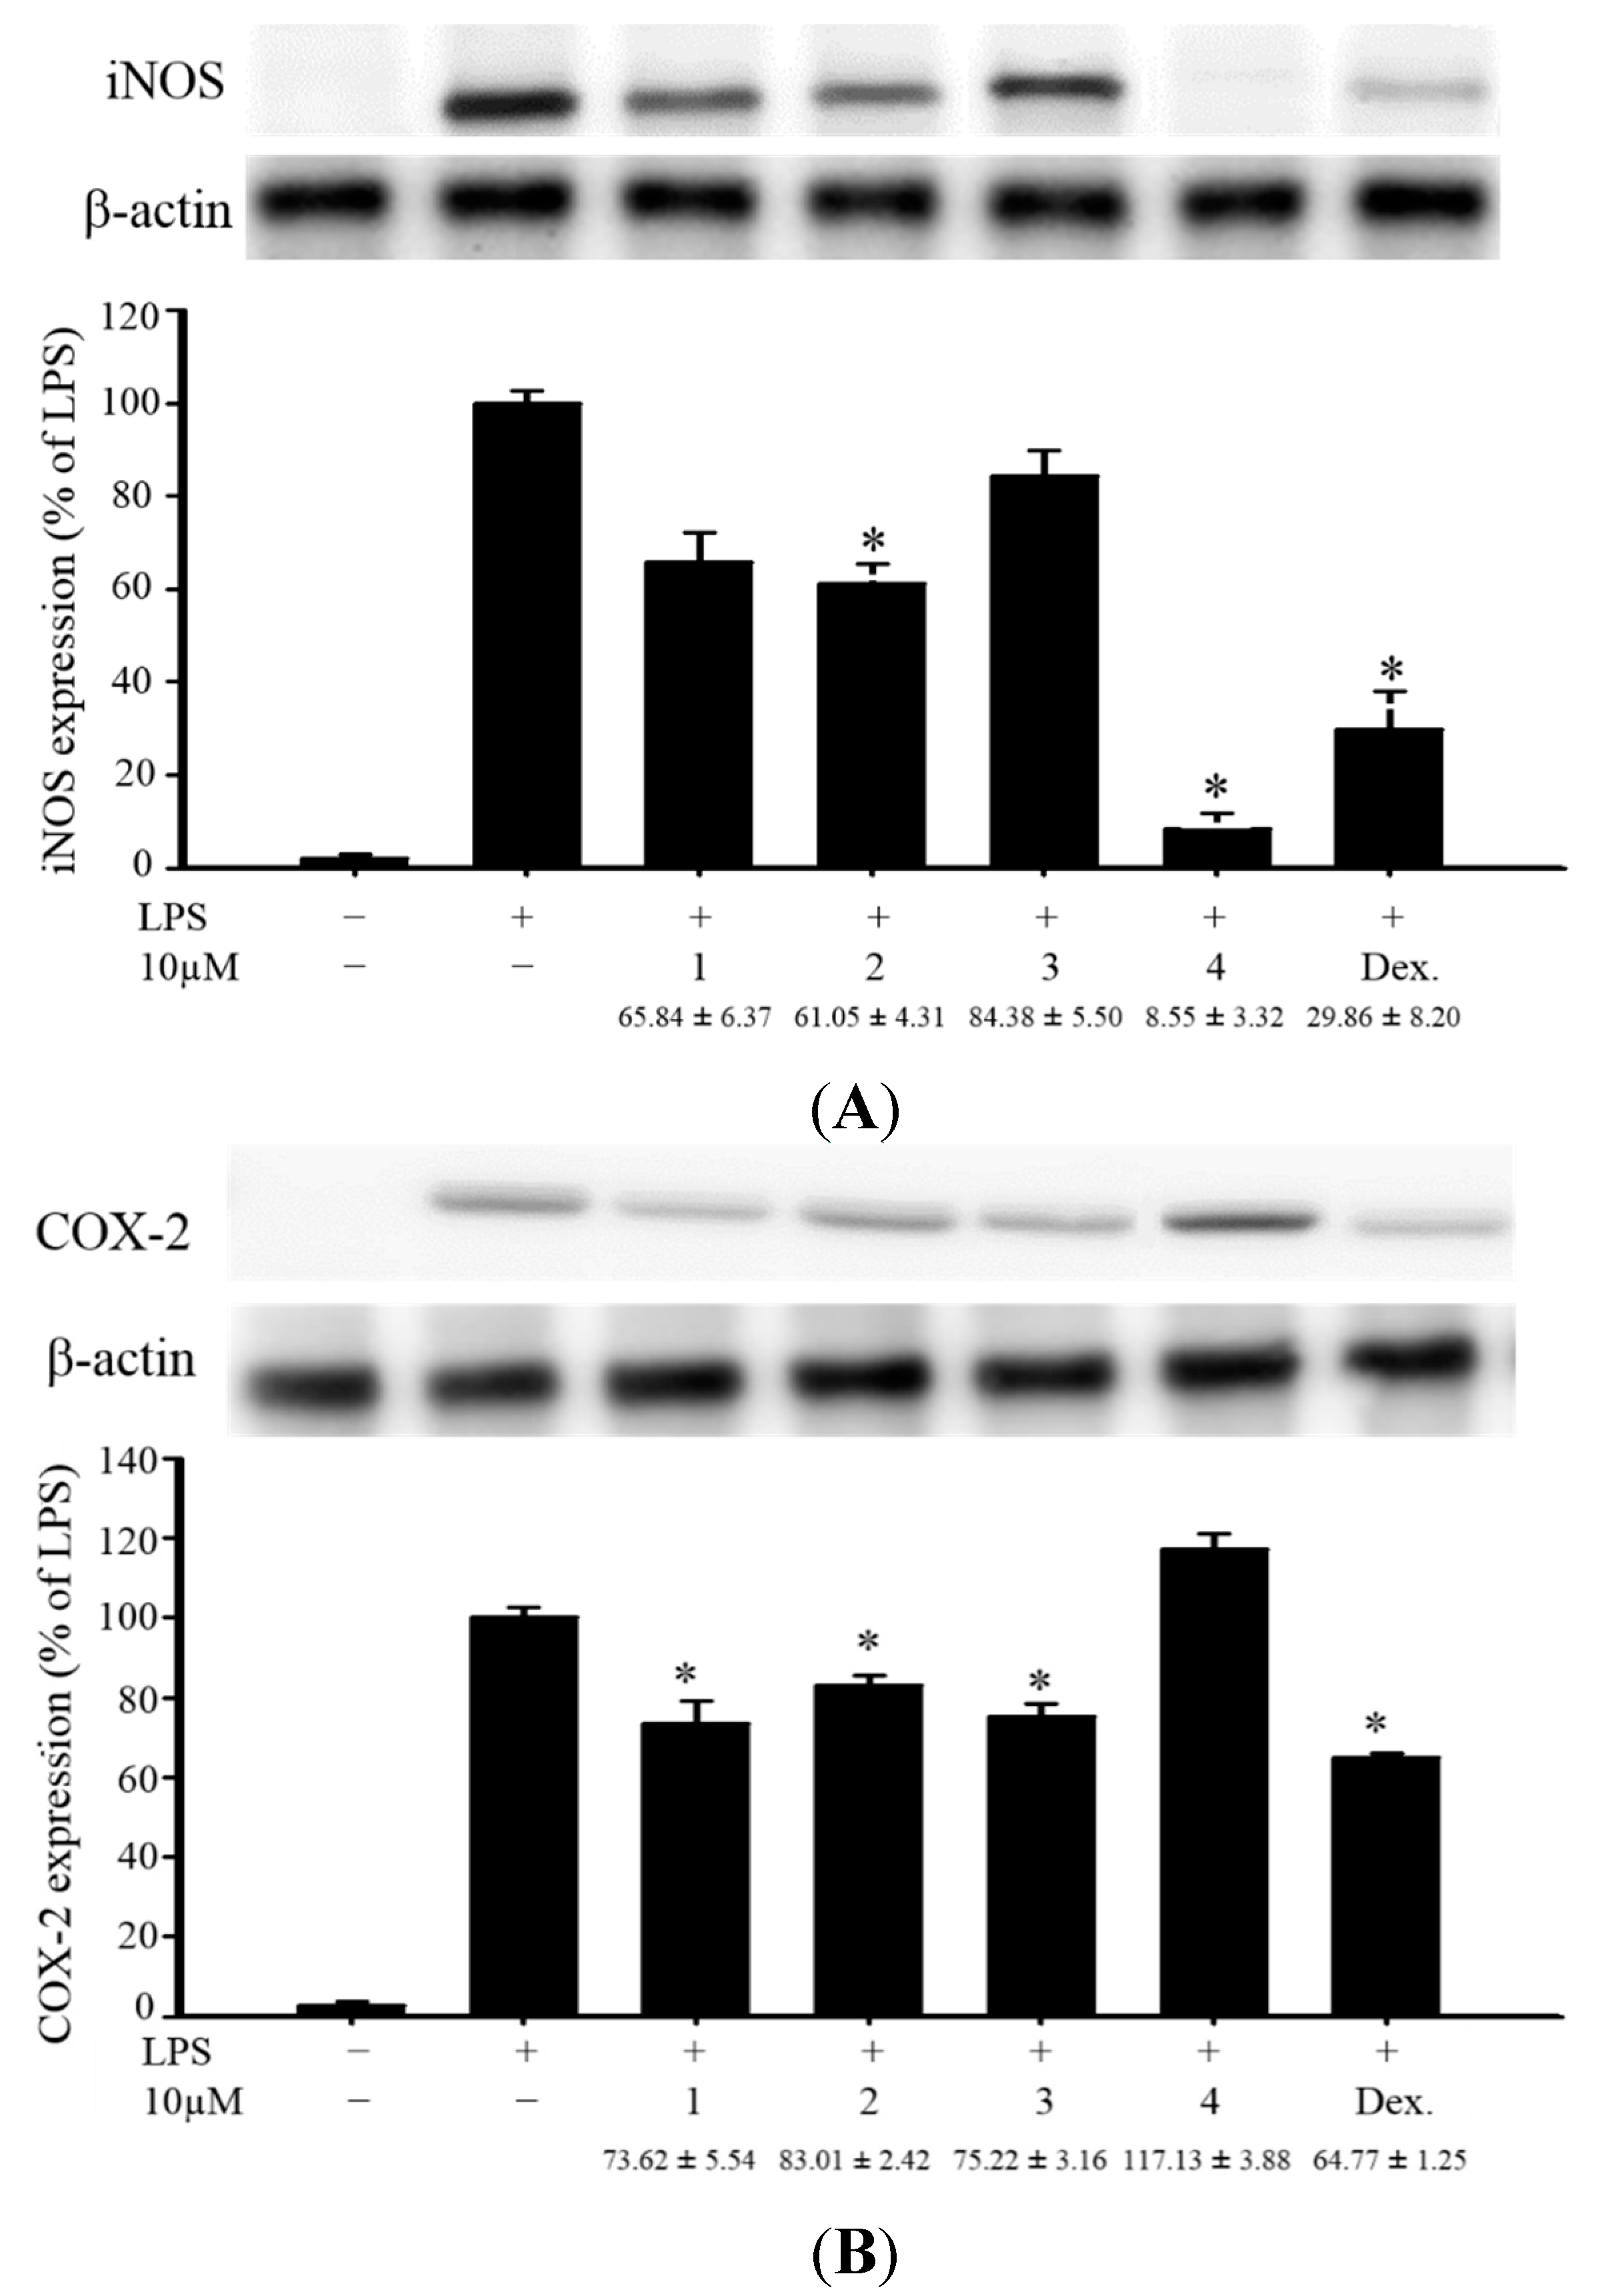
Figure 4.
Effects of compounds 1–4 on pro-inflammatory iNOS and COX-2 protein expression in LPS-stimulated murine macrophage cell line RAW264.7. (A) Relative density of iNOS immunoblot; (B) relative density of COX-2 immunoblot. The relative intensity of the LPS-stimulated group was taken to be 100%. Band intensities were quantified by densitometry and are indicated as the percent change relative to that of the LPS-stimulated group. Compound 4 and dexamethasone (Dex.) significantly inhibited LPS-induced iNOS protein expression in macrophage. The experiment was repeated three times. (* p < 0.05, significantly different from the LPS-stimulated group).
In the
in vitro anti-inflammatory activity test, the upregulation of the pro-inflammatory inducible nitric oxide synthase (iNOS) and cyclooxygenase-2 (COX-2) proteins expression of LPS (lipopolysaccharide) -stimulated RAW264.7 macrophage cells was evaluated using immunoblot analysis. At a concentration of 10 μM, compound
4 was found to significantly reduce the levels of iNOS to 8.55% ± 3.32%, relative to the control cells stimulated with LPS only (
Figure 4). Thus, compound
4 might be promising as an anti-inflammatory agent, as this compound did not exhibit cytotoxicity to RAW264.7 macrophage cells.
3. Experimental Section
3.1. General Experimental Procedures
Optical rotation values were measured with a Jasco P-1010 digital polarimeter (Japan Spectroscopic Corporation, Tokyo, Japan). IR spectra were recorded on a Jasco FT-4100 FT-IR spectrometer (Japan Spectroscopic Corporation, Tokyo, Japan); peaks are reported in cm−1. NMR spectra were recorded on a Varian Mercury Plus 400 NMR spectrometer (Varian Inc., Palo Alto, CA, USA) using the residual CHCl3 signal (δH 7.26 ppm) as the internal standard for 1H NMR and CDCl3 (δC 77.1 ppm) for 13C NMR. Coupling constants (J) are given in Hz. ESIMS and HRESIMS were recorded using a Bruker 7 Tesla solariX FTMS system (Bruker, Bremen, Germany). Column chromatography was performed on silica gel (230–400 mesh, Merck, Darmstadt, Germany). TLC was carried out on precoated Kieselgel 60 F254 (0.25 mm, Merck, Darmstadt, Germany); spots were visualized by spraying with 10% H2SO4 solution, followed by heating. Normal-phase HPLC (NP-HPLC) was performed using a system comprised of a Hitachi L-7110 pump (Hitachi Ltd., Tokyo, Japan) and a Rheodyne 7725 injection port (Rheodyne LLC, Rohnert Park, CA, USA). Two normal-phase columns (Supelco Ascentis® Si Cat #: 581514-U, 25 cm × 10 mm and 581515-U, 25 cm × 21.2 mm, 5 μm, Sigma-Aldrich, St. Louis, MO, USA) were used for HPLC. Reverse phase HPLC (RP-HPLC) was performed using a system comprised of a Hitachi L-2130 pump (Hitachi Ltd., Tokyo, Japan), a Hitachi L-2455 photodiode array detector (Hitachi Ltd., Tokyo, Japan), a Rheodyne 7725 injection port (Rheodyne LLC., Rohnert Park, CA, USA). A reverse phase column (Supelco Ascentis® Si Cat #: 581343-U, 25 cm × 10.0 mm, 5 μm, Sigma-Aldrich, St. Louis, MO, USA) was used for RP-HPLC.
3.2. Animal Material
Specimens of the octocoral Sinularia gaweli (Verseveldt, 1978) were collected by hand using self-contained underwater breathing apparatus (SCUBA) equipment off the coast of Sansiantai, Taitung county, Taiwan on 7 May 2013, and stored in a freezer (−20 °C) until extraction. A voucher specimen (NMMBA-TWSC-13031) was deposited in the National Museum of Marine Biology & Aquarium, Taiwan.
3.3. Extraction and Isolation
Sliced bodies of Sinularia gaweli (wet weight 2794 g, dry weight 756 g) were extracted with ethyl acetate (EtOAc). The EtOAc layer (20.5 g) was separated on silica gel and eluted using n-hexane/EtOAc (stepwise, 100:1→99:1→95:5→9:1→4:1→7:3→3:2→1:1→2:3→3:7→1:4→1:9→pure EtOAc, each fraction × 2 L) to yield 21 fractions, A–U, by thin layer chromatography (TLC) analysis. Fraction G (collected from the fraction eluted using n-hexane/EtOAc 4:1) was chromatographed on NP-HPLC using a mixture of n-hexane and acetone (4:1) to afford nine fractions, G1–G9. Fraction G5 was separated by NP-HPLC using a mixture of dichloromethane (DCM) and acetone (50:1, flow rate: 1.0 mL/min) to afford 2 (2.8 mg, tR = 38 min). Fraction H (collected from the fraction eluted using n-hexane/EtOAc 7:3) was chromatographed on NP-HPLC using a mixture of n-hexane and EtOAc (3:1) to afford 14 fractions, H1–H14. Fraction H9 was separated by NP-HPLC using a mixture of n-hexane and acetone (5:1, flow rate: 0.5 mL/min) to afford 1 (0.5 mg, tR = 80 min). Fraction N (collected from the fraction eluted using n-hexane/EtOAc 1:1) was separated on silica gel and eluted using n-hexane and acetone (stepwise, 6:1–1:1) to yield 16 fractions, N1–N16. Fraction N11 was separated by on NP-HPLC using a mixture of n-hexane and acetone (2:1) to afford 3 (6.6 mg, tR = 23 min). Fraction P (collected from the fraction eluted using n-hexane/EtOAc 2:3) was chromatographed on NP-HPLC using a mixture of n-hexane and acetone (2:1) to afford 12 fractions, P1–P12. Fraction P7 was separated by RP-HPLC using a mixture of methanol and H2O (60:40, flow rate: 3.0 mL/min) to afford 4 (1.4 mg, tR = 120 min).
Verticillatol (
1): colorless oil;
−113 (
c 0.17, CHCl
3) (reference [
5],
−41.2 (
c 0.13, CHCl
3)); IR (neat) ν
max 3444 cm
−1;
1H and
13C NMR data were found to be in full agreement with those reported previously [
6].
5α-Acetoxy-4(14)-eudesmene-1β-ol (
2): colorless oil;
+75 (
c 0.93, MeOH) (
+25 (
c 0.93, CHCl
3)); IR (neat) ν
max 3465, 1735 cm
−1;
1H (400 MHz, CDCl
3) and
13C (100 MHz, CDCl
3) NMR data, see
Table 1; ESIMS:
m/
z 303 [M + Na]
+; HRESIMS:
m/
z 303.19293 (calcd for C
17H
28O
3 + Na, 303.19307).
(–)-Leptodiol acetate (
3): white solid; mp 183–185 °C;
−24 (
c 0.33, CHCl
3) (
−10 (
c 0.33, CH
2Cl
2)); IR (neat) ν
max 3502, 1785, 1734 cm
−1;
1H and
13C NMR data were found to be in full agreement with those reported previously [
8]; ESIMS:
m/
z 529 [M + Na]
+; HRESIMS:
m/
z 529.16777 (calcd for C
25H
30O
11 + Na, 529.16803).
Sinulacembranolide A (
4): white solid; mp 120–123 °C;
−10 (
c 0.07, CHCl
3); IR (neat) ν
max 3481, 1756, 1721 cm
−1;
1H (400 MHz, CDCl
3) and
13C (100 MHz, CDCl
3) NMR data, see
Table 2; ESIMS:
m/
z 513 [M + Na]
+; HRESIMS:
m/
z 513.17338 (calcd for C
25H
30O
10 + Na, 513.17312).
3.4. In Vitro Anti-Inflammatory Assay
Murine macrophage (RAW264.7) cell line was purchased from ATCC.
In vitro anti-inflammatory activity of compounds
1–
4 was measured by examining the inhibition of lipopolysaccharid (LPS)-induced up-regulation of pro-inflammatory inducible nitric oxide synthase (iNOS) and cyclooxygenase-2 (COX-2) protein expression in macrophage cells using Western blotting analysis [
12,
13,
14]. Briefly, inflammation in macrophages was induced by incubating them for 16 h in a medium containing only LPS (10 ng/mL) without compounds. For anti-inflammatory activity assay, compounds
1–
4 and dexamethasone (10 μM) were added the cells 10 min before LPS challenge. The cells then underwent Western blot analysis. The immunoreactivity data are calculated with respect to the average optical density of the corresponding LPS-stimulated group. For statistical analysis, the data were analyzed by a one-way analysis of variance (ANOVA), followed by the Student-Newman-Keuls
post hoc test for multiple comparisons. A significant difference was defined as a
p value of <0.05.


 ,
, 

