Article

Comparative Analysis of the Brassica napus Root and Leaf Transcript Profiling in Response to Drought Stress

1
National Key Laboratory of Crop Genetic Improvement, National Center of Rapeseed Improvement in Wuhan, Huazhong Agricultural University, Wuhan 430070, China
2
Key Laboratory of Oil Crop Biology and Genetic Breeding of the Ministry of Agriculture, Oil Crops Research Institute, Chinese Academy of Agriculture Sciences, Wuhan 430062, China
*
Author to whom correspondence should be addressed.
Int. J. Mol. Sci. 2015, 16(8), 18752-18777; https://doi.org/10.3390/ijms160818752
Submission received: 12 June 2015 / Revised: 28 July 2015 / Accepted: 30 July 2015 / Published: 11 August 2015
(This article belongs to the Special Issue Plant Molecular Biology)

Abstract

:
Drought stress is one of the major abiotic factors affecting Brassica napus (B. napus) productivity. In order to identify genes of potential importance to drought stress and obtain a deeper understanding of the molecular mechanisms regarding the responses of B. napus to dehydration stress, we performed large-scale transcriptome sequencing of B. napus plants under dehydration stress using the Illumina sequencing technology. In this work, a relatively drought tolerant B. napus line, Q2, identified in our previous study, was used. Four cDNA libraries constructed from mRNAs of control and dehydration-treated root and leaf were sequenced by Illumina technology. A total of 6018 and 5377 differentially expressed genes (DEGs) were identified in root and leaf. In addition, 1745 genes exhibited a coordinated expression profile between the two tissues under drought stress, 1289 (approximately 74%) of which showed an inverse relationship, demonstrating different regulation patterns between the root and leaf. The gene ontology (GO) enrichment test indicated that up-regulated genes in root were mostly involved in “stimulus” “stress” biological process, and activated genes in leaf mainly functioned in “cell” “cell part” components. Furthermore, a comparative network related to plant hormone signal transduction and AREB/ABF, AP2/EREBP, NAC, WRKY and MYC/MYB transcription factors (TFs) provided a view of different stress tolerance mechanisms between root and leaf. Some of the DEGs identified may be candidates for future research aimed at detecting drought-responsive genes and will be useful for understanding the molecular mechanisms of drought tolerance in root and leaf of B. napus.

1. Introduction

Currently, 70% of total fresh water is used for agricultural consumption and a decrease of fresh water has caused serious environmental stress [1]. Rapeseed (Brassica napus L.) is one of the most important oil crops due to its edible oil and the meal that remains after oil extraction [2,3]. The growing threat of global warming and reduction in available fresh water have promoted the development of resistant rapeseed cultivars [4]. Plant root is an important tissue for the uptake of soil water and nutrients and for perceiving and transmitting soil water deficit signals to the shoot. Plant leaf plays critical roles in releasing water vapor through transpiration; especially in hot, dry, windy environments, water evaporates quickly. Under drought stress, to uptake enough water through the root and close stoma to avoid water loss through the leaf are critical to defend stress. When water uptake and water loss cannot keep balance by primary adaptive responses, different drought mechanisms through abscisic acid (ABA) and other signaling pathways, may be exploited to avoid and/or tolerate dehydration in root and leaf [5,6,7].
Various genes that function as stress sensors in signaling transduction pathways, which comprise a network of protein-protein reactions, transcription factors (TFs) and promoters, are activated in Arabidopsis and other plants [8,9]. Several pathways independently respond to environmental stresses through ABA dependent- and independent-manner, suggesting an extremely intricate gene regulatory network. The phytohormone ABA, which is triggered by stress, functions mainly in regulating plant water balance, stomatal closure, and coordinating the complex gene regulatory network enabling plants to cope with decreased water availability. Nearly 10% of the protein-coding genes in Arabidopsis were regulated by ABA [10]. The exogenous application of ABA also activates a number of genes that respond to dehydration stress [11]. Recently, a new model for ABA action, in which PYR/PYL/RCAR receptors function at the apex of a negative regulatory pathway to inhibit PP2C phosphatases and, in turn, directly increase SnRK2 kinases to trigger bZIP TFs and ABA-induced genes expression, has been proposed and validated [12,13,14,15]. This pathway is also critical for the direct control of guard cell physiology, which, in turn, regulates the stomatal response to stresses [16].
Most of the stress-inducible genes are dependent upon their interaction with TFs. As master regulators of gene transcription, TFs regulate activities of these factors, thereby employing or obstructing access of RNA polymerases to the DNA template [17]. In the Arabidopsis thaliana genome, approximately 1500 TFs are involved in stress responsive gene expression. Some of them are controlled by ABA but others are not [18]. ABA-dependent signaling systems regulons included: ABA-responsive element-binding proteins (ABRE), ABA binding factor (ABF), myeloblastosis related proteins (MYB), myelocytomatosis related proteins (MYC); While ABA-independent regulons are: APETALA2/ETHYLENE-RESPONSIVE ELEMENT BINDING FACTORS (AP2/EREBP), no apical meristem (NAM), Arabidopsis transcription activation factor (ATAF), and cup-shaped cotyledon (CUC) (NAC) and ZF-HD (zinc finger homeodomain) regulon [19]. In addition, several studies have identified the existence of function through both ABA-dependent and -independent pathways of stress response such as AP2/EREBP (ERF) family members [20].
As molecular responses, the interaction partners of the TFs determine the activation or repression of response pathways and are crucial to understand the regulatory networks that modulate plant defense responses, for example, AREB/ABF TFs and ABI5 can bind to ABRE, which is a major cis-acting element controlling ABA-responsive expression of the Arabidopsis RD29B, COR78, LTI78, and RD20 gene; MYC and MYB TFs are shown to bind cis-elements MYCRS and MYBRS in the RD22 promoter and co-operatively activate RD22; AP2/EREBP binds to DRE/CRT elements in the RD29A promoter; NAC TFs are identified as DNA-binding proteins interacting with cis-elements in ERD1 promoter, analysis of which involved dehydration stress induction and in dark-induced senescence; many JA-inducible genes are target genes of RD26, which is a drought-inducible gene encoding a NAC TF [11]. WRKYGQK (WRKY) TFs have been shown to bind the TTGACC/T sequence (W-box) of the promoters of several important ABA-responsive or signaling genes, such as ABI4, ABI5, ABF4, MYB2, DREB1A, DREB2A, RAB18, RD29A, and COR47 [21]. All these TFs function as transcriptional activators in the expression of stress-inducible genes [22].
Evaluations of the response of plant genotypes to drought stress have led to progress in the development of drought-resistant crops through both classical breeding efforts and modern genetic approaches [23,24,25,26]. Classical breeding approaches have revealed that stress-tolerance traits are mainly quantitative trait loci (QTLs), through which we have identified many stress-related genes, such as Bo1, a major boron tolerance QTL in bread (Triticum aestivum) [27], Sub1, a major submergence tolerance QTL in rice [28], Vgt1, a major flowering time QTL in maize [29] and the Stg1-Stg4, post-flowering drought-induced leaf senescence QTLs in Sorghum [30] and QTLs for water use traits in rapeseed [31,32]. However, the genetic selection of phenotypes response to drought stress is complex, ambiguous, and time-consuming; using classical breeding alone, even requires a broader interdisciplinary approach, involving an understanding of the factors. Recently, additional stress-inducible genes have been identified using transcriptomic analyses, such as microarray technology and ultrahigh-throughput RNA sequencing (RNA-seq). RNA-seq is a powerful technique that has been proven very useful for discovering many stress-inducible genes [33,34]. Recently, studies on the gene expression patterns of Arabidopsis [35,36], maize [37], wheat [38,39], barley [40,41], and rice [42,43] are common, and some have been performed on rapeseed stress [44], but the study on drought stress-responsive mechanism in Brassica napus (B. napus) has progressed slowly. In the present study, we performed large-scale transcriptome analysis of B. napus under air-dried dehydration stress using the Illumina sequencing technology for the purpose of obtaining a deeper understanding of the molecular mechanisms regarding B. napus responses to dehydration stress. Q2, a drought tolerant cultivar from Canada, was sampled at 0 and 24 h air dry treatment. We generated a total of more than 10 million reads from B. napus root and leaf, respectively. Then 6018 and 5377 genes were detected, differentially expressed in response to drought stress in root and leaf, respectively. The analyses showed that B. napus responded to dehydration mainly by down-regulating many biological processes, while those related to ABA signal transduction, phenylpropanoid biosynthesis, protection factors of macromolecules, and detoxification enzymes were highly activated. In addition, the two tissues of root and leaf showed distinctive differences in their gene expression profiles in response to drought stress. These sequencing datasets will serve as a valuable resource for candidate genes or markers that can be used to guide future efforts attempting to breed drought resistant B. napus cultivars.

2. Results and Discussion

2.1. Results

2.1.1. Transcriptome Sequencing of Drought Stress

Q2 is characterized as drought tolerant B. napus pure line cultivar [45,46]. In this study, drought stress was imposed by initiating air dry down protocol starting 95 days after seeding (DAS) [47]. To obtain an overview of the transcriptome of B. napus root and leaf in response to drought stress, four cDNA libraries were constructed using the Illumina sequencing technology. These cDNA libraries were from root and leaf that had been exposed to air for 0 h (CK) and 24 h (DS). Compared to the well-watered control condition (Control Check) CK, the stress treatment showed until a loss of 75% of fresh weight (DS). A total of 11,957,048 CK root (CKR) raw reads, 12,476,345 drought stress root (DSR) raw reads, 12,338,528 CK leaf (CKL) raw reads and 12,054,260 drought stress leaf (DSL) raw reads were sequenced in libraries, respectively. After filtering out low-quality data (tags containing unknown nucleotide “N” or only adaptor tags) and single-copy tags, the final numbers of CKR (11,763,435), DSR (12,308,861), CKL (12,168,994) and DSL (11,905,805) clean tags were obtained. The results of the Illumina sequencing are shown as in Table 1.
Table 1. Illumina sequencing reads in CK root (CKR), drought stress root (DSR), CK leaf (CKL) and drought stress leaf (DSL) libraries.
ItemsCKRDSRCKLDSL
Total Raw Reads11,957,04812,476,34512,338,52812,054,260
Reads Containing N22292822
Only Adaptors115,94581,69084,94168,814
Low Quality Reads77,64685,76584,56579,619
Clean Reads11,763,43512,308,86112,168,99411,905,805
CKR, root treated with water (air dry 0 h); DSR, root treated with drought stress (air dry 24 h); CKL, leaf treated with water (air dry 0 h); DSL, leaf treated with drought stress (air dry 24 h).

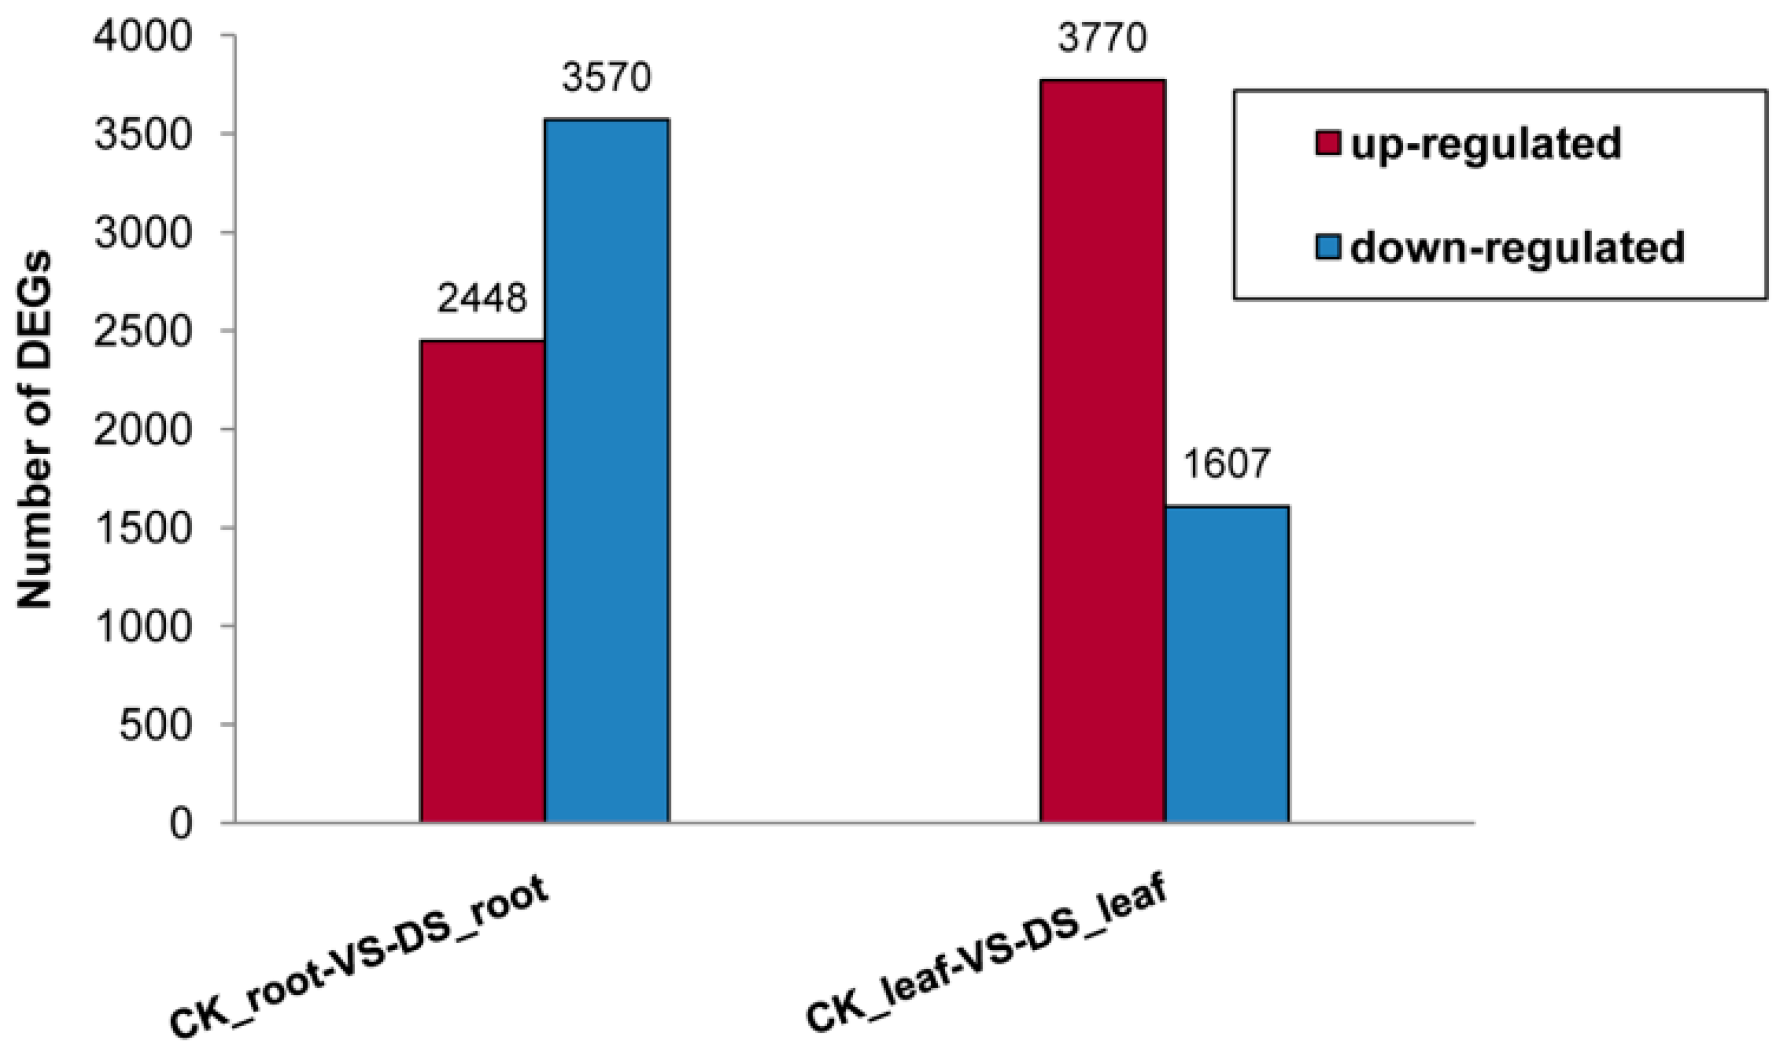
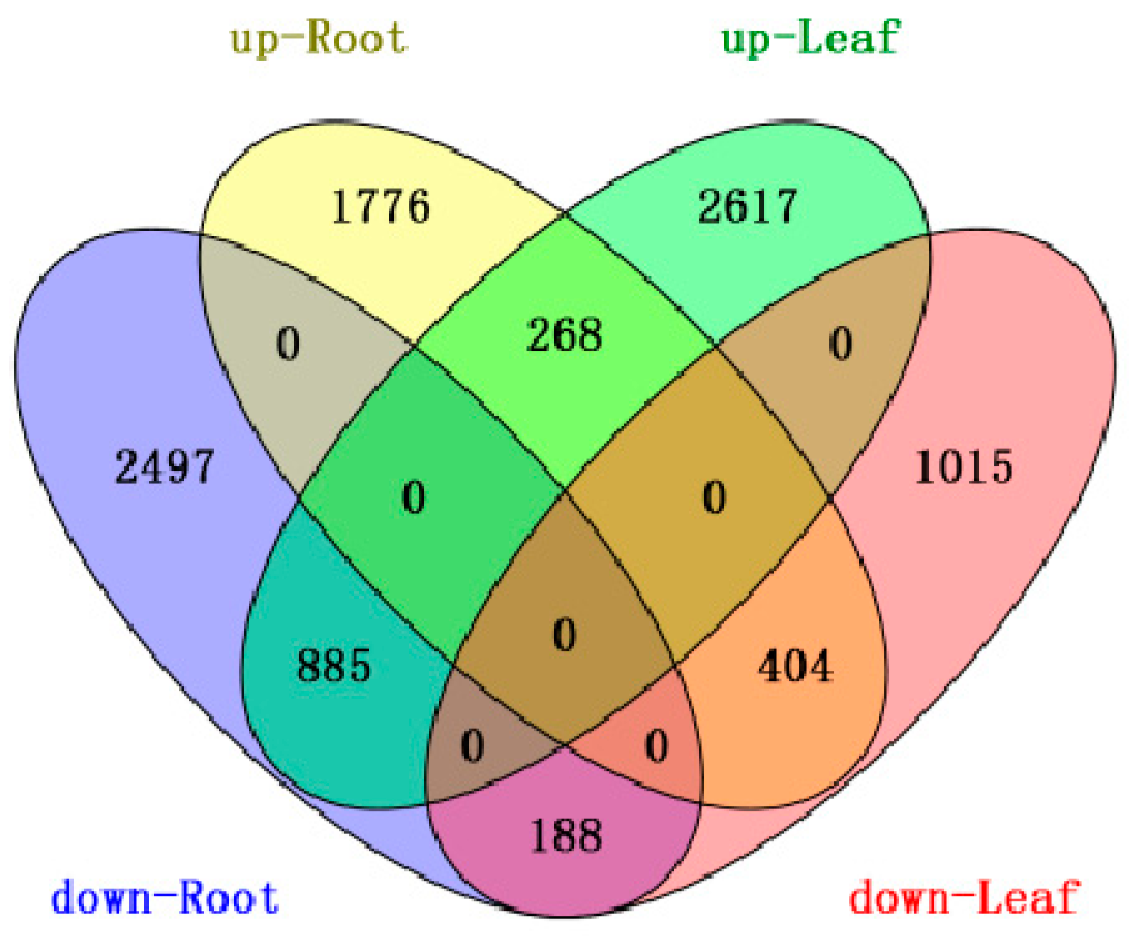
2.1.2. Differential Gene Expression between the Root and Leaf Libraries

Based on “the significance of digital gene expression profiles” [48], a rigorous algorithm was developed to identify the differentially expressed genes (DEGs) in the two samples. The expression abundance of tag-mapped genes in the datasets was analyzed by counting the number of transcripts per million (TPM) clean tags. Through a comparison of our four Illumina libraries, a great number of differentially expressed transcripts were identified, and based on the above-described algorithm, 6018 DEGs of B. rapa (Brassica rapa L.) (Supplementary Data S1) were detected with significantly different expression levels in root, which included 2448 up-regulated and 3570 down-regulated genes. In addition, 5377 DEGs of B. rapa (Supplementary Data S2) were detected in leaf, which included 3770 up-regulated genes and 1607 down-regulated genes (Figure 1). This result showed the majority of the down-regulated genes were expressed in root, whereas leaf DEGs exhibited more up-regulated genes. In addition, we considered specific DEGs in root compared with leaf. A total of 3632 and 4273 unique DEGs were specifically expressed in root and leaf, respectively, and 1745 genes were identified in both root and leaf (Figure 2). Among the 1745 co-expressed genes, 268 and 188 genes were simultaneously up- and down-regulated in root and leaf; While 404 genes were specifically up-regulated in root and down-regulated in leaf, 885 genes were specifically down-regulated in root and up-regulated in leaf (Figure 2). Approximately 75% of co-expressed DEGs were conversely regulated between root and leaf samples, showing different expression patterns of DEGs in root and leaf existed in response to drought stress.

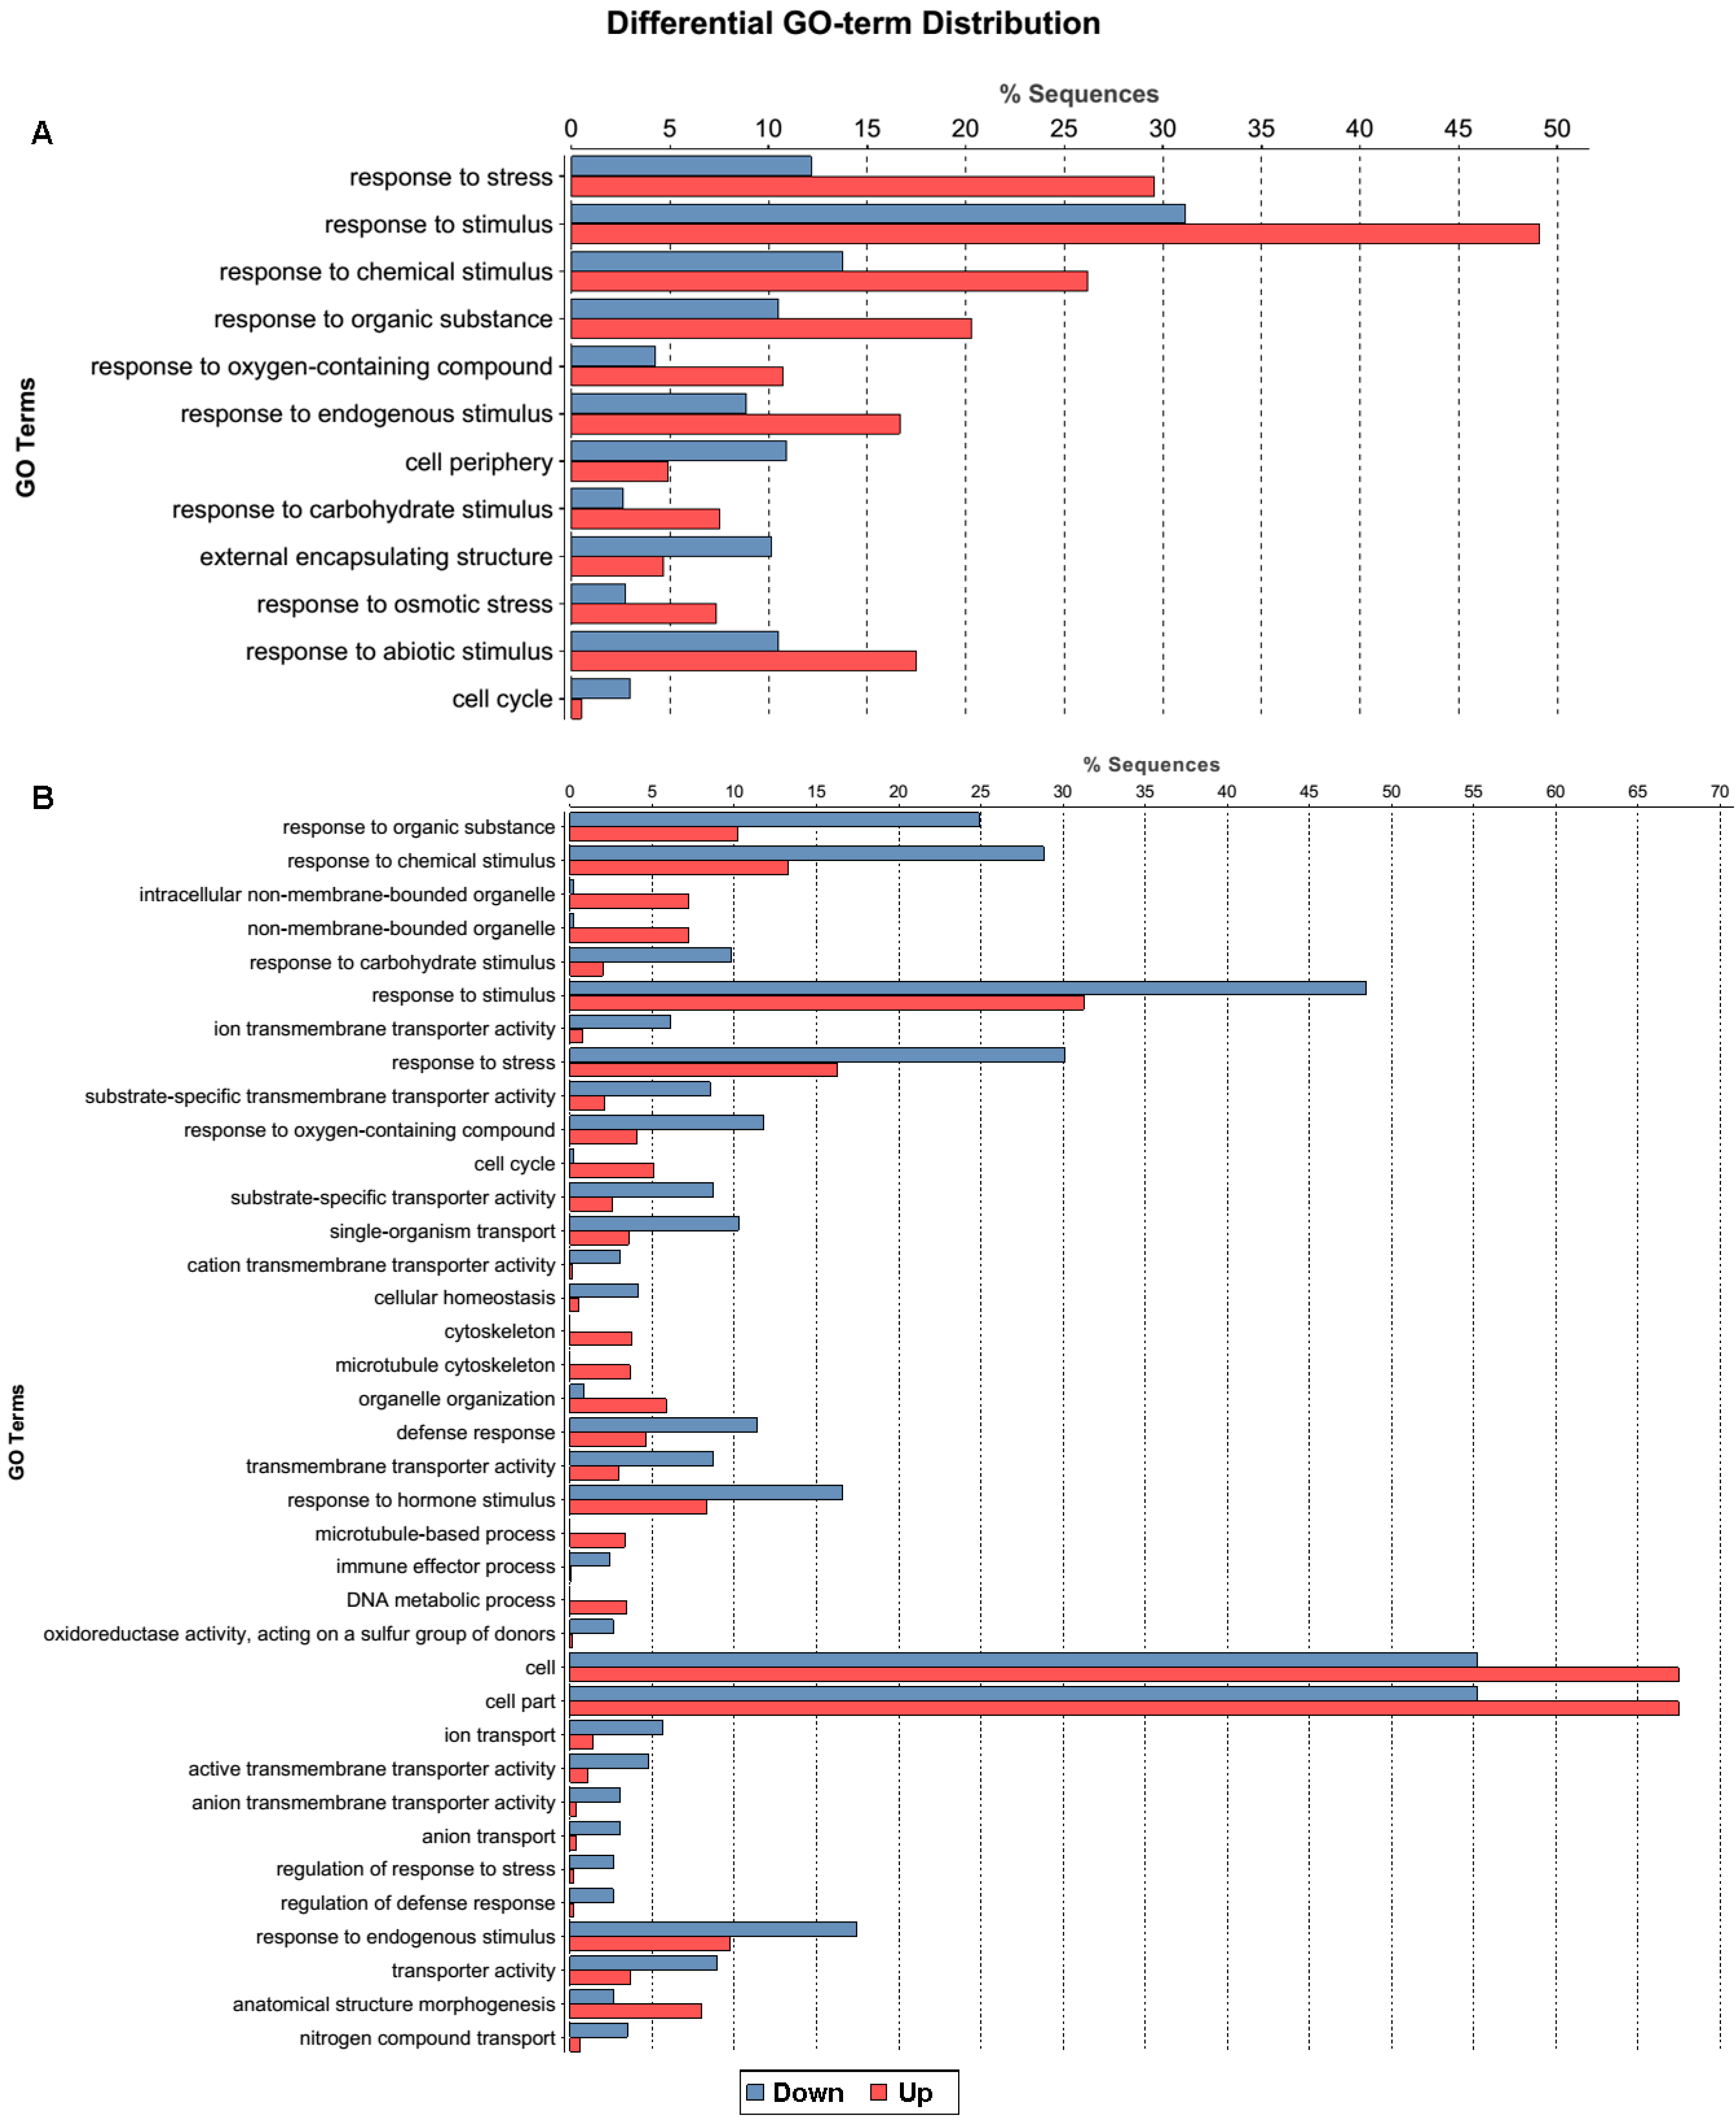
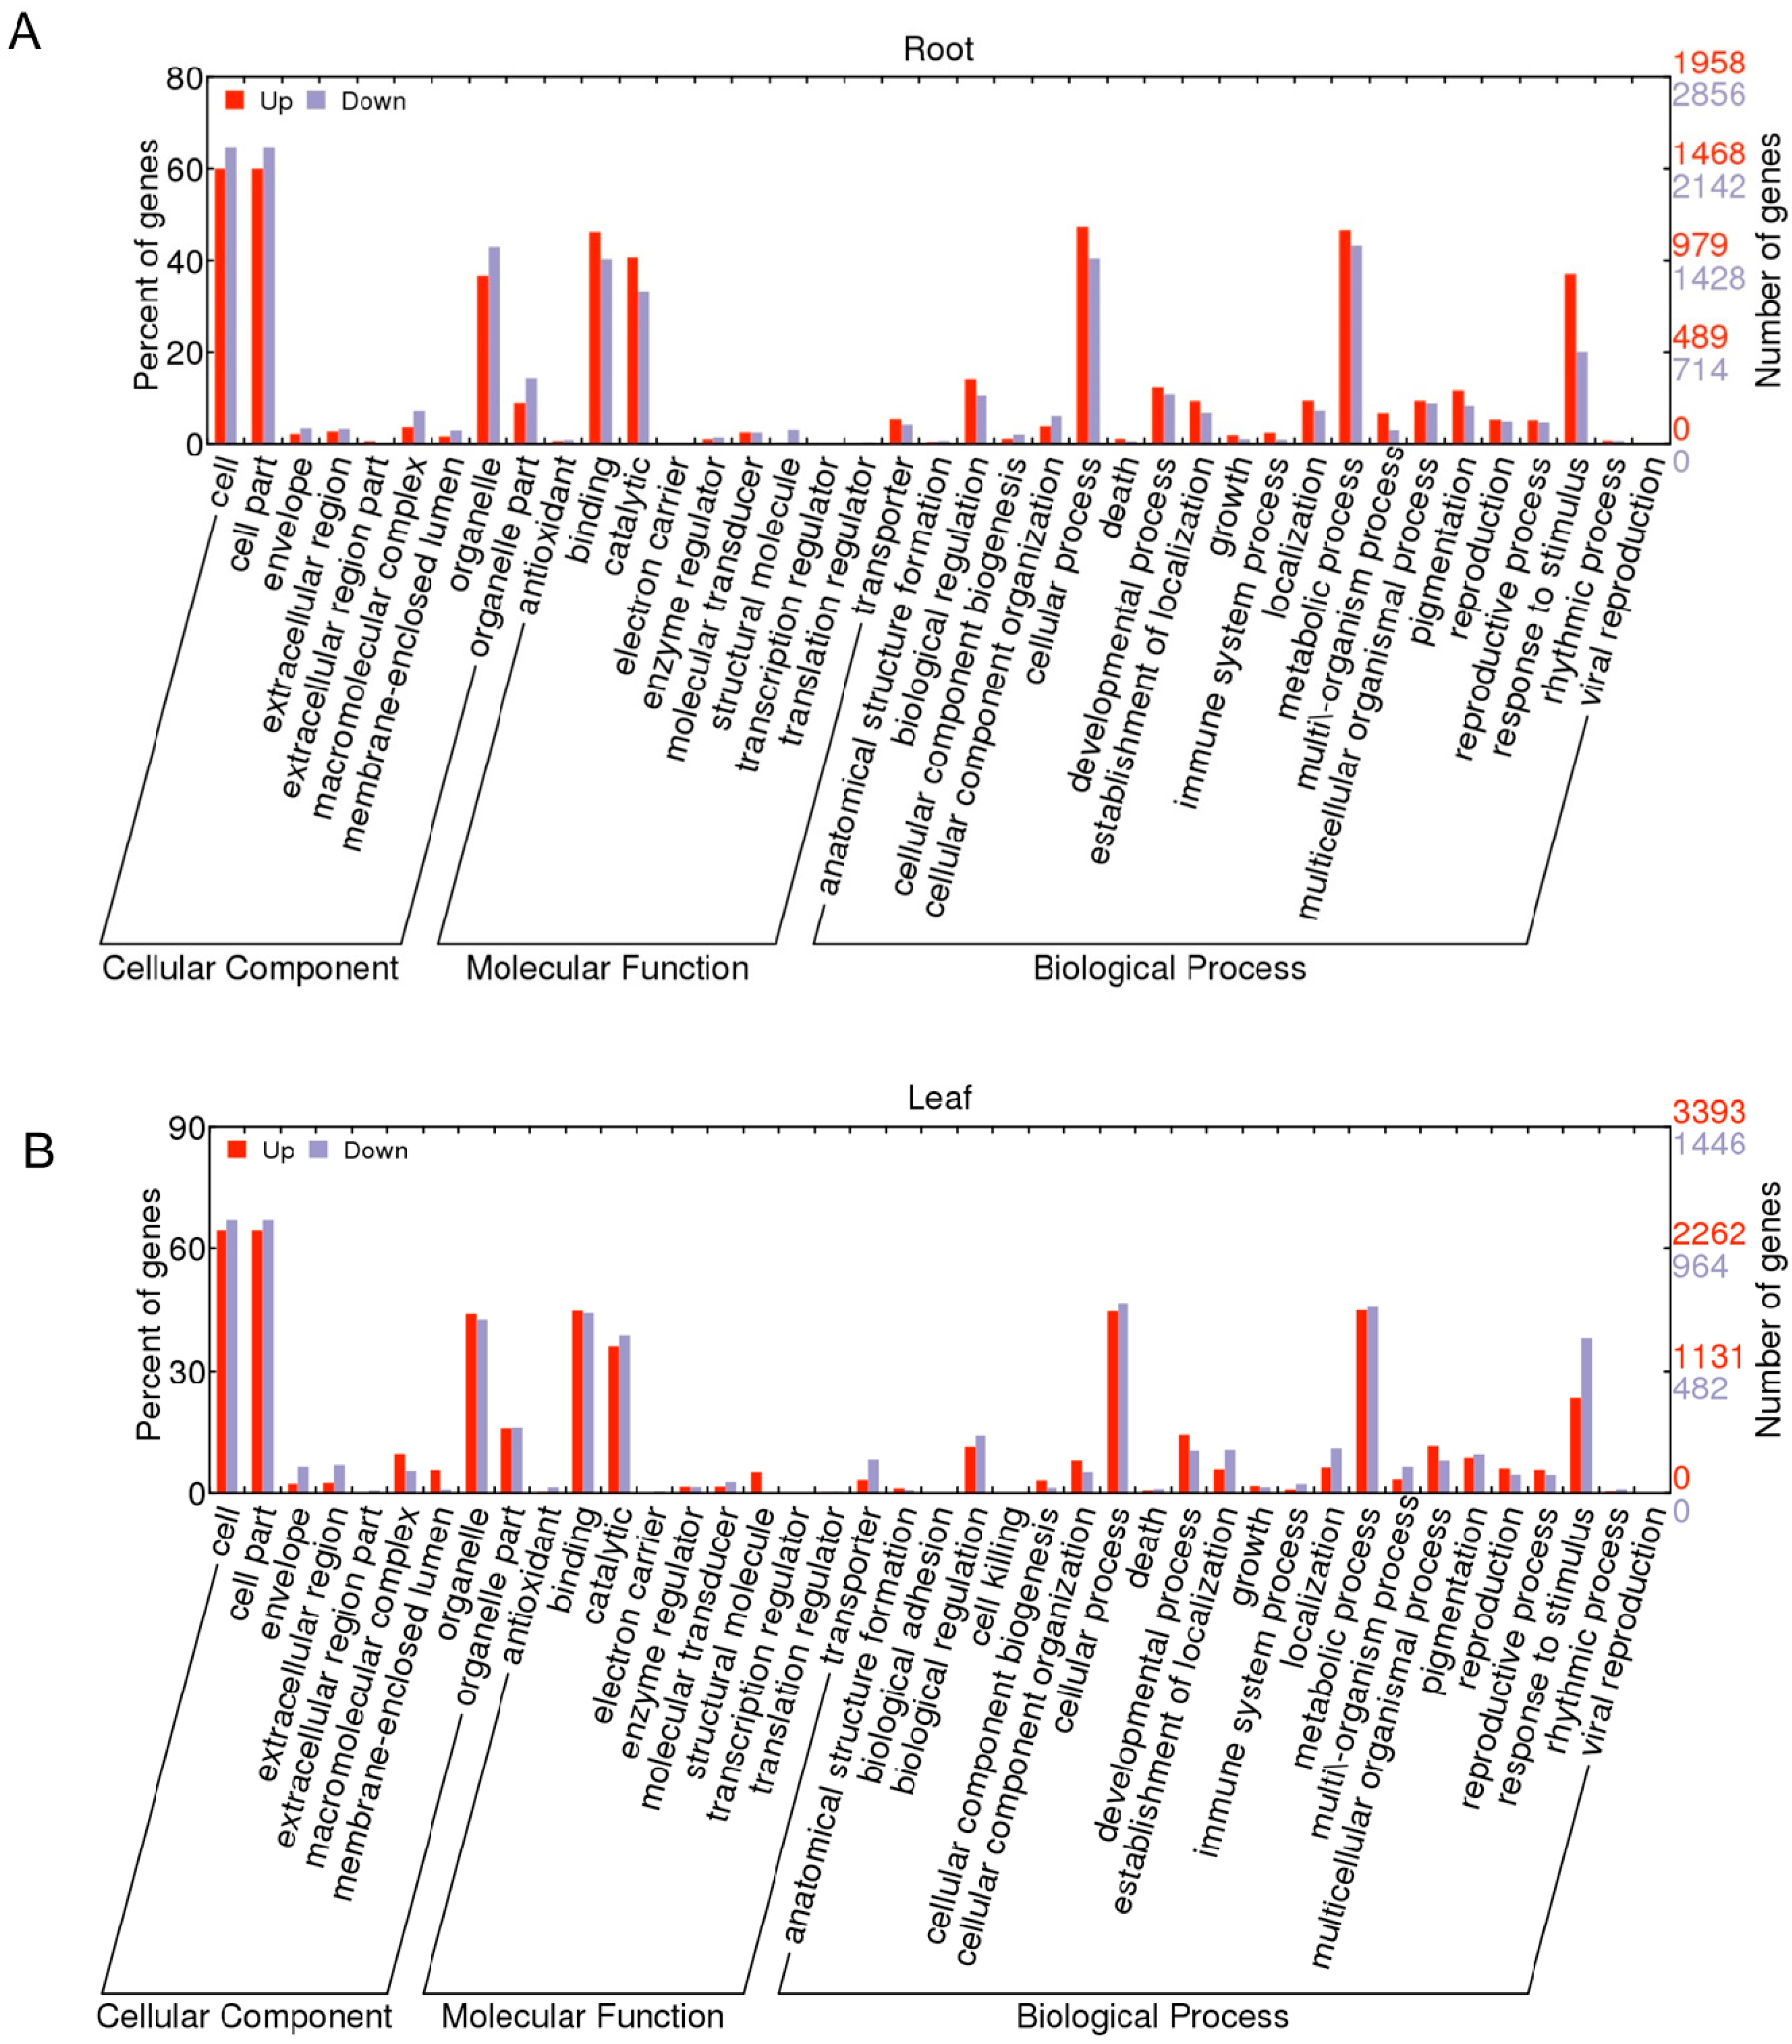
2.1.3. Gene Ontology Function Analysis of DEGs

Gene ontology (GO) is widely applied to understand the functional classification of differential gene expression data [49]. This analysis was performed to determine the major molecular functions, biological processes, and cellular components with which the DEGs were associated. A total of 6018 DEGs in root and 5377 DEGs in leaf of B. rapa were analyzed for GO category annotations using Blast2GO [50]. A GO term with p ≤ 0.001 and |log2| > 2 was defined as a significantly DEG-enriched GO term (Figure 3). Twelve GO terms were found as enriched biological processes based on the DEGs in root (Figure 3A): “response to stress”, “response to stimulus”, and “response to chemical stimulus”, which were the major GO terms. Simultaneously, more down-regulated genes were shown in “cell cycle”, “cell wall”, “external encapsulating structure” and “cell periphery” terms. However, 37 GO terms for the DEGs were found in leaf (Figure 3B): “cell”, “cell part”, and “organelle” were the major GO terms. Also comparatively higher contents of down-regulated genes were found in “response to stress” (63.0%), “response to chemical stimulus” (73.7%), and “response to stimulus” (52.7%) terms. Overall, most stress-related biological processes were up-regulated in root but down-regulated in leaf, and cellular components were mostly down-regulated in root but up-regulated in leaf. This GO terms enrichment analysis showed the critical biological processes in response to drought stress. We concluded from this result that B. napus seedlings mostly used the same terms and pathways, but different models of gene regulation were present in different tissue types in response to drought-stress conditions. In addition, GO (Gene ontology) classifications were also obtained to investigate the functions of the unigenes (Figure 4). A total of 6018 DEGs in root and 5377 DEGs in leaf were classified into 42 groups, and all could be categorized into three main classifications: “cellular component”, “molecular function”, and “biological process.” Among the biological process category, “cell” (approximately 59.3% in root and 60.8% in leaf) and “cell part” (approximately 59.3% in root and 60.8% in leaf) were the most dominant groups. GO enrichment analysis was also carried out in root (Supplementary Table S1) and leaf (Supplementary Table S2). Among the biological process category, response to stimulus process (about 44.6%) was the most dominant group in root, followed by response to stress (about 23.2%), biosynthetic process (about 23.2%), cellular biosynthetic process (about 22.6%), and response to chemical stimulus (about 22.1%). Regarding molecular functions, 12.3% of the unigenes were assigned to nucleic acid binding transcription factor activity, followed by phosphotransferase activity, alcohol group as acceptor (about 9.8%) and protein kinase activity (about 9.4%). In the cellular component category, intrinsic to membrane (12.8% for both) was the dominant group, followed by cell periphery (about 9.7%). In leaf, response to stimulus (about 44%) was also the most dominant group, followed by response to stress (about 23.6%), response to abiotic stimulus (about 16.2%), cellular component organization or biogenesis (about 13.7%) in the biological process category. Regarding molecular functions in leaf, 11.1% of the unigenes were assigned to nucleic acid binding transcription factor activity, followed by structural molecule activity (about 5.4%). In the cellular component category, membrane (about 36.3%) was the dominant group, followed by organelle part (about 24.3%), intracellular organelle part (about 20.8%).
Figure 1. Changes in gene expression in Root and Leaf libraries. Numbers of up-regulated and down-regulated genes were summarized. CK_root-VS-DS_root refers to number of differentially expressed genes in root in response to drought stress; CK_leaf-VS-DS_leaf refers to number of differentially expressed genes in leaf in response to drought stress.
Ijms 16 18752 g001
Figure 2. Overlap of differentially expressed genes in root and leaf in response to drought. Four-way Venn diagram showed the overlap of up- and down-regulated differentially expressed genes in root and leaf in response to drought stress. Regions corresponding to genes that are up-regulated commonly in both root and leaf are shaded in green. Regions corresponding to genes that are down-regulated commonly in both root and leaf are shaded in purple. Regions corresponding to genes that are up-regulated in leaf and down-regulated in root are shaded in blue. Regions corresponding to genes that are up-regulated in root and down-regulated in leaf are shaded in orange.
Ijms 16 18752 g002
Figure 3. Statistical column diagram showing gene ontology (GO) annotation between up- and down-regulated differentially expressed genes (DEGs) in root (A) and leaf (B).
Ijms 16 18752 g003
Figure 4. GO annotation of the differentially expressed genes in root (A) and leaf (B). The x-axis indicates the sub-categories, the left y-axis indicates the percentage of a sub-category of genes in that category, and the right y-axis indicates the number of unigenes in a sub-category.
Ijms 16 18752 g004

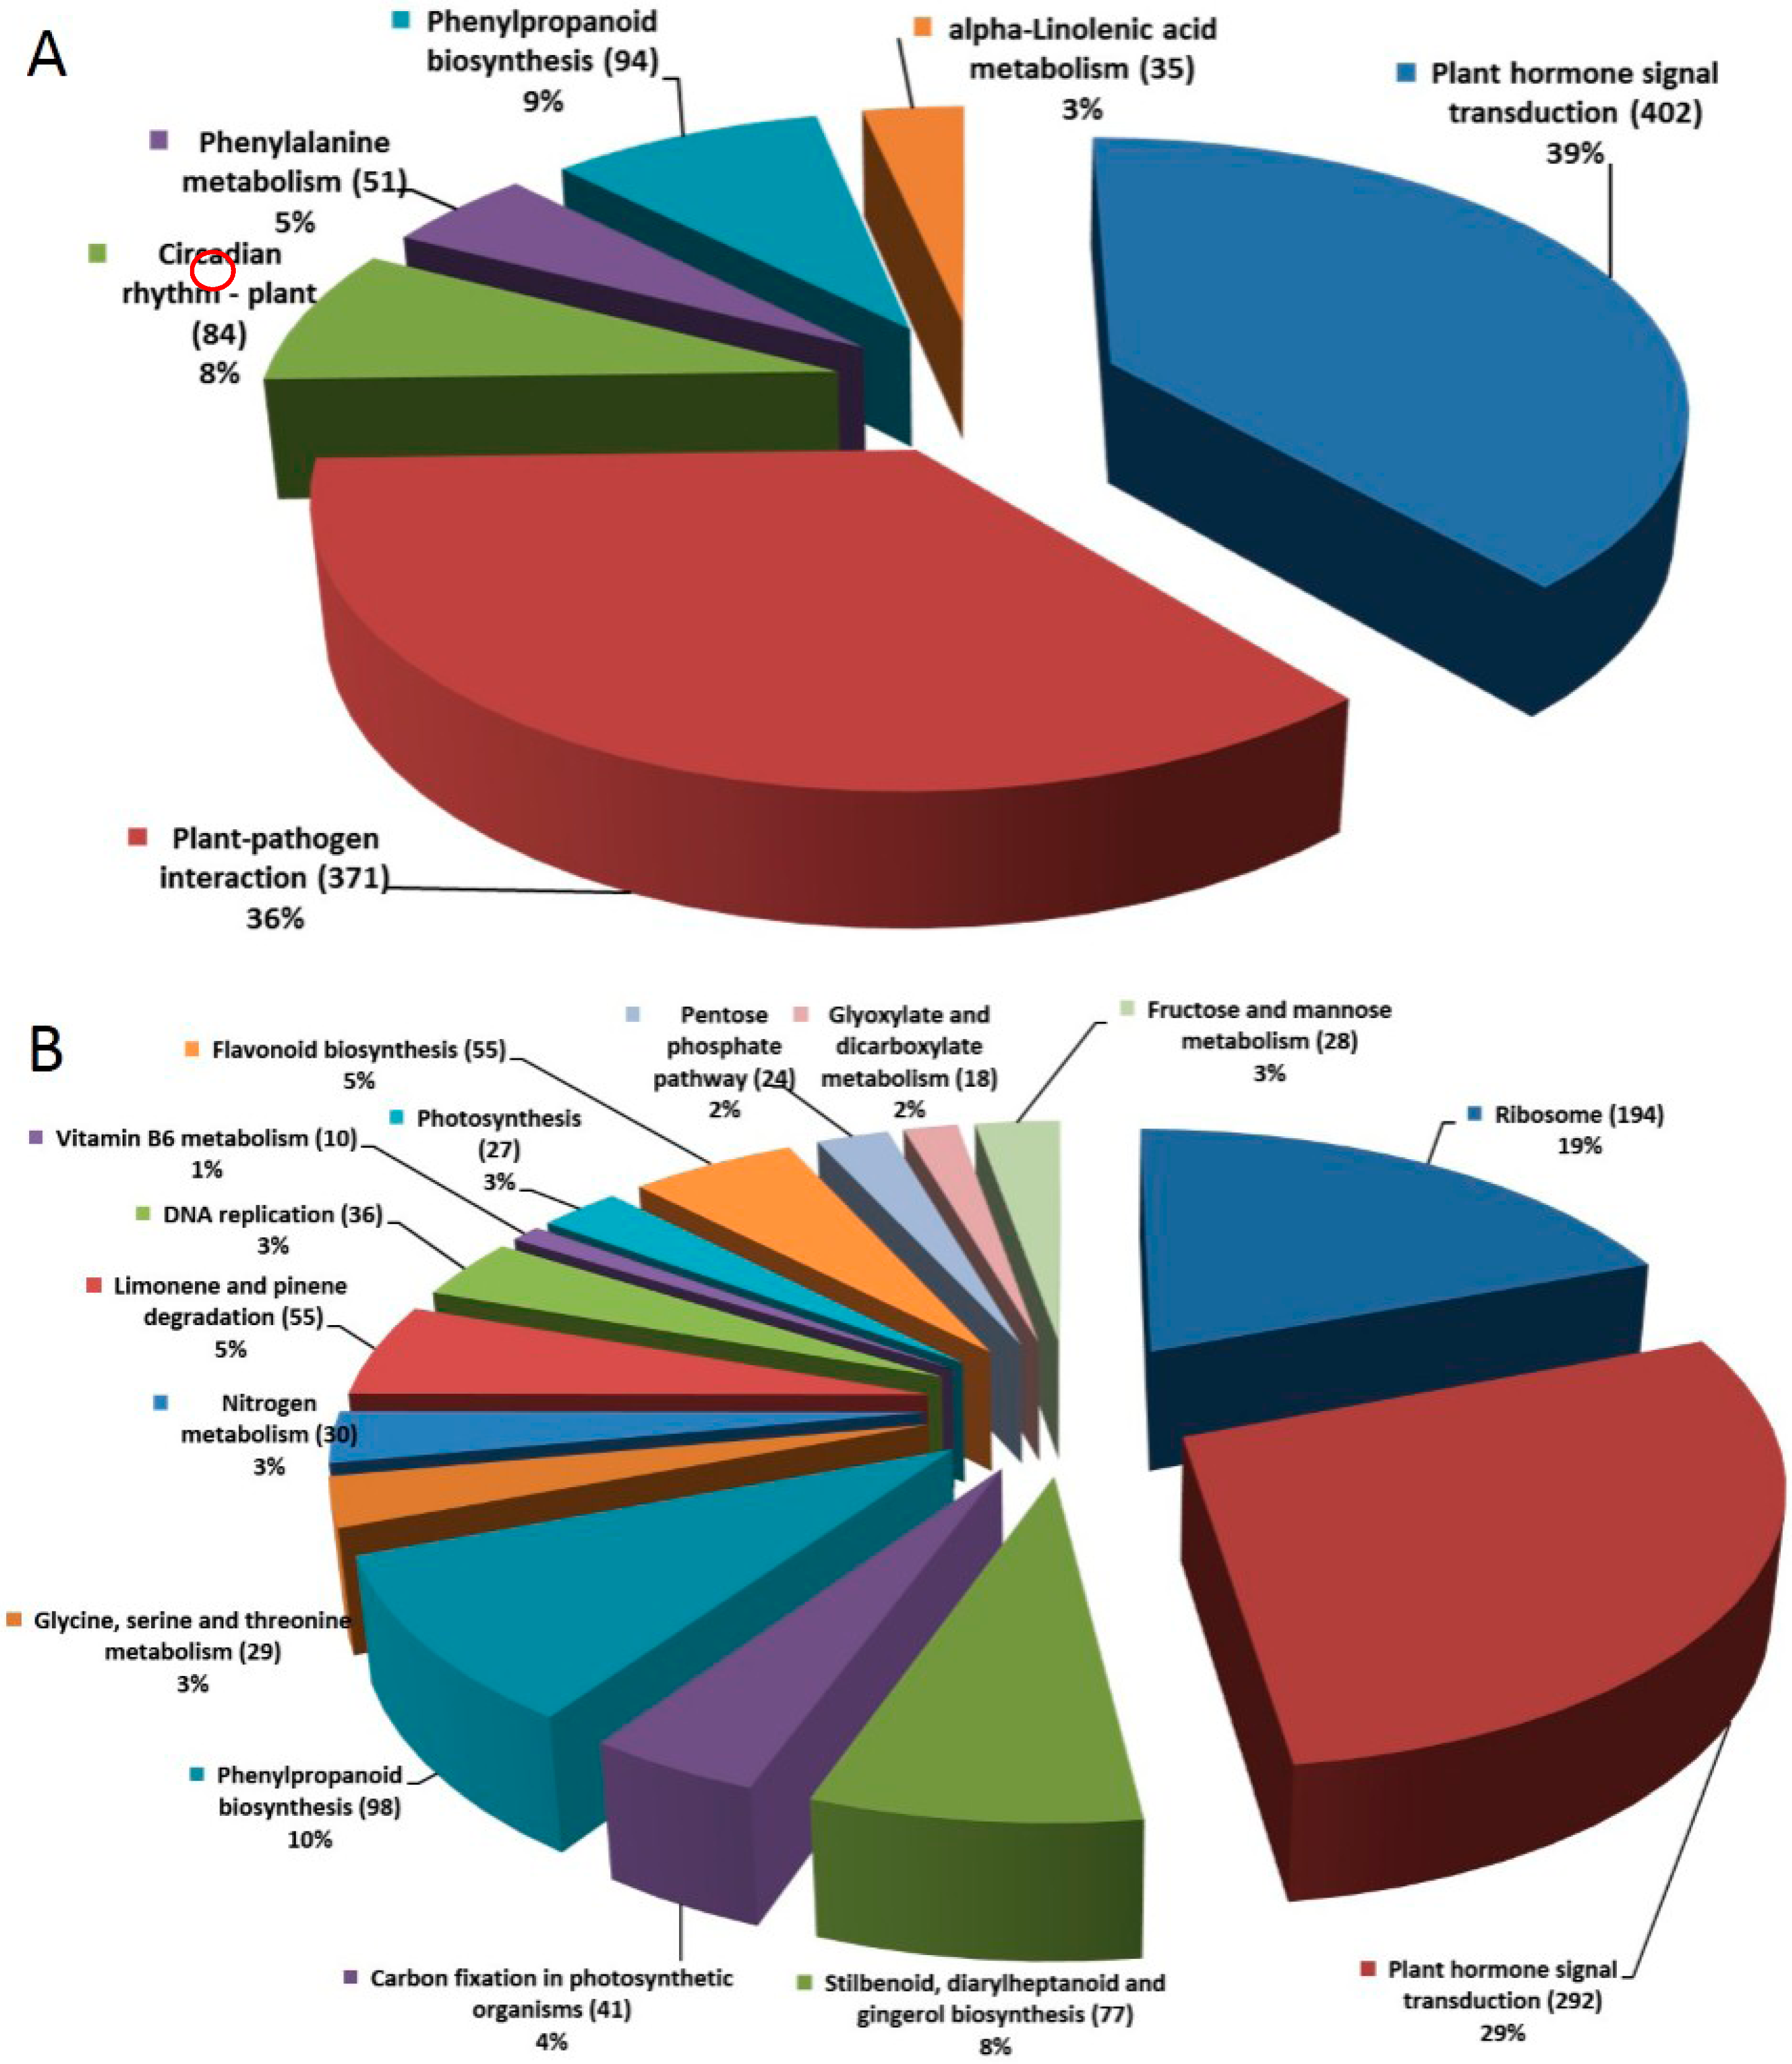
2.1.4. Pathway Analysis of the DEGs

The DEGs were further analyzed according to their various biological functions. Pathway-based analysis was used to further understand the biological functions of the DEGs. The biological pathways of the DEGs were identified using KEGG (Kyoto Encyclopedia of Genes and Genomes) pathway analysis as well as the major public pathway-related database and included “metabolic”, “signal transduction”, “protein transport and degradation” together with “genetic information processing” [51]. The obtained pathways are listed in Supplementary Table S3. The significantly enriched pathways that the up-regulated and down-regulated genes were involved in, were identified using the same statistical algorithms as in the GO analysis (Figure 5). Among the significantly enriched pathways in root, “plant hormone signal transduction” (402 members for B. rapa) was the largest complex comprising several plant hormone patterns, including ABA, auxin (AUX), cytokinin, gibberellins (GA), ethylene (ET), brassinosteroid (BR), jasmonic acid (JA), and salicylic acid (SA). It followed by “plant-pathogen interaction” (371 members for B. rapa), “phenylpropanoid biosynthesis” (94 members for B. rapa), “Circadian rhythm-plant” (84 members for B. rapa) and so on, all of which had a Q value <0.01 (Figure 5A).
In the leaf libraries, the enriched pathways (Q value < 0.01) included “ribosome” (194 members for B. rapa), “plant hormone signal transduction” (292 members for B. rapa), “phenylpropanoid biosynthesis” (98 members for B. rapa) and so on (Figure 5B). This finding suggested the important drought tolerance pathways response to drought stress such as “plant hormone signal transduction” and “phenylpropanoid biosynthesis” which were consistent with previous results [52,53,54,55]. In addition, regulation of phenylpropanoid biosynthesis pathways is becoming increasingly associated with the MYB family of TFs, which control both biotic and abiotic stress responses [56].
Figure 5. The summary enriched pathways of DEGs in root and leaf. (A) CK_root-VS-DS_root DEGs Pathway classification; (B) CK_leaf VS DS_leaf DEGs Pathway classification.
Ijms 16 18752 g005

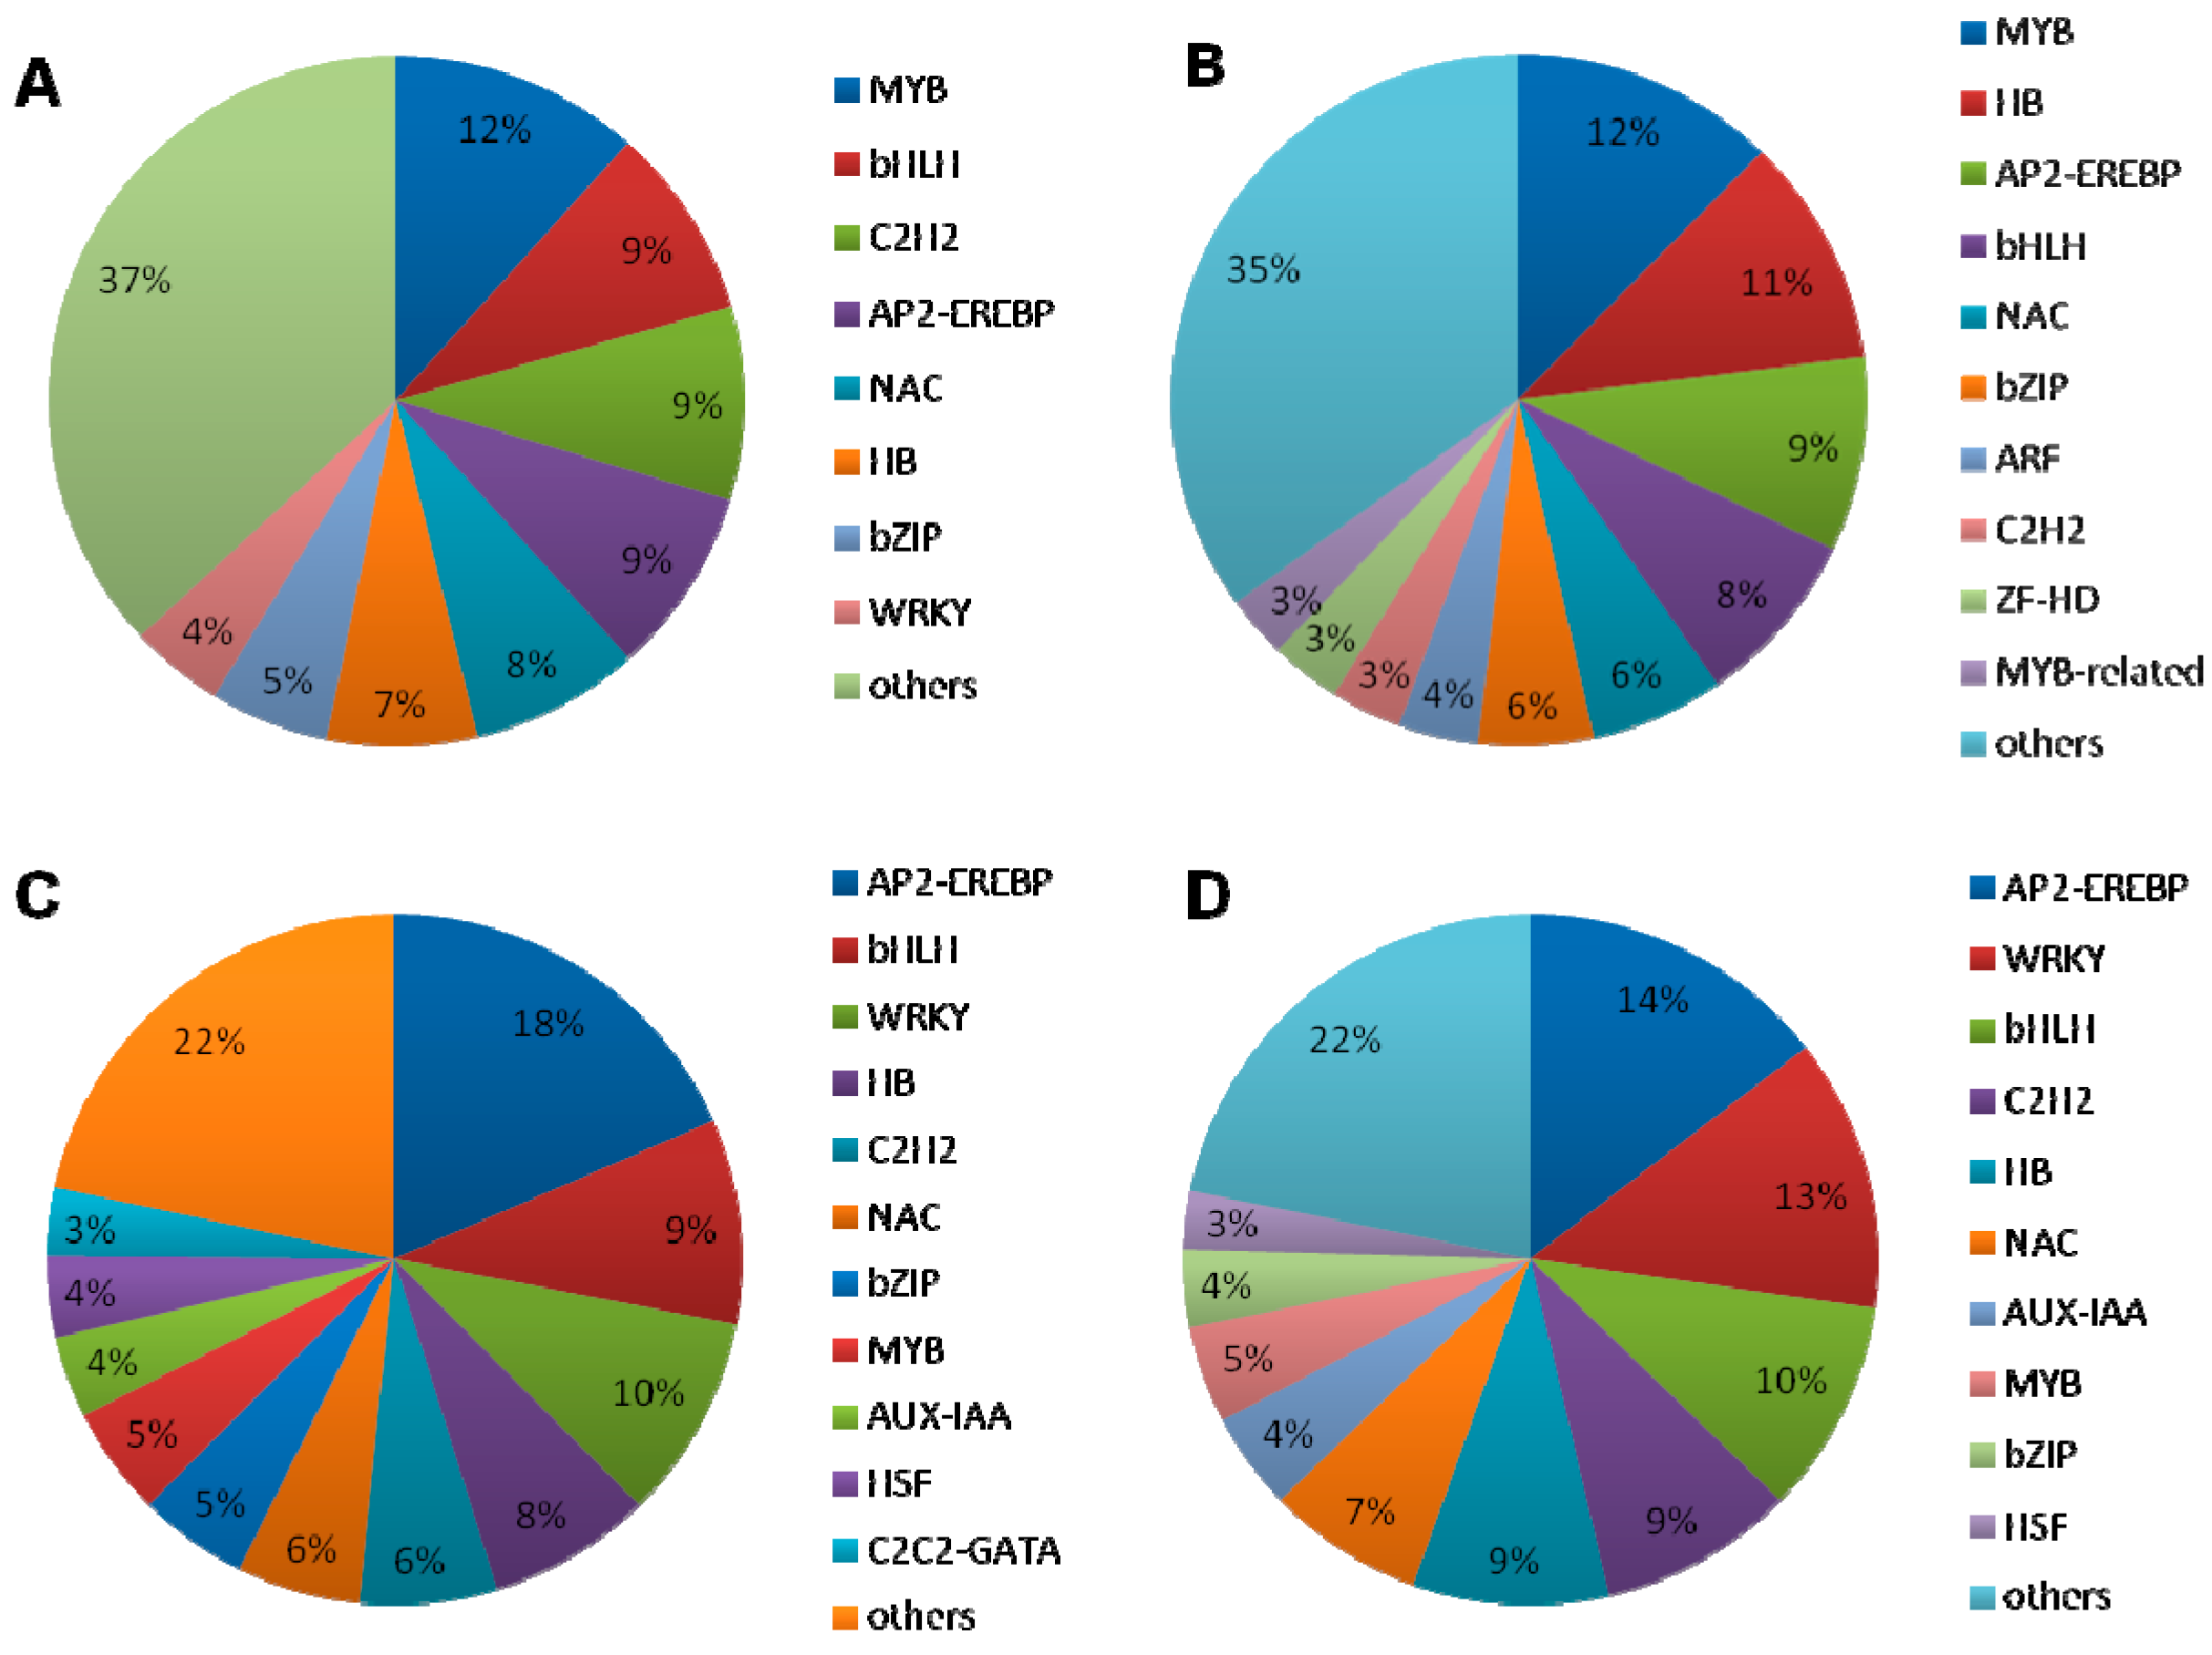
2.1.5. DEGs Encoding Transcription Factors

To assess the complex network of signaling pathways in drought stress, we further compared the expression profiles of the TFs in root and leaf. Genes (501 genes in root and 400 genes in leaf) encoding putative TFs that were responsive to drought stress in B. napus were identified based on a comparison with their expression of Arabidopsis, and 157 TFs were found to be co-expressed. In addition, 110 TFs (70% of the 157 co-expressed TFs) were conversely expressed in root and leaf. Of the root TFs, 344 TFs that were specifically expressed in root were divided into 16 groups based on a classification of their Arabidopsis homologs (Figure 6A). Also, five of the TF families which comprised 47% of these groups, including MYB (Bra027389, Bra039067, Bra020624, Bra018223), basic helix-loop-helix (bHLH) (Bra019773, Bra033690, Bra031721, Bra027501, Bra038792, Bra024115), C2H2 (Bra008445, Bra003582), AP2/EREBP (Bra037630, Bra006599, Bra009272, Bra026280), and NAC (Bra001596, Bra040152), played important roles in response to drought stress in root (Figure 6A). In addition, 243 TFs specifically expressed in leaf were also divided into 16 groups, in which four TF families, including MYB (Bra013000, Bra003443, Bra015911), HB (Bra024984, Bra028454), AP2/EREBP (Bra019777), and bHLH (Bra003073), accounting for 40% of the total TFs (Figure 6B). Four groups of TFs—AP2/EREBP (Bra024539, Bra010880, Bra022115, Bra024394), bHLH (Bra004489), WRKY (Bra008435, Bra035148, Bra003588, Bra005104), and HB (Bra027050, Bra007920)—were co-expressed in root and leaf (Figure 6C). Moreover, five groups—AP2/EREBP (Bra024539, Bra024394), WRKY (Bra008435, Bra035148, Bra003588, Bra005104), bHLH (Bra004489), C2H2 (Bra017432), and HB (Bra007920, Bra027050)—exhibited converse expressions between root and leaf (con-expression TFs) (Figure 6D). It has been demonstrated that MYB, NAC, C2H2, AP2/EREBP, bHLH, WRKY TFs participate in plant defense and play important roles in crosstalk among abiotic stress responses [19,57].
Figure 6. Distribution of transcription factor gene families in B. napus. (A) Distribution of transcription factors specially expressed in root; (B) Distribution of transcription factors specially expressed in leaf; (C) Distribution of transcription factors expressed both in root and leaf; (D) Distribution of transcription factors conversely expressed in root and leaf.
Ijms 16 18752 g006

2.1.6. Interaction between the Transcription Factors and Hormone-Related Genes

The interaction partners of these TFs activated as molecular responses are the key components of signal transduction pathways that take place during plant defense responses. These interactions determine the activation or repression of response pathways and are crucial in understanding the regulatory networks that modulate plant defense responses. The results showed that ERD1 (Bra029193), RAB18 (Bra031809, Bra037177), RD29B (Bra022585, Bra029121), and RD20A (Bra005501, Bra021847, Bra022936) were differentially expressed and had been proposed to function in the interaction with NAC and WRKY TFs and AREB/ABF, respectively [11]. In addition, MYC2 (Bra010178) was shown to be able to interact with all 12 of the JAZ proteins including JAZ1 (Bra025713, Bra016520, Bra031065), JAZ2 (Bra015880, Bra008172, Bra003778), JAZ3 (Bra022254, Bra021281), JAZ5 (Bra025977, Bra016604, Bra030986), JAZ6 (Bra016056, Bra008033), JAZ8 (Bra032362, Bra010794), JAZ9 (Bra016193, Bra007937, Bra003947), JAZ10 (Bra008846, Bra006190, Bra023399), JAZ12 (Bra002338, Bra020135), all of which were differentially expressed in our result and the mechanisms of interaction were similar to MYC4 (Bra013264) [19]. C2H2-type zinc-finger proteins ZAT10 (Bra032845, Bra010922) appeared to be partially dependent on ENA1/PMR2, a P-type ATPase required for Li+ and Na+ efflux in yeast [58].
Plants’ accumulations of phenylpropanoids and phenylpropanoid-based secondary products, like lignin, suberin, flavonoids, or condensed tannins, contribute substantially to all aspects of responses towards mechanical or environmental damage, such as drought, UV-light or wounding. In the present study, all encoding key enzyme transcripts in the phenylpropanoid biosynthetic pathway were found to be significantly up-regulated, including four phenylalanine ammonia-lyase (PAL) family genes: PAL1 (Bra017210, Bra005221), PAL2 (Bra039777, Bra006985, Bra003126), PAL3 (Bra028793), PAL4 (Bra029831); cinnamate 4-hydroxylase (C4H) (Bra022803, Bra022802, Bra021637, Bra021636, Bra018311); two isoforms of 4-coumarate: CoA ligase (4CL): 4CL1 (Bra030429) and 4CL5 (Bra031263, Bra001819); chalcone synthase (CHS) (Bra036307), dihydroflavonol reductase (DFR) (Bra027457), and flavonol synthase (FLS) (Bra018076), suggesting these pathway genes might play important roles in B. napus response to dehydration. New information has been obtained on the interactions of TFs and cis-acting elements of several phenylpropanoid biosynthetic genes. R2R3-MYB and a bHLH factor, respectively, known to be one of the largest groups of TFs in our data, were together able to activate the CHS, FLS promoter; bZIP, and a R2R3-MYB factor work in conferring stress responsiveness [59,60]. The accumulation of these osmolytes could be critical in improving drought stress tolerance of B. napus.
Comprehensive molecular analyses have shown that the major and the best-known player, ABA, acting in concert with JA, ET, AUX, cytokinins, BR and SA, regulates the expression of many genes under osmotic stress conditions [12,16,61]. In the plant hormone signal transduction pathways, 402 DEGs in root and 292 DEGs in leaf were detected and most genes involved in ABA, JA, ET, BR and AUX. PYR/PYL/RCAR (Bra025048, Bra000938), COI1 (Bra00500), MPK6 (Bra004727), BSK (Bra020340) and AUX1 (Bra031158, Bra000584) were differently expressed between the root and leaf. In addition, transcript levels of ion channels related genes Cl, NO3, malate2− and K+ (Bra040606, Bra001068, Bra017567, Bra011367) were strongly induced by hormone signal. We hypothesized that elevated hormone levels caused the differently activated DEGs and then regulated downstream TFs, such as MYB, WRKY, bHLH, AP2/EREBP, C2H2 and so on, which in turn, regulated ion transports to stimulate stomatal closure in leaf and improve water uptake in root [17].

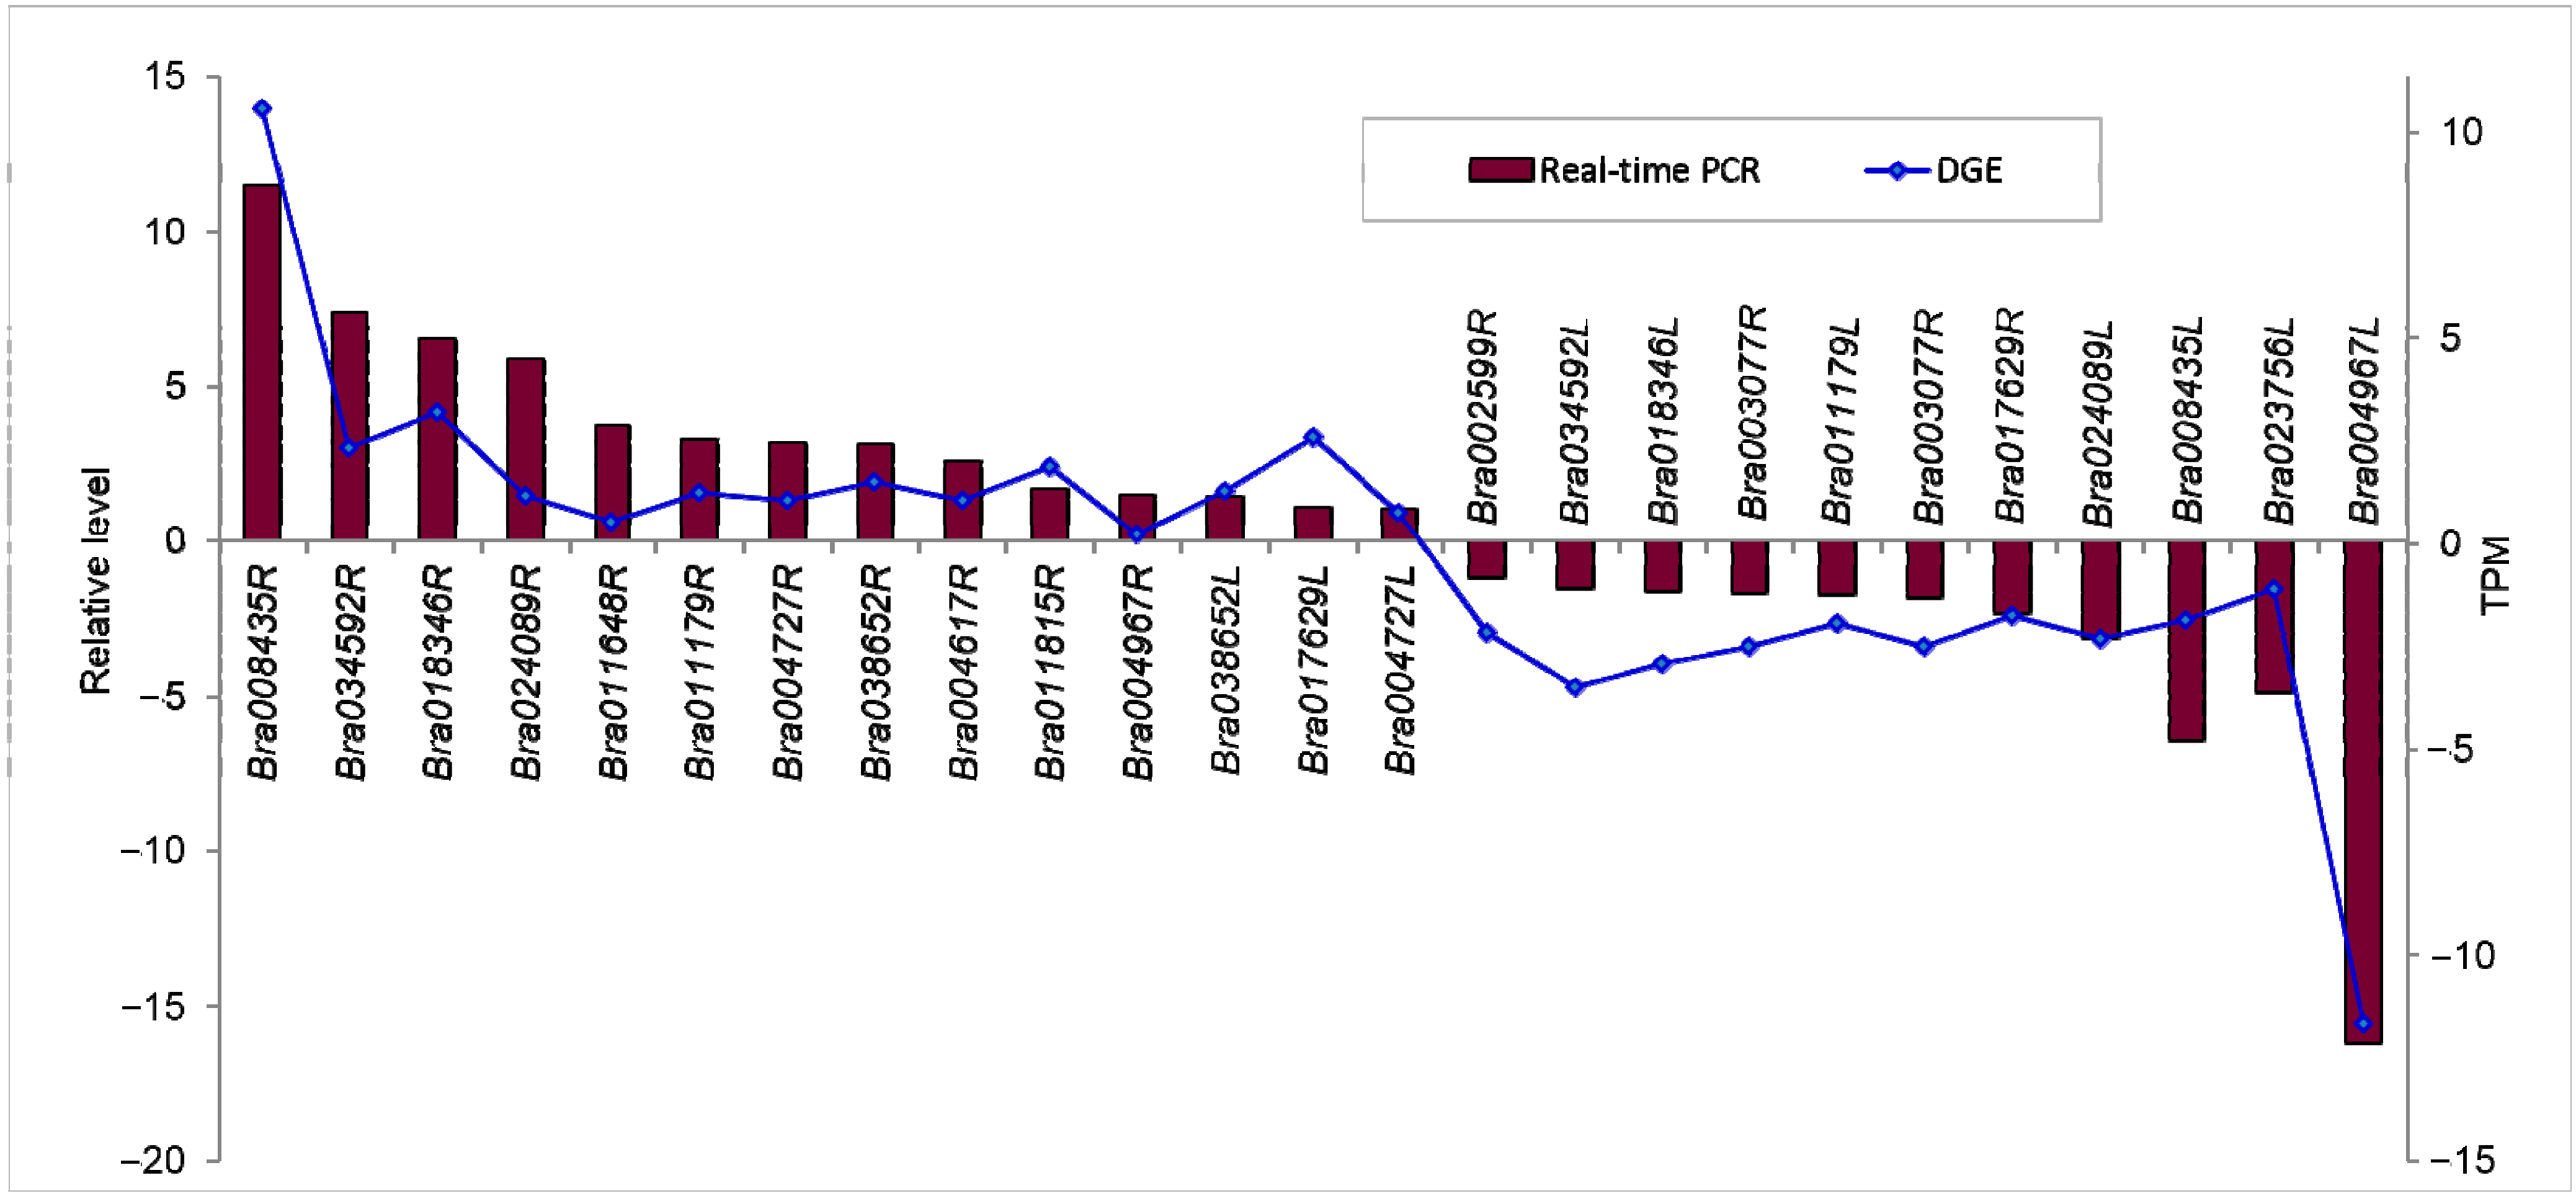
2.1.7. Confirmation of Tag-Mapped Genes by qRT-PCR (Quantitative Real-Time PCR)

To validate the Solexa/Illumina sequencing results, we performed quantitative RT-PCR on 25 selected DEGs after drought stress. Most of the real-time RT-PCR results were consistent with the DGE analyses (Figure 7), which demonstrated the reliability of the Illumina results. That DGE was more sensitive in the detection of low-abundant transcripts and small changes in gene expression than qPCR, might be the reason leading to a few inconsistent results between the transcriptome and qRT-PCR. Gene-specific primers of the selected genes were used for PCR analysis (Supplementary Table S4). In addition, five of the selected DEGs were also selected to perform quantitative RT-PCR in B. napus drought sensitive material 2021 root and leaf respectively [46] (Supplementary Figure S1). Some of the real-time RT-PCR results were consistent with the DGE analyses in drought tolerance material Q2, including Bra011179R, Bra008435R, Bra008435L, Bra024089L, Bra002599R. However, Bra024089R, Bra011179L, Bra004727R, Bra002599L were converse compared to the results in Q2. These data implied that most of the plants would defend the stress condition for survival in the same way, in which the differently expressed genes decided their different resistant cultivars.
Figure 7. Real-time PCR validations of tag-mapped genes in root (R) and leaf (L). Relative level, (2−ΔCt·ΔCt); TPM, log2 Ratio (DS/CK).
Ijms 16 18752 g007

2.2. Discussion

2.2.1. Different Regulation Patterns between Root and Leaf Based on Transcriptome Profiles

The primary goal of this work was to identify a broad spectrum of drought-responsive genes in B. napus in order to estimate a range of physiological, metabolic, and cellular processes influenced by drought stress. This knowledge would allow characterization of the most tolerant pathways/genes associated with resistance to drought in B. napus. The tolerant inbred line Q2 had higher relative water content (RWC) and drought resistance index (DRI), lower relative electrical leakage [45]. Among various putative drought resistance mechanisms, the ability of plants to maintain relatively high tissue water potential and keep enzymes and ion homeostasis in the cells are critical relevant traits that influence yield under drought stress [62].
During deficits in the water supply, to improve root water uptake is one of the earliest responses to water deficit [63]. While most water loss occurs through the leaf via transpiration; the opening and closing of stomata are also closely related to drought stress [64]. It has been proposed that DEGs specific to the root are associated with osmotic stress, root hair, and relative root length, whereas DEGs specific to leaf are involved in stomata, water use efficiency (WUE) and leaf epicuticular waxes [65,66,67]. The central goal of this research was to identify a broad spectrum of drought-responsive genes and the expression patterns between root and leaf in B. napus to elucidate the different responsive mechanisms affected by drought stress.
For root and leaf analysis, a sequencing depth of 12.0 million tags was reached (Table 1), and more than 72% unique tags were matched with the genome and transcriptome of B. rapa, suggesting that the selected database was relatively complete. More than 70% of the genes had a match in the B. rapa database (Table 1), and the remaining 30% likely represented previously unidentified genes, partial and UTR sequences, non-coding RNA or sequences that were not conserved sufficiently to be identifiable across these species (i.e., B. napus versus B. rapa) [68,69,70,71]. We analyzed the most differentially regulated tags, i.e., those with a log 2 ratio >1 or <−1, a greater statistically significant value (p < 0.001) and false discovery rates (FDR < 0.001). Based on this rigorous algorithm, 6018 genes with significant differential expression levels were found for root (Supplementary Data S1) and 5377 genes were found for leaf (Supplementary Data S2). The number of DEGs in root was higher than that in leaf. Moreover, 3570 (59.3%) down-regulated DEGs were detected in root compared with 1607 (29.9%) down-regulated DEGs in leaf. In contrast to leaf, more down-regulated than up-regulated DEGs were shown in root suggesting the presence of different expression patterns in root and leaf.
A large gap in understanding still exists between the transcriptional control and the cellular execution during drought stress. These results may increase our understanding of the gene expression changes during drought stress. For example, through GO functional analysis, 92 categories were categorized using Blast2GO. DEGs involved in the responses to “chemical stimulus”, “osmotic stress”, “abiotic stimulus” and other stress stimuli were mostly up-regulated in root but down-regulated in leaf. Conversely, DEGs involved in “cell structure” and “organelle organization” were mostly down-regulated in root but up-regulated in leaf. Based on the DEGs among the transcriptome, more genes were down-regulated in the root, while more up-regulated genes were in the leaf during drought stress. It may be theorized that root played critical roles in directly tolerating drought stress and stimulus, such as the ability to undergo stress, and leaf played major roles in cell and structure-related effects, such as the ability to repair stress damages in order to sustain plant growth. This was consistent with a complementary division of labor by root and leaf in response to drought-stress conditions. Accordingly, drought stress signaling can be divided into three functional categories: ionic and osmotic stress signaling for the reestablishment of cellular homeostasis under stress conditions, detoxification signaling to control and repair stress damages, and signaling to coordinate cell division and expansion to levels suitable for the particular stress conditions [6]. Different mechanisms also achieved tolerance in two pairs of drought-tolerant and susceptible rice near-isogenic lines under drought stress through GO terms enrichment analysis and transcription factor gene families [5]. DEGs, transcription factor and ion distribution were also found to be different in the two Alfalfa lines corresponding to genotype-specific responses to salt [62].
The perception of drought stress activates the signal transduction cascades that interact with the baseline pathways that are transduced by phytohormones [72]. Previous results show a good agreement in the DEGs involved drought stress response and cross-talk in signal transduction pathways, such as ABA and GA [73], and sugar signaling (ABI4) [74]. Since ABA is the best-known stress hormone for triggering short-term responses, such as stomatal closure, and controlling longer-term growth responses, such as the maintenance of root growth, which stimulates water uptake [75]. ABA receptors, phosphatases type-2C (PP2Cs), and SNF1-related protein kinases2 are shown to control the ABA signaling pathway [12]. Primary phytohormone ABA receptor-PYR/PYL/RCAR (Bra025048, Bra000938) acts in concert with AUX-AUX1 (Bra031158, Bra000584), ET-MPK6 (Bra004727), BR-BSK (Bra020340) and JA-COI1 (Bra00500) to regulate stomatal closure through a complex network of signaling pathways [16,76,77,78]. The interaction between TFs and cis-elements plays important roles in crosstalk among abiotic stress responses [57].

2.2.2. TFs Functional Protein-Protein Interactions in Hormone Transduction Pathway

A set of genes that are considered to be important regulators of drought-suffered plant, encoding components of signaling pathways or TFs, has been implicated in this process [6,11]. In the present study, MYB, bHLH, WRKY, AP2/EREBP, HB, and C2H2 were highly enriched during the drought-stress period, such as MYB30 (Bra033067), MYB60 (Bra018598), MYB28 (Bra027389), MYB108 (Bra040274, Bra001202), bHLH92 (Bra033690, Bra027501), ABA-INDUCIBLE BHLH-TYPE TRANSCRIPTION FACTOR (AIB) (Bra039279, Bra004532), ERF2 (Bra022115, Bra024954, Bra017495), ERF4 (Bra027270, Bra021594, Bra001588), WRKY40 (Bra035148, Bra008435, Bra003588), WRKY18 (Bra011299, Bra023983, Bra010220), WRKY33 (Bra005104, Bra017117, Bra000064), WRKY57 (Bra038313), HB40 (Bra017780), HB7 (Bra039265), C2H2-type zinc-finger proteins ZAT10 (Bra032845, Bra010922) and so on. All of them have been proposed to function in plant defense [79,80,81,82,83]. Among the DEGs for the highly expressed TFs, the MYB family contained the most abundant DEGs (12% in root and leaf), while AP2/EREBP was the highest co-expressed and con-expressed TFs, which were 18% and 14%, respectively. This finding suggested that different MYB family members were triggered for root and leaf in response to drought stress, whereas the same AP2/EREBP family members played crucial roles in regulating drought stress tolerance in both root and leaf. The MYB TFs are functionally diverse and present in all eukaryotes, in which R2R3-MYB class are plant-specific and involved in response to abiotic and biotic stress such as AtMYB30 (Bra033067), AtMYB60 (Bra018598) and AtMYB96 [19,84,85,86]. MYB2 (Bra004473) was up-regulated in root, interacting with MYBR cis-elements in the promoter of ABA-inducible gene RD22 in Arabidopsis to control the ABA-inducible salt and dehydration responsive genes [87]. However, RD22 was not detected in our data, we supposed the expression of RD22 was not simultaneous and might be later than MYB and MYC in response to drought stress. TFs expressions are early and emergency responses of stress and the interaction downstream genes are late and adaptive response [88]. MYB108 (Bra040274, Bra001202) were activated in the root, and they interacted with genes in jasmonate signaling pathway, mediated by reactive oxygen intermediates from both biotic and abiotic stress agents [89]. AP2/EREBP TFs, ERF2 (Bra022115, Bra024954, Bra017495) functioned as activators and ERF4 (Bra027270, Bra021594, Bra001588) acted as repressors that down-regulated basal transcription levels, which were shown to activate the defense pathway by interacting with the G-box in the promoter of RD29A and PR (pathogen-related) genes [90]. In addition, a high percentage of WRKY TFs were included in the con-expression TFs, suggesting that WRKY family members might also play an important role in the converse expression patterns. WRKY genes have been found to be up-regulated in response to pathogens, wounding, and senescence [79]. In our result, all of the WRKY40 (Bra035148, Bra008435, Bra003588), WRKY18 (Bra011299, Bra023983, Bra010220), WRKY33 (Bra005104, Bra017117, Bra000064), WRKY57 (Bra038313) were up-regulated in root but down-regulated in leaf, which were consistent with the result of the con-expression patterns between root and leaf (Figure 6D). Through the yeast one-hybrid assay, WRKY18, WRKY60, and WRKY40 were shown to interact with the W-box in the promoters of ABI4 and ABI5 genes and repressed ABI4 and ABI5 expression as negative ABA signaling regulators [91]. Activated expression of WRKY57 conferred drought tolerance by elevation of ABA levels in Arabidopsis. ChIP assays demonstrated that WRKY57 could directly bind the W-box of RD29A and NCED3 promoter sequences [92]. In the present study, the NCED3 genes (Bra027336, Bra021558) were activated in both root and leaf and they were also the key genes in ABA biosynthesis [93]. NAC TFs are one of the largest plant-specific TFs and have been shown to function in relation to variety of abiotic and biotic stress responses [94]. Using the yeast one-hybrid system, three NAC members, ANAC019, ANAC055, and ANAC072 bound to the promoter of the ERD1 and enhanced tolerance by inducing stress-related genes expression [95]. In our data, ANAC019 (Bra018998), ANAC055 (Bra001586), ANAC072 (Bra026353, Bra019052), and ERD1 (Bra029193) were up-regulated in root, consistent with a previous result. In addition, NAC103 could induce reactive oxygen species (ROS) accumulation and cell death in B. napus [96] and overexpression of BnNAC2 and BnNAC5 genes in yeast remarkably enhanced the cells sensitive to high-salinity and osmotic stresses through inducing COR15A and RD29A expression [97]. The well-established phenylpropanoid biosynthetic pathway served as a useful model for studying metabolic regulation. The best characterized elements, G-box and H-box, were conserved and recognized by MYB, bHLH, or bZIP proteins. Cotransfection analysis demonstrated MYB12 strongly activated the promoters of CHS, F3H, FLS, and, to some lesser extent, the CHI promoter, the gene products of which were indispensable for the biosynthesis of phenylpropanoid [59]. MYB305 bound to the H-box in the promoter of PAL2 and activated PAL2 expression in tobacco protoplasts [60]. There was a hypothesis that the bZIP factors acted specifically in stimulus-dependent gene activation, while bHLH factors served to activate genes in a cell-identity dependent manner. Both factors would interact with MYB-like factors. Collectively, our data enables us to investigate the mechanism underlying gene expression in response to drought stress and the complex complementary division of labor by root and leaf in response to drought-stress conditions and strength, a hypothesis drought-related model previously proposed [89].

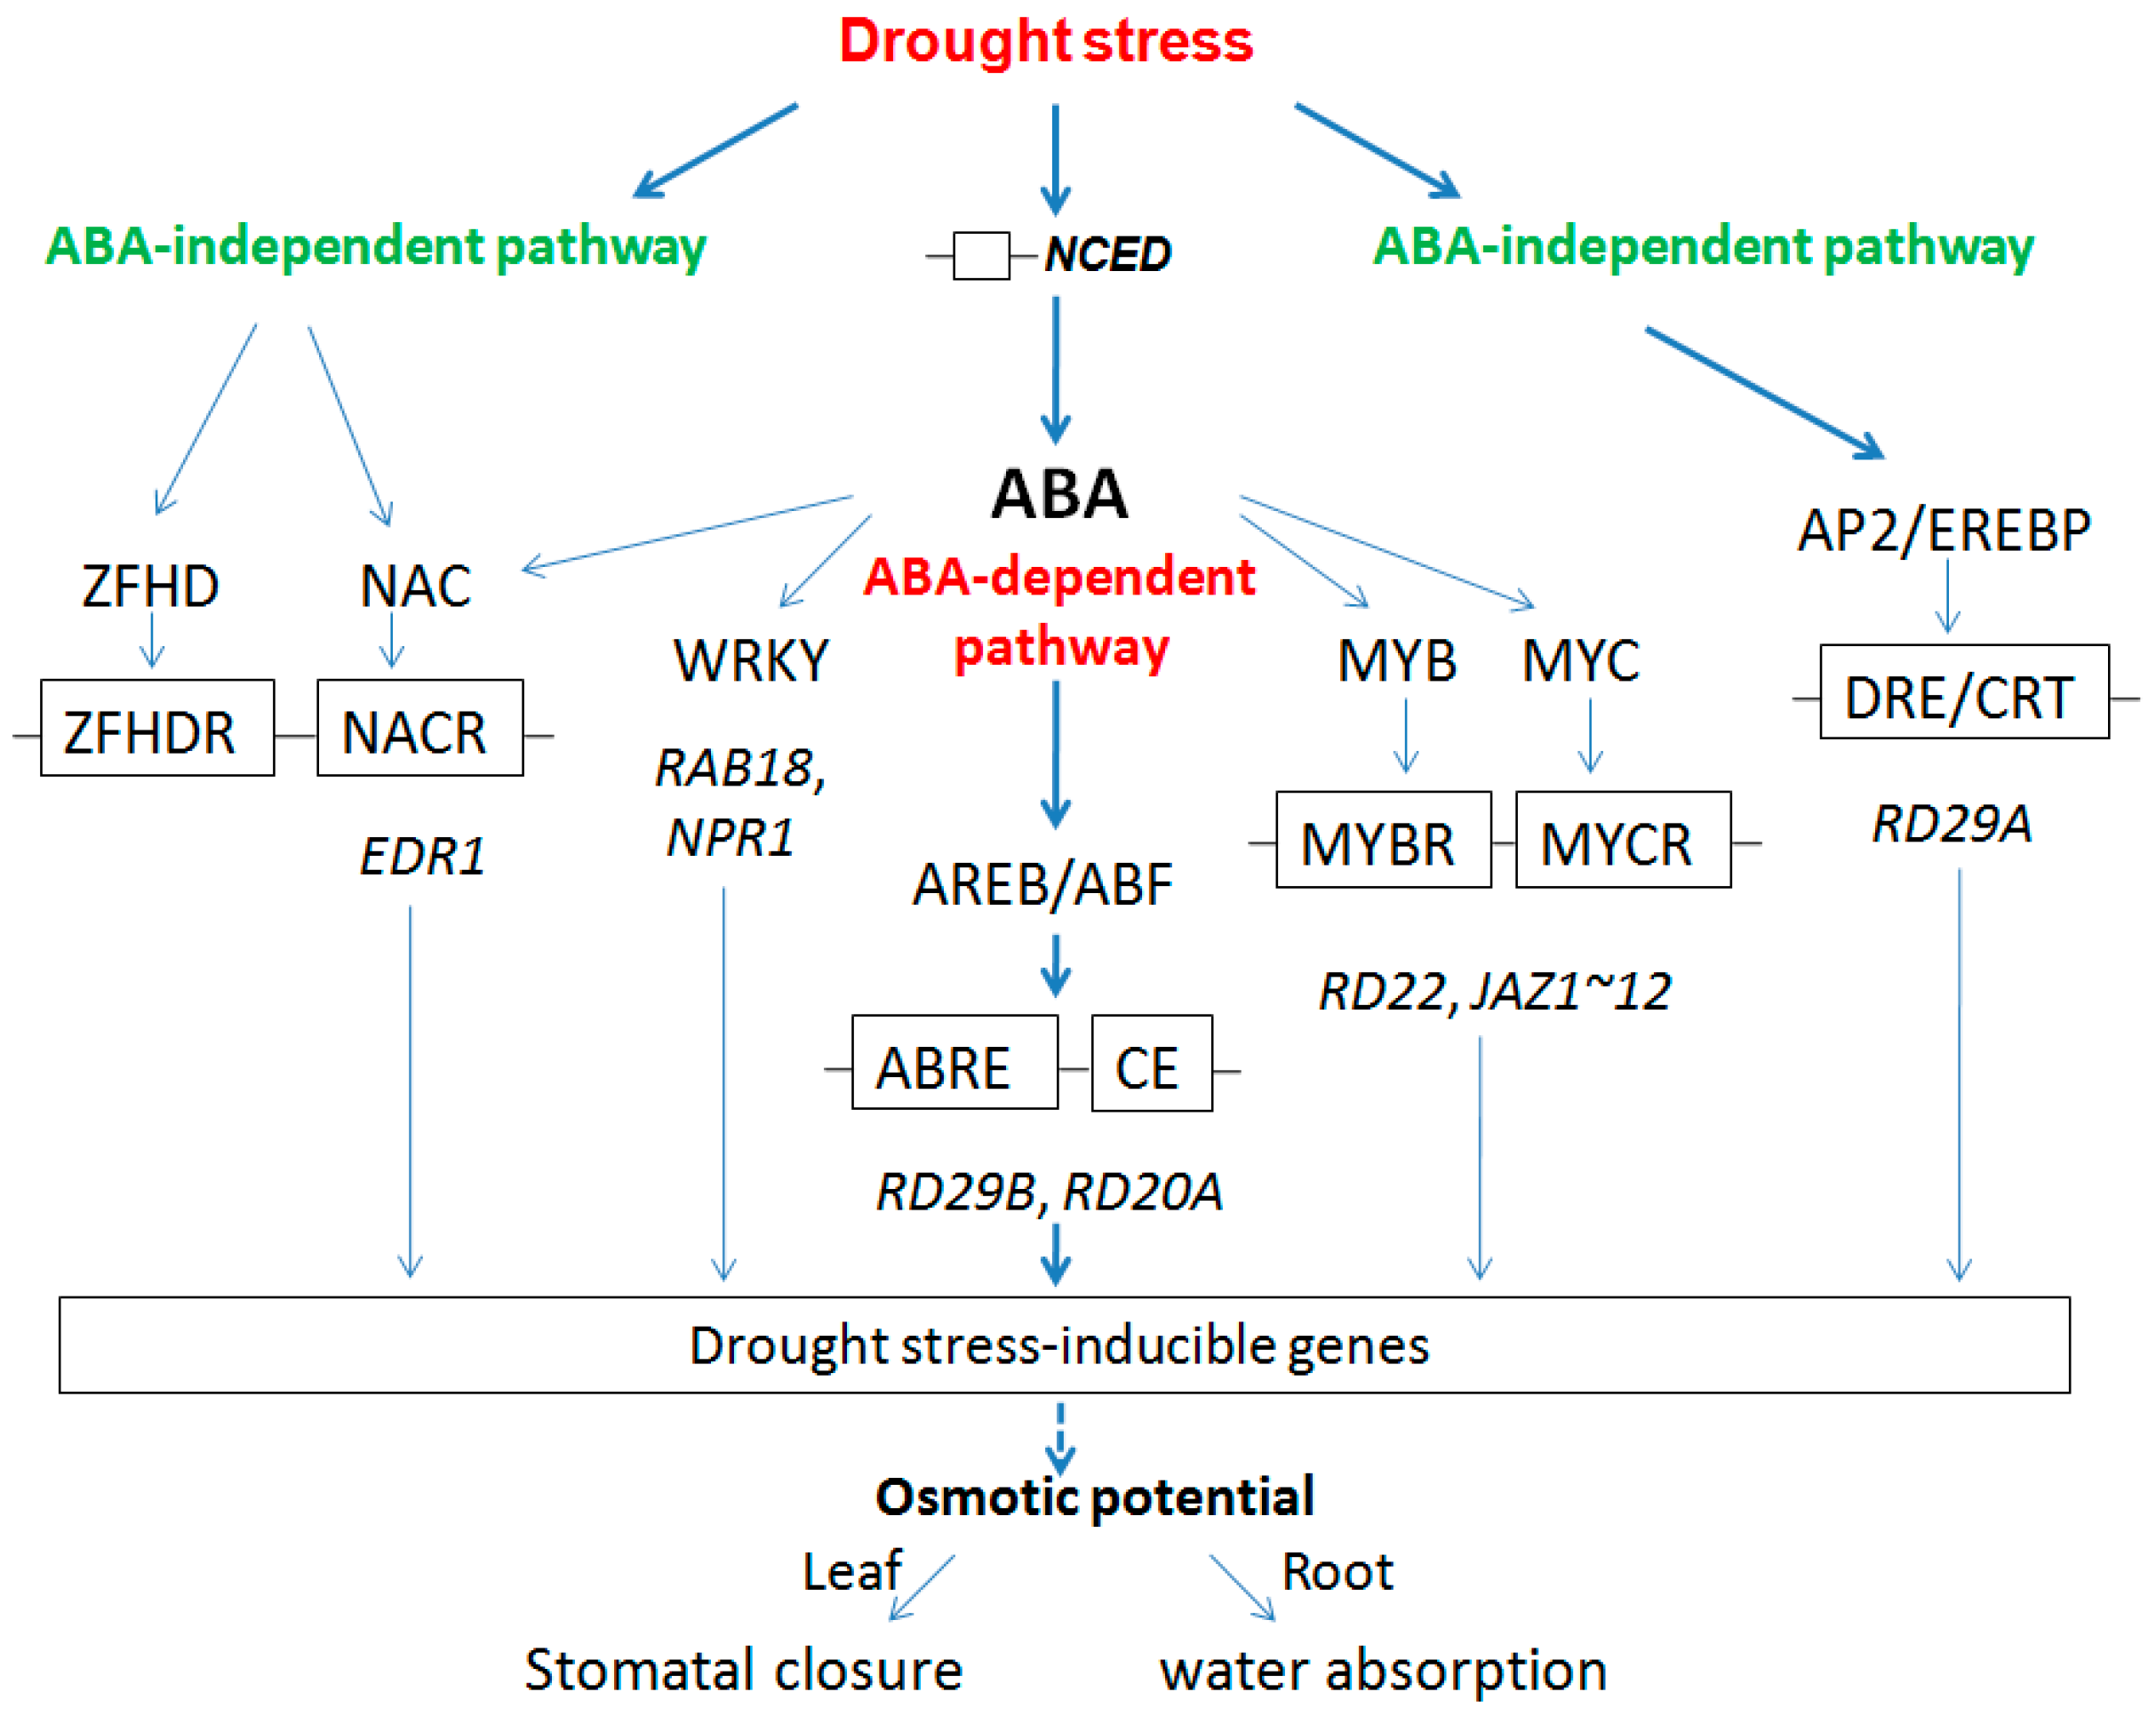
2.2.3. Regulation Model for Root and Leaf under Drought Stress

The products of drought-induced genes can be classified into two groups. The first group includes proteins function to protect cells from stress through the production of important enzymes and metabolic proteins (functional proteins). The second group regulates signal transduction and gene expression in stress response (regulatory proteins) [98]. Functional proteins contained hydrophilic proteins including dehydrins-RAB18 (Bra031809, Bra037177), LTI29/ERD10 (Bra025819, Bra012230), ERD14 (Bra008242, Bra003732); osmotin-ATOSM34 (Bra033138), proline synthesis enzyme-P5CS1 (Bra017051), heat shock protein (HSP)-HSP70 (Bra038734, Bra001457), HSP70T-2 (Bra005610), all of which were up-regulated except osmotin-ATOSM34 (Bra033138), suggesting their functions in drought stress. Regulatory systems that are activated in response to drought stress have demonstrated the presence of both ABA-independent and ABA-dependent pathways. ABA-dependent signaling pathways that mediate stress adaptation are induced by at least two separate regulators and their interaction of cis-elements: AREB/ABF TFs and ABRE, MYB/MYC TFs and MYBR/MYCR, WRKY TFs and WRKYR (W-box). While ABA-independent pathways are: AP2/EREBP TFs and DRE/CRT, NAC/ZFHD TFs and NACR/ZFHDR. Subsequently, the down-stream drought-induced genes were activated, including RD29B, RD20A, RD22, JA-inducible genes (JAZ1-12), RAB18, NPR1, RD29A, ERD1. We hypothesized that these drought stress-inducible genes led to ion exchange, such as Cl, NO3, malate2−, and K+ in leaf and root that influenced the level of osmotic potential and then led to stomatal closure in leaf and improved water uptake in root. In addition, the elevation of the Ca2+ concentration as a result of the regulator of drought stress was another event that accompanied transcription factor which led to the changes of transports for ions such as K+, Cl, and NO3 and the subsequent change in turgor [16]. According to the above results, we now provide an overview about drought stress in a root and leaf regulated model in B. napus plants in Figure 8.
Figure 8. Proposed model for drought stress mechanism of root and leaf in B. napus.
Ijms 16 18752 g008

3. Experimental Section

3.1. Plant Materials and Stress Conditions

Seeds of Brassica napus Q2 were grown in the field in October 2010 for one month and then transferred into greenhouse conditions with a thermoperiod of 20 °C (day) and 18 °C (night) and a photoperiod of 16 h for two months . Prior to the treatment, roots were washed, carefully prevented from mechanical damage, and then placed in distilled water for 12–24 h. Both dehydration and control plants were placed under same growing conditions with 22 °C temperature, 65% relative humidity, and continuous light. For sampling of RNA-seq, six plants were exposed to air-drying on a filter paper for 24 h, and the control plants were kept further in distilled water. This treatment resulted in loss of 75% of fresh weight [46,47]. Leaves and roots samples were then collected from the control and dehydration-treated plants and immediately frozen in liquid nitrogen and stored at −80 °C until use.

3.2. RNA Isolation and Illumina Sequencing Results

Total RNA was isolated using the Total RNA Extraction kit (Bioteke, Bejing, China) according to the manufacturer’s instructions, and the RNA quantity and quality were monitored using RNA gel electrophoresis and a BioAnalyzer G2938A (Agilent Technologies, Waldbronn, Germany). A total of 10 μg RNA (≥400 ng/μL) was sent to Beijing Genomics Institute (Shenzhen, China) for Illumina sequencing, in which Illumina Gene Expression Sample Prep Kit, Illumina Sequencing Chip (flow cell) and the Illumina HiSeq™ 2000 System (Illumina, Inc., San Diego, CA, USA) were uses as the main reagents, supplies and instruments respectively. Libraries were prepared from a 17 bp (base pair) size-selected fraction following adapter ligation and agarose gel separation [99]. The original sequencing is deposited in SRA (Short Read Archive) with the accession number SRP045411.

3.3. Gene Expression Profiling RNA-Seq Analysis

After Illumina HiSeq™ 2000 sequencing, the raw reads were obtained and transformed into clean tags using certain data-processing steps. Then clean sequencing tags were aligned to the reference sequences, which covered all possible CATG+17-nt tag sequences of the genome and transcriptome of B. rapa using blastn, allowing only a 1-bp mismatch. Clean tags that mapped to reference sequences of multiple genes were filtered beside unambiguous clean tags. The number of unambiguous clean tags for each gene was calculated and then normalized to the TPM (number of transcripts per million clean tags) [99,100,101]. A rigorous algorithm was used to identify the differentially expressed genes (DEGs) between the four samples. The absolute values of |log 2 Ratio| ≥1 and FDR (False Discovery Rate) ≤0.001 were used as thresholds to judge the significance of differences in transcript abundance [48]. Then the DEGs were obtained and GO function and KEGG pathway analyses were carried out [51]. GO enrichment analysis provides all GO terms that significantly enriched in DEGs compared to the genome background, and filters the DEGs that correspond to biological functions. The calculating formula (1) is:
P = 1 i = 0 m 1 ( m i ) ( N M n i ) ( N n )
where N is the number of all genes with GO annotation; n is the number of DEGs in N; M is the number of all genes that are annotated to the certain GO terms; m is the number of DEGs in M. The calculated p-value goes through Bonferroni Correction, taking corrected p-value ≤0.05 as a threshold. GO terms fulfilling this condition are defined as significantly enriched GO terms in DEGs. This analysis is able to recognize the main biological functions that DEGs exercise.

3.4. qRT-PCR Analysis

To validate the results from the transcriptomic profile experiment, 25 selected DEGs from different functional categories were analyzed using qRT-PCR. Total RNA (160 ng) was reverse-transcribed using the RevertAid First Strand cDNA Synthesis Kit (Thermo, Hudson, NH, USA). The qRT-PCR reaction mixture was composed of the THUNDERBIRD SYBR qPCR Mix (TOYOBO, Osaka, Japan) and 2 μL of 50 × -diluted cDNA reaction mixture in a final volume of 20 μL with 200 nM of the gene-specific primers which were designed according to the reference unigene sequences using the Oligo 6 (Supplementary Table S4). The PCR reaction was performed using an iCycler iQ (BIO-RAD, Hercules, CA, USA) with the following cycle: denaturation at 95 °C for 1 min and annealing and polymerization at 60 °C for 20 s. Three biological repeats were performed, and actin was used as a reference gene.

4. Conclusions

The application of high-throughput sequencing technology has enabled us to detect DEGs in root and leaf under drought stress treatments at the rosette stage. In total, 6018 and 5377 DEGs were detected in root and leaf respectively. The number of down-regulated DEGs was higher in root than in leaf. The molecular functions of these genes were determined using GO, pathway-based and transcription factors and their interaction proteins analyses. These analyses showed that more stress-related biological process and relatively fewer cell component genes were triggered in root compared with leaf, indicating their complementary division of labor by root and leaf in response to drought stress conditions. The results provide a strong basis for future research on regulation patterns in root and leaf and their regulation mechanisms for drought stress, which could lead to improvements in drought-tolerant agronomic traits in B. napus. Future work should focus on characterizing these candidate target genes.

Supplementary Materials

Supplementary materials can be found at https://www.mdpi.com/1422-0067/16/08/18752/s1.

Acknowledgments

This research was financed by the National High Technology Research and Development Program of China (2012AA101107), Natural Science Foundation of Hubei province Key program (2014CFA008), 948 project (number 2011-G23), National Science Foundation of China (31171589 and 31201244), the National Basic Research Program (2011CB109302) and international scientific and technological cooperation projects (2012DFG90290).

Author Contributions

Bin Yi, Xuekun Zhang and Jinxing Tu conceived of the study. Chunqing Liu carried out the data analysis, molecular woks and prepared the RNA. Chunqing Liu and Bin Yi drafted the manuscript. Ka Zhang, Hong An, Kaining Hu, Jinxiong Shen, Chaozhi Ma, Jing Wen, Jinxing Tu and Tingdong Fu provided suggestions, funds and experimental conditions. All authors read and approved the final manuscript.

Conflicts of Interest

The authors declare no conflict of interest.

References

  1. Lobell, D.B.; Schlenker, W.; Costa-Roberts, J. Climate trends and global crop production since 1980. Science 2011, 333, 616–620. [Google Scholar] [CrossRef] [PubMed]
  2. Khalili, M.; Aboughadareh, A.P.; Naghavi, M.R.; Talebzadeh, S.J. Response of spring Canola (Brassica napus L.) genotypes to water deficit stress. Int. J. Agric. Crop Sci. 2012, 4, 1579–1586. [Google Scholar]
  3. Müller, T.; Lentzsch, P.; Müller, M.E.H. Carbohydrate dynamics in leaves of rapeseed (Brassica napus) under drought. J. Agron. Crop Sci. 2012, 198, 207–217. [Google Scholar] [CrossRef]
  4. Ahuja, I.; de Vos, R.C.H.; Bones, A.M.; Hall, R.D. Plant molecular stress responses face climate change. Trends Plant Sci. 2010, 15, 664–674. [Google Scholar] [CrossRef] [PubMed]
  5. Moumeni, A.; Satoh, K.; Kondoh, H.; Asano, T.; Hosaka, A.; Venuprasad, R.; Serraj, R.; Kumar, A.; Leung, H.; Kikuchi, S. Comparative analysis of root transcriptome profiles of two pairs of drought-tolerant and susceptible rice near-isogenic lines under different drought stress. BMC Plant Biol. 2011, 11, 174. [Google Scholar] [CrossRef] [PubMed]
  6. Zhu, J.K. Salt and drought stress signal transduction in plants. Annu. Rev. Plant Biol. 2002, 53, 247–273. [Google Scholar] [CrossRef] [PubMed]
  7. Chen, H.; Li, Z.F.; Xiong, L.M. A plant microRNA regulates the adaptation of roots to drought stress. FEBS Lett. 2012, 586, 1742–1747. [Google Scholar] [CrossRef] [PubMed]
  8. Bartels, D.; Sunkar, R. Drought and Salt Tolerance in Plants. Crit. Rev. Plant Sci. 2005, 24, 23–58. [Google Scholar] [CrossRef]
  9. Mahajan, S.; Tuteja, N. Cold, salinity and drought stresses: An overview. Arch. Biochem. Biophys. 2005, 444, 139–158. [Google Scholar] [CrossRef] [PubMed]
  10. Fujita, Y.; Fujita, M.; Shinozaki, K.; Yamaguchi-Shinozaki, K. ABA-mediated transcriptional regulation in response to osmotic stress in plants. J. Plant Res. 2011, 124, 509–525. [Google Scholar] [CrossRef] [PubMed]
  11. Shinozaki, K.; Yamaguchi-Shinozaki, K. Gene networks involved in drought stress response and tolerance. J. Exp. Bot. 2007, 58, 221–227. [Google Scholar] [CrossRef] [PubMed]
  12. Cutler, S.R.; Rodriguez, P.L.; Finkelstein, R.R.; Abrams, S.R. Abscisic acid: Emergence of a core signaling network. Annu. Rev. Plant Biol. 2010, 61, 651–679. [Google Scholar] [CrossRef] [PubMed]
  13. Ma, Y.; Szostkiewicz, I.; Korte, A.; Moes, D.; Yang, Y.; Christmann, A.; Grill, E. Regulators of PP2C phosphatase activity function as abscisic acid sensors. Science 2009, 324, 1064–1068. [Google Scholar] [CrossRef] [PubMed]
  14. Park, S.Y.; Fung, P.; Nishimura, N.; Jensen, D.R.; Fujii, H.; Zhao, Y.; Lumba, S.; Santiago, J.; Rodrigues, A.; Chow, T.F.; et al. Abscisic acid inhibits type 2C protein phosphatases via the PYR/PYL family of START proteins. Science 2009, 324, 1068–1071. [Google Scholar] [CrossRef] [PubMed]
  15. Fujii, H.; Zhu, J.K. Arabidopsis mutant deficient in 3 abscisic acid-activated protein kinases reveals critical roles in growth, reproduction, and stress. Proc. Natl. Acad. Sci. USA 2009, 106, 8380–8385. [Google Scholar] [CrossRef] [PubMed]
  16. Daszkowska-Golec, A.; Szarejko, I. Open or close the gate-stomata action under the control of phytohormones in drought stress conditions. Front. Plant Sci. 2013, 4, 138. [Google Scholar] [CrossRef] [PubMed]
  17. Udvardi, M.K.; Kakar, K.; Wandrey, M.; Montanari, O.; Murray, J.; Andriankaja, A.; Zhang, J.Y.; Benedito, V.; Hofer, J.M.; Chueng, F.; et al. Legume transcription factors: Global regulators of plant development and response to the environment. Plant Physiol. 2007, 144, 538–549. [Google Scholar] [CrossRef] [PubMed]
  18. Riaño-Pachón, D.M.; Ruzicic, S.; Dreyer, I.; Mueller-Roeber, B. PlnTFDB: An integrative plant transcription factor database. BMC Bioinform. 2007, 8, 42. [Google Scholar] [CrossRef] [PubMed]
  19. Alves, M.S.; Dadalto, S.P.; Gonçalves, A.B.; de Souza, G.B.; Barros, V.A.; Fietto, L.G. Transcription factor functional protein-protein interactions in plant defense responses. Proteomes 2014, 2, 85–106. [Google Scholar] [CrossRef]
  20. Zhu, Q.; Zhang, J.T.; Gao, X.S.; Tong, J.H.; Xiao, L.T.; Li, W.B.; Zhang, H.X. The Arabidopsis AP2/ERF transcription factor RAP2.6 participates in ABA, salt and osmotic stress responses. Gene 2010, 457, 1–12. [Google Scholar] [CrossRef] [PubMed]
  21. Rushton, D.L.; Tripathi, P.; Rabara, R.C.; Lin, J.; Ringler, P.; Boken, A.K.; Langum, T.J.; Smidt, L.; Boomsma, D.D.; Emme, N.J.; et al. WRKY transcription factors: Key components in abscisic acid signalling. Plant Biotechnol. J. 2012, 10, 2–11. [Google Scholar] [CrossRef] [PubMed]
  22. Sakamoto, H.; Maruyama, K.; Sakuma, Y.; Meshi, T.; Iwabuchi, M.; Shinozaki, K.; Yamaguchi-Shinozaki, K. Arabidopsis Cys2/His2-type zinc-finger proteins function as transcription repressors under drought, cold, and high-salinity stress conditions. Plant Physiol. 2004, 136, 2734–2746. [Google Scholar] [CrossRef] [PubMed]
  23. Dodig, D.; Zorić, M.; Kandić, V.; Perović, D.; Šurlan-Momirović, G. Comparison of responses to drought stress of 100 wheat accessions and landraces to identify opportunities for improving wheat drought resistance. Plant Breed. 2012, 131, 369–379. [Google Scholar] [CrossRef]
  24. Xiong, L.; Wang, R.G.; Mao, G.; Koczan, J.M. Identification of drought tolerance determinants by genetic analysis of root response to drought stress and abscisic Acid. Plant Physiol. 2006, 142, 1065–1074. [Google Scholar] [CrossRef] [PubMed]
  25. Hou, X.; Xie, K.B.; Yao, J.L.; Qi, Z.Y.; Xiong, L.Z. A homolog of human ski-interacting protein in rice positively regulates cell viability and stress tolerance. Proc. Natl. Acad. Sci. USA 2009, 106, 6410–6415. [Google Scholar] [CrossRef] [PubMed]
  26. Hu, H.H.; Dai, M.Q.; Yao, J.L.; Xiao, B.Z.; Li, X.H.; Zhang, Q.F.; Xiong, L.Z. Overexpressing a NAM, ATAF, and CUC (NAC) transcription factor enhances drought resistance and salt tolerance in rice. Proc. Natl. Acad. Sci. USA 2006, 103, 12987–12992. [Google Scholar] [CrossRef] [PubMed]
  27. Schnurbusch, T.; Collins, N.C.; Eastwood, R.F.; Sutton, T.; Jefferies, S.P.; Langridge, P. Fine mapping and targeted SNP survey using rice wheat gene colinearity in the region of the Bo1 boron toxicity tolerance locus of bread wheat. Theor. Appl. Genet. 2007, 115, 451–461. [Google Scholar] [CrossRef] [PubMed]
  28. Ismail, A.M.; Thomson, M.J.; Ching, J.-H.; Septiningsih, E.; Wissuwa, M.; Heuer, S.; Singh, R.K.; Gregorio, G.B.; Mackill, D.J. Introgression of QTLs associated with tolerance to abiotic stresses in rice using marker-assisted breeding. In Proceedings of Plant and Animal Genome XVI, San Diego, CA, USA, 12–16 January,2008; Scherago International: Jersey City, NJ, USA, 2008. W233. p. 55. [Google Scholar]
  29. Ducrocq, S.; Madur, D.; Veyrieras, J.B.; Camus-Kulandaivelu, L.; Kloiber-Maitz, M.; Presterl, T.; Ouzunova, M.; Manicacci, D.; Charcosset, A. Key impact of Vgt1 on flowering time adaptation in maize: Evidence from association mapping and ecogeographical information. Genetics 2008, 178, 2433–2437. [Google Scholar] [CrossRef] [PubMed]
  30. Harris, K.; Subudhi, P.K.; Borrell, A.; Jordan, D.; Rosenow, D.; Nguyen, H.; Klein, P.; Klein, R.; Mullet, J. Sorghum stay-green QTL individually reduce post-flowering drought-induced leaf senescence. J. Exp. Bot. 2007, 58, 327–338. [Google Scholar] [CrossRef] [PubMed]
  31. Yang, Y.H. Identification and QTL Analysis of Drought Tolerant Traits in Brassica Napus L. Master’s Thesis, Southwestern University, Chongqing, China, 2011. [Google Scholar]
  32. Hall, N.M.; Griffiths, H.; Corlett, J.A.; Jones, H.G.; Lynn, J.; King, G.J. Relationships between water-use traits and photosynthesis in Brassica oleracea resolved by quantitative genetic analysis. Plant Breed. 2005, 124, 557–564. [Google Scholar] [CrossRef]
  33. Park, S.H.; Chung, P.J.; Juntawong, P.; Bailey-Serres, J.; Kim, Y.S.; Jung, H.; Bang, S.W.; Kim, Y.K.; Do, Choi. Y.; Kim, J.K. Posttranscriptional control of photosynthetic mRNA decay under stress conditions requires 3ʹ and 5ʹ untranslated regions and correlates with differential polysome association in rice. Plant Physiol. 2012, 159, 1111–1124. [Google Scholar] [CrossRef] [PubMed]
  34. Wei, W.; Qi, X.; Wang, L.; Zhang, Y.; Hua, W.; Li, D.; Lv, H.; Zhang, X. Characterization of the sesame (Sesamum indicum L.) global transcriptome using Illumina paired-end sequencing and development of EST-SSR markers. BMC Genom. 2011, 12, 451. [Google Scholar] [CrossRef] [PubMed]
  35. Chen, W.; Provart, N.J.; Glazebrook, J.; Katagiri, F.; Chang, H.S.; Eulgem, T.; Mauch, F.; Luan, S.; Zou, G.; Whitham, S.A.; et al. Expression profile matrix of Arabidopsis transcription factor genes suggests their putative functions in response to environmental stresses. Plant Cell 2002, 14, 559–574. [Google Scholar] [CrossRef] [PubMed]
  36. Rasmussen, S.; Barah, P.; Suarez-Rodriguez, M.C.; Bressendorff, S.; Friis, P.; Costantino, P.; Bones, A.M.; Nielsen, H.B.; Mundy, J. Transcriptome responses to combinations of stresses in Arabidopsis. Plant Physiol. 2013, 161, 1783–1794. [Google Scholar] [CrossRef] [PubMed] [Green Version]
  37. Zheng, J.; Fu, J.; Gou, M.; Huai, J.; Liu, Y.; Jian, M.; Huang, Q.; Guo, X.; Dong, Z.; Wang, H.; et al. Genome-wide transcriptome analysis of two maize inbred lines under drought stress. Plant Mol. Biol. 2010, 72, 407–421. [Google Scholar] [CrossRef] [PubMed]
  38. Mohammadi, M.; Kav, N.N.; Deyholos, M.K. Transcript expression profile of water-limited roots of hexaploid wheat (Triticum aestivum 'Opata'). Genome 2008, 51, 357–367. [Google Scholar] [PubMed]
  39. Aprile, A.; Mastrangelo, A.M.; De Leonardis, A.M.; Galiba, G.; Roncaglia, E.; Ferrari, F.; De Bellis, L.; Turchi, L.; Giuliano, G.; Cattivelli, L. Transcriptional profiling in response to terminal drought stress reveals differential responses along the wheat genome. BMC Genom. 2009, 10, 279. [Google Scholar] [CrossRef] [PubMed]
  40. Talamè, V.; Ozturk, N.Z.; Bohnert, H.J.; Tuberosa, R. Barley transcript profiles under dehydration shock and drought stress treatments. A comparative analysis. J. Exp. Bot. 2007, 58, 229–240. [Google Scholar] [CrossRef] [PubMed]
  41. Gao, R.H.; Duan, K.; Guo, G.M.; Du, Z.Z.; Chen, Z.W.; Li, L.; He, T.; Lu, R.J.; Huang, J.H. Comparative transcriptional profiling of two contrasting barley genotypes under salinity stress during the seedling stage. Plant Physiol. 2013, 139, 822–835. [Google Scholar] [CrossRef] [PubMed]
  42. Micheletto, S.; Rodriguez-Uribe, L.; Hernandez, R.; Richins, R.D.; Curry, J.; O’Connell, M.A. Comparative transcript profiling in roots of Phaseolus acutifolius and P. vulgaris under water deficit stress. Plant Sci. 2007, 173, 510–520. [Google Scholar] [CrossRef]
  43. Huang, L.; Zhang, F.; Zhang, F.; Wang, W.; Zhou, Y.; Fu, B.; Li, Z. Comparative transcriptome sequencing of tolerant rice introgression line and its parents in response to drought stress. BMC Genom. 2014, 15, 1026. [Google Scholar] [CrossRef] [PubMed]
  44. Long, W.; Zou, X.; Zhang, X. Transcriptome Analysis of canola (Brassica napus) under salt stress at the germination stage. PLoS ONE 2015, 10, e0116217. [Google Scholar] [CrossRef] [PubMed]
  45. Xiao, Q.S. Drought-related gene expression analysis during drought stress in Rapeseed (Brassica napus. L). Master’s Thesis, Oil Crops Research Institute Chinese Academy of Agricultural Sciences, Wuhan, China, 2011. [Google Scholar]
  46. Li, Z. Evaluation of drought tolerance in varieties of rapeseed (Brassica napus L.) and role of exogenous GA3. Master’s Thesis, Oil Crops Research Institute Chinese Academy of Agricultural Sciences, Wuhan, China, 2010. [Google Scholar]
  47. Cammue, B.P; Broekaert, W.F.; Kellens, J.T.; Raikhel, N.V.; Peumans, W.J. Stress-induced accumulation of wheat germ agglutinin and abscisic acid in roots of wheat seedlings. Plant Physiol. 1989, 91, 1432–1435. [Google Scholar] [CrossRef] [PubMed]
  48. Audic, S.; Claverie, J.M. The significance of digital gene expression profiles. Genome Res. 1997, 7, 986–995. [Google Scholar] [PubMed]
  49. Du, Z.; Zhou, X.; Ling, Y.; Zhang, Z.H.; Su, Z. agriGO: A GO analysis toolkit for the agricultural community. Nucleic Acids Res. 2010, 38, W64–W70. [Google Scholar] [CrossRef] [PubMed]
  50. Conesa, A.; Götz, S.; García-Gómez, J.M.; Terol, J.; Talón, M.; Robles, M. Blast2GO: A universal tool for annotation, visualization and analysis in functional genomics research. Bioinformatics 2005, 21, 3674–3676. [Google Scholar] [CrossRef] [PubMed]
  51. Kanehisa, M.; Araki, M.; Goto, S.; Hattori, M.; Hirakawa, M.; Itoh, M.; Katayama, T.; Kawashima, S.; Okuda, S.; Tokimatsu, T.; et al. KEGG for linking genomes to life and the environment. Nucleic Acids Res. 2008, 36, 480–484. [Google Scholar] [CrossRef] [PubMed]
  52. Xiong, L.M.; Schumaker, K.S.; Zhu, J.K. Cell signaling during cold, drought, and salt stress. Plant Cell 2002, 14, S165–S183. [Google Scholar] [PubMed]
  53. Shen, W.; Gómez-Cadenas, A.; Routly, E.L.; Ho, T.H.; Simmonds, J.A.; Gulick, P.J. The salt stress-inducible protein kinase gene, Esi47, from the salt-tolerant wheatgrass Lophopyrum elongatum is involved in plant hormone signaling. Plant Physiol. 2001, 125, 1429–1441. [Google Scholar] [CrossRef] [PubMed]
  54. Cramer, G.R.; Urano, K.; Delrot, S.; Pezzotti, M.; Shinozaki, K. Effects of abiotic stress on plants: A systems biology perspective. BMC Plant Biol. 2011, 11, 163. [Google Scholar] [CrossRef] [PubMed]
  55. Vranová, E.; Atichartpongkul, S.; Villarroel, R.; Van Montagu, M.; Inzé, D.; van Camp, W. Comprehensive analysis of gene expression in Nicotiana tabacum leaves acclimated to oxidative stress. Proc. Natl. Acad. Sci. USA 2002, 99, 10870–10875. [Google Scholar] [CrossRef] [PubMed]
  56. Atkinson, N.J.; Urwin, P.E. The interaction of plant biotic and abiotic stresses: From genes to the field. J. Exp. Bot. 2012, 63, 3523–3543. [Google Scholar] [CrossRef] [PubMed]
  57. Nakashima, K.; Yamaguchi-Shinozaki, K.; Shinozaki, K. The transcriptional regulatory network in the drought response and its crosstalk in abiotic stress responses including drought, cold, and heat. Front. Plant Sci. 2014, 5, 170. [Google Scholar] [CrossRef] [PubMed]
  58. Lippuner, V.; Cyert, M.S.; Gasser, C.S. Two classes of plant cDNA clones differentially complement yeast calcineurin mutants and increase salt tolerance of wild-type yeast. J. Biol. Chem. 1996, 271, 12859–12866. [Google Scholar] [PubMed]
  59. Mehrtens, F.; Kranz, H.; Bednarek, P.; Weisshaar, B. The Arabidopsis transcription factor MYB12 is a flavonol-specific regulator of phenylpropanoid biosynthesis. Plant Physiol. 2005, 138, 1083–1096. [Google Scholar] [CrossRef] [PubMed]
  60. Sablowski, R.W.; Moyano, E.; Culianez-Macia, F.A.; Schuch, W.; Martin, C.; Bevan, M. A flower-specific Myb protein activates transcription of phenylpropanoid biosynthetic genes. EMBO J. 1994, 13, 128–137. [Google Scholar] [PubMed]
  61. Zhang, J.H.; Jia, W.S.; Yang, J.C.; Ismail, A.M. Role of ABA in integrating plant responses to drought and salt stresses. Field Crops Res. 2006, 97, 111–119. [Google Scholar] [CrossRef]
  62. Mitra, J. Genetics and genetic improvement of drought resistance in crop plants. Curr. Sci. 2001, 80, 758–763. [Google Scholar]
  63. Steudle, E. Water uptake by roots: Effects of water deficit. J. Exp. Bot. 2000, 51, 1531–1542. [Google Scholar] [CrossRef] [PubMed]
  64. Jones, H.G. Stomatal control of photosynthesis and transpiration. J. Exp. Bot. 1998, 49, 387–398. [Google Scholar] [CrossRef]
  65. Kramer, P.J.; Boyer, J.S. Water Relations of Plants and Soils; Academic Press: New York, NY, USA, 1995; pp. 167–200. [Google Scholar]
  66. Steudle, E.; Peterson, C.A. How does water get through roots? J. Exp. Bot. 1998, 49, 775–788. [Google Scholar] [CrossRef]
  67. Collins, N.C.; Tardieu, F.; Tuberosa, R. Quantitative trait loci and crop performance under abiotic stress: Where do we stand? Plant Physiol. 2008, 147, 469–486. [Google Scholar] [CrossRef] [PubMed]
  68. Rudd, S. Expressed sequence tags: Alternative or complement to whole genome sequences? Trends Plant Sci. 2003, 8, 321–329. [Google Scholar] [CrossRef]
  69. Ziolkowski, P.A.; Kaczmarek, M.; Babula, D.; Sadowski, J. Genome evolution in Arabidopsis/Brassica: Conservation and divergence of ancient rearranged segments and their breakpoints. Plant J. 2006, 47, 63–74. [Google Scholar] [CrossRef] [PubMed]
  70. Hoskins, R.A.; Smith, C.D.; Carlson, J.W.; Carvalho, A.B.; Halpern, A.; Kaminker, J.S.; Kennedy, C.; Mungall, C.J.; Sullivan, B.A.; Sutton, G.G.; et al. Heterochromatic sequences in a Drosophila whole-genome shotgun assembly. Genome Biol. 2002, 3. [Google Scholar] [CrossRef] [Green Version]
  71. Whittle, C.A.; Malik, M.R.; Li, R.; Krochko, J.E. Comparative transcript analyses of the ovule, microspore, and mature pollen in Brassica napus. Plant Mol. Biol. 2010, 72, 279–299. [Google Scholar] [CrossRef] [PubMed]
  72. Harrison, M.A. Cross-talk between phytohormone signaling pathways under optimal and stressful conditions. In Phytohormones and Abiotic Stress Tolerance in Plants; Nafees, A.K., Ed.; Springer-Verlag GmbH: Berlin, Germany, 2012; pp. 49–76. [Google Scholar]
  73. Piskurewicz, U.; Tureckova, V.; Lacombe, E.; Lopez-Molina, L. Far-red light inhibits germination through DELLA-dependent stimulation of ABA synthesis and ABI3 activity. EMBO J. 2009, 28, 2259–2271. [Google Scholar] [CrossRef] [PubMed]
  74. Teng, S.; Rognoni, S.; Bentsink, L.; Smeekens, S. The Arabidopsis GSQ5/DOG1 Cvi allele is induced by the ABA-mediated sugar signalling pathway, and enhances sugar sensitivity by stimulating ABI4 expression. Plant J. 2008, 55, 372–381. [Google Scholar] [CrossRef] [PubMed]
  75. Zhang, X.; Takemiya, A.; Kinoshita, T.; Shimazaki, K. Nitric oxide inhibits blue light-specific stomatal opening via abscisic acid signaling pathways in Vicia guard cells. Plant Cell Physiol. 2007, 48, 715–723. [Google Scholar] [CrossRef] [PubMed]
  76. Schroeder, J.I.; Allen, G.J.; Hugouvieux, V.; Kwak, J.M.; Waner, D. Guard cell signal transduction. Annu. Rev. Plant Physiol. Plant Mol. Biol. 2001, 52, 627–658. [Google Scholar] [CrossRef] [PubMed]
  77. Nemhauser, J.L.; Hong, F.; Chory, J. Different plant hormones regulate similar processes through largely nonoverlapping transcriptional responses. Cell 2006, 126, 467–475. [Google Scholar] [CrossRef] [PubMed]
  78. Huang, D.; Wu, W.; Abrams, S.R.; Cutler, A.J. The relationship of drought-related gene expression in Arabidopsis thaliana to hormonal and environmental factors. J. Exp. Bot. 2008, 59, 2991–3007. [Google Scholar] [CrossRef] [PubMed]
  79. Pandey, S.P.; Somssich, I.E. The role of WRKY transcription factors in plant immunity. Plant Physiol. 2009, 150, 1648–1655. [Google Scholar] [CrossRef] [PubMed]
  80. Sakamoto, H.; Araki, T.; Meshi, T.; Iwabuchi, M. Expression of a subset of the Arabidopsis Cys2/His2-type zinc-finger protein gene family under water stress. Gene 2000, 248, 23–32. [Google Scholar] [CrossRef]
  81. Seo, P.J.; Xiang, F.; Qiao, M.; Park, J.Y.; Lee, Y.N.; Kim, S.G.; Lee, Y.H.; Park, W.J.; Park, C.M. The MYB96 transcription factor mediates abscisic acid signaling during drought stress response in Arabidopsis. Plant Physiol. 2009, 151, 275–289. [Google Scholar] [CrossRef] [PubMed]
  82. Sasaki-Sekimoto, Y.; Jikumaru, Y.; Obayashi, T.; Saito, H.; Masuda, S.; Kamiya, Y.; Ohta, H.; Shirasu, K. Basic helix-loop-helix transcription factors JASMONATE-ASSOCIATED MYC2-LIKE1 (JAM1), JAM2, and JAM3 are negative regulators of jasmonate responses in Arabidopsis. Plant Physiol. 2013, 163, 291–304. [Google Scholar] [CrossRef] [PubMed]
  83. Coego, A.; Ramirez, V.; Gil, M.J.; Flors, V.; Mauch-Mani, B.; Vera, P. An Arabidopsis homeodomain transcription factor, OVEREXPRESSOR OF CATIONIC PEROXIDASE 3, mediates resistance to infection by necrotrophic pathogens. Plant Cell 2005, 17, 2123–2137. [Google Scholar] [CrossRef] [PubMed]
  84. Dubos, C.; Stracke, R.; Grotewold, E.; Weisshaar, B.; Martin, C.; Lepiniec, L. MYB transcription factors in Arabidopsis. Trends Plant Sci. 2010, 15, 573–581. [Google Scholar] [CrossRef] [PubMed]
  85. Raffaele, S.; Vailleau, F.; Léger, A.; Joubès, J.; Miersch, O.; Huard, C.; Blée, E.; Mongrand, S.; Domergue, F.; Roby, D. A MYB transcription factor regulates very-long-chain fatty acid biosynthesis for activation of the hypersensitive cell death response in Arabidopsis. Plant Cell 2008, 20, 752–767. [Google Scholar] [CrossRef] [PubMed]
  86. Cominelli, E.; Galbiati, M.; Vavasseur, A.; Conti, L.; Sala, T.; Vuylsteke, M.; Leonhardt, N.; Dellaporta, S.L.; Tonelli, C. A guard-cell-specific MYB transcription factor regulates stomatal movements and plant drought tolerance. Curr. Biol. 2005, 15, 1196–1200. [Google Scholar] [CrossRef] [PubMed]
  87. Abe, H.; Urao, T.; Ito, T.; Seki, M.; Shinozaki, K.; Yamaguchi-Shinozaki, K. Arabidopsis AtMYC2 (bHLH) and AtMYB2 (MYB) function as transcriptional activators in abscisic acid signaling. Plant Cell 2003, 15, 63–78. [Google Scholar] [CrossRef] [PubMed]
  88. Yamaguchi-Shinozaki, K.; Shinozaki, K. Transcriptional regulatory networks in cellular responses and tolerance to dehydration and cold stresses. Annu. Rev. Plant Biol. 2006, 57, 781–803. [Google Scholar] [CrossRef] [PubMed]
  89. Mengiste, T.; Chen, X.; Salmeron, J.; Dietrich, R. The BOTRYTIS SUSCEPTIBLE1 gene encodes an R2R3MYB transcription factor protein that is required for biotic and abiotic stress responses in Arabidopsis. Plant Cell 2003, 15, 2551–2565. [Google Scholar] [CrossRef] [PubMed]
  90. Fujimoto, S.Y.; Ohta, M.; Usui, A.; Shinshi, H.; Ohme-Takagi, M. Arabidopsis ethylene-responsive element binding factors act as transcriptional activators or repressors of GCC box-mediated gene expression. Plant Cell 2000, 12, 393–404. [Google Scholar] [CrossRef] [PubMed]
  91. Liu, Z.Q.; Yan, L.; Wu, Z.; Mei, C.; Lu, K.; Yu, Y.T.; Liang, S.; Zhang, X.F.; Wang, X.F.; Zhang, D.P. Cooperation of three WRKY-domain transcription factors WRKY18, WRKY40, and WRKY60 in repressing two ABA-responsive genes ABI4 and ABI5 in Arabidopsis. J. Exp. Bot. 2012, 63, 6371–6392. [Google Scholar] [CrossRef] [PubMed]
  92. Jiang, Y.; Liang, G.; Yu, D. Activated expression of WRKY57 confers drought tolerance in Arabidopsis. Mol. Plant 2012, 5, 1375–1388. [Google Scholar] [CrossRef] [PubMed]
  93. Endo, A.; Sawada, Y.; Takahashi, H.; Okamoto, M.; Ikegami, K.; Koiwai, H.; Seo, M.; Toyomasu, T.; Mitsuhashi, W.; Shinozaki, K.; et al. Drought induction of Arabidopsis 9-cis-epoxycarotenoid dioxygenase occurs in vascular parenchyma cells. Plant Physiol. 2008, 147, 1984–1993. [Google Scholar] [CrossRef] [PubMed]
  94. Ozhuner, E.; Eldem, V.; Ipek, A.; Okay, S.; Sakcali, S.; Zhang, B.; Boke, H.; Unver, T. Boron stress responsive microRNAs and their targets in barley. PLoS ONE 2013, 8, e59543. [Google Scholar] [CrossRef] [PubMed]
  95. Tran, L.S.; Nakashima, K.; Sakuma, Y.; Simpson, S.D.; Fujita, Y.; Maruyama, K.; Fujita, M.; Seki, M.; Shinozaki, K.; Yamaguchi-Shinozaki, K. Isolation and functional analysis of Arabidopsis stress-inducible NAC transcription factors that bind to a drought-responsive cis-element in the early responsive to dehydration stress 1 promoter. Plant Cell 2004, 16, 2481–2498. [Google Scholar] [CrossRef] [PubMed]
  96. Niu, F.; Wang, B.; Wu, F.; Yan, J.; Li, L.; Wang, C.; Wang, Y.; Yang, B.; Jiang, Y.Q. Canola (Brassica napus L.) NAC103 transcription factor gene is a novel player inducing reactive oxygen species accumulation and cell death in plants. Biochem. Biophys. Res. Commun. 2014, 454, 30–35. [Google Scholar] [CrossRef] [PubMed]
  97. Zhong, H.; Guo, Q.Q.; Chen, L.; Ren, F.; Wang, Q.Q.; Zheng, Y.; Li, X.B. Two Brassica napus genes encoding NAC transcription factors are involved in response to high-salinity stress. Plant Cell Rep. 2012, 31, 1991–2003. [Google Scholar] [CrossRef] [PubMed]
  98. Yamaguchi-Shinozaki, K.; Shinozaki, K. Organization of cis-acting regulatory elements in osmotic- and cold-stress-responsive promoters. Trends Plant Sci. 2005, 10, 88–94. [Google Scholar] [CrossRef] [PubMed]
  99. AC’t Hoen, P.A.; Ariyurek, Y.; Thygesen, H.H.; Vreugdenhil, E.; Vossen, R.H.; de Menezes, R.X.; Boer, J.M.; van Ommen, G.J.; den Dunnen, J.T. Deep sequencing-based expression analysis shows major advances in robustness, resolution and inter-lab portability over five microarray platforms. Nucleic Acids Res. 2008, 36, e141. [Google Scholar] [CrossRef] [PubMed]
  100. Yan, X.H.; Dong, C.H.; Yu, J.Y.; Liu, W.H.; Jiang, C.H.; Liu, J.; Hu, Q.; Fang, X.P.; Wei, W.H. Transcriptome profile analysis of young floral buds of fertile and sterile plants from the self-pollinated offspring of the hybrid between novel restorer line NR1 and Nsa CMS line in Brassica napus. BMC Genom. 2013, 14, 26. [Google Scholar] [CrossRef] [PubMed]
  101. Morrissy, A.S.; Morin, R.D.; Delaney, A.; Zeng, T.; McDonald, H.; Jones, S.; Zhao, Y.; Hirst, M.; Marra, M.A. Next-generation tag sequencing for cancer gene expression profiling. Genome Res. 2009, 19, 1825–1835. [Google Scholar] [CrossRef] [PubMed]

