Article

β-Radiation Stress Responses on Growth and Antioxidative Defense System in Plants: A Study with Strontium-90 in Lemna minor

1
SCK•CEN, Belgian Nuclear Research Centre, Boeretang 200, 2400 Mol, Belgium
2
Department of Biology, University of Antwerp, Groenenborgerlaan 171, 2020 Antwerpen, Belgium
3
Centre for Environmental Research, University of Hasselt, Universiteitslaan 1, 3590 Diepenbeek, Belgium
4
Veterinary Sciences, University of Antwerp, Groenenborgerlaan 171, 2020 Antwerpen, Belgium
*
Author to whom correspondence should be addressed.
Int. J. Mol. Sci. 2015, 16(7), 15309-15327; https://doi.org/10.3390/ijms160715309
Submission received: 28 May 2015 / Revised: 23 June 2015 / Accepted: 26 June 2015 / Published: 7 July 2015
(This article belongs to the Special Issue Abiotic Stress and Gene Networks in Plants)

Abstract

:
In the following study, dose dependent effects on growth and oxidative stress induced by β-radiation were examined to gain better insights in the mode of action of β-radiation induced stress in plant species. Radiostrontium (90Sr) was used to test for β-radiation induced responses in the freshwater macrophyte Lemna minor. The accumulation pattern of 90Sr was examined for L. minor root and fronds separately over a seven-day time period and was subsequently used in a dynamic dosimetric model to calculate β-radiation dose rates. Exposing L. minor plants for seven days to a 90Sr activity concentration of 25 up to 25,000 kBq·L−1 resulted in a dose rate between 0.084 ± 0.004 and 97 ± 8 mGy·h−1. After seven days of exposure, root fresh weight showed a dose dependent decrease starting from a dose rate of 9.4 ± 0.5 mGy·h−1. Based on these data, an EDR10 value of 1.5 ± 0.4 mGy·h−1 was estimated for root fresh weight and 52 ± 17 mGy·h−1 for frond fresh weight. Different antioxidative enzymes and metabolites were further examined to analyze if β-radiation induces oxidative stress in L. minor.

Graphical Abstract

1. Introduction

Anthropogenic activities have led to enhanced releases of fission products from nuclear facilities into the environment. Many of these fission products are radionuclides that are short-lived γ- and β-emitting isotopes, which rapidly lose their radioactivity. However, some radionuclides have a physical half-life that takes several years and therefore can contribute to a long-lasting contamination of the biosphere [1]. Among the artificially produced radionuclides, strontium-90 (90Sr) is of particular interest due to its relative long physical half-live of 28.6 years. It is produced with high yields as a byproduct of the fission of uranium and plutonium and is thus a common waste product from nuclear activities [2]. Also, the explosions of nuclear weapons in the 1950s and 1960s contributed to the widespread distribution of 90Sr in the environment [3]. More recently, 90Sr was accidently released during nuclear meltdown in Fukushima in 2011 [4] and in substantial amounts in Chernobyl in 1986 [5]. Geochemical studies revealed that large amount of this radionuclide can be transported via rivers to the ocean or could accumulate in freshwater reservoirs where it can remain for many years [4,6]. As 90Sr decays, it releases moderate energy β-particles and forms yttrium-90, which in turn emits very strong energetic β-particles within 64 h to stable zirconium. Since most of the energy from such β-particles is absorbed by surface tissues, the bioaccumulation of these radionuclides can potentially produce deleterious effects to the health of living organisms [1].
Radioecological research on β-emitting isotopes in plants has mainly focused on 90Sr accumulation in edible plants, in particular crops [7,8,9,10] or on exploring the use of plants in phytoremediation strategies i.e., to decontaminate soils contaminated with low levels of 90Sr [11,12,13,14]. A number of studies report on a reduction in plant growth at elevated Sr concentrations [10,15,16,17]. However, these focused on stable Sr at the mM-level. Biological responses induced by β-radiation from 90Sr have, to date, not been studied in detail in plants [18]. Only one study examined the photosynthetic response induced by high 90Sr exposure levels [19]. Relative biological effectiveness (RBE) values can be used to extrapolate the biological responses for different types of radiation in non-human biota. Since RBE values for high-energy β-radiation are equal to γ-radiation, similar radiation responses can be expected compared to γ-radiation exposure [20]. A transcriptomic study revealed similar stress responses, defense responses and metabolic processes of rice seedlings exposed differentially to either γ-radiation or particle radiation [21]. High levels of ionizing radiation often lead to an increase in the formation of highly reactive oxygen species (ROS), which may cause oxidative stress, a disturbance of the cellular redox status, as is observed after exposure to other environmental stressors [22,23]. These ROS molecules are also generated as byproducts of normal oxidative metabolism and play an imported role in signaling and oxidative stress responses. Under abiotic stress, an imbalance between oxidative and reductive processes in the cell is generated. Plants have antioxidative defense systems to counteract the elevated ROS levels. These comprise of low molecular weight antioxidants like reduced glutathione (GSH) and ascorbate (ASC). The metabolites are key players in the ASC-GSH cycle, forming an important mechanism of the antioxidative defense system [24]. Other antioxidative biomolecules include antioxidative enzymes such as catalase (CAT), glutathione reductase (GR), superoxide dismutase (SOD), ascorbate peroxidase (APOD), syringaldizyne peroxidase (SPOD) and guaiacol peroxidase (GPOD). Together these enzymatic and non-enzymatic antioxidants can scavenge different free radical elements in order to maintain the redox balance in the cell and to protect biomolecules from oxidative attacks. Different studies already highlighted the importance of such antioxidative enzymes and metabolites to handle γ-radiation exposure treatment in plants [25,26]. However, antioxidative defense mechanisms have never been examined in β-irradiated plants.
Although Sr is not essential for plant metabolism, it bears a chemical analogy with the essential plant macronutrient Ca. In terrestrial plants, the uptake of Ca occurs mainly via Ca channels in the roots [27]. Calcium ATPases are also present in the roots and catalyze the Ca influx and efflux across the plasma membrane of endodermal cells. Calcium is then transported to the shoots via the xylem where the excess of Ca is stored in vacuoles to keep the Ca concentration in cytosol at a basal level. Kinetic studies of Ca in combination with Sr pointed out that both compounds have almost identical uptake efficiencies [11,17,28]. Furthermore, it has been found that once taken up, like Ca, Sr is exclusively transported via the xylem, which further led to the conclusion that plants do not discriminate Sr and Ca ions [29,30]. Calcium oxalate crystals are formed at toxic Ca concentration in plants and when Sr is added to nutrient solutions, it has been found that Sr is incorporated in Ca oxalate crystals in L. minor [31,32]. Overall, plants seem to have the capacity to accumulate Sr-ions, thereby taking advantage of Ca uptake and transport mechanisms. Therefore, it is conceivable that when the radioactive isotope 90Sr accumulates, it can subsequently deliver a considerable β-radiation dose to the plant organs.
Lemna minor was selected as a biological model to study irradiation effects following β-radiation exposure. This free-floating vascular macrophyte develops roots and has the potential to take up nutrients through both fronds and roots. L. minor is to date the only freshwater plant model for testing metal biomonitoring and other toxic chemicals in freshwater ecosystems [33,34]. This bio-test includes a seven-day experiment to evaluate growth related endpoints. This study reports on the responses of L. minor to β-radiation by using 90Sr as β-emitting isotope. First, the uptake pattern of 90Sr was characterized over a seven-day time period to construct a dynamic dosimetric model to determine internal and external exposures rates. Afterwards, L. minor plants were exposed to different 90Sr concentrations in order to study possible dose dependent relationships. The classical growth related endpoints were evaluated and compared with antioxidative defense system endpoints. Our findings contribute to a better insight into the antioxidant defense system in plants following β-radiation.

2. Results

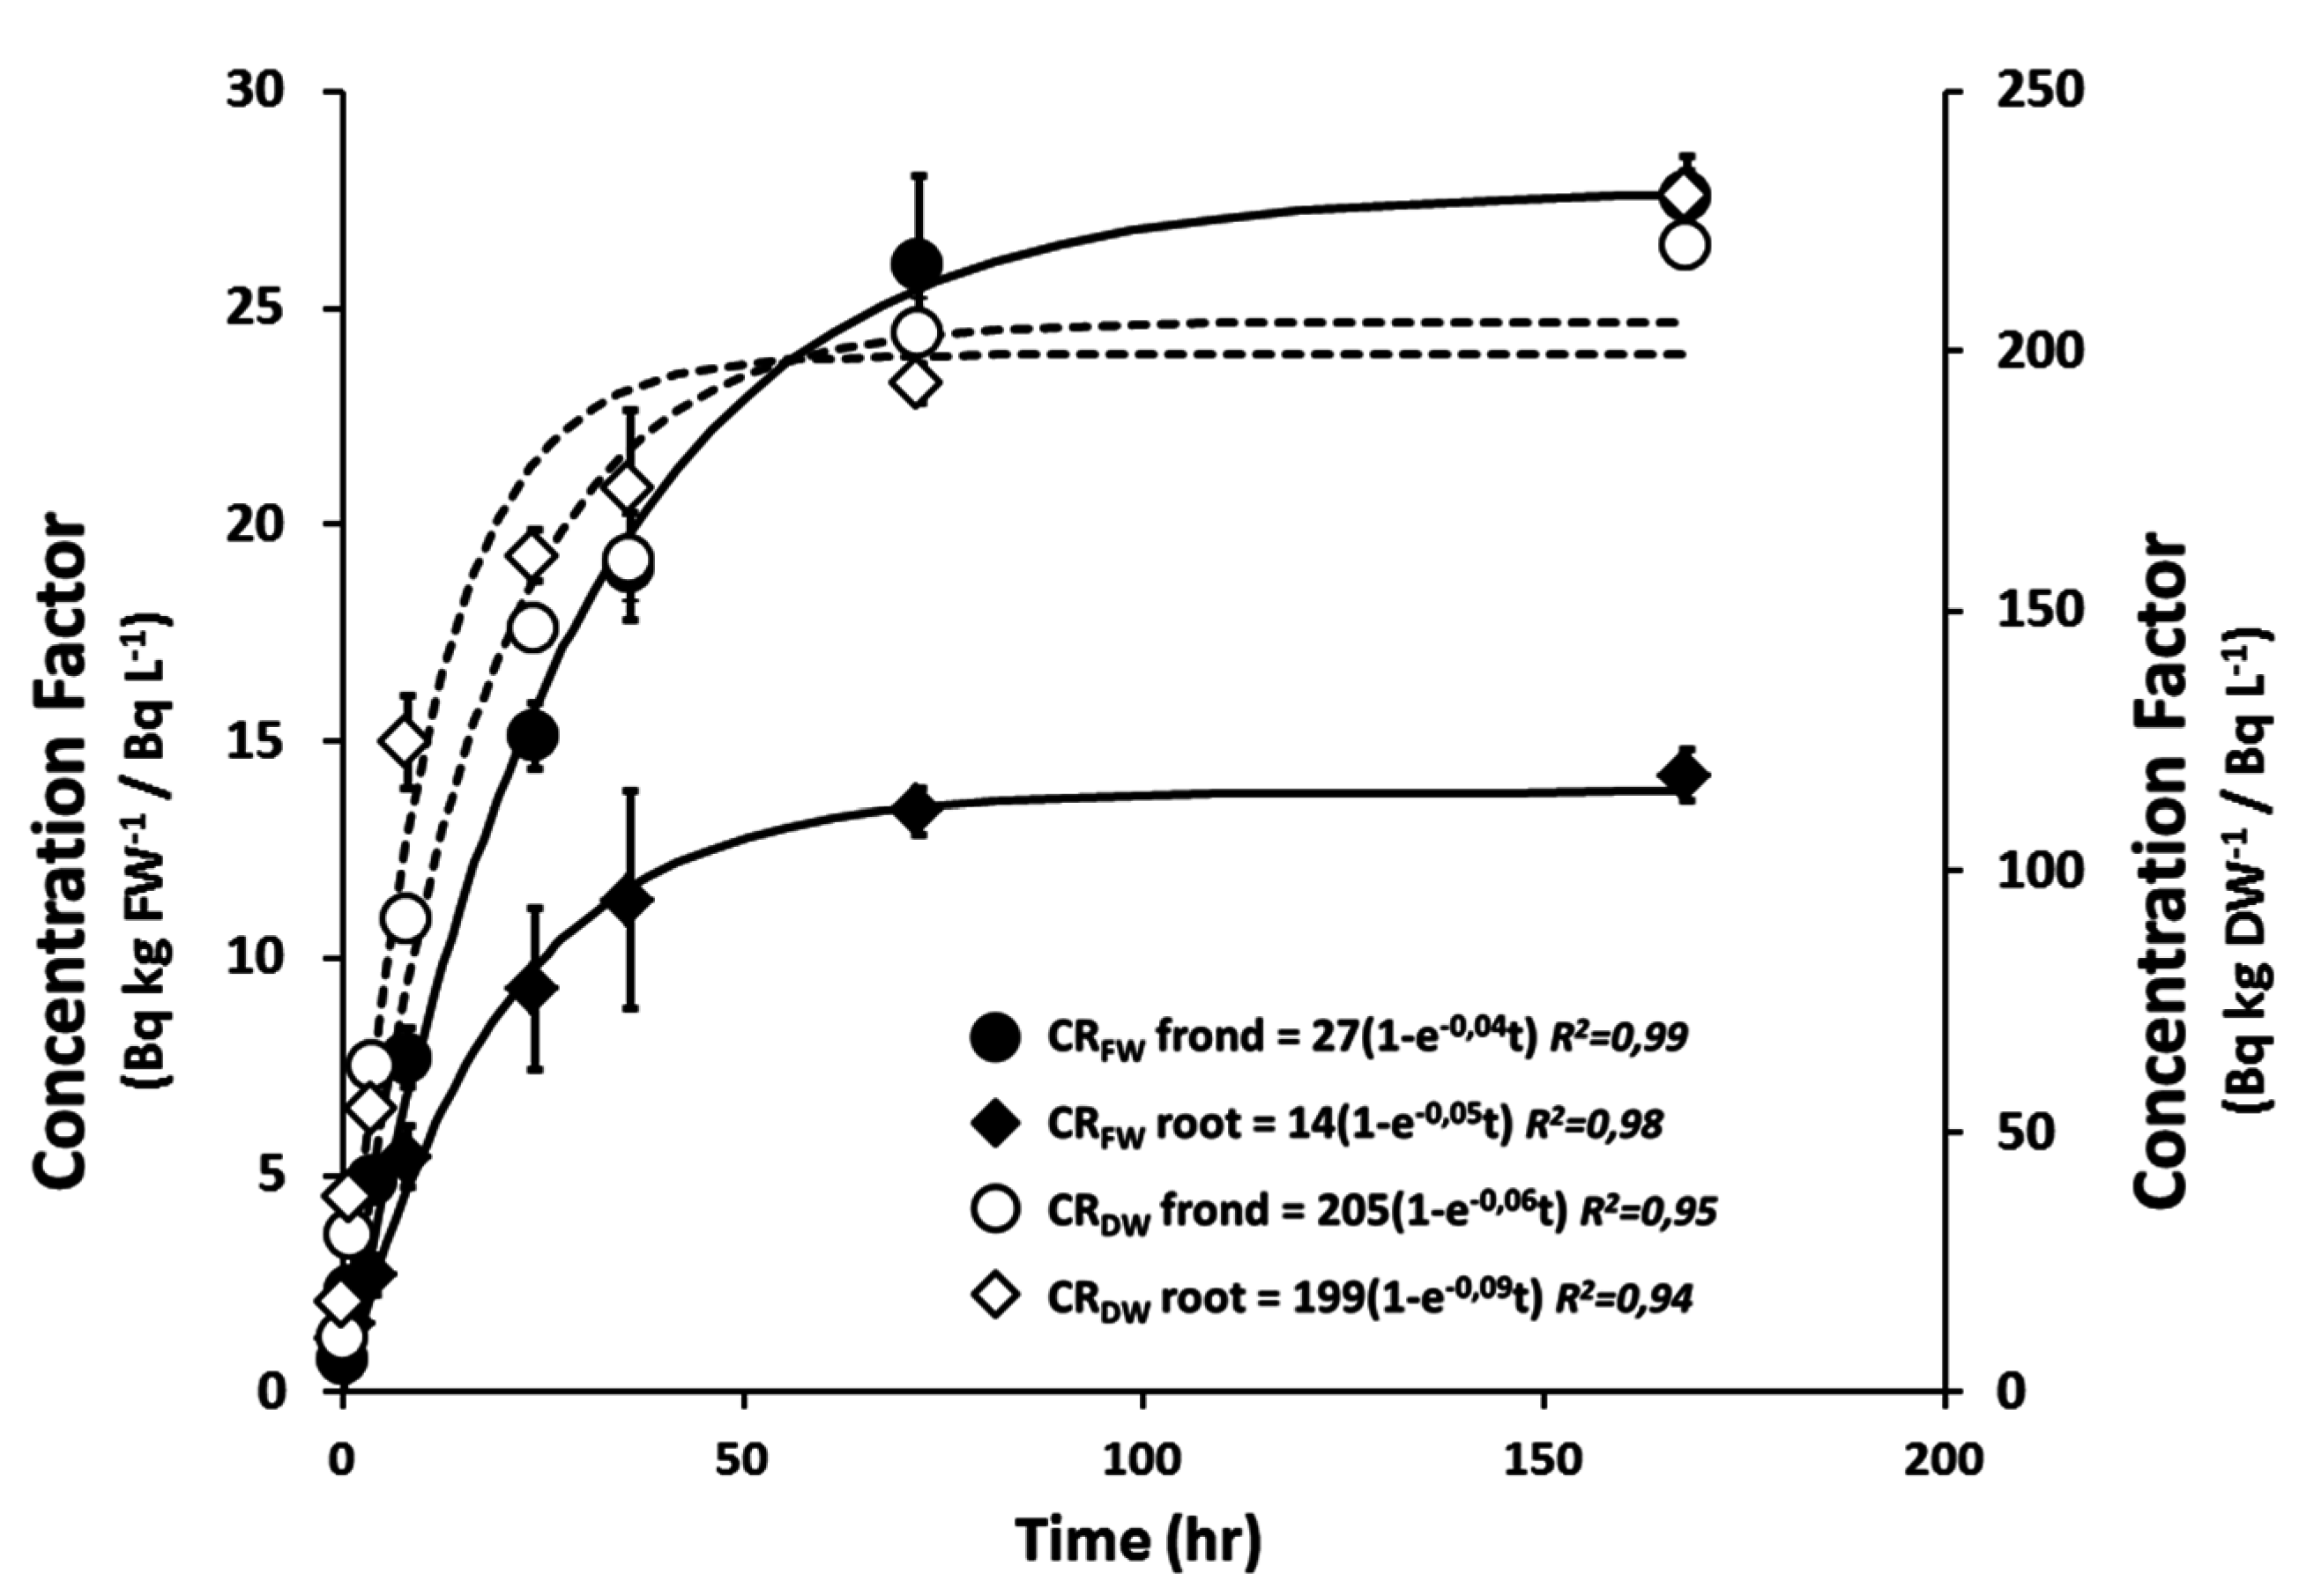
2.1. 90Sr Uptake and Dosimetry

L. minor plants were continuously exposed for seven days to four different activity concentrations from 25 up to 25,000 kBq·L−1 to study dose dependent relationships of β-radiation. In order to constitute a maximal 90Sr uptake and accumulation, L. minor plants were exposed in a medium containing 0.2 mM Ca. The 90Sr concentration ratios (CR) to frond and root expressed on fresh and dry weigh basis are shown in Table 1. Although the CRDW of the highest tested activity concentration was slightly lower compared with other tested activity concentrations, no significant differences in CRDW were observed between tested Sr activity concentrations from non-exposed plants (ANOVA, p < 0.05). It was found that the 90Sr content was similar in both plant organs (fronds and roots) indicated by equivalent CRDW for each tested activity concentration. In contrast, the CRs expressed on plant fresh weight (CRFW) and used in dosimetry calculations, were remarkably lower in the roots compared to the fronds. The CRFW in this study were approximately 60 and 30 Bq·kg−1 FW/Bq·L−1 for fronds and roots respectively. As for CRDW, no concentration-dependent differences in CRs were observed for the tested activity concentrations. 90Sr uptake in L. minor roots and fronds was monitored over a seven-day period in order to enable more correct dose assessment estimations. With the tested 90Sr activity concentration used in this experiment, the activity of 90Sr found in roots increased rapidly during the first 8 h, then much slower during the next 72 h before it tended to stabilize (Figure 1). About 92% ± 3% of the 90Sr uptake capacity at equilibrium phase (at which the net uptake is zero) of the L. minor fronds and 97% ± 4% of the roots was accumulated after 72 h of exposure. These time-dependent uptake parameters and the respective CRFW were considered to calculate accurate dose rates for L. minor organs (fronds and roots) exposed over a seven-day exposure. Calculating internal and external dose rates for roots and fronds separately, the exposure of L. minor plants to 90Sr activity concentration from 25 up to 25,000 kBq·L−1 resulted in a total dose rate ranging from 0.084 ± 0.004 and 97 ± 8 mGy·h−1 for the L. minor plants (Table 1). The estimated absorbed dose rates from internal exposure were generally one order of magnitude higher than those from external exposure.
Figure 1. Time course of Sr90 uptake in L. minor for time period of 168 hours exposed to 10 kBq·L−1 of 90Sr. Black dots refers to concentration ratios on fresh weight for frond and root, white dots refers to concentration ratios on dry weight for frond and root. Legend shows the equation of each fit with the R2 value. Each data point represents the mean ± SE of six biological replicas.
Ijms 16 15309 g001
Table 1. Nominal and measured medium activity concentrations of 90Sr, biomass of L. minor fronds and roots given as fresh weight (FW) and dry weight (DW) of each activity concentration, 90Sr concentration ratios expressed in fresh weights and dry weights for L. minor fronds and roots after seven days of exposure and the calculated absorbed dose rates in L. minor organs. All values are given as mean ± SE with at least three biological replicates. Significant differences from control plants (p < 0.05, one-way ANOVA) are given as *.
Activity Concentration BiomassUptake ParametersDosimetric Parameters
Nominal
[kBq·L−1]
Measured
[kBq·L−1]
FW
[mg]
DW
[mg]
Conc. Ratio FW
[Bq·kg−1 FW/Bq·L−1]
Conc. Ratio DW
[Bq·kg−1 DW/Bq·L−1]
Dose Rate Intern
[µGy·h−1]
Dose Rate Extern
[µGy·h−1]
Total Dose Rate
[µGy·h−1]
00 ± 0.001plant199.5 ± 1013.9 ± 0.7nanananana
frond165.6 ± 7.812.3 ± 0.6nanananana
root33.8 ± 2.31.6 ± 0.1nanananana
2525 ± 0.1plant225.3 ± 10.415.3 ± 0.560 ± 3832 ± 2185 ± 45 ± 0.284 ± 4
frond186 ± 8.813.5 ± 0.362 ± 2829 ± 3086 ± 45 ± 0.289 ± 4
root38.8 ± 1.81.8 ± 0.228 ± 2783 ± 2341 ± 310 ± 0.451 ± 2
250247 ± 0.1plant210.2 ± 9.615.1 ± 0.960 ± 4767 ± 65918 ± 6353 ± 3967 ± 58
frond178 ± 813.7 ± 0.765 ± 5789 ± 711000 ± 7653 ± 31053 ± 74
root31.2 ± 1.61.5 ± 0.129 ± 1752 ± 15454 ± 20107 ± 5562 ± 21
25002453 ± 2plant195.6 ± 5.614.0 ± 0.260 ± 3844 ± 238881 ± 486530 ± 39432 ± 483
frond178.5 ± 513.2 ± 0.363 ± 3858 ± 249185 ± 477530 ± 39715 ± 476
root16.8 ± 0.7 *0.9 ± 0.1 *37 ± 3820 ± 485486 ± 4691070 ± 66556 ± 464
25,00024,567 ± 13plant124.4 ± 3.412.5 ± 0.157 ± 5540 ± 35 *91,063 ± 86076006 ± 9897,264 ± 8490
frond118.7 ± 3.5 *12.2 ± 0.159 ± 6 542 ± 36 *92,827 ± 91306006 ± 9898,834 ± 9033
root5.7 ± 0.2 *0.4 ± 0.02 *36 ± 2474 ± 20 *56,904 ± 228712,121 ± 19769,025 ± 2181

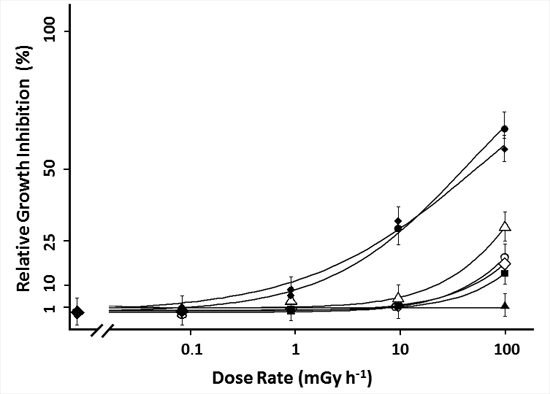
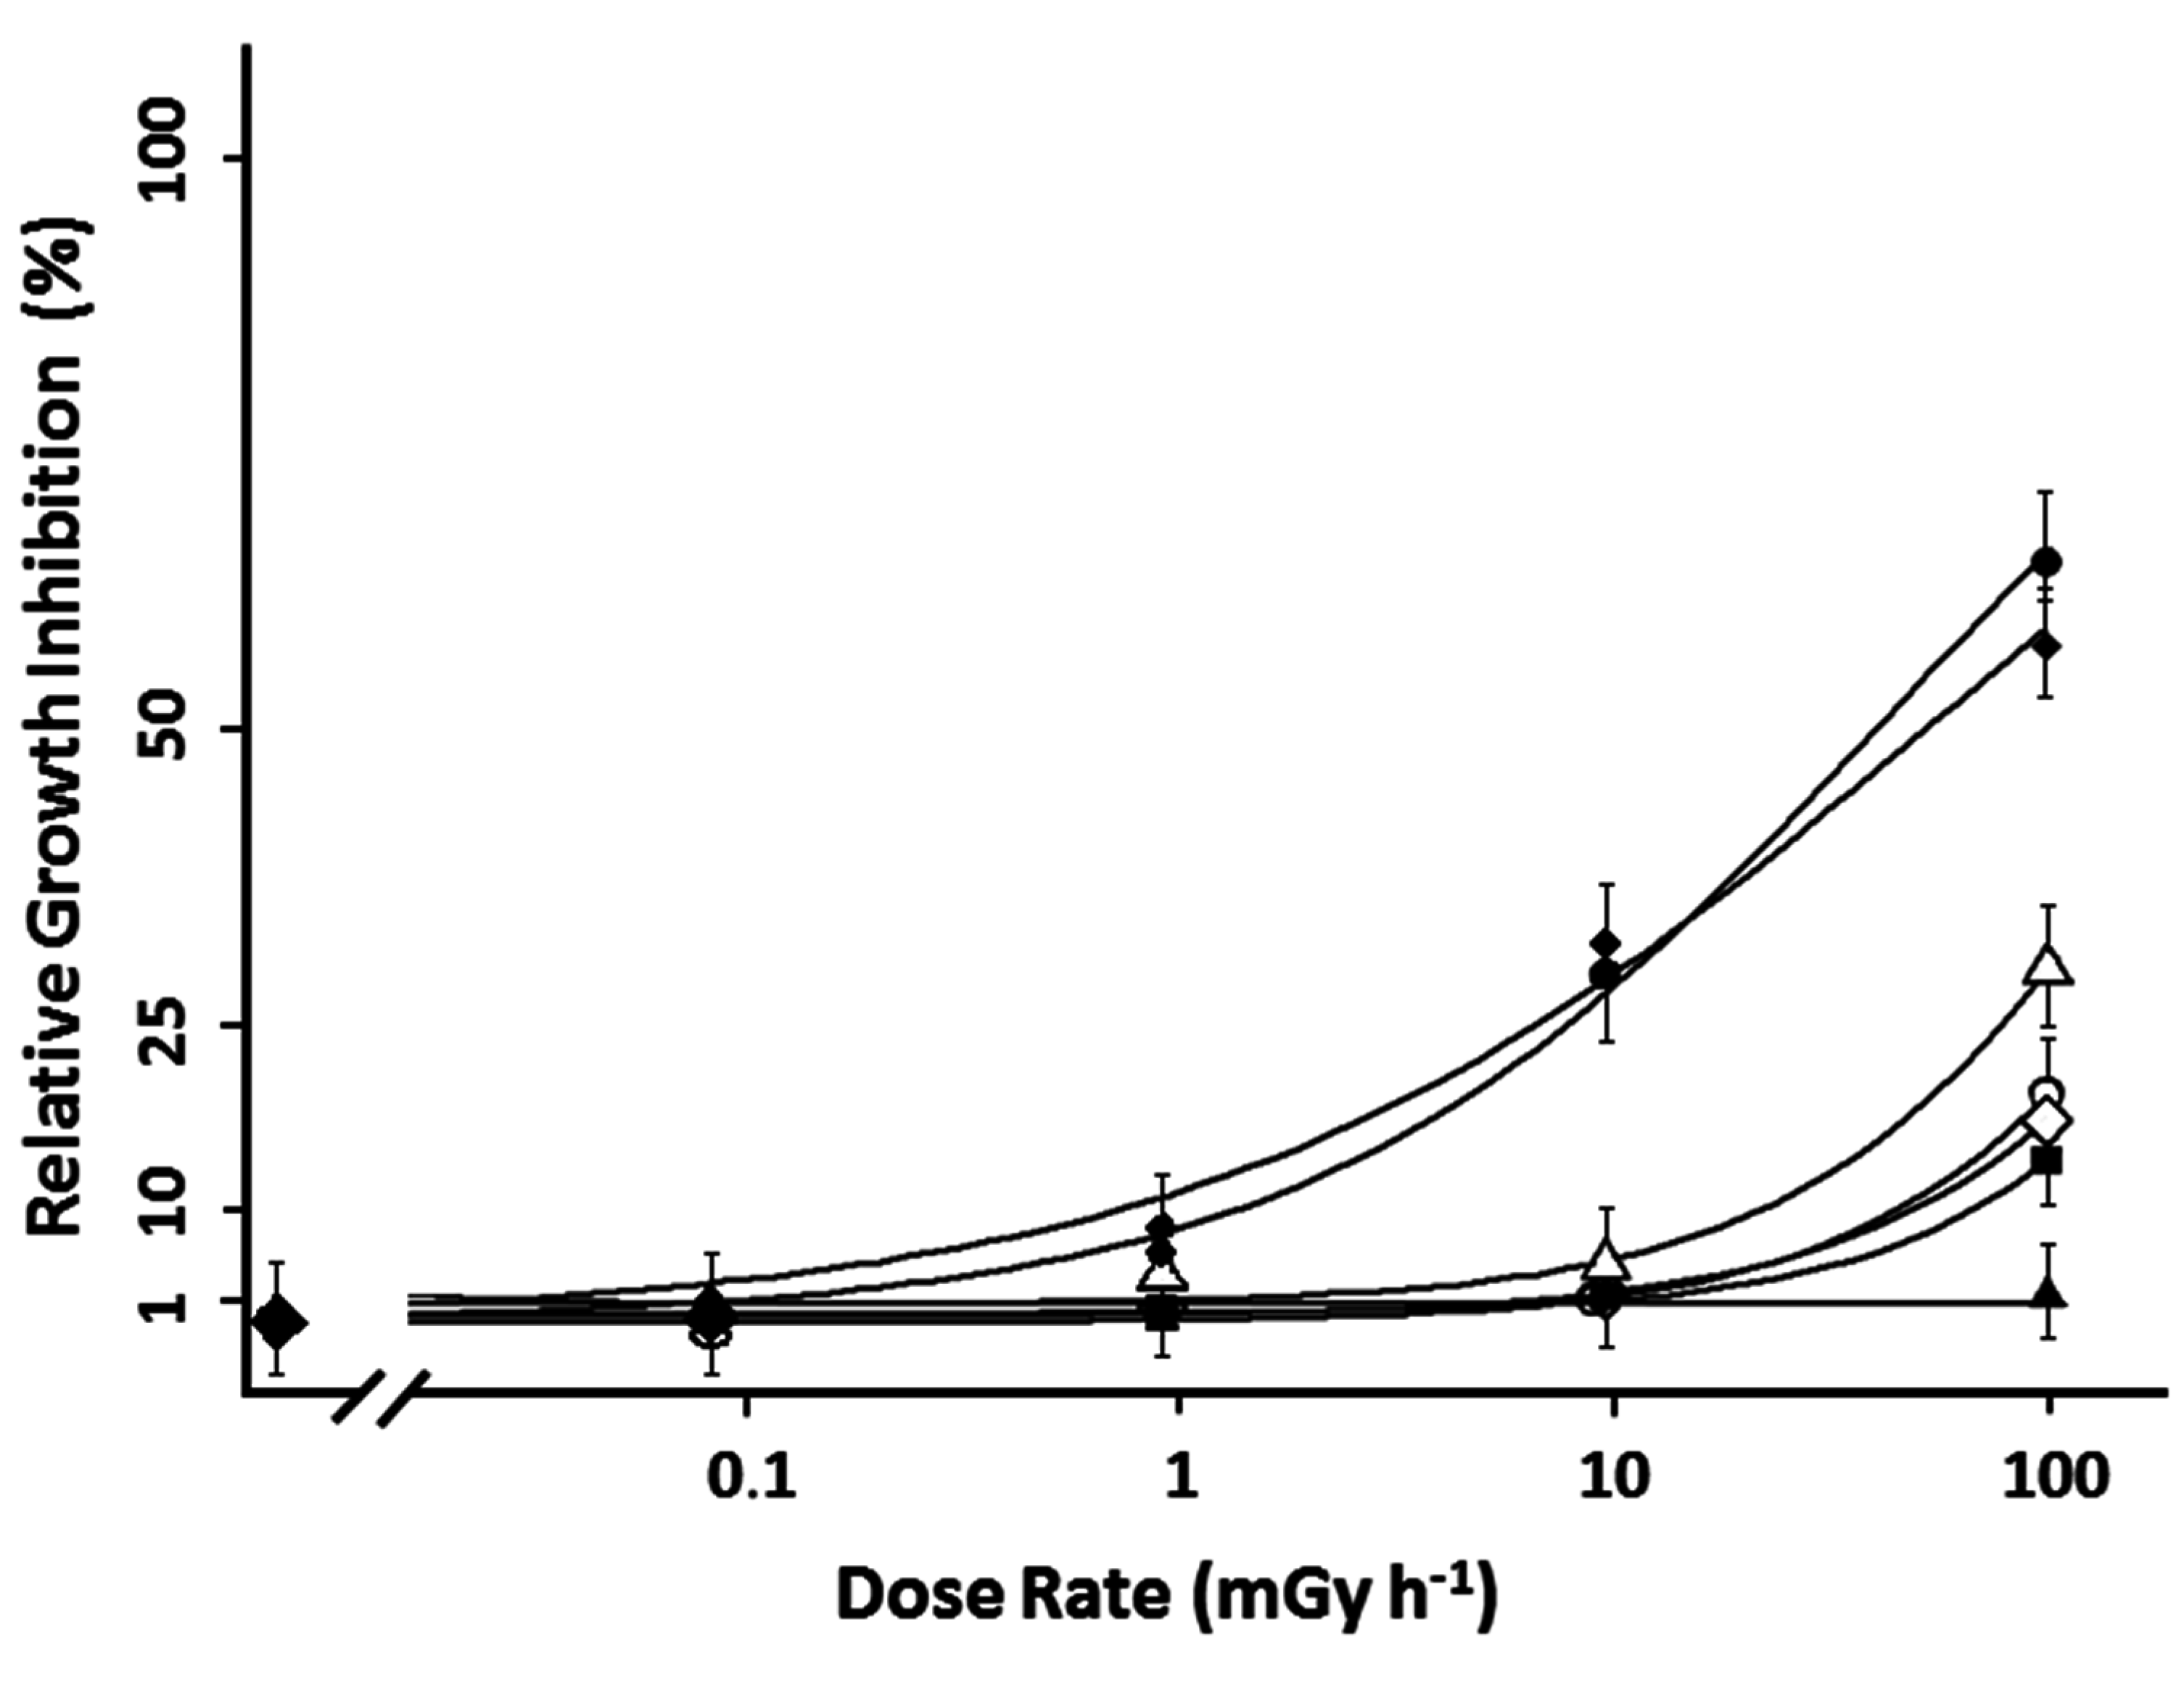
2.2. 90Sr Induced Effects in L. minor

Frond number, frond area and frond and root fresh and dry weight were measured for L. minor plants exposed from 0.084 ± 0.004 mGy·h−1 up to 97 ± 8 mGy·h−1. After seven days, frond related growth rates determined based on fresh weight, frond area and number decreased significantly at the highest tested dose rate of 97 ± 8 mGy·h−1 with an inhibition of 16% ± 3%, 18% ± 1% and 16% ± 3%, respectively (ANOVA, p < 0.05). The growth endpoints measured on root fresh and dry weight were significantly affected at 9.4 ± 0.5 mGy·h−1. At the highest tested dose rate, root fresh and dry weight was inhibited for 63% ± 1.5% and 57% ± 0.4%, respectively (Figure 2). The derived EDR10-value (Effective Dose Rate) for frond area was 95 ± 7, and 154 ± 15 and 152 ± 13 mGy·h−1 for fresh weight and frond number, respectively. The EDR10-values for root biomass were 1.5 ± 0.4 and 1.0 ± 0.5 mGy·h−1 for root fresh and dry weight, respectively. Growing L. minor plants in stable Sr concentrations up to 60 nM, the equivalent nominal concentration at 90Sr activity concentration of 25,000 kBq·L−1, did not result in a significant difference in growth rate (data not shown). As such, observed growth effects are expected to be linked to 90Sr induced radiotoxicity and not Sr chemotoxicity.
Figure 2. Dose response curve of L. minor plants treated for seven days with β-radation. The dose response curces are given by relative growth inhibition based on frond area ( Ijms 16 15309 i001), frond number ( Ijms 16 15309 i002), plant fresh weight ( Ijms 16 15309 i003), frond fresh weight ( Ijms 16 15309 i004), frond dry weight ( Ijms 16 15309 i005), root fresh weight ( Ijms 16 15309 i006) and root dry weight ( Ijms 16 15309 i007). Each data point represents the mean ± SE of nine biological replicas for frond related endpoints and three biological replicas for root related endpoints. In addition to the average values of each point, the log-logistic function fitted through the data is added.
Ijms 16 15309 g002
To evaluate oxidative stress induced in β-exposed L. minor plants, antioxidative enzyme activities including CAT, GR, SOD, APX, GPOD and SPOD were analyzed (Figure 3). No significant differences in enzyme activities were found in plants exposed to the lowest dose rate at 0.084 ± 0.004 mGy·h−1. At the next tested dose rate 0.97 ± 0.06 mGy·h−1, enzyme activities of CAT and APX were significantly enhanced, which remained status quo at the next tested dose rate. At the highest dose rate tested, a significant increase in CAT, APX, GPOD and SPOD activities in comparison to non-treated plants was observed. At the dose rate of 97 ± 8 mGy·h−1, an approximately twofold increase in activity was evidenced for CAT, while enhancement in activity was less pronounced for the other enzymes. GR and SOD were the only enzymes exhibiting no alterations in activity with increasing dose rate.
Concentrations of oxidized and reduced forms of ASC and GSH were determined to study their redox status (Figure 4). No significant shift in redox status was observed at any dose rate intensity for ASC. In contrast, an increase in GSH content was observed at the highest tested dose rate of 97 ± 8 mGy·h−1. At this dose rate, the total GSH concentration attained a level of 121± 1 nmol·g−1 FW while control plants exhibited a GSH concentration of 96 ± 8 nmol·g−1 FW.
Figure 3. Enzyme activities of (A) catalase (CAT); (B) ascorbate peroxidase (APX); (C) glutathione reductase (GR); (D) guaiacol type peroxidase (GPOD); (E) syringaldizine peroxidase (SPOD); and (F) superoxide dismutase (SOD) in L. minor exposed to different dose rates levels of β-radation for seven days. Each data point represents the mean ± SE of three biological replicas. Different capital letters indicate significant differences between treated plants and control plants (p < 0.05, one-way ANOVA).
Ijms 16 15309 g003
Figure 4. Metabolite concentrations of (a) ascorbate (ASC) and (b) glutathione (GSH) in L. minor exposed to different dose rates levels of β-radation for seven days. Concentration levels of reduced and oxidized forms of the metabolites are shown in light and dark grey bars, respectively. Each data point represents the mean ± SE of three biological replicas. Different capital letters indicate significant differences between treated plants and control plants (p < 0.05, one-way ANOVA).
Ijms 16 15309 g004

3. Discussion

3.1. 90Sr Accumulation and Uptake

The present study aimed at evaluating β-radiation induced growth and oxidative stress responses in L. minor to a range of 90Sr exposure concentrations. Therefore, L. minor plants were exposed above the threshold level of 400 µGy·h−1 since dose rates under this level are considered not to induce detrimental effects to some individuals in aquatic organisms [35]. Exposure media were adjusted with low Ca concentrations to induce high 90Sr uptake in L. minor plants and subsequent high internal β-radiation exposure. The time course of 90Sr uptake showed that the 90Sr content of L. minor roots and fronds tended to saturate over time. The 90Sr uptake reached a plateau after three days in both roots and shoots, indicating that 90Sr concentration in plants was in equilibrium with the 90Sr concentration of the growth medium. Similar results were obtained with Sr uptake in large-flowered waterweed and in hydroponically grown maize and sunflower where a steady state for 90Sr/Sr uptake between was obtained after three to five days [17,36,37]. The CRFW in present study were approximately 60 and 30 Bq·kg−1 FW/Bq·L−1 for fronds and roots, respectively. These are among the lower CRFW compared to other floating-leafed macrophophytes [38,39,40,41]. Phylogenetic studies suggest that monocotyls, like L. minor, have low capacity for Ca accumulation [11]. As it is generally presumed that Sr-ions are homologous to Ca ions and thus behave like Ca in organisms, low accumulation capacity of Sr is possibly linked with low Ca content in plants biomass.

3.2. Dosimetry

To obtain accurate dose rate estimates, L. minor was split in two functional units (fronds and roots) each having tissue-specific dose conversion coefficients. The calculated total dose ranged between 0.084 ± 0.004 mGy·h−1 up to 97 ± 8 mGy·h−1, of which the lowest dose rate was of the same order of magnitude as the IAEA threshold dose rate. After seven days of exposure, the second highest dose rate tested (9.4 ± 0.5 mGy·h−1) had a negative impact on root growth. According to the EDR values, the root related endpoints were about twenty times more sensitive compared to frond related endpoints. Highly sensitive stress responses on L. minor root growth were also observed in metal and pesticide toxicity. Following this, L. minor root growth/length has been suggested as an alternative bioassay for toxicity testing [42,43,44]. All endpoints, including frond biomass, frond number and frond area, showed a clear decrease at the highest tested dose rate (97 ± 8 mGy·h−1). From the available literature dealing with effect studies [45,46], no reports were found on 90Sr or β-radiation induced effects in aquatic plants, emphasizing a large data gap for aquatic plants [35,45]. However, daphnids exposed to a dose rate of 1.8 mGy·h−1 with 90Sr revealed a 36% reduction in life span, while another study with daphnids using 90Sr, showed a decrease of 26% in fertility rate after exposure to 0.8 mGy·h−1 [45,47]. These dose rates at which growth effects on these aquatic invertebrates were observed are comparable to the dose rates at which L. minor root growth was affected. Since β-particles are proposed to have an RBE factor of 1 (or 3 for low-energy β-radiation), it is generally accepted that radiological effects caused by γ-radiation can also be adopted for making radiation comparisons. From a 14-year field experiment in the Canadian Boreal forest, it has been found that the most sensitive of plant species studied, pine trees, died within 2–3 years when exposed to a dose rate of 5–10 mGy·h−1 and within two weeks at an estimated dose rate of 250–300 mGy·h−1 for pine trees close to the damaged reactor in Chernobyl [48,49]. In the present study, EDR50 values ranged between 250 and 500 mGy·h−1 for L. minor fronds, suggesting that L. minor is more radioresistant than pine trees. Garnier-Laplace, et al. [50] established a species sensitivity distribution curve for terrestrial plants chronically exposed to γ-radiation under laboratory and field conditions and derived EDR10 values on population related endpoints. Considering the most sensitive EDR10 endpoint obtained in this study (1.0 ± 0.5 mGy·h−1 for root dry weight), approximately 50% of the selected organisms from the SSD curve were more radioresistant in comparison to L. minor.

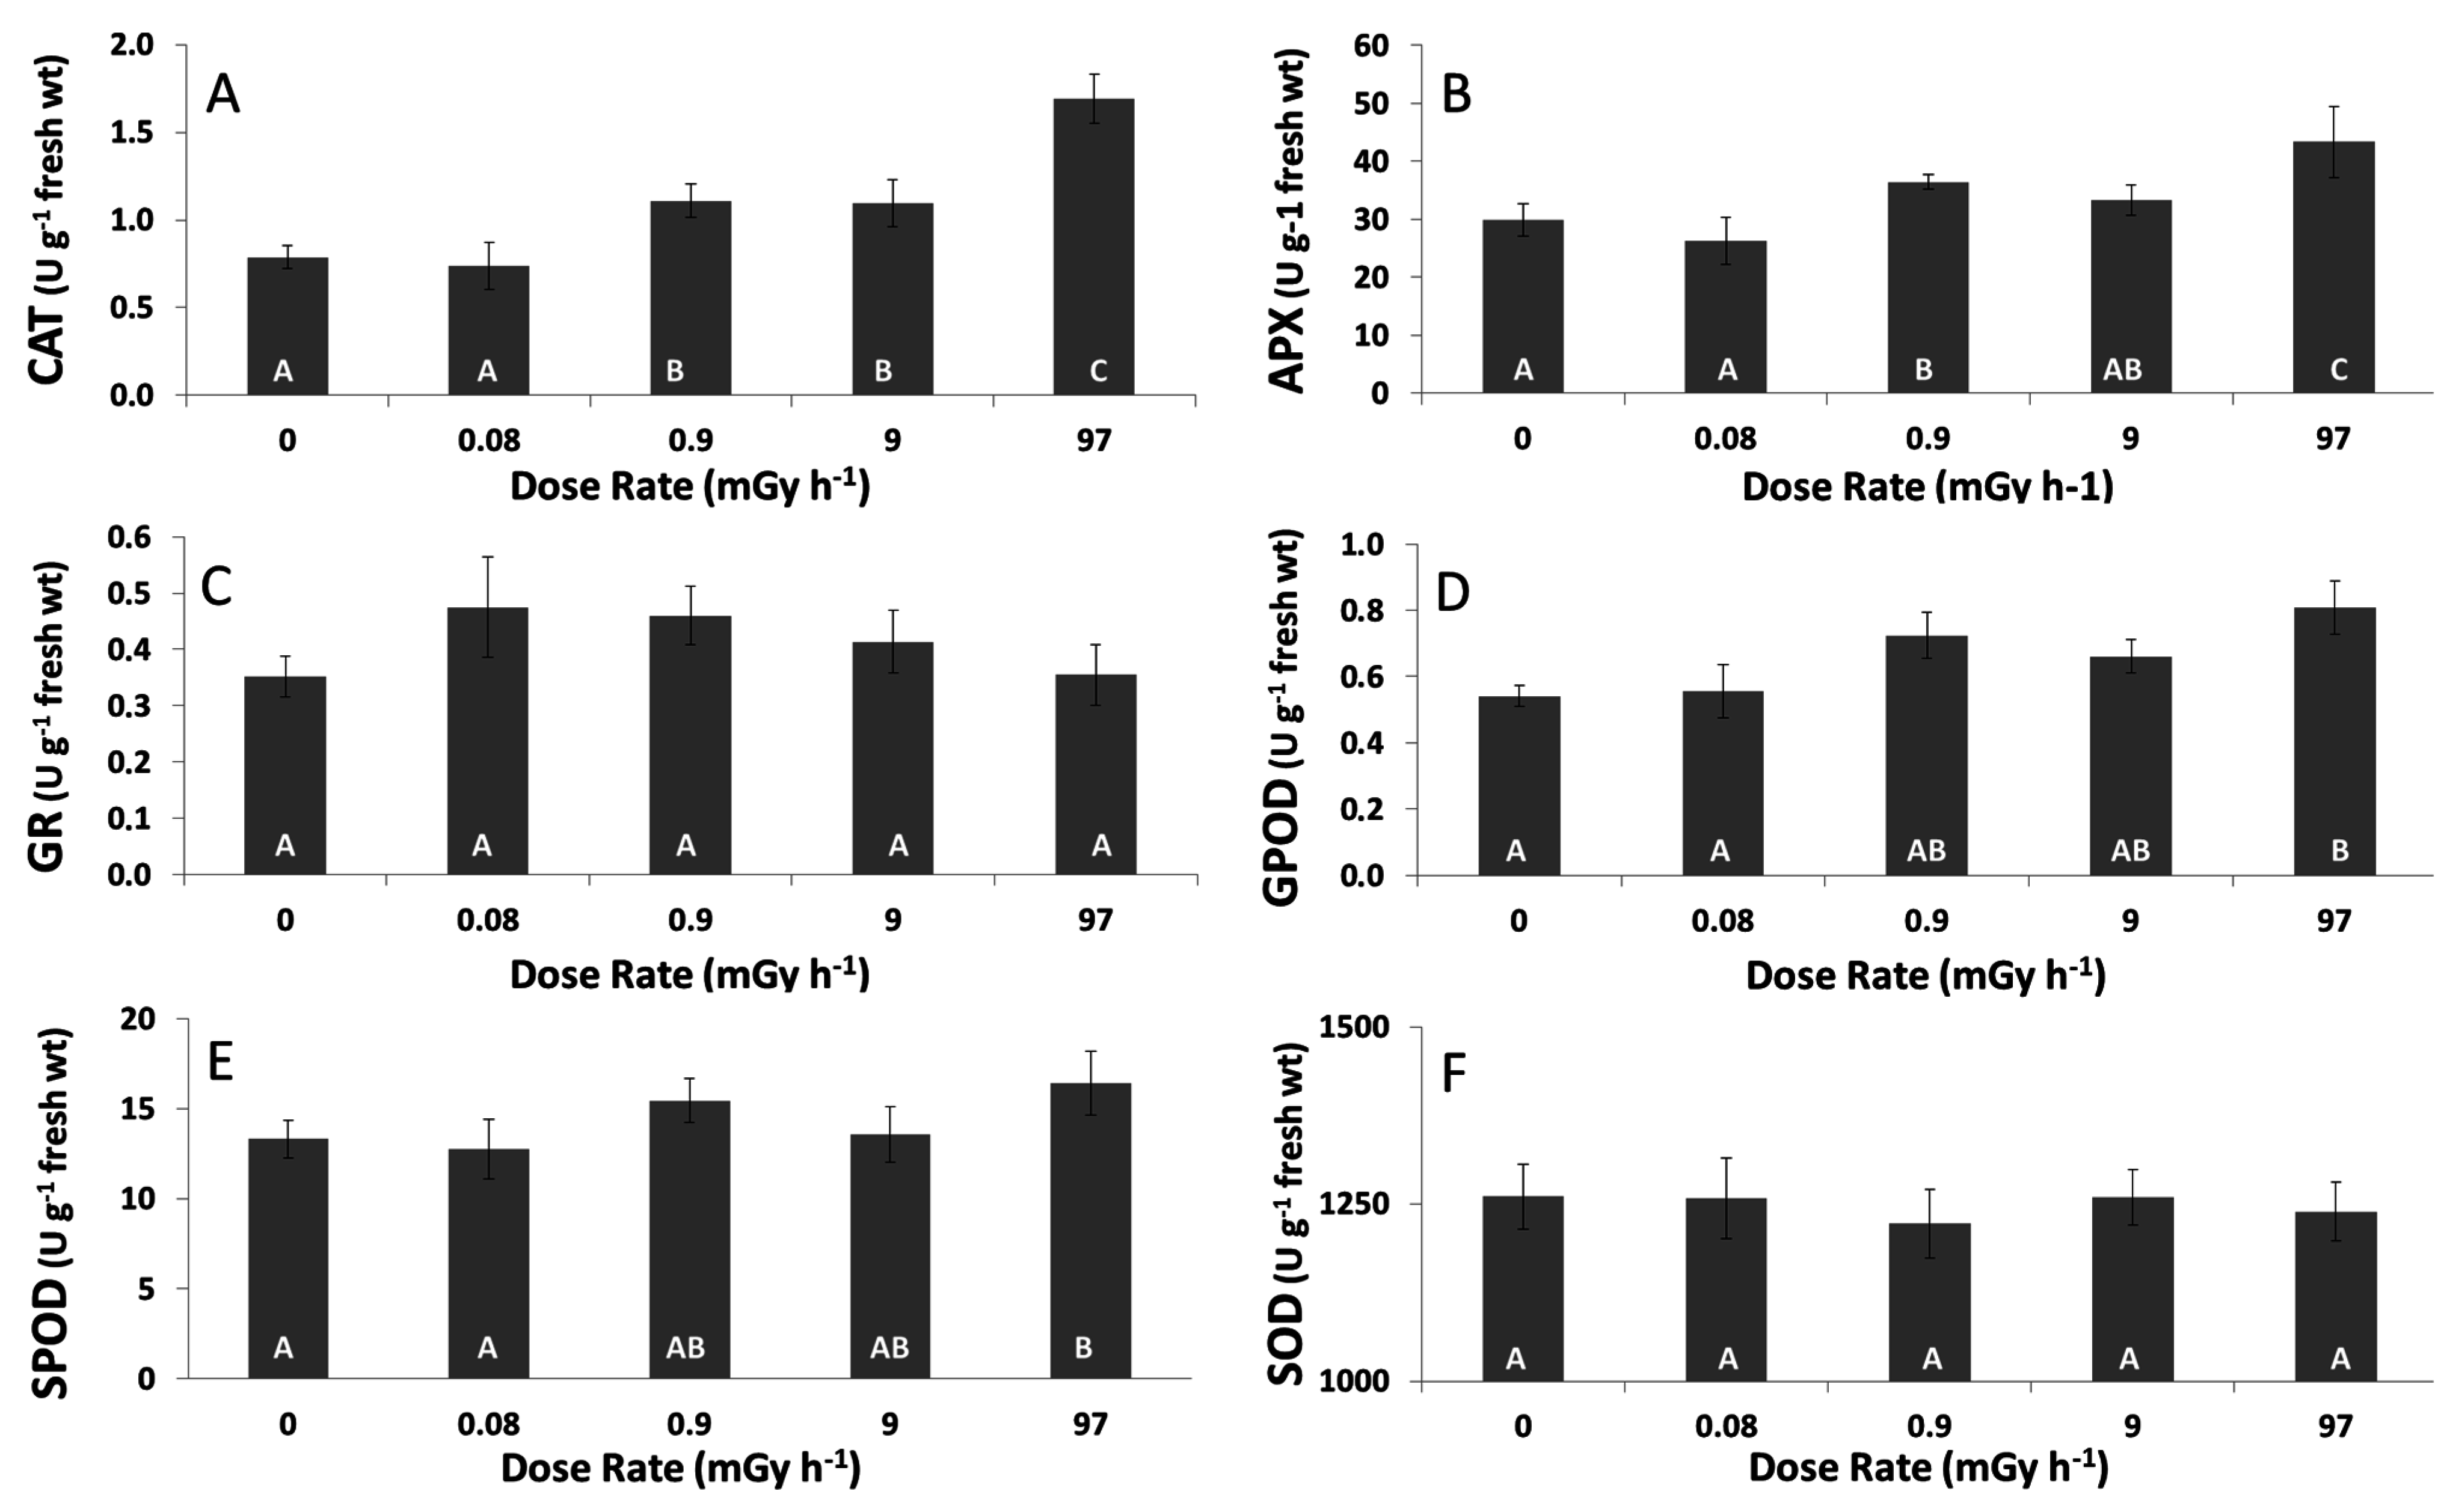
3.3. Antioxidative Response

Oxidative stress related genes are among the most represented genes in responding to radiation in Arabidopsis plants [51,52]. Therefore, to gain more insights in the antioxidative stress response of L. minor plants following β-radiation exposure, some features of the ROS scavenging biosynthetic pathways involving both enzymatic and non-enzymatic processes were studied. There were minor changes in total ASC content or redox status, although an enhanced activity of APX was found. Increased APX activity with a stable ASC content was also found in other duckweed studies under chemical stress [53]. Under severe oxidative stress conditions, an enhanced APX activity is typically associated with a decrease in reduced ASC content to remove H2O2 from the cytosol and chloroplasts [54]. Similar, at the highest dose rate tested, the increase in APX activity followed by slight decrease in reduced ASC levels observed points to an increased oxidative stress under these severe radiation conditions.
The concentration of the other antioxidant studied, GSH, significantly increased at the highest tested dose rate of 97 mGy·h−1. An increased GSH content was also found in other plants tissues suffering from oxidative stress to compensate ascorbate oxidation [55,56,57]. The fact that redox status of GSH remained virtually unchanged could explain the unaltered GR activity since this enzyme is responsible for maintaining the GSSG/GSH ratio constant [22]. Also in acutely γ-irradiated red pepper plants (0–10 Gy), no changes were reported in GR activity upon increasing radiation dose [58]. However, the higher level of GSH and indications that ASA redox starts to decline at 97 ± 8 mGy·h−1 corroborate the hypothesis that L. minor plants have difficulty in controlling the production of ROS under high radiation stress. In addition to APX, also CAT increased at levels below the EDR10 value. Increased CAT activity is supposed to be an adaptive trait helping to reduce toxic levels of H2O2 in peroxisomes [54]. Sensitive responses on CAT activity were also reported for S. capillata exposed to 65 µGy·h−1 with γ-radiation. L. minor plants exposed to radiofrequency radiation and in A. thaliana where increased expression levels of CAT1 and CAT3 genes were observed at 50 mGy·h−1 [25,59,60]. Therefore, it does seem that plants rely on CAT as their first defense to counter radiation-mediated ROS production. On the contrary, SODs are regarded as the first line of defense against ROS under several abiotic stressors, but according to our findings, β-radiation did not induce any alterations in SOD enzyme activity [22,54]. For acutely γ-irradiated red pepper, a weak enhancement in SOD activity was found from 2 Gy, while SOD activity in chronically irradiated Stipa capillata (65 µGy·h−1) did not show any response [58,60]. Also, GPOD, GR, and SPOD were not or only slightly affected at the highest dose rate, which might indicate that a β-irradiation treatment of 97 ± 8 mGy·h−1 for seven days. However, since growth was clearly hampered at the highest dose rate, available energy supplies might be used for other metabolic pathways to neutralize β-radiation stress in L. minor plants.

4. Experimental Section

4.1. Culture Stock

Lemna minor cv. Blarney plants were obtained from Dr. M. Jansen (University College Cork, Cork, Ireland) and cultured aseptically in 250 mL glass Erlenmeyer flasks containing half-strength Hütner medium [34] under continuous light (Osram 400 W HQI-BT daylight, OSRAM GmbH, Augsburg, Germany, 80–100 µmol·m−2·s−1) at 24 °C. Plants were sub-cultured every 10–12 days by transferring three plants to 100 mL of fresh growth medium. To obtain sufficient and homogenous plant population, 1 week before the experiment a preculture was initiated with five mature plants per pot (3–4 fronds) in 100 mL of fresh medium.

4.2. 90Sr Exposure

For the 90Sr treatment, 3 healthy duckweed plants were chosen randomly and transferred to 250 mL PC containers (VWR) containing 25 mL experiment nutrient solution. For the 90Sr uptake experiments, modified K-medium (0.4 mM Ca and (in mg·L−1) 889 KNO3, 95 Ca(NO3)2·4H2O, 500 MgSO4·7H2O, 9 Na-EDTA, 3 tartaric acid, 1.86 H3BO3, 0.22 ZnSO4·7H2O, 0.12 Na2MoO4·2H2O, 0.08 CuSO4·5H2O, 3.62 MnCl2·4H2O, 5.4 FeCl3·6H2O with lower KH2PO4 concentrations (0.5 mg·L−1) [61]) was used containing an activity concentration of 10 kBq·L−1 90Sr, added as SrCl2 (3.7 MBq stock solution, IDB Belgium) for 6 biological replicates. For the 90Sr effect experiments, a modified Steinberg medium (0.2 mM Ca and (in mg·L−1) 350 KNO3, 50 Ca(NO3)2·4H2O, 0.09 KH2PO4, 100 MgSO4·7H2O, 1.5 Na-EDTA, 0.12 H3BO3, 0.18 ZnSO4·7H2O, 0.044 Na2MoO4·2H2O, 0.18 MnCl2·4H2O, 0.76 FeCl3·6H2O [62]) was used having activity concentrations of 25, 250, 2500 and 25,000 kBq·L−1 90Sr for 9 biological replicates. Since L. minor plants exposed in Steinberg medium had the highest Sr90 uptake, and hence highest dose rate, this medium was selected for all effect experiments. The growth of the plants did not differ between both exposure media. The chemical concentration of Sr at the highest tested activity level amounted to 54 nM. Plants were exposed in a growth chamber in sterile environment under continuous light (80 to 100 µmol/s m2) at 24 °C during 90Sr treatment. Plants were harvested after 7 days of exposure by washing in 1 mM Pb(NO3)2 and twice in distilled water for 10 min in order to discriminate 90Sr accumulation from 90Sr adsorption on root and frond surface. A significant difference was found between plants washed with Pb-solution compared to non-washed or washed with distilled water (p < 0.05, data not shown). On the other hand, it was confirmed that there was no significant difference in washing the L. minor plants with a solution containing an excess of Pb (1 mM) with plants washed in a high Ca-solution (10 mM. data not shown). Fresh weight was determined by weighing all collected plant material from all individual pots after quickly dry patting with clean tissue. For the 90Sr effect experiments, plants from 3 pots were further dried for 2 days at 60 °C (humidity < 5%) for dry weight determination and Sr uptake measurement. Plants from the remaining 6 pots were, after fresh weight determination, snap frozen in liquid nitrogen for storage at −80 °C for biochemical analysis.

4.3. 90Sr Transfer and Dosimetry

All collected plant material from 3 individual pots was dry-ashed in a muffle furnace, and subsequently digested in 0.1 M HCl. For 90Sr uptake experiments, all 6 individual pots were used. Digested samples were then diluted 10-fold in dH2O, vortexed and diluted again 4-fold in scintillation cocktail (Optiphase Hisafe 3, PerkinElmer). Samples (5 mL) were taken from each pot at the end of the experiment and brought to 20 mL with the same scintillation cocktail. After careful mixing of sample and scintillation fluid, the 90Sr activity was measured for 60 min by β-liquid scintillation counting (Packard 1600TR Tri-Carb, Canberra, Zellik, Belgium). The counting efficiency was determined using a dilution series of 90Sr with known activities. No difference was found between concentrations in samples from growth medium before and after the experimental period indicating that 90Sr was dissolved during the exposure period (data not shown). Concentration Ratios (CR) are expressed as the ratio of 90Sr activity in the plant organ (root and frond) (in Bq·kg−1) and the external solution 90Sr content (expressed in Bq·L−1). Concentration ratios were calculated on a organ fresh weight (CRFW) and organ dry weight (CRDW) basis. CRs were calculated for roots and fronds.
Dosimetry of radionuclides in species with small sizes requires special attention for accurate dose rate calculations since the range of high-energy β-radiation in biological matter exceeds the geometrical size of species. Therefore, L. minor plants were split in two functional units for dose calculations. The internal and external dose conversion coefficients (DCC, in µGy·h−1 per Bq·kg−1·FW) were calculated by the ERICA tool for root and shoot separately [39]. The estimated dimensions of fronds and roots necessary for use in ERICA tool were determined by picture analyses using the ImageJ open source software (version 1.43) [63]. An average control L. minor plant had the following dimensions: 0.25 mm thick, 3 mm wide and 3.5 mm deep for frond and the average root length determined at 90 mm long with a diameter of 0.15 mm. Within the Tier 2 assessment, DCCs can be calculated for any organism by entering the required radionuclide and the organism’s dimensions (the mass and the three axes that define the ellipsoid used as its simplified representation). The geometries for both organs were separately entered in the software and the DCCs obtained were in agreement with the DCCs obtained from Biermans et al. [19]. The obtained internal DCCs were 9.33 × 10⁻⁵ and 8.82 × 10⁻⁵ µGy·h−1/Bq·kg−1·FW for frond and root, respectively, and external DCCs were 5.58 × 10⁻⁴ and 5.63 × 10⁻⁴ µGy·h−1/Bq·kg−1·FW.
Since at the start of the experiment, no 90Sr is taken up yet by the plants, a time dependent dose rate approach was designed with the following assumptions: (i) The uptake ratio of 90Sr for both frond and root were given by their CRFW, which reached equilibrium phase at harvest time; (ii) The rate of uptake for all tested activity concentrations followed the same equation as obtained by the time course illustrated by Figure 1. Subsequently, the dose rate for fronds and roots (µGy·h−1) is given by Equations (1) and (2), respectively:
[ d o s e   r a t e f r o n d = 1 t 0 t D t o t a l   f r o n d ( t ) d t = A C m   ×   D C C i n t   f r o n d   ×   0 t   CR FW   m a x   f r o n d ( 1 e β t )   d t + ( A C m × D C C e x t   f r o n d ) / 2   ]
[ d o s e   r a t e r o o t = 1 t 0 t D t o t a l   r o o t ( t ) d t = A C m   ×   D C C i n t   r o o t   × 0 t   CR FW   m a x   r o o t ( 1 e β t )   d t   + A C m   × D C C e x t   r o o t   ]
where Dtotal is the total dose (µGy), ACm is the activity concentration measured in medium (Bq·L−1), DCCint organ and DCCext organ are the internal and external dose conversion coefficients, respectively, for root or frond, unweighted for radiation quality (µGy·h−1/Bq·kg−1·FW), CRmax organ is the organ specific CRFW at equilibrium phase (Bq·kg−1·FW/Bq·L−1). β is the slope of the fit from the 7-day uptake experiment given by Figure 1 and t is the time of the exposure experiment which is set at 7 days. The DCCext frond was divided by two since L. minor floats on water surface and therefore, only half of the fronds are surrounded by contaminated liquid medium. The total dose rate of the whole plant was calculated as the cumulative dose rate from frond and root separately, including organ-sized correction factors. The correction factors were the average fresh weight ratios for fronds and roots for each dose rate condition; (iii) Since L. minor exhibits an exponential growth with an average reproduction rate of 0.45 ± 0.02 fronds per day [64,65], the present experiment exposes approximately three generations of L. minor plants during this seven days treatment, meaning that not all plants were equally exposed with respect to exposure time. However, since the offspring of contaminated organisms are also subjected to equal dose rates, this dynamic approach considers the total population of L. minor as one organism with a treatment time of seven days, as in accordance with the OECD guidelines for the evaluation of chemical toxicants; (iv) 90Sr radionuclides were distributed homogeneously in both organs. However, since the morphologic dimensions of fronds and roots of L. minor fall within the range of the path length of a β-particle, this effect can be considered as negligible in this dosimetric approach.

4.4. Plant Growth

Growth parameters, in terms of relative frond number, relative frond area and fresh weight were analyzed according to OECD guidelines [33]. Images for determination of average specific growth rate and average specific frond area were taken at Day 0 and 7, and analyzed with ImageJ open source software (version 1.43) [63]. Fresh weight and dry weight for fronds and roots was determined as explained above. The average specific growth rate for the considered endpoint was calculated according to the OECD guidelines 221 [33]. Percentage growth inhibition was subsequently calculated for each test concentration; the average doubling time for frond number in non-irradiated controls was 1.74 ± 0.02, achieving the validity criterion of the experiment of ≤2.5 days as stated by the OECD guidelines. The pH in all test solutions remained constant at pH 5.5 ± 0.5. There were 9 replicates for each 90Sr treatment condition and control.

4.5. Antioxidative Enzyme Activities

Frozen plant tissue (50–80 mg·FW) was homogenized under frozen conditions with liquid nitrogen using two tungsten carbide beads (Qiagen, Venlo, The Netherlands) of 3-mm diameter in a Retsch Mixer Mill MM400 at 30 Hz for 3 min after a spatula of insoluble polyvinylpyrrolidone (PVP) was added. Hereafter, 400 µL ice-cold 0.1 M Tris-HCl buffer (pH 7.8) containing 1 mM EDTA and 1 mM dithiothreitol was added to the frozen homogenized tissue, the mixture was vortexed and subsequently centrifuged at 20,000× g at 4 °C for 10 min. The supernatant was kept on ice and used freshly for determination of enzyme capacities. All measurements were performed at room temperature (20–22 °C) based on spectrophotometric assays, as previously described [66]. Briefly, The capacity of CAT was analyzed by adding 10 μL of supernatants with 190 μL of a 49 mM H2O2 solution. The absorbance at 240 nm was monitored kinetically. To determine the GPX capacity, 150 μL 0.1 M phosphate buffer, 10 μL sample extract and 40 μL guajacol mastermix, consisting of 90 mM guaiacol and 163 mM H2O2 mixed on a 1:1 ratio were added in each well of a plastic 96-well plate. Subsequently, the appearance of tetraguajacol was monitored kinetically at 436 nm. SPX capacity was assessed in 96-well UV-plates. In each well, 155 μL 0.1 TRIS (pH 7.5), 20 μL 98 mM H2O2, 20 μL plant extract and 5 μL syringaldazine (SAZ) were added. The appearance of oxidized SAZ was monitored kinetically at 530 nm. For the determination of the GR capacity, 165 μL TRIS-EDTA buffer (0.1 M TRIS; 1 mM Na2-EDTA) (pH 8), 7 μL GR mastermix (1:1 mix of 82 mM GSSG and 6 mM NADPH) and 28 μL were added in each well of a 96-well UV-plate. The decrease of NADPH, used for the reduction of GSSG, was followed kinetically at 340 nm. The APX capacity was determined in UV-cuvettes using the Ultrospec 2000 UV/VIS Spectrophotometer (Pharmacia Biotech, Diegem, Belgium). In each cuvette, 665 μL HEPES-EDTA (0.1 M HEPES; 1 mM EDTA) buffer, 100 μL 30 mM Na-ascorbate, 35 μL 196 mM H2O2 and 200 μL sample extract were added. Subsequently, the appearance of dehydroascorbate (DHA) was measured spectrophotometrically at 298 nm. The activity of SOD was measured on the Ultrospec 2000 UV/VIS Spectrophotometer (Pharmacia Biotech) in plastic cuvettes. In each cuvette, 580 μL KH2PO4 buffer (pH 7.8), 100 μL 1 mM EDTA, 100 μL 0.5 mM xanthine, 100 μL 0.1 mM cytochrome C, 100 μL extract and 20 μL xanthine oxidase was added. The extent of cytochrome C reduction (measured at 550 nm) was compared to this in a blank, not containing any sample extract. Then, the relative inhibition of cytochrome C reduction by the sample extract was calculated as a measure of SOD capacity. At least 3 biological replicas were analyzed in triplicate (technical replicates). Statistical analysis was performed on the measured data before expressing them relative to controls.

4.6. Metabolite Measurements

Oxidized and reduced forms of ascorbate and glutathione were measured spectrophotometrically using a plate-reader assay, as described by [67]. Frozen plant tissue (50–80 mg·FW) was homogenized under frozen conditions using two tungsten carbide beads (Qiagen) of 3-mm diameter in a Retsch Mixer Mill MM400 at 30 Hz for 3 min in 600 μL of 200 mM HCl. After centrifugation (15 min, 13,000 rpm, 4 °C), 30 μL 200 mM NaH2PO4 (pH 5.6) was added to 300 μL of the supernatant. Subsequently, the pH of all samples was adjusted to 4.5 using 200 mM NaOH. For the measurement of total AsA, samples were incubated with 25 μM DTT and 120 mM NaH2PO4 (pH 7.5) for 15 min at 20 °C to fully reduce the AsA pool. Subsequently, the pH of the samples was adjusted to pH 5.5, the optimal pH for ascorbate oxidase, using 200 mM HCl. Further, all measurements were performed as described by Queval and Noctor [54]. Oxidized AsA and reduced GSH were calculated as the difference between total and reduced AsA and total and oxidized GSH, respectively. Furthermore, all measurements were performed as described by Queval and Noctor [67]. At least 3 biological replicas were analzed in triplicate (technical replicates). Statistical analysis was performed on the measured data before expressing them relative to controls.

4.7. Statistical Analysis

All data have been presented as mean values ± standard error (SE). Statistical analysis was performed with the open-source software package R (R i386 2.15.5; R Foundation for Statistical Computing, Vienna, Austria). Normal distribution was tested with a Shapiro–Wilk test, Barlett’s test was used to test for homoscedasticity. To identify any statistical differences between treatments, a one-way ANOVA was performed. When significant differences (p-value < 0.05) were found, a Tukey post hoc test was applied to further discriminate between significantly different groups. Student’s unpaired two-tailed t-test was used for single comparisons. The dose response curves were modeled using the three parameter log-logistic drm equation from the drc package available in the software package R (p-value < 0.05) [68]. Maximal growth reduction was fixed to 100% and the slope and EDR50 parameters were −0.99 and 238 for frond area, −1.02 and 391 for frond number, −0.96 and 509 for frond fresh weight, −0.92 and 732 for frond fresh weight, −0.67 and 39 for root fresh weight and −0.5 and 51 for root dry weight in the equation model.

5. Conclusions

In conclusion, our data demonstrated for the first time that β-radiation provokes a negative growth in L. minor plants. Submerged roots of L. minor plants were more radiosensitive to β-radiation compared to the floating fronds. All considered growth related endpoints showed a negative growth at the highest tested dose rate, although only a mild stimulation of the antioxidative defense system was observed. L. minor plants relied mainly on catalase to counteract the ROS generation following β-radiation, although some compounds of the ASC-GSH cycle were also activated, as they possessed higher levels of GSH at the highest tested dose rate level. The regulation of these antioxidative enzymes at the transcriptional level might be crucial in further examinations to support the observed biochemical changes.

Acknowledgments

The authors thank the Research foundation-Flanders (FWO) (G.A040.11N) and the European Commission Contract Fission-2010-3.5.1-269672 Strategy for Allied Radioecology (www.star-radioecology.org) for financial support of this work. Belgian nuclear research institute (SCK•CEN) is further thanked for funding the PhD of A. Van Hoeck.

Author Contributions

Arne Van Hoeck designed the study, performed the experiments, analyzed the data and wrote the manuscript. May Van Hees and Robin Nauts participated in the experiments. Nele Horemans designed the study and together with Hildegarde Vandenhove critically revised the manuscript. All contributors read and approved the final manuscript.

Conflicts of Interest

The authors declare no conflict of interest.

References

  1. Bradley, E.S. Radionuclides in biota. In Environmental Contaminants in Biota; CRC Press: Boca Raton, FL, USA, 2011; pp. 703–732. [Google Scholar]
  2. Roussel-Debet, S.; Beaugelin, K. Strontium 90 et Environnement; IRSN: Paris, France, 2005. [Google Scholar]
  3. Buesseler, K.O.; Livingston, H.D. Natural and man-made radionuclides in the black sea. In Adionuclides in the Oceans, Inputs and Inventories; Guéguéniat, P., Germain, P., Métivier, H., Eds.; Institut de Protection et de Surete Nucleaire: Cherbourg, France, 1996; pp. 199–217. [Google Scholar]
  4. Yu, W.; He, J.; Lin, W.; Li, Y.; Men, W.; Wang, F.; Huang, J. Distribution and risk assessment of radionuclides released by fukushima nuclear accident at the northwest pacific. J. Environ. Radioact. 2015, 142C, 54–61. [Google Scholar] [CrossRef] [PubMed]
  5. Smith, J.T.; Comans, R.N.; Beresford, N.A.; Wright, S.M.; Howard, B.J.; Camplin, W.C. Chernobyl’s legacy in food and water. Nature 2000, 405, 141. [Google Scholar] [CrossRef] [PubMed] [Green Version]
  6. Mirzoyeva, N.Y.; Egorov, V.N.; Polikarpov, G.G. Distribution and migration of (9)(0)sr in components of the dnieper river basin and the black sea ecosystems after the chernobyl npp accident. J. Environ. Radioact. 2013, 125, 27–35. [Google Scholar] [CrossRef] [PubMed]
  7. Penrose, B.; Beresford, N.A.; Broadley, M.R.; Crout, N.M.J. Inter-varietal variation in caesium and strontium uptake by plants: A meta-analysis. J. Environ. Radioact. 2015, 139, 103–117. [Google Scholar] [CrossRef] [PubMed]
  8. Scotti, I.A.; Carini, F. Heavy metal effect on uptake and translocation of 134cs and 85sr in aubergine plants. J. Environ. Radioact. 2000, 48, 183–190. [Google Scholar] [CrossRef]
  9. Baeza, A.; Paniagua, J.M.; Rufo, M.; Sterling, A.; Barandica, J. Radiocaesium and radiostrontium uptake by turnips and broad beans via leaf and root absorption. Appl. Radiat. Isot. 1999, 50, 467–474. [Google Scholar] [CrossRef]
  10. Kozhevnikova, A.D.; Seregin, I.V.; Bystrova, E.I.; Belyaeva, A.I.; Kataeva, M.N.; Ivanov, V.B. The effects of lead, nickel, and strontium nitrates on cell division and elongation in maize roots. Russ. J. Plant Physiol. 2009, 56, 242–250. [Google Scholar] [CrossRef]
  11. Broadley, M.R.; White, P.J. Some elements are more equal than others: Soil-to-plant transfer of radiocaesium and radiostrontium, revisited. Plant Soil 2012, 355, 23–27. [Google Scholar] [CrossRef]
  12. Camps, M.; Rigol, A.; Vidal, M.; Rauret, G. Assessment of the suitability of soil amendments to reduce cs-137 and sr-90 root uptake in meadows. Environ. Sci. Technol. 2003, 37, 2820–2828. [Google Scholar] [CrossRef] [PubMed]
  13. Dan, W.; Fangping, W.; Changhe, X.; Yunlai, T.; Xuegang, L. The uptake of cs and sr from soil to radish (raphanus sativus l.)-potential for phytoextraction and remediation of contaminated soils. J. Environ. Radioact. 2012, 110, 78–83. [Google Scholar]
  14. Willey, N.; Fawcett, K. A phylogenetic effect on strontium concentrations in angiosperms. Environ. Exp. Bot. 2006, 57, 258–269. [Google Scholar] [CrossRef]
  15. Chen, M.; Tang, Y.L.; Ao, J.; Wang, D. Effects of strontium on photosynthetic characteristics of oilseed rape seedlings. Russ. J. Plant Physiol. 2012, 59, 772–780. [Google Scholar] [CrossRef]
  16. Kanter, U.; Hauser, A.; Michalke, B.; Draxl, S.; Schaffner, A.R. Caesium and strontium accumulation in shoots of arabidopsis thaliana: Genetic and physiological aspects. J. Exp. Bot. 2010, 61, 3995–4009. [Google Scholar] [CrossRef] [PubMed]
  17. Moyen, C.; Roblin, G. Uptake and translocation of strontium in hydroponically grown maize plants, and subsequent effects on tissue ion content, growth and chlorophyll a/b ratio: Comparison with ca effects. Environ. Exp. Bot. 2010, 68, 247–257. [Google Scholar] [CrossRef]
  18. Copplestone, D.; Brown, J.E.; Beresford, N.A. Considerations for the integration of human and wildlife radiological assessments. J. Radiol. Prot. 2010, 30, 283–297. [Google Scholar] [CrossRef] [PubMed]
  19. Biermans, G.; Horemans, N.; Vanhoudt, N.; Vandenhove, H.; Saenen, E.; van Hees, M.; Wannijn, J.; Vives i Batlle, J.; Cuypers, A. An organ-based approach to dose calculation in the assessment of dose-dependent biological effects of ionising radiation in arabidopsis thaliana. J. Environ. Radioact. 2014, 133, 24–30. [Google Scholar] [CrossRef] [PubMed]
  20. Hunter, N.; Muirhead, C.R. Review of relative biological effectiveness dependence on linear energy transfer for low-let radiations. J. Radiol. Prot. 2009, 29, 5–21. [Google Scholar] [CrossRef] [PubMed]
  21. Hwang, J.E.; Hwang, S.-G.; Kim, S.-H.; Lee, K.J.; Jang, C.S.; Kim, J.-B.; Kim, S.H.; Ha, B.-K.; Ahn, J.-W.; Kang, S.-Y.; et al. Transcriptome profiling in response to different types of ionizing radiation and identification of multiple radio marker genes in rice. Physiol. Plant. 2014, 150, 604–619. [Google Scholar] [CrossRef] [PubMed]
  22. Apel, K.; Hirt, H. Reactive oxygen species: Metabolism, oxidative stress, and signal transduction. Annu. Rev. Plant Biol. 2004, 55, 373–399. [Google Scholar] [CrossRef] [PubMed]
  23. Gill, S.S.; Tuteja, N. Reactive oxygen species and antioxidant machinery in abiotic stress tolerance in crop plants. Plant Physiol. Biochem. 2010, 48, 909–930. [Google Scholar] [CrossRef] [PubMed]
  24. Horemans, N.; Foyer, C.H.; Potters, G.; Asard, H. Ascorbate function and associated transport systems in plants. Plant Physiol. Biochem. 2000, 38, 531–540. [Google Scholar] [CrossRef]
  25. Tkalec, M.; Malaric, K.; Pevalek-Kozlina, B. Exposure to radiofrequency radiation induces oxidative stress in duckweed lemna minor l. Sci. Total Environ. 2007, 388, 78–89. [Google Scholar] [CrossRef] [PubMed]
  26. De Micco, V.; Arena, C.; Pignalosa, D.; Durante, M. Effects of sparsely and densely ionizing radiation on plants. Radiat. Environ. Biophys. 2011, 50, 1–19. [Google Scholar] [CrossRef] [PubMed]
  27. White, P.J.; Broadley, M.R. Calcium in plants. Ann. Bot. 2003, 92, 487–511. [Google Scholar] [CrossRef] [PubMed]
  28. Guillaume, T.; Chawla, F.; Steinmann, P.; Gobat, J.M.; Froidevaux, P. Disparity in sr-90 and cs-137 uptake in alpine plants: Phylogenetic effect and ca and k availability. Plant Soil 2012, 355, 29–39. [Google Scholar] [CrossRef]
  29. Zeller, S.; Feller, U. Long-distance transport of alkali metals in maturing wheat. Biol. Plant. 2000, 43, 523–528. [Google Scholar] [CrossRef]
  30. White, P.J. The pathways of calcium movement to the xylem. J. Exp. Bot. 2001, 52, 891–899. [Google Scholar] [CrossRef] [PubMed]
  31. Mazen, A.M.A.; Zhang, D.Z.; Franceschi, V.R. Calcium oxalate formation in lemna minor: Physiological and ultrastructural aspects of high capacity calcium sequestration. New Phytol. 2004, 161, 435–448. [Google Scholar] [CrossRef]
  32. Franceschi, V.R. Calcium-oxalate formation is a rapid and reversible process in lemna-minor-l. Protoplasma 1989, 148, 130–137. [Google Scholar] [CrossRef]
  33. OECD. Lemna sp. Growth Inhibition Test; Guideline 221; Organisation for Economic Co-operation and Development: Paris, France, 2006. [Google Scholar]
  34. Brain, R.A.; Solomon, K.R. A protocol for conducting 7-day daily renewal tests with lemna gibba. Nat. Protoc. 2007, 2, 979–987. [Google Scholar] [CrossRef] [PubMed]
  35. UNSCEAR. Effects of Ionizing Radiation United Nations Scientific Committee on the Effects of Atomic Radiation: Unscear 2008 Report to the General Assembly, with Scientific Annexes; United Nations: New York, NY, USA, 2011. [Google Scholar]
  36. Anamika, S.; Eapen, S.; Fulekar, M.H. Phytoremediation technology for remediation of radiostrontium (90sr) and radiocesium (137cs) by catharanthus roseus (L.) G. Don in aquatic environment. Environ. Eng. Manag. J. 2009, 8, 527–532. [Google Scholar]
  37. Soudek, P.; Valenová, Š.; Vavříková, Z.; Vaněk, T. 137cs and 90sr uptake by sunflower cultivated under hydroponic conditions. J. Environ. Radioact. 2006, 88, 236–250. [Google Scholar] [CrossRef] [PubMed]
  38. IAEA. Handbook of Parameter Values for the Prediction of Radionuclide Transfer in Terrestrial and Freshwater Environments; Technical Reports Series No. 472; IAEA: Vienna, Austria, 2010. [Google Scholar]
  39. Brown, J.E.; Alfonso, B.; Avila, R.; Beresford, N.A.; Copplestone, D.; Prohl, G.; Ulanovsky, A. The erica tool. J. Environ. Radioact. 2008, 99, 1371–1383. [Google Scholar] [CrossRef] [PubMed] [Green Version]
  40. Vadzis, D.R.; Leinerte, M.P.; Seisuma, Z.K.; Sloka, Y.Y. Strontium and Calcium in Natural Freshwater Ecosystemsl; Riga Zinatne: Latvia, 1979. [Google Scholar]
  41. Yankovich, T.L.; Vives i Batlle, J.; Vives-Lynch, S.; Beresford, N.A.; Barnett, C.L.; Beaugelin-Seiller, K.; Brown, J.E.; Cheng, J.J.; Copplestone, D.; Heling, R.; et al. An international model validation exercise on radionuclide transfer and doses to freshwater biota. J. Radiol. Prot. 2010, 30, 299–340. [Google Scholar] [CrossRef] [PubMed]
  42. Park, A.; Kim, Y.J.; Choi, E.M.; Brown, M.T.; Han, T. A novel bioassay using root re-growth in lemna. Aquat. Toxicol. 2013, 140–141, 415–424. [Google Scholar] [CrossRef] [PubMed]
  43. Gopalapillai, Y.; Vigneault, B.; Hale, B.A. Root length of aquatic plant, lemna minor l., as an optimal toxicity endpoint for biomonitoring of mining effluents. Integr. Environ. Assess. Manag. 2014, 10, 493–497. [Google Scholar] [CrossRef] [PubMed]
  44. Arts, G.H.P.; Belgers, J.D.M.; Hoekzema, C.H.; Thissen, J. Sensitivity of submersed freshwater macrophytes and endpoints in laboratory toxicity tests. Environ. Pollut. 2008, 153, 199–206. [Google Scholar] [CrossRef] [PubMed]
  45. Copplestone, D.; Hingston, J.; Real, A. The development and purpose of the frederica radiation effects database. J. Environ. Radioact. 2008, 99, 1456–1463. [Google Scholar] [CrossRef] [PubMed]
  46. Garnier-Laplace, J.; Copplestone, D.; Gilbin, R.; Alonzo, F.; Ciffroy, P.; Gilek, M.; Aguero, A.; Bjork, M.; Oughton, D.H.; Jaworska, A.; et al. Issues and practices in the use of effects data from frederica in the erica integrated approach. J. Environ. Radioact. 2008, 99, 1474–1483. [Google Scholar] [CrossRef] [PubMed]
  47. Gudkov, D.I.; Mardarevich, M.G.; Kipnis, L.S.; Ponomaryov, A.V. Long-term combined impact of 90sr and pb2+ on freshwater cladoceran. In Protection of the Environment From Ionising Radiation. Proceedings of the Third International Symposium on the Protection of the Environment from Ionising Radiation (SPEIR 3), Darwin, Australia, 22–26 July 2002; Volume 34, pp. 43–49.
  48. Amiro, B.D. Response of boreal forest tree canopy cover to chronic gamma-irradiation. J. Environ. Radioact. 1994, 24, 181–197. [Google Scholar] [CrossRef]
  49. UNSCEAR. Sources and effects of ionizing radiation. In UNSCEAR 1996 Report to the General Assembly, with Scientific Annex; United Nations Scientific Committee on the Effects of Atomic Radiation: New York, NY, USA, 1996; p. 86. [Google Scholar]
  50. Garnier-Laplace, J.; Geras'kin, S.; Della-Vedova, C.; Beaugelin-Seiller, K.; Hinton, T.G.; Real, A.; Oudalova, A. Are radiosensitivity data derived from natural field conditions consistent with data from controlled exposures? A case study of chernobyl wildlife chronically exposed to low dose rates. J. Environ. Radioact. 2013, 121, 12–21. [Google Scholar] [CrossRef] [PubMed]
  51. Kovalchuk, I.; Molinier, J.; Yao, Y.L.; Arkhipov, A.; Kovalchuk, O. Transcriptome analysis reveals fundamental differences in plant response to acute and chronic exposure to ionizing radiation. Mutat. Res. Fundam. Mol. Mech. Mutagen. 2007, 624, 101–113. [Google Scholar] [CrossRef] [PubMed]
  52. Gicquel, M.; Taconnat, L.; Renou, J.P.; Esnault, M.A.; Cabello-Hurtado, F. Kinetic transcriptomic approach revealed metabolic pathways and genotoxic-related changes implied in the arabidopsis response to ionising radiations. Plant Sci. 2012, 195, 106–119. [Google Scholar] [CrossRef] [PubMed] [Green Version]
  53. Cheng, L.-J.; Cheng, T.-S. Oxidative effects and metabolic changes following exposure of greater duckweed (spirodela polyrhiza) to diethyl phthalate. Aquat. Toxicol. 2012, 109, 166–175. [Google Scholar] [CrossRef] [PubMed]
  54. Kim, H.-S.; Kim, Y.-S.; Hahn, K.-W.; Joung, H.; Jeon, J.-H. Chapter 2 reactive oxygen species: Regulation of plant growth and developmen. In Advances in Botanical Research; Jean-Pierre, J., Ed.; Academic Press: Waltham, MA, USA, 2009; Volume 52, pp. 25–46. [Google Scholar]
  55. Noctor, G.; Gomez, L.; Vanacker, H.; Foyer, C.H. Interactions between biosynthesis, compartmentation and transport in the control of glutathione homeostasis and signalling. J. Exp. Bot. 2002, 53, 1283–1304. [Google Scholar] [CrossRef] [PubMed]
  56. Nimptsch, J.; Pflugmacher, S. Ammonia triggers the promotion of oxidative stress in the aquatic macrophyte myriophyllum mattogrossense. Chemosphere 2007, 66, 708–714. [Google Scholar] [CrossRef] [PubMed]
  57. Wang, C.; Zhang, S.H.; Wang, P.F.; Hou, J.; Li, W.; Zhang, W.J. Metabolic adaptations to ammonia-induced oxidative stress in leaves of the submerged macrophyte vallisneria natans (lour.) hara. Aquat. Toxicol. 2008, 87, 88–98. [Google Scholar] [CrossRef] [PubMed]
  58. Kim, J.H.; Chung, B.Y.; Kim, J.S.; Wi, S.G. Effects of in planta gamma-irradiation on growth, photosynthesis, and antioxidative capacity of red pepper (capsicum annuum l.) plants. J. Plant Biol. 2005, 48, 47–56. [Google Scholar] [CrossRef]
  59. Vanhoudt, N.; Vandenhove, H.; Horemans, N.; Wannijn, J.; van Hees, M.; Vangronsveld, J.; Cuypers, A. The combined effect of uranium and gamma radiation on biological responses and oxidative stress induced in arabidopsis thaliana. J. Environ. Radioact. 2010, 101, 923–930. [Google Scholar] [CrossRef] [PubMed]
  60. Zaka, R.; Vandecasteele, C.M.; Misset, M.T. Effects of low chronic doses of ionizing radiation on antioxidant enzymes and g(6)pdh activities in stipa capillata (poaceae). J. Exp. Bot. 2002, 53, 1979–1987. [Google Scholar] [CrossRef] [PubMed]
  61. Cedergreen, N.; Abbaspoor, M.; Sorensen, H.; Streibig, J.C. Is mixture toxicity measured on a biomarker indicative of what happens on a population level? A study with lemna minor. Ecotoxicol. Environ. Saf. 2007, 67, 323–332. [Google Scholar] [CrossRef] [PubMed]
  62. Steinberg, R. Mineral requirement of lemna minor. Plant Physiol. 1946, 21, 42–48. [Google Scholar] [CrossRef] [PubMed]
  63. Abràmoff, M.D.; Magalhaes, P.J.; Ram, S.J. Image Processing Using Imagej. Biophotonics International; Laurin Publishing Co., Inc.: Pittsfield, MA, USA, 2004. [Google Scholar]
  64. Lemon, G.D.; Posluszny, U.; Husband, B.C. Potential and realized rates of vegetative reproduction in spirodela polyrhiza, lemna minor, and wolffia borealis. Aquat. Bot. 2001, 70, 79–87. [Google Scholar] [CrossRef]
  65. Ziegler, P.; Adelmann, K.; Zimmer, S.; Schmidt, C.; Appenroth, K.J. Relative in vitro growth rates of duckweeds (lemnaceae)—The most rapidly growing higher plants. Plant Biol. 2015, 17 (Suppl. 1), 33–41. [Google Scholar] [CrossRef] [PubMed]
  66. Horemans, N.; van Hees, M.; van Hoeck, A.; Saenen, E.; de Meutter, T.; Nauts, R.; Blust, R.; Vandenhove, H. Uranium and cadmium provoke different oxidative stress responses in lemna minor l. Plant Biol. 2015, 17 (Suppl. 1), 91–100. [Google Scholar] [CrossRef] [PubMed]
  67. Queval, G.; Noctor, G. A plate reader method for the measurement of nad, nadp, glutathione, and ascorbate in tissue extracts: Application to redox profiling during arabidopsis rosette development. Anal. Biochem. 2007, 363, 58–69. [Google Scholar] [CrossRef] [PubMed]
  68. Ritz, C.; Streibig, J.C. Bioassay analysis using r. J. Stat. Soft. 2005, 12, 1–22. [Google Scholar]

