Article

Microscale Diffusion Measurements and Simulation of a Scaffold with a Permeable Strut

1
Department of Mechanical System Engineering, Graduate School of Knowledge-Based Technology and Energy, Korea Polytechnic University, Jeongwang-dong, Siheung-si, Gyeonggi-do 429-793, Korea
2
Department of Mechanical Engineering, Korea Polytechnic University, Jeongwang-dong, Siheung-si, Gyeonggi-do 429-793, Korea
3
Department of Mechanical Engineering, Graduate School, Kookmin University, Jeongneung-ro 77, Seongbuk-gu, Seoul 136-702, Korea
4
School of Mechanical Systems Engineering, Kookmin University, Jeongneung-ro 77, Seongbuk-gu, Seoul 136-702, Korea
*
Author to whom correspondence should be addressed.
These authors contributed equally to this work.
Int. J. Mol. Sci. 2013, 14(10), 20157-20170; https://doi.org/10.3390/ijms141020157
Submission received: 16 July 2013 / Revised: 6 September 2013 / Accepted: 10 September 2013 / Published: 10 October 2013
(This article belongs to the Special Issue Frontiers of Micro-Spectroscopy in Biological Applications)

Abstract

:
Electrospun nanofibrous structures provide good performance to scaffolds in tissue engineering. We measured the local diffusion coefficients of 3-kDa FITC-dextran in line patterns of electrospun nanofibrous structures fabricated by the direct-write electrospinning (DWES) technique using the fluorescence recovery after photobleaching (FRAP) method. No significant differences were detected between DWES line patterns fabricated with polymer supplied at flow rates of 0.1 and 0.5 mL/h. The oxygen diffusion coefficients of samples were estimated to be ~92%–94% of the oxygen diffusion coefficient in water based on the measured diffusion coefficient of 3-kDa FITC-dextran. We also simulated cell growth and distribution within spatially patterned scaffolds with struts consisting of either oxygen-permeable or non-permeable material. The permeable strut scaffolds exhibited enhanced cell growth. Saturated depths at which cells could grow to confluence were 15% deeper for the permeable strut scaffolds than for the non-permeable strut scaffold.

1. Introduction

The goal of tissue engineering is tissue regeneration. Tissue-engineering scaffolds provide the three-dimensional (3D) space necessary for cells to grow into tissues and to then guide their development into specific shapes [1,2]. Various scaffold-fabrication methods are available, such as emulsion freeze-drying [3,4], foaming [5,6], salt leaching [7], rapid prototyping [811], and electrospinning [1214]. Various synthetic polymers, such as polystyrene (PS) [15], poly(lactic-co-glycolic acid) (PLGA) [9,10,16] and polycaprolactone (PCL) [911,16], as well as natural polymers, such as chitosan [1723] and silk [2426], have been used as scaffold materials.
Electrospun nanofibers have high surface-to-volume ratios and a structure similar to that of the extracellular matrices of the human body. Electrospinning techniques use a variety of materials, including natural materials such as collagen and alginate. These characteristics enable good performance in terms of cell adhesion; therefore, a number of recent studies have investigated electrospun scaffolds [1214]. However, difficulties related to structural control have been identified as a drawback of electrospinning. Therefore, most electrospinning products are two-dimensional (2D) sheets, unlike products fabricated using rapid prototyping. We recently reported a direct-write electrospinning (DWES) technique for patterning electrospun nanofibers [27]. Various patterns, such as lines, spirals, and meshes were successfully fabricated using this technique. The outward shape of the patterns resembles those fabricated using rapid prototyping, but each pattern is composed of tangled nanofibers with improved consistency in terms of geometry and morphology. Therefore, scaffolds fabricated using the DWES technique have the advantages of both electrospun nanofibers and rapid prototyping simultaneously.
The permeability of struts is another advantage of patterned electrospun scaffolds. The permeability of a “scaffold” is determined by the arrangement and volume fraction of struts, whereas the permeability of the “struts” is determined by the properties of the strut material. A scaffold with permeable struts is expected to improve mass transfer to the inner regions of the scaffold, especially when cells fill the spaces between the struts. Limited mass transfer into the scaffold interior is directly linked to necrosis of internally located cells, a phenomenon observed in most scaffolds developed to date. Necrosis typically occurs when oxygen cannot diffuse further into the interior of a scaffold where cells proliferate [28]. This problem must be resolved if millimeter-sized scaffolds are to be functionally significant.
However, studies of scaffolds have focused mainly on production and fabrication methods, whereas research on diffusion phenomena has received significantly less attention. Therefore, the current study used the fluorescence recovery after photobleaching (FRAP) method to examine microscale diffusion through patterns constructed by electrospinning [29]. Microscale diffusion through an alginate hydrogel was also examined for comparison. The diffusion coefficient of a 2D porous sheet is sometimes measured using donor and receiver chambers divided by the sheet [30]. However, this approach determines only the diffusion coefficient of the entire sheet, which depends on micro structural properties (volume fraction and arrangement of struts, total thickness, uniformity, etc.) and properties of strut constituent. The advantage of the FRAP method is that a small region can be assessed, which allows us to measure the diffusion coefficient in the line pattern which are only affected by nanoscale structure rather than the entire patterned mesh. We also simulated cell concentrations in the scaffold to predict the efficiency of a scaffold with permeable struts. The aim of this study was to evaluate and predict the advantages of a scaffold with permeable struts and provide guidelines for designing such a scaffold.

2. Results and Discussion

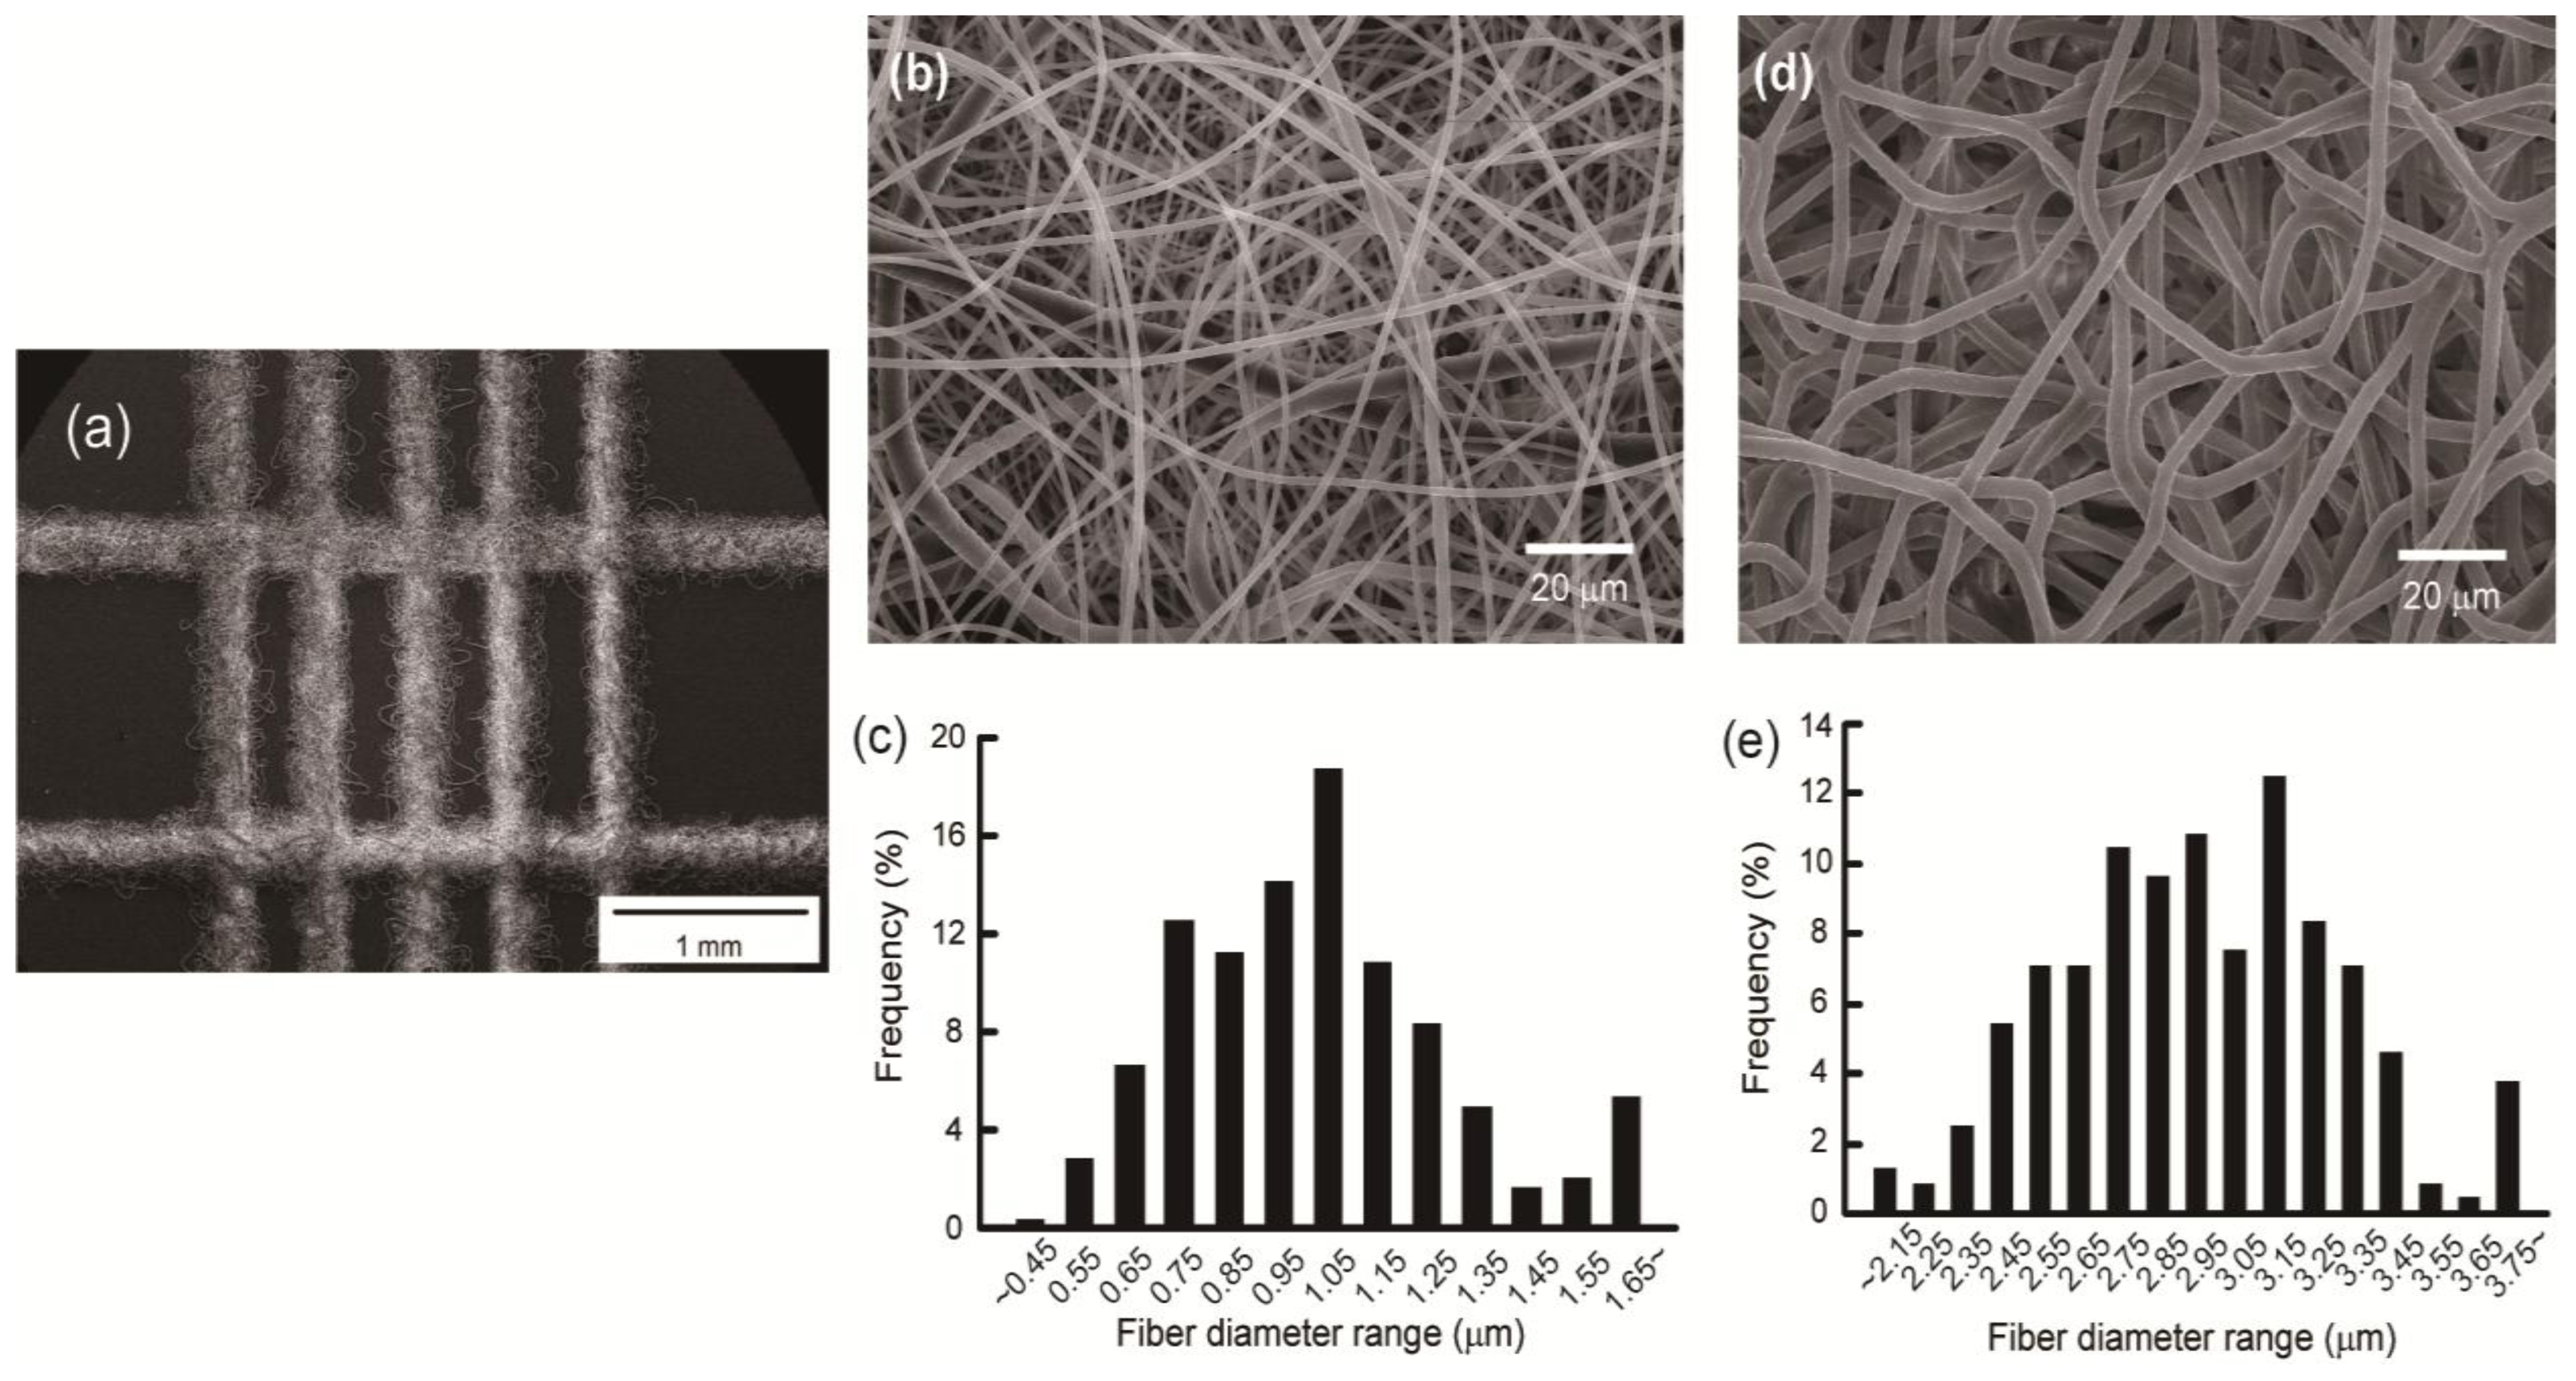
2.1. Fabrication of the Electrospun Nanofibrous Patterns

The ladder-patterned nanofibrous structure fabricated using DWES is shown in Figure 1a. A grid-shaped pattern was created using the DWES method, and each line of the pattern was formed by tangled nanofibers. Width and thickness of each line are 309.16 ± 33.56 μm and 78.15 ± 5.12 μm, respectively.
Figure 1b,d present scanning electron micrographs of the electrospun patterns and Figure 1c,e show the nanofiber diameter distribution. To examine differences in the structure of the pattern and diffusion within the electrospun samples according to solution flow rate (Qp), the scaffold samples were prepared with PCL at flow rates of 0.1 mL/h (Figure 1b,c) and 0.5 mL/h (Figure 1d,e). As shown in Figure 1b–e, the higher the flow rate, the thicker the nanofiber. The average radius and standard deviation of the nanofibers under each process condition were 2.923 ± 0.340 μm at Qp = 0.5 mL/h and 1.007 ± 0.381 μm at Qp = 0.1 mL/h.

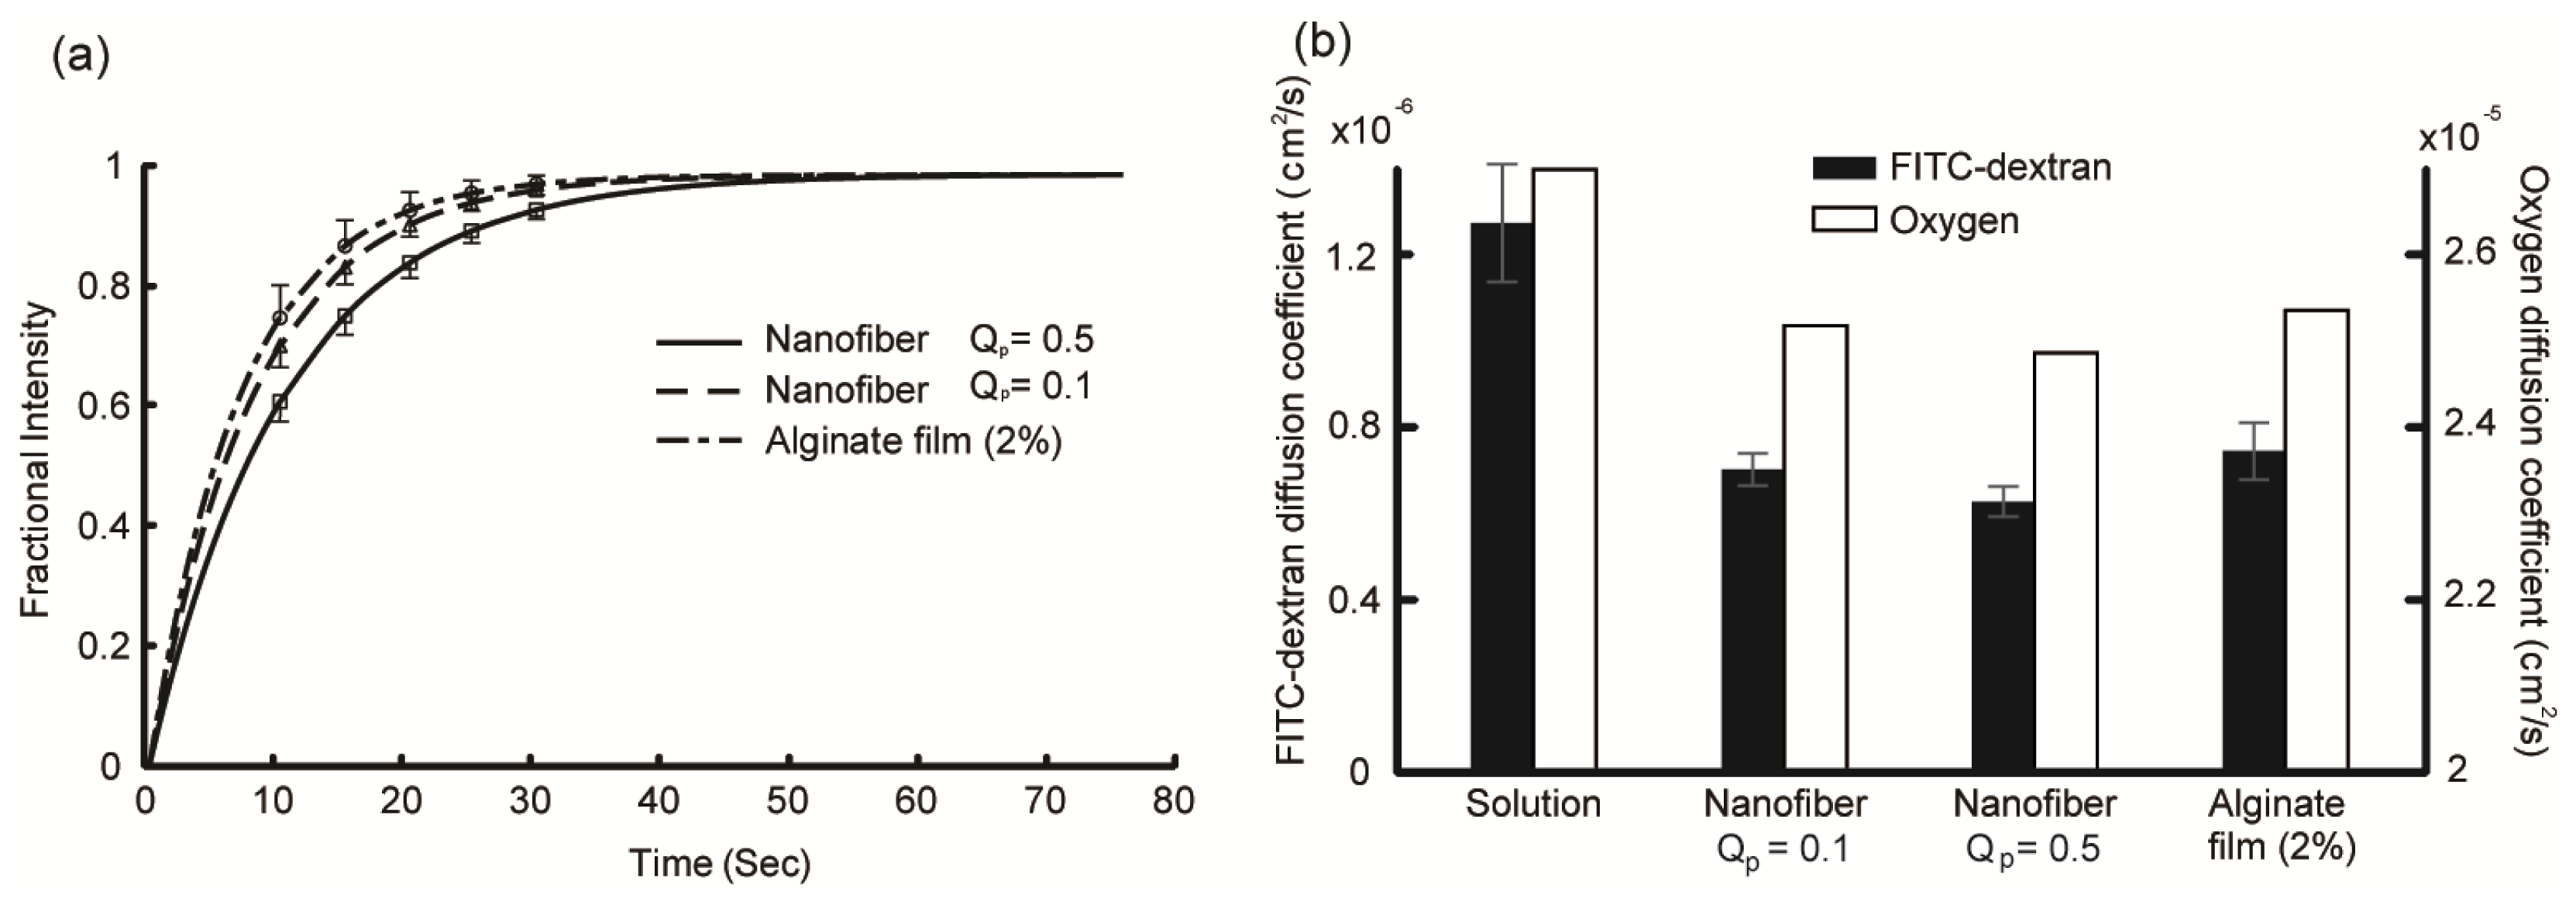
2.2. Diffusion Coefficient Measurements Using FRAP

Figure 2a shows the recovery curves of 3-kDa FITC-dextran for the Qp = 0.1 and Qp = 0.5 line patterns and 2% calcium alginate hydrogel. Five to seven curves obtained from three to five samples were averaged for each curve. The position of the bleaching spot was changed each time to obtain a single recovery curve. As shown in Figure 2a, the recovery rates of the Qp = 0.1 mL/h sample and 2% calcium alginate hydrogel were slightly faster than that of the Qp = 0.5 mL/h sample. However, the differences were not statistically significant (p > 0.05). The diffusion coefficient was calculated from the recovery curve using Equation (1) [31],
D = 0.224 × ω 2 t 1 / 2
where t1/2 is the half-time of recovery and ω is the radius of the bleaching spot. The calculated diffusion coefficients of 3-kDa FITC-dextran in the electrospun line patterns and alginate hydrogel are shown as solid black bars in Figure 2b. The diffusion coefficient in water was also measured and is shown for reference. The measured diffusion coefficient of 3-kDa FITC-dextran in water (1.28 × 10⁻⁶ cm2/s) was reasonably consistent with other reports (1.48 × 10⁻⁶ cm2/s for 4-kDa FITC-dextran [32] and 0.75 × 10⁻⁶ cm2/s for 9.4-kDa FITC-dextran [33]).
The oxygen diffusion coefficient was roughly estimated from the diffusion coefficient of 3-kDa FITC-dextran using Equation (2) [29,34],
D D 0 = exp ( - φ v r s r f )
where D0 is the diffusion coefficient of a test molecule in water, D is the diffusion coefficient of a test molecule in the sample, φv is the volume fraction of fiber in the sample, rs is the radius of the test molecule, and rf is the radius of the fiber. This equation describes the effect of barriers formed by randomly distributed long molecular fibers on the diffusion of a molecule [34]. In this equation, - v / r f is a property of the sample and can be calculated using the measured diffusion coefficients of 3-kDa FITC-dextran for each sample. The radius of the 3-kDa FITC-dextran molecule is 1.2 nm [35] and that of oxygen is 0.14 nm [36]. The oxygen diffusion coefficient in 37 °C water is 2.68 × 10⁻⁵ cm2/s [37]. The white bars in Figure 2b indicate the oxygen diffusion coefficient of each sample. The oxygen diffusion coefficient was estimated to be ~92%–94% of that in water for each sample. Equation (2) can overestimate the diffusion coefficient for small molecule [38]; however, the estimated oxygen diffusion coefficient in the alginate hydrogel (2.52 × 10⁻⁵ cm2/s) is in good agreement with that reported previously (2.54 × 10⁻⁵ cm2/s at 30 °C [39]).

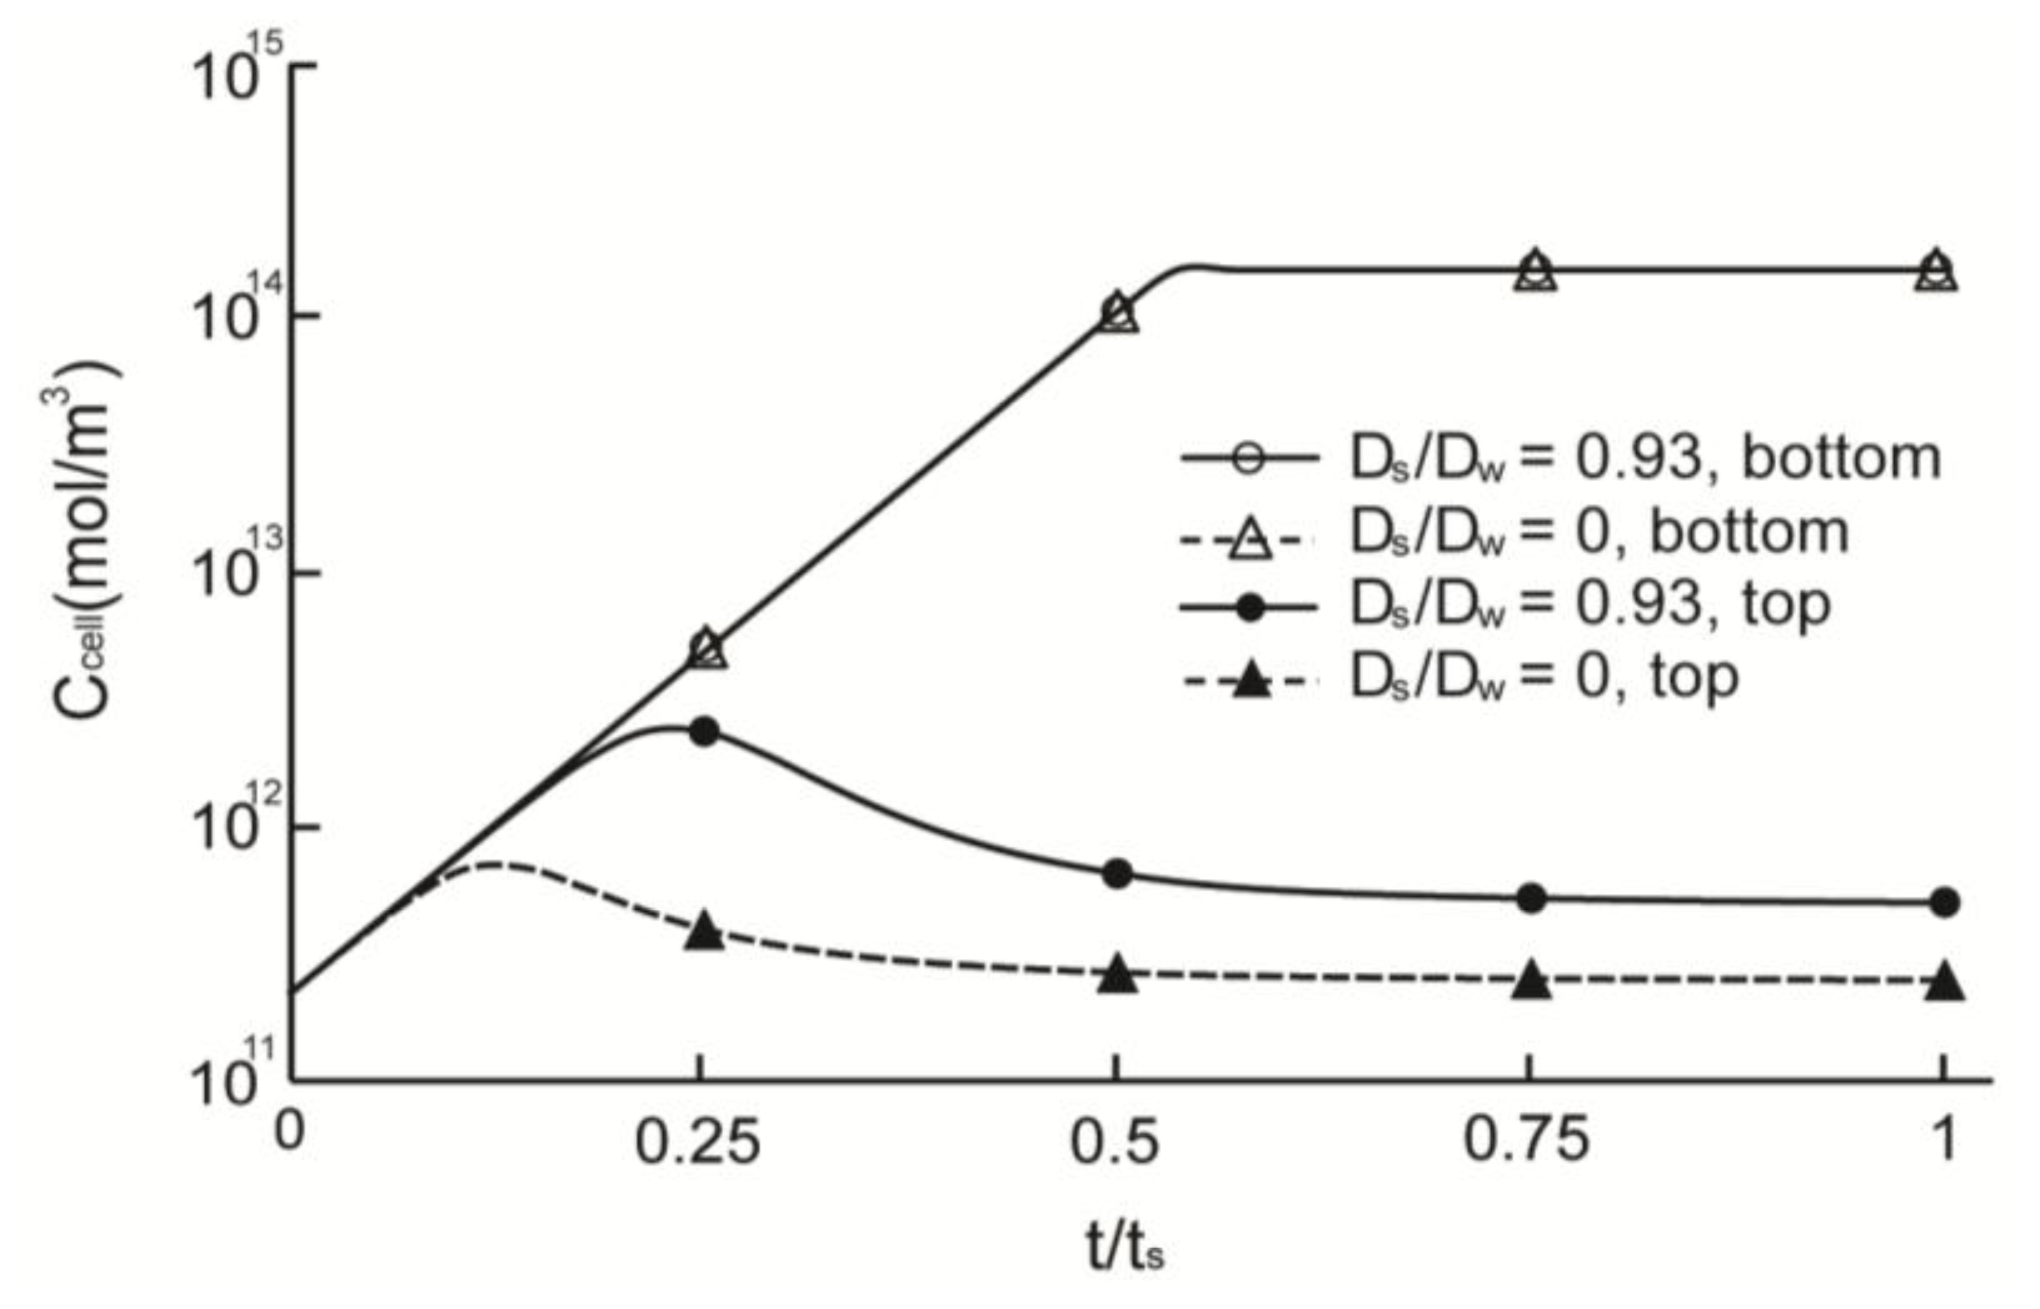
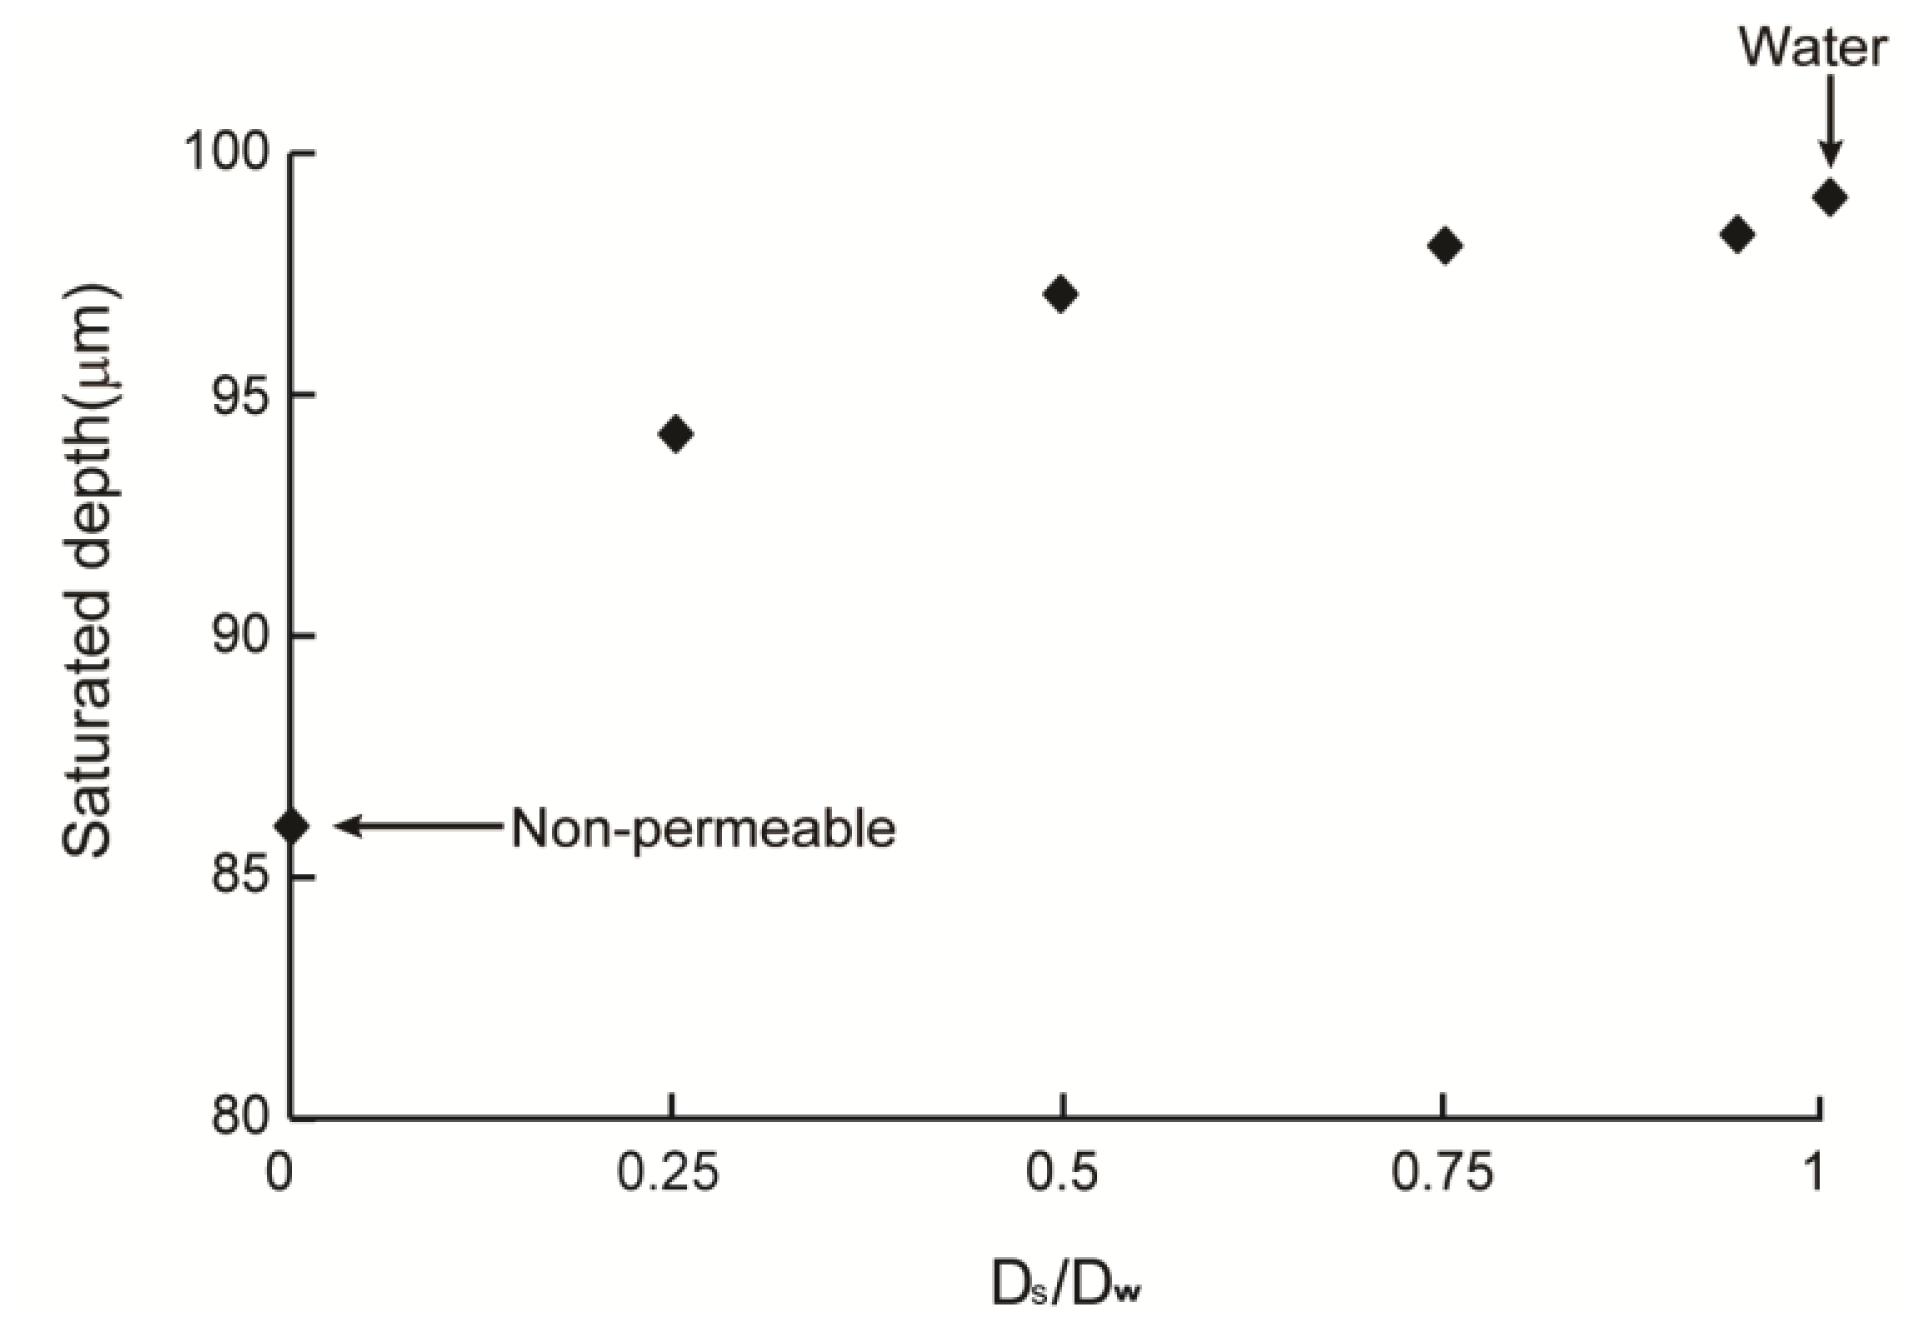
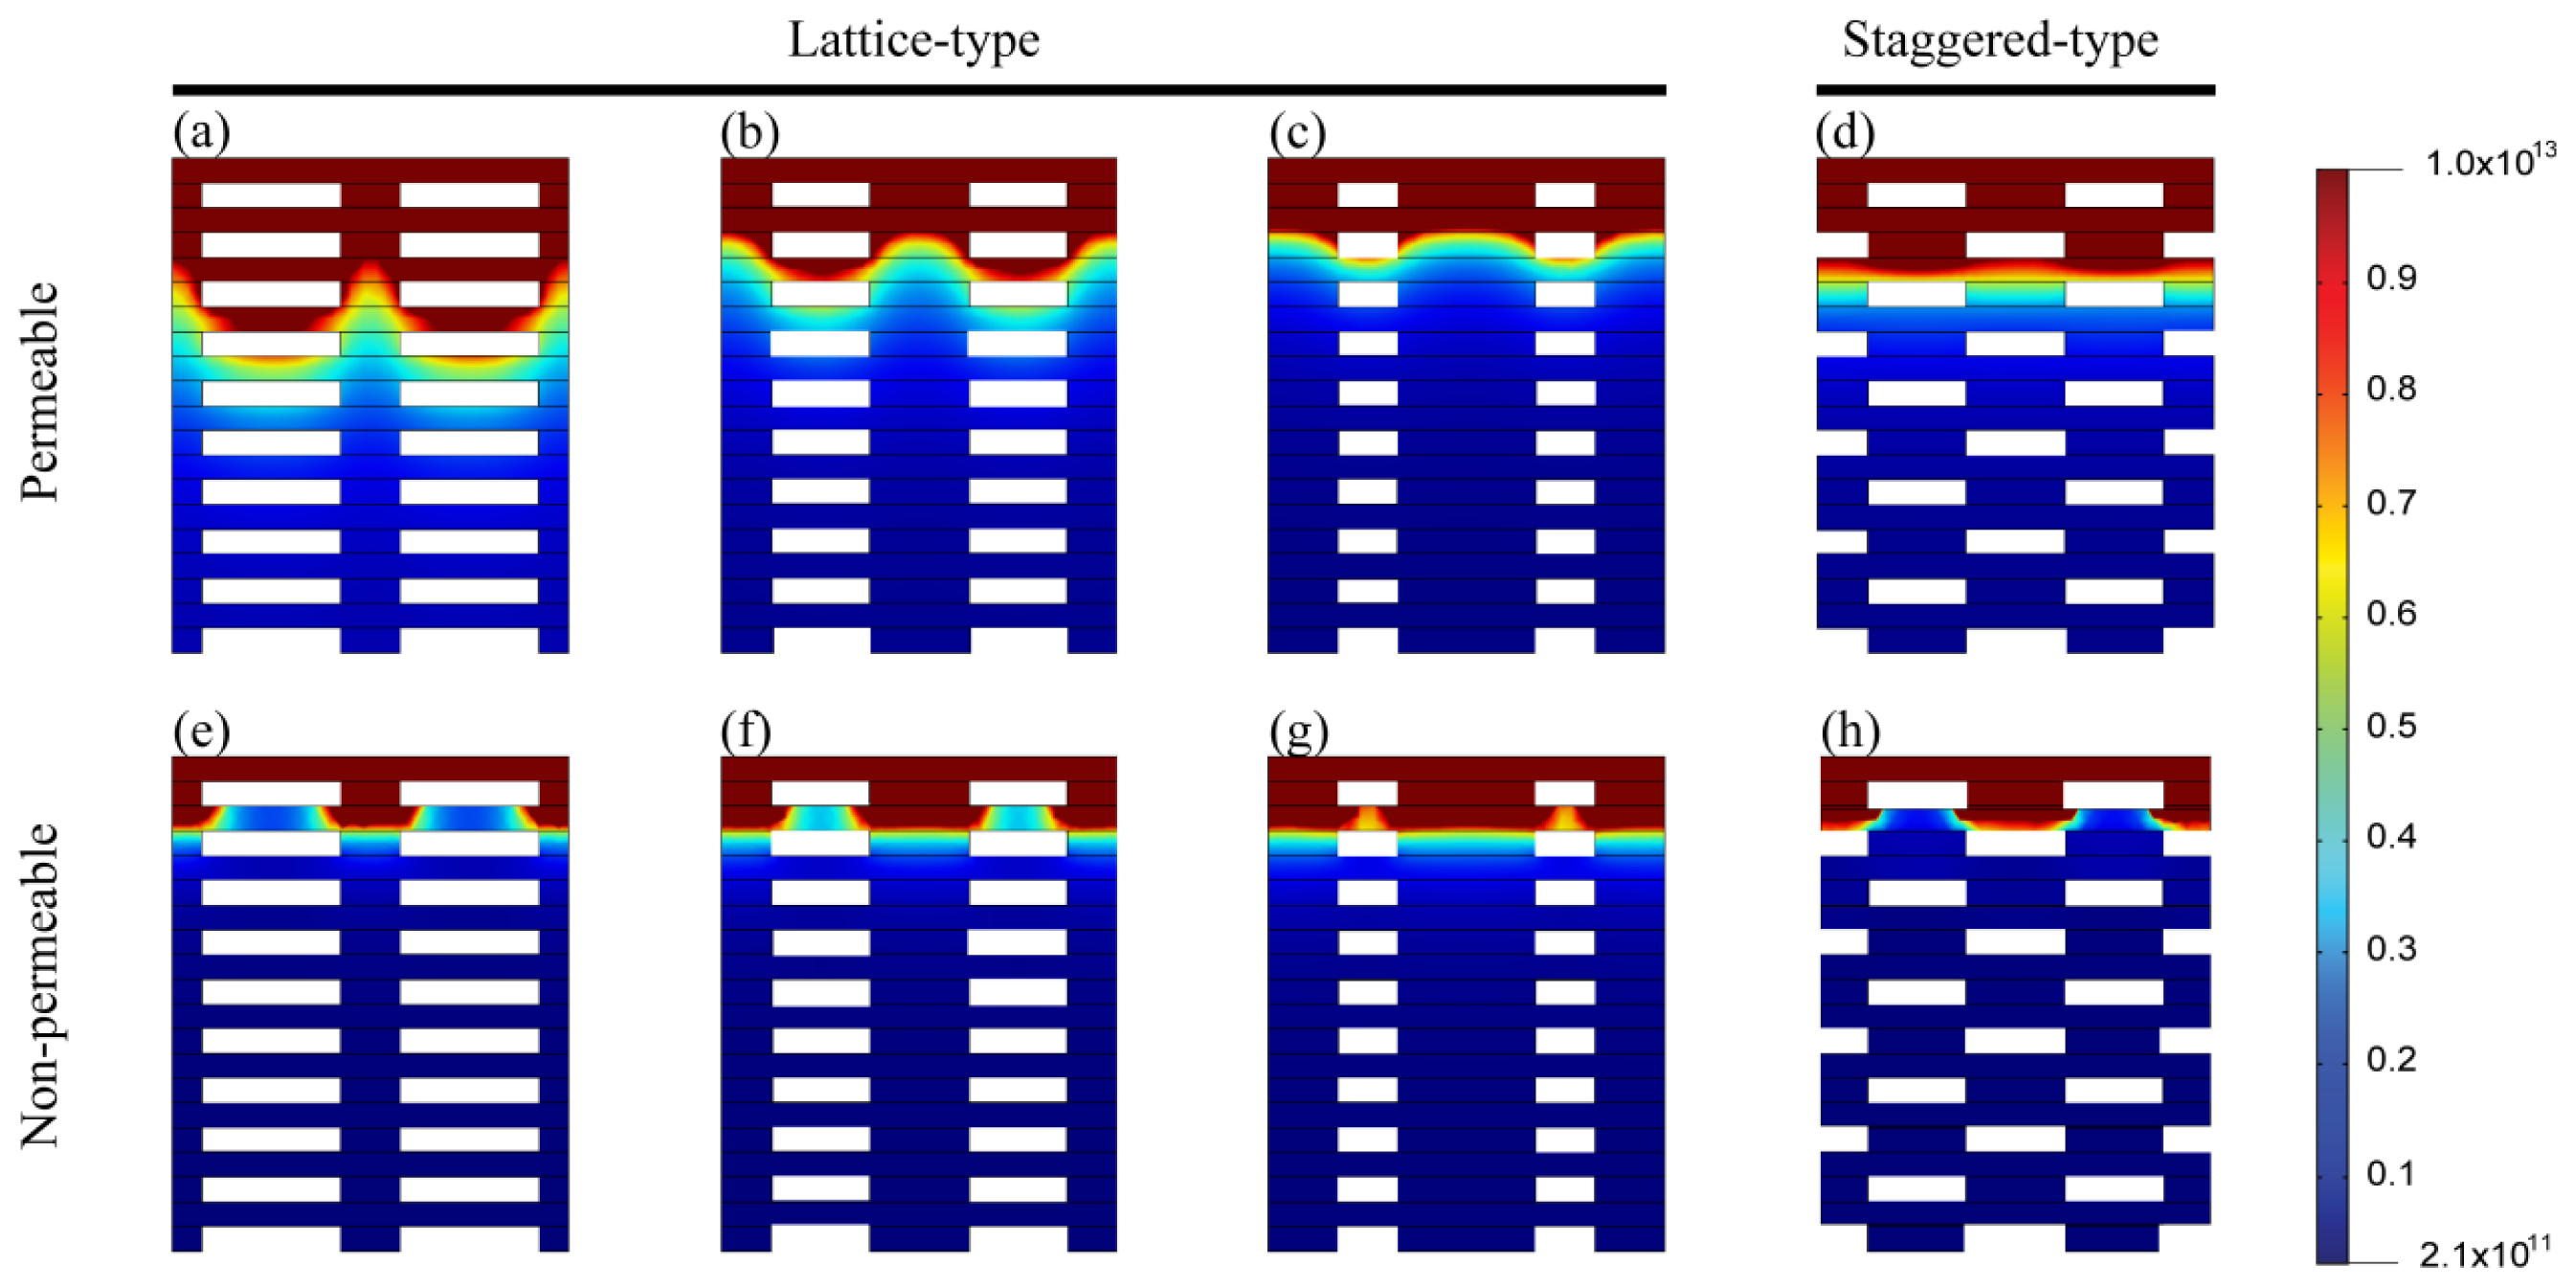
2.3. Cell Density Distribution Simulated within the Spatially Patterned Scaffold

Figure 3 illustrates the simulation results of cell concentrations in scaffolds with permeable (Ds/Dw = 0.93) and non-permeable (Ds/Dw = 0) struts. The saturation time, ts, was defined as the time required to attain steady state for the Ds/Dw = 1 model (~28 days). The cell densities of both permeable and non-permeable cases reached a predetermined maximum value after 0.54 ts at the top surface of the scaffold that was directly exposed to fresh media. However, cell density at the bottom surface peaked at 0.13 ts and 0.23 ts for the non-permeable and permeable strut scaffolds, respectively; moreover, the maximum cell density was much lower than that of the top surface. After peaking, the cell density decreased gradually and reached a steady state. Cell densities were saturated at 98 μm for the permeable strut (Ds/Dw = 0.93) scaffold and at 86 μm for the non-permeable strut scaffold. Figure 4 shows the saturated depth, which is defined as the depth at which the cell density reaches a predetermined maximum as a function of Ds. The maximum saturated depth was ~99 μm; this value was obtained when the oxygen diffusion coefficient in the strut was identical to that in water, which simulated the situation when the strut region was just filled with water with no obstacles. In the case of the scaffold constructed with a strut diffusion coefficient of 0.75Dw, the saturation depth was similar to the maximum saturated depth, as shown in Figure 4. The oxygen diffusion coefficients of various hydrogels, are 57%–94% [39,40] that of water; therefore, hydrogel strut scaffolds have similar saturated depth when the scaffold strut contains only with water.
Figure 5 shows the cell density distribution according to volume fraction (a–c, e–g) strut arrangement (d and f) in permeable (Ds = 0.93Dw, a–d) and non-permeable struts (e–h), respectively. In the case of the non-permeable strut scaffold, the cell density distribution was not altered markedly according to the strut arrangement. Additionally, as the volume fraction of the strut (α) increased, the depth to which cells grew to confluence decreased, albeit not to a marked extent.
However, the cell density distribution changed significantly with the strut volume fraction in the case of the permeable strut model. The penetration depth increased as the strut volume fraction increased because the strut region acts as an oxygen-diffusion pass and cell-free region in which oxygen is not consumed. Figure 5b, d show the cell density distribution of scaffolds that had the same volume fraction but different strut arrangements. The cell density was distributed more evenly for the staggered arrangement than for the latticed arrangement, and penetration depth was slightly greater for the staggered arrangement. However, the tendency was the opposite for the non-permeable strut scaffold.
The maximum thicknesses of the scaffolds in this study differed according to the strut width and height and the pore size. However, our analyses demonstrate that the permeable strut scaffold, such as when fabricated using the DWES method, is advantageous for the transfer of materials and for cell growth. We previously reported several preliminary cell culture tests using patterns or scaffolds fabricated by DWES electrospinning [27,41]. The scaffolds fabricated by the DWES method maintained their structures for minimum 14 days, and DWES-patterned scaffolds exhibited superior cell dispersion performance compared with scaffolds fabricated by convectional electrospinning or salt leaching [41].
Numerous studies of scaffolds have been published; however, few have measured the cell density distribution within scaffolds according to their thickness. Therefore, we have to date been unable to verify our simulation results. Nevertheless, Dunn et al. [28] cultured MC3T3 pre-osteoblast cells in a 3D scaffold constructed using a solvent casting/particulate-leaching technique with polylactide-co-glycolide. Cells at the edge of the scaffold grew most efficiently; the growth rate decreased gradually with increasing depth; at 1 mm from the edge, growth was negligible. However, these results cannot be compared directly with our findings because of differences in scaffold shapes, materials, and production methods. Also, they did not measure the diffusion coefficient of the scaffold. Androjna et al. [30] measured oxygen diffusion coefficient through natural extracellular matrices, such as small-intestine submucosa, human dermis and canine fascia lata. The range for the effective diffusion coefficients was found to be approximately 7 × 10⁻⁶–4 × 10⁻⁵ cm2/s. They estimated the critical size of cell-seeded scaffold that can be cultured in vitro, and those were 0.5–2.0 mm. However, this should be considered to be an initial estimate because the diffusion coefficients are representative of only initial material properties and culture conditions.

3. Materials and Methods
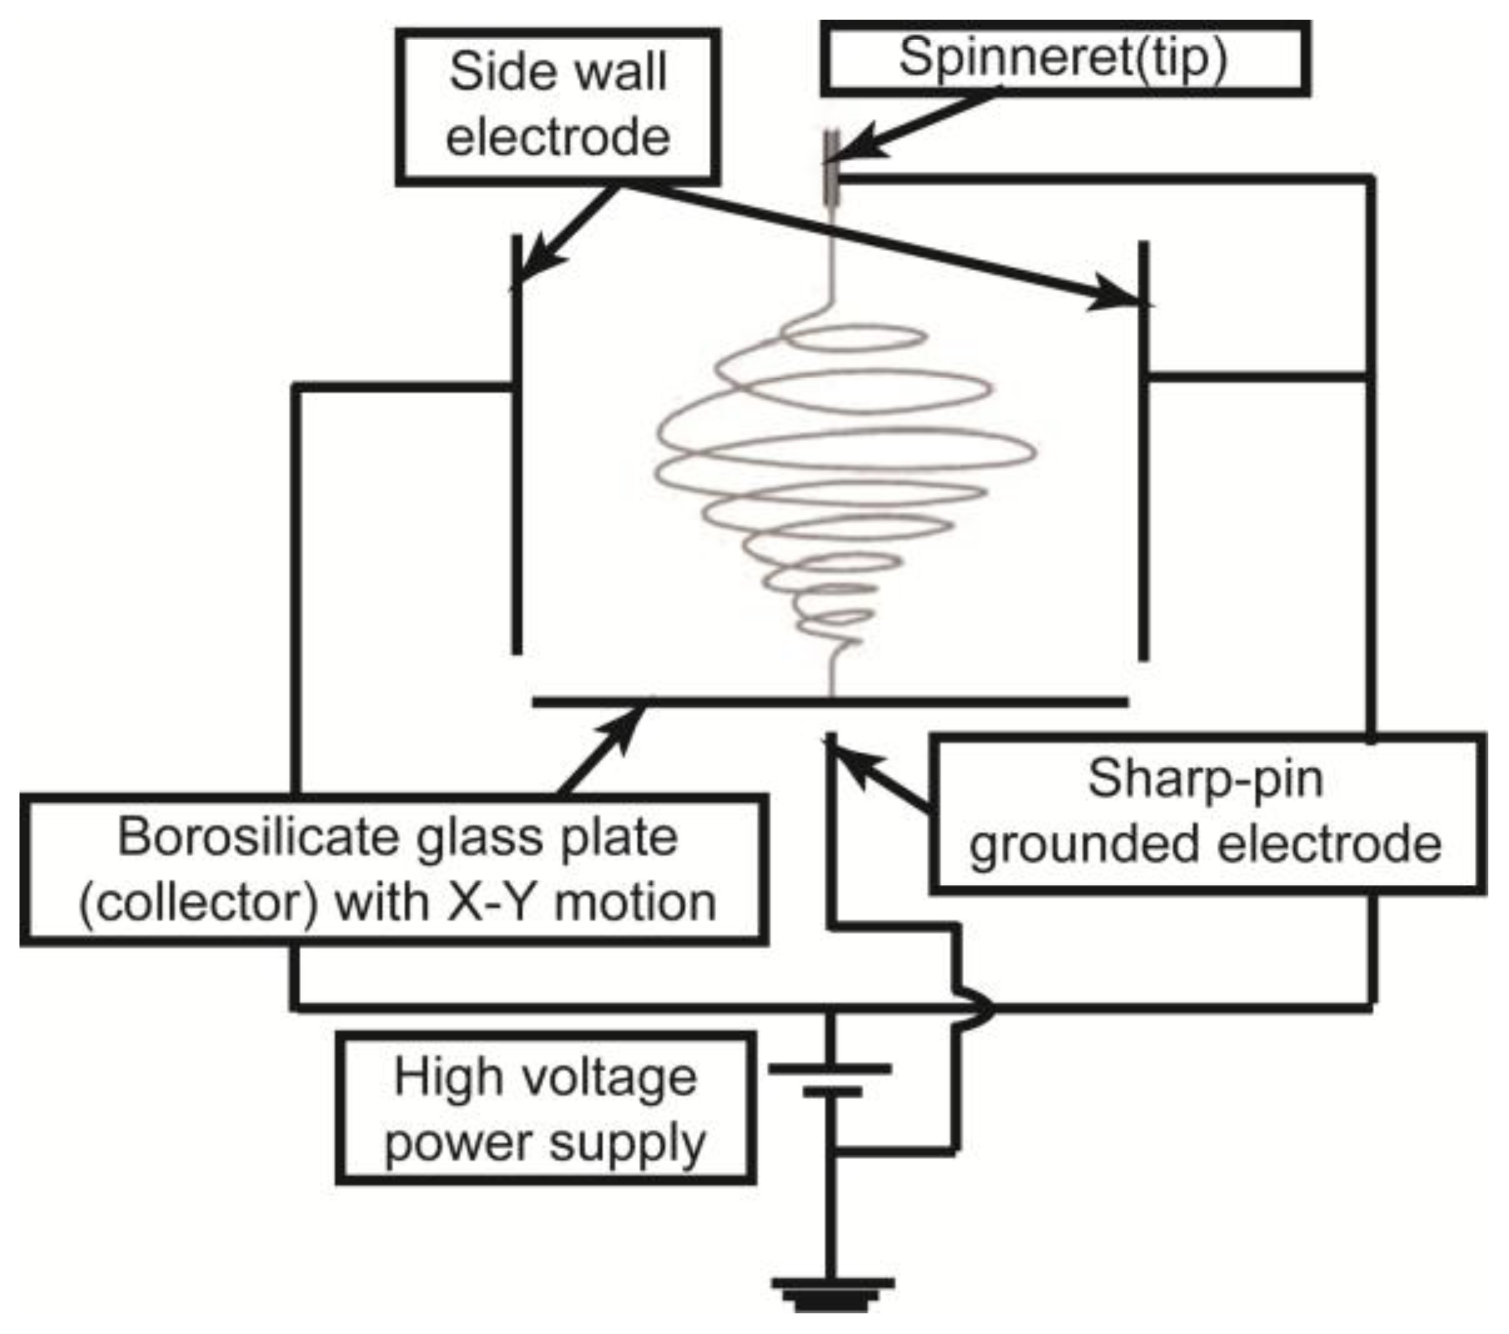
3.1. DWES Apparatus

Figure 6 presents a schematic diagram of the DWES apparatus used in this study. Complete details regarding the DWES apparatus are described in reference [27]. The DWES apparatus employs the concepts of electric field shaping and a collector scanning system. To shape the electric field, we used a sidewall electrode with an electric potential identical to that of the spinneret, a sharp-pin grounded electrode, and a 27-G needle spinneret. As a result, the electrospun nanofibers were concentrated toward the sharp-pin grounded electrode. A thin borosilicate glass plate with a thickness of 100 μm was placed between the spinneret and the sharp-pin electrode to collect the focused electrospun nanofibers. The glass plate collector had X-Y planar motion as it was placed on an X-Y motion stage. Using this apparatus, a single layer of the nanofibrous pattern was fabricated along the scan path of the collector. We used a layer-by-layer approach to increase the thickness of the nanofibrous pattern.

3.2. Sample Preparation
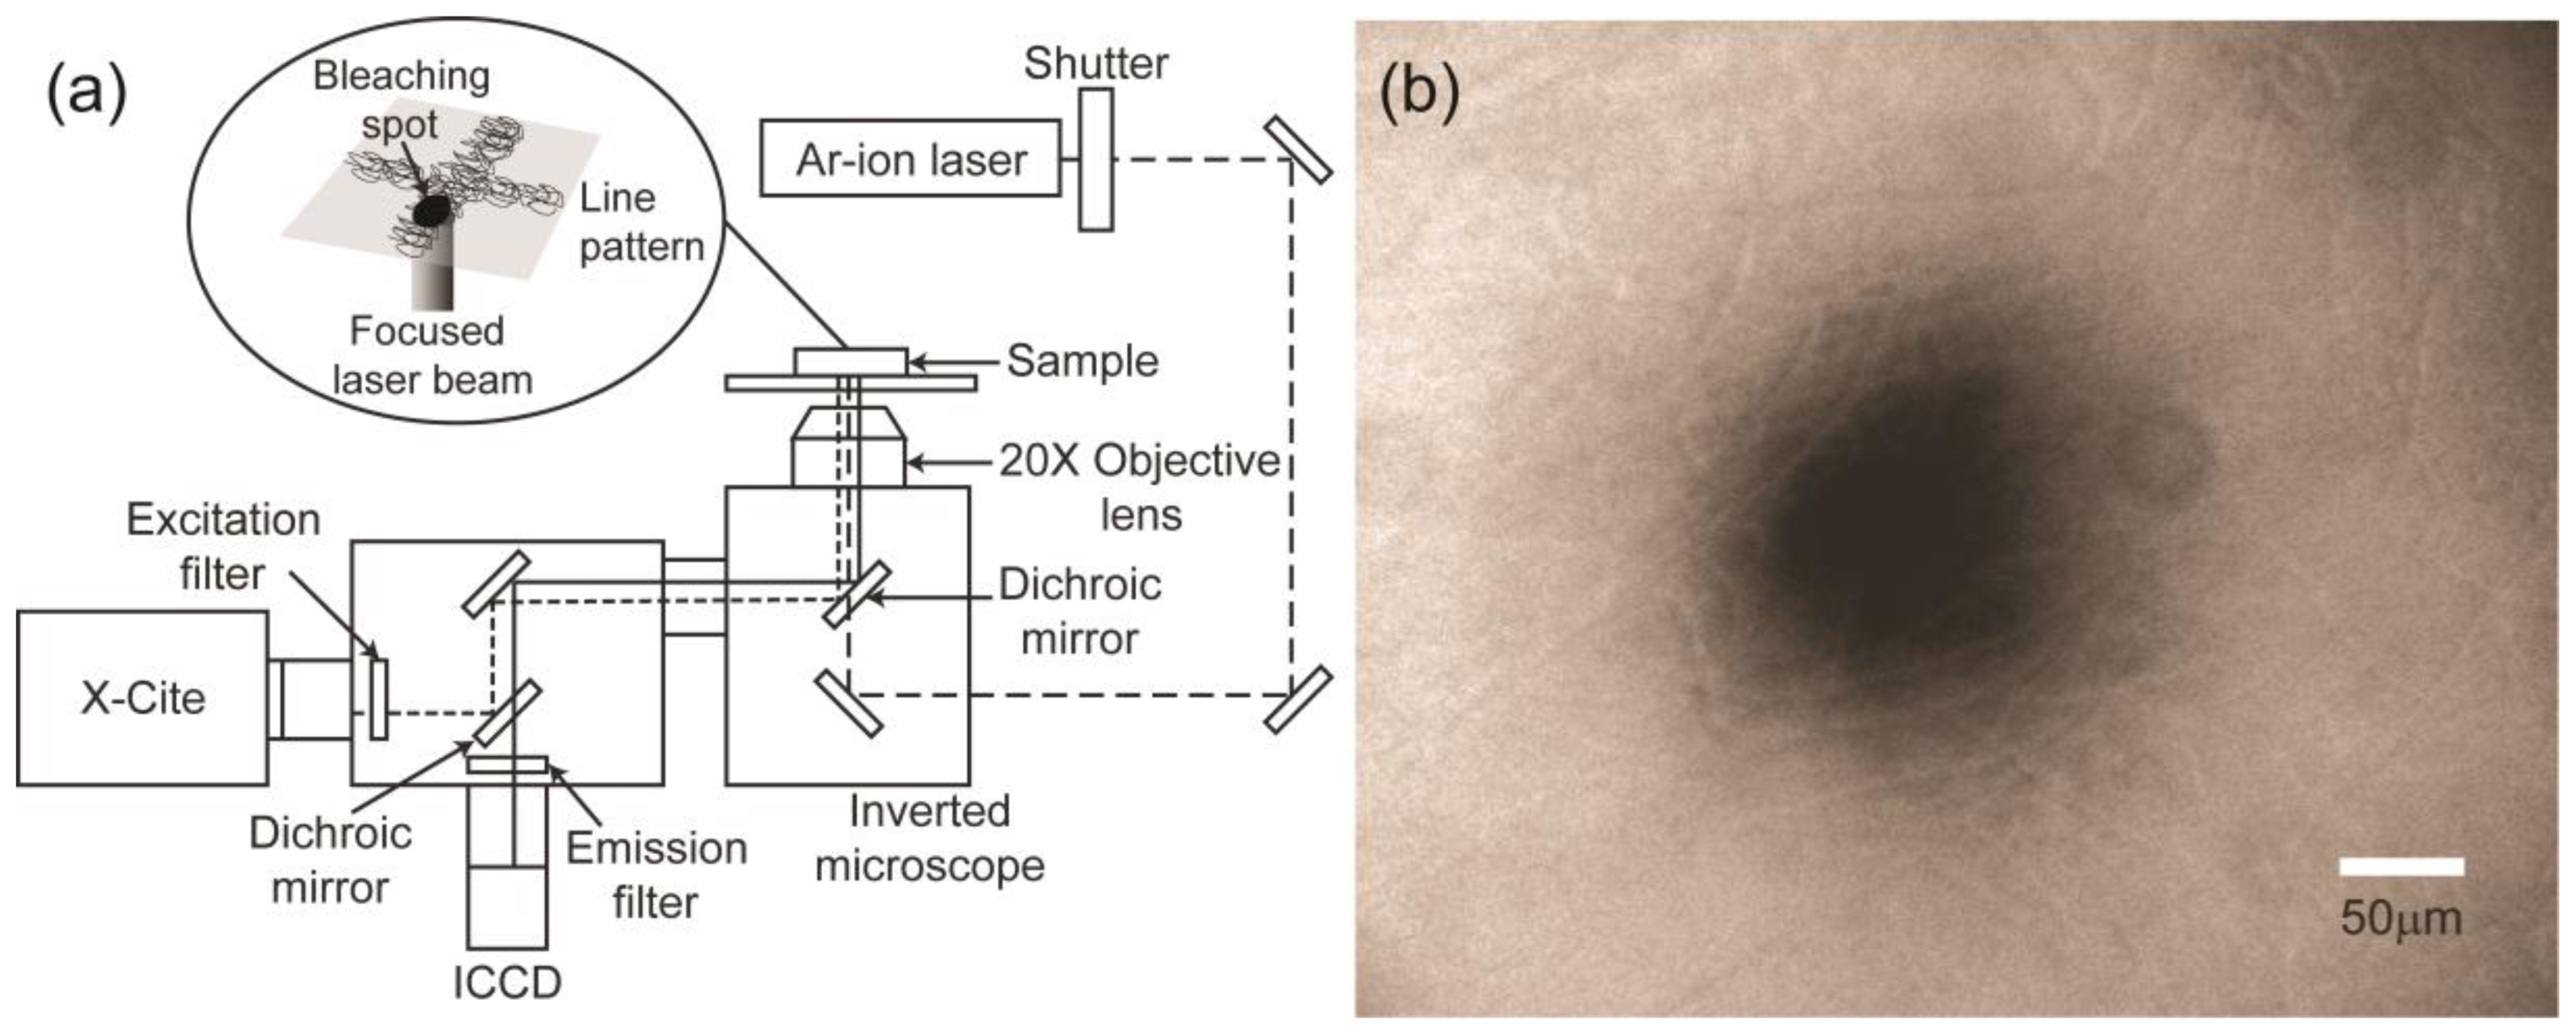
PCL (Sigma, St. Louis, MO, USA) was used for electrospinning. PCL (MW = 70,000–90,000) was dissolved in 99.5% pure chloroform (Samchun Pure Chemical Co., Ltd., Pyeongtaek, Korea) to a final concentration of 8.8%. The flow rate of the polymer solution was controlled using a syringe pump. The tip-to-collector distance was ~70 mm, and the voltage applied to the spinneret was 25–30 KV. The scan speed of the collector was 30 mm/s. We used a film structure instead of a line pattern to evaluate the alginate hydrogel. To fabricate a 2% hydrogel film, sodium alginate (Sigma, St. Louis, MO, USA) was dissolved in distilled deionized water at a final concentration of 2 wt%, and calcium carbonate (Junsei Chemical, Tokyo, Japan) was added as a cross-linking agent at a final concentration of 72 mM. G-Glucono-δ-lactone (Sigma, St. Louis, MO, USA) was then added to the solution at a molar ratio of 0.5:1 to maintain pH. The sodium alginate hydrogel was maintained at 37 °C for at least 24 h during cross-linking. The thickness of the fabricated film (~70 μm) was similar to that of the line pattern.

3.3. FRAP Method

Figure 7a shows a schematic of FRAP measurement of the diffusion coefficient in the nanofibrous line patterns fabricated by electrospinning and alginate hydrogel film. FRAP is an optical technique that is capable of measuring the diffusion coefficient of fluorescently labeled molecules. It begins with the bleaching of a particular area using a fast and strong light pulse, such as a laser. The diffusion coefficient is calculated by analyzing the recovery curve of the fluorescence intensity at the bleached spot. In this study, a 488-nm Ar-ion laser (Melles Griot, Albuquerque, NM, USA) focused by a 20× objective lens was used to create a bleach spot, and the bleaching time was adjusted to 257 ms using a mechanical shutter. The bleached spot and the recovery process were captured immediately after bleaching using a cooled CCD camera (The Cooke Corp., Romulus, MI, USA) and AQM6 software (Kinetic Imaging, Nottingham, UK). X-cite (Exfo Photonic Solutions Inc., Mississauga, ON, Canada) with an ND filter was used as a light source to observe photobleaching and recovery. The bleaching position was at the center of the line pattern, and we confirmed that the radius of the bleaching spot (~50 μm) was smaller than the width of the pattern (Figure 7b).
We used 3-kDa FITC-dextran (Invitrogen, Carlsbad, CA, USA) as a fluorescent probe. The scaffold was soaked in a FITC-dextran solution (100 mg/mL) under a vacuum for ~5 min to allow the solution to penetrate the pattern. The fluorescence signal was stable prior to bleaching. An inverted microscope (Olympus, Tokyo, Japan) with a 20× objective lens was used to form the bleaching spot and capture recovery.

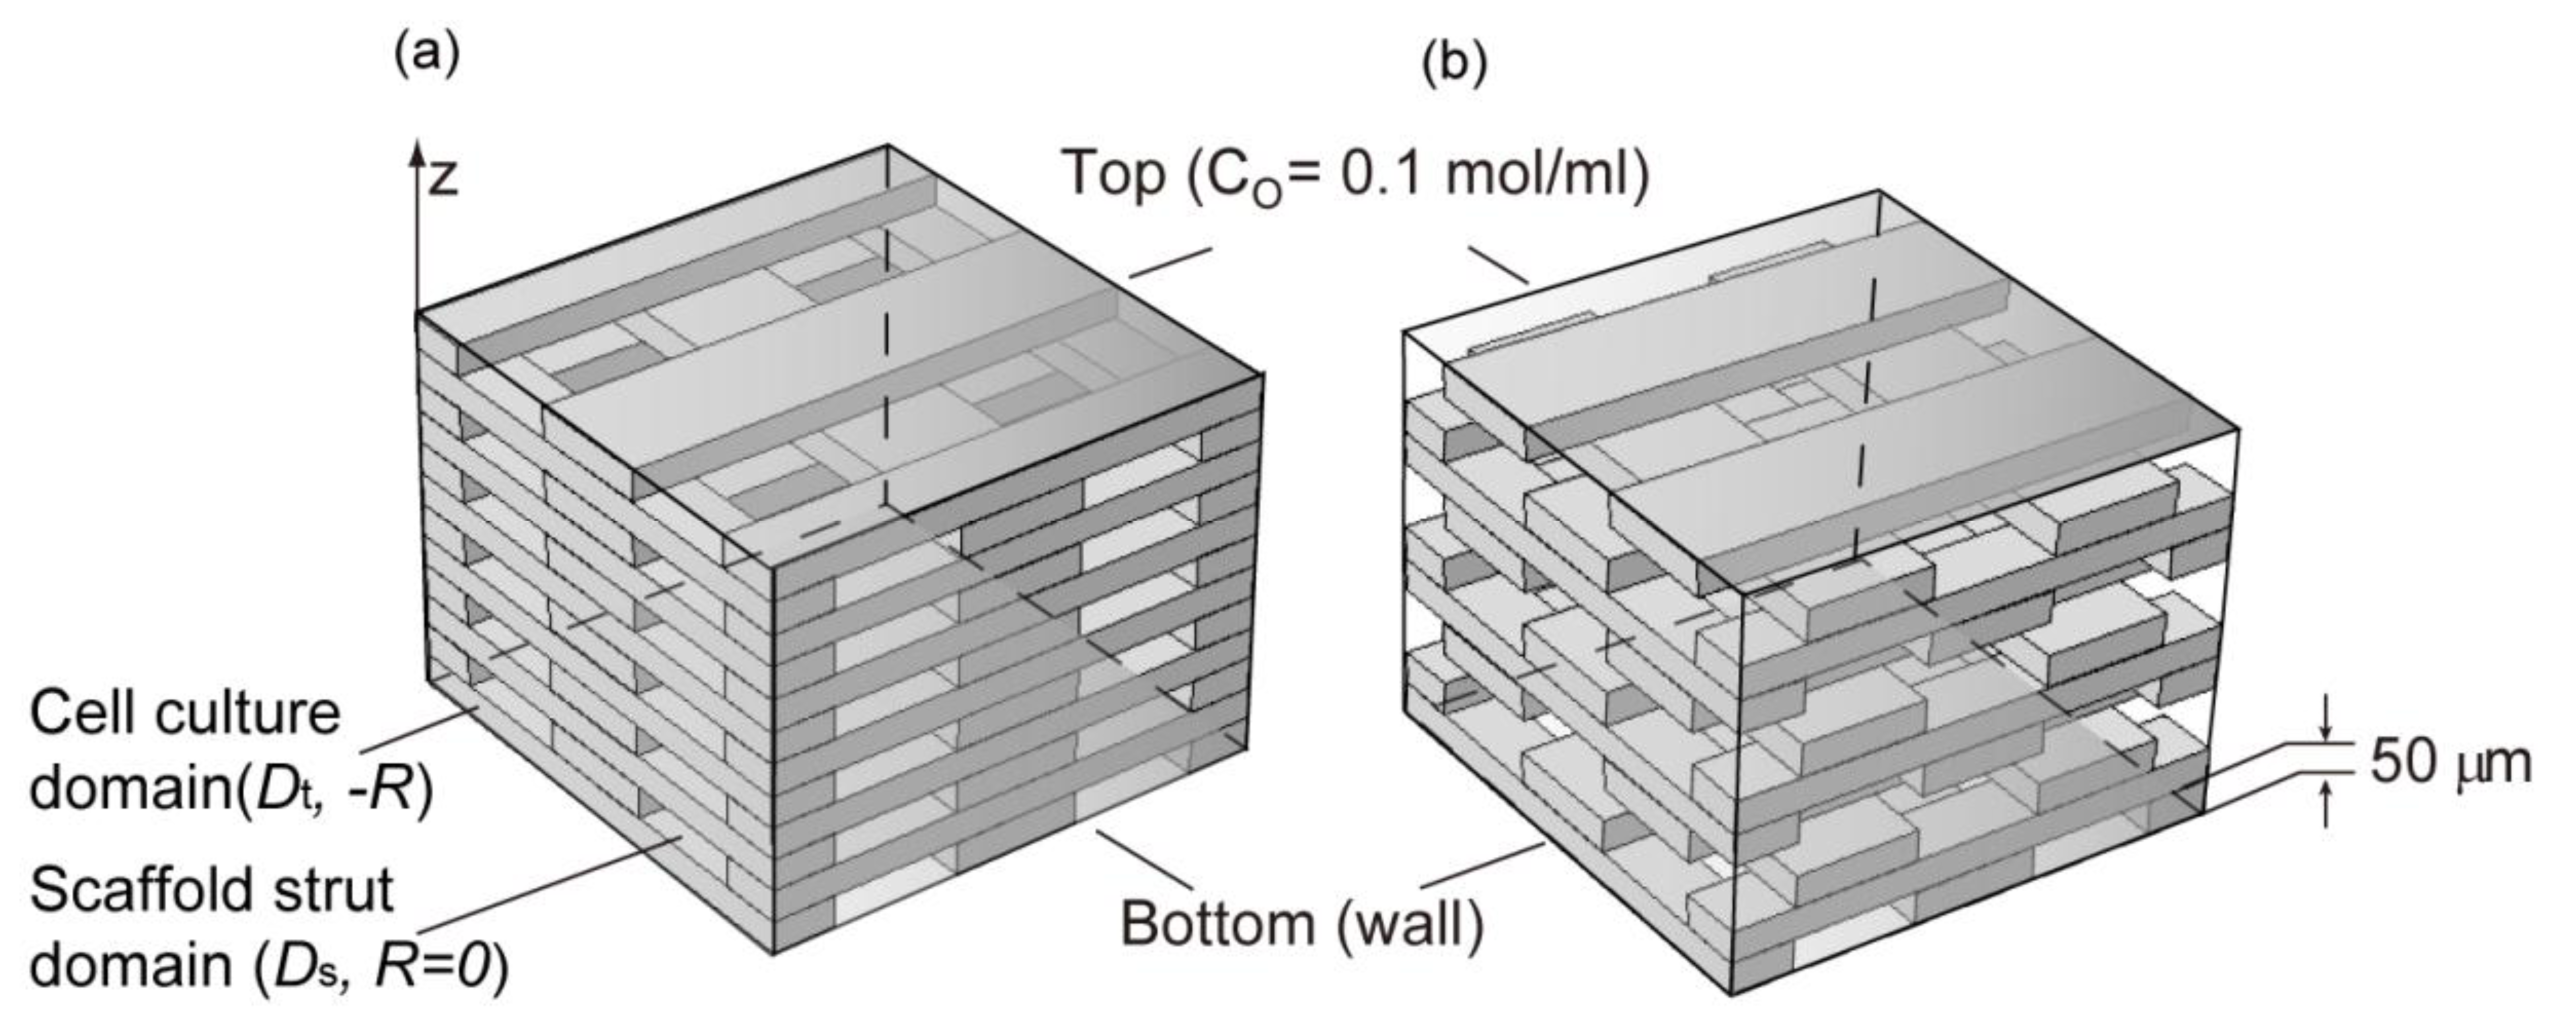
3.4. Simulation of Cell Density Distribution in a Scaffold

The simulation was performed using the hypothetical 3D scaffold model shown in Figure 8. The “scaffold strut domain” in Figure 8 simulates the strut of a scaffold with an oxygen diffusion coefficient, Ds. The “cell culture domain”, simulates the space between the struts; cells are assumed to be cultured only in this domain. The height of each strut was set to 50 μm; therefore, the height of each layer of the scaffold was 50 μm. The mesh pattern was created by rotating each layer 90° and stacking layers on top of each other. The total thickness was set to 1000 μm. The diffusion coefficient of the cell culture domain was assumed to be the oxygen diffusion coefficient in typical tissue culture system (Dt) [28]. The diffusion coefficient of the scaffold strut domain Ds was altered from 0 to 2.68 × 10⁻⁵ cm2/s; that is, the diffusion coefficient of oxygen in water (Dw) [37]. The initial oxygen concentration within the scaffold model was assumed to be the maximum dissolved oxygen concentration (C0) [28], and the bottom of the scaffold model was assumed to be a wall. The top surface of the scaffold model was assumed to be exposed to fresh media; therefore, the oxygen concentration of the top surface was maintained. Other boundaries were assumed to be symmetrical so that conditions were similar to the culture conditions of a flat, board-shaped scaffold. Oxygen consumption in the cell culture domains was established using the Michaelis-Menten equation (Equation (3)): [42].
R = ρ c e l l V max C K m + C
This equation was derived based on oxygen consumption in spaces within which cells were present. The initial and maximum cell densities were set at 2.1 × 10¹¹ cell/m3[28] and 1.5 × 10¹⁴ cell/m3[43,44], respectively. The Monod equation (Equation (4)) was applied to simulate cell proliferation.
r g = r g , max C K + C
r g , max = 1 t d
where rg is doubling rate, rg,max is the maximum cell population doubling rate and td is minimum cell division time [45].
The effect of the strut volume fraction (α = volume of the strut/total scaffold volume) and arrangement were also investigated. Applied strut arrangements were chosen to be of the “lattice type” (Figure 8 left model), which is a criss-cross-shaped truss structure, and the “staggered type” (Figure 8 right model), which is formed by a zigzag shape. The constants in this equation are defined in Table 1, and the analysis was conducted using Comsol Multiphysics version 4.2 (Comsol Inc., Burlington, VT, USA).

4. Conclusions

The diffusion characteristics in a spatially patterned scaffold constructed of a permeable strut were investigated. The diffusion coefficients of fluorescent dyes within the DWES line patterns and alginate hydrogel film were measured using FRAP. We observed no significant differences in diffusion coefficients among the alginate hydrogel and DWES line patterns fabricated with polymer supplied at a flow rate of 0.1 and 0.5 mL/h. The oxygen diffusion coefficient was estimated to be ~92%–94% of the diffusion coefficient of water.
A diffusion simulation was performed in the various scaffold models using the estimated oxygen diffusion coefficient. The saturated depths to which cells could grow to confluence were 86 μm for the non-permeable strut scaffold and 99 μm for the permeable strut (Ds/Dw = 1) scaffold when the strut volume fraction was 50%. Therefore, the permeable strut scaffold could be made ~15% thicker.
We found good diffusion within both the electrospun scaffold and the alginate hydrogel. Therefore, the tissue mass regenerated by bioengineering, which to date has been restricted due to mass transfer of adequate gas and nutrients, might be increased by developing our approach further.
Figure 1. Scanning electron microscopy (SEM) micrographs and fiber diameter distribution charts of the nanofibrous structures. (a) Ladder-patterned nanofibrous structure. Scale bar is 1 mm; (b,d) SEM micrographs of Qp = 0.1 mL/h (b) and Qp = 0.5 mL/h (d) samples. Scale bars are 20 μm; (c,e) Fiber diameter distribution charts of Qp = 0.1 mL/h (c) and Qp = 0.5 mL/h (e) samples.
Ijms 14 20157f1
Figure 2. Results of fluorescence recovery after photobleaching (FRAP) measurements. (a) Fractional fluorescence intensity recovery curves at flow rates of 0.5 and 0.1 mL/h electrospun line patterns and the 2% calcium alginate hydrogel. Error bars represent the standard deviations; (b) Diffusion coefficients of 3-kDa FITC-dextran and oxygen in the electrospun line patterns, 2% calcium alginate hydrogel, and water at 37 °C. Oxygen diffusion coefficients are estimated values from Equation 2 and the diffusion coefficient of 3-kDa FITC-dextran. Error bars represent the standard deviations.
Ijms 14 20157f2
Figure 3. Time based simulation results for the quantity of cells in the various scaffold models. Two points (bottom and top) for electrospun line patterns (Ds/Dw = 0.93) and for the non-diffusion strut model (Ds/Dw = 0).
Ijms 14 20157f3
Figure 4. Saturated depth according to strut diffusion coefficient.
Ijms 14 20157f4
Figure 5. Cell density distribution at ts. (ac) Permeable (Ds = 0.93 Dw) strut with a lattice-type arrangement. α = 70% (a), 50% (b) and 30% (c); (d) Permeable (Ds = 0.93 Dw) strut with a staggered type arrangement. α = 50%; (eg) Non-permeable strut with a lattice-type arrangement. α = 70% (e), 50% (f) and 30% (g); (h) Non-permeable strut with a staggered-type arrangement. α = 50%.
Ijms 14 20157f5
Figure 6. Schematic diagram of the direct-write electrospinning (DWES) apparatus.
Ijms 14 20157f6
Figure 7. Fluorescence recovery after photobleaching (FRAP) system for diffusion coefficient measurements. (a) Experimental setup; (b) Image of a bleaching spot.
Ijms 14 20157f7
Figure 8. Schematic representation of the simulation domain. (a) Lattice model; (b) Staggered model.
Ijms 14 20157f8
Table 1. Parameter values and definitions.
ParameterDefinitionValueRef.
VmaxMaximum cellular oxygen consumption rate3.3 × 10−16 mol/cell/s[46]
KmHalf-maximum rate oxygen concentration3.79 × 10−3 mol/m3[47]
KSaturation constant in Monod kinetics3 nmol/mL[46]
C0Maximum dissolved oxygen concentration0.1 mol/m3[28]
DtOxygen diffusion coefficient in typical tissue culture sysyem2.0 × 10−5 cm2/s[28]
DsOxygen diffusion coefficient in scaffold strut domain0–2.68 × 10⁻⁵ cm2/s-
tdminimum cell division time36.5 h[45]

Acknowledgments

This research was supported by the Pioneer Research Center and Basic Science Research Program through the National Research Foundation of Korea funded by the Ministry of Science, ICT & Future Planning (NRF-2010-0004324, NRF-2012-0009666, 2012R1A1A1015738), and the Human Resources Development Program (20114010100070) of the Korea Institute of Energy Technology Evaluation and Planning (KETEP) funded by the Ministry of Trade, Industry and Energy, Republic of Korea.

Conflicts of Interest

The authors declare no conflict of interest.

References

  1. Tejas, K.; Agrawal, C.; Joo, O. Diffusion in musculoskeletal tissue engineering scaffolds: Design issues related to porosity, permeability, architecture, and nutrient mixing. Ann. Biomed. Eng 2004, 32, 1728–1743. [Google Scholar]
  2. Yang, J.; Shi, G.; Bei, J.; Wang, S.; Cao, Y.; Shang, Q.; Yang, G.; Wang, W. Fabrication and surface modification of macroporous poly(l-lactic acid) and poly(l-lactic-co-glycolic acid) (70/30) cell scaffolds for human skin fibroblast cell culture. J. Biomed. Mater. Res. A 2002, 62, 438–446. [Google Scholar]
  3. Ho, M.H.; Kuo, P.Y.; Hsieh, H.J.; Hsien, T.Y.; Hou, L.T.; Lai, J.Y.; Wang, D.M. Preparation of porous scaffolds by using freeze-extraction and freeze-gelation methods. Biomaterials 2004, 25, 129–138. [Google Scholar]
  4. Whang, K.; Thomas, C.H.; Healy, K.E.; Nuber, G. A novel method to fabricate bioabsorbable scaffolds. Polymer 1995, 36, 837–842. [Google Scholar]
  5. Wang, X.; Li, W.; Kumar, V. A method for solvent-free fabrication of porous polymer using solid-state foaming and ultrasound for tissue engineering applications. Biomaterials 2006, 27, 1924–1929. [Google Scholar]
  6. Singh, L.; Kumar, V.; Ratner, B.D. Generation of porous microcellular 85/15 poly (dl-lactide-co-glycolide) foams for biomedical applications. Biomaterials 2004, 25, 2611–2617. [Google Scholar]
  7. Hou, Q.; Grijpma, D.W.; Feijen, J. Porous polymeric structures for tissue engineering prepared by a coagulation, compression moulding and salt leaching technique. Biomaterials 2003, 24, 1937–1947. [Google Scholar]
  8. Zein, I.; Hutmacher, D.W.; Tan, K.C.; Teoh, S.H. Fused deposition modeling of novel scaffold architectures for tissue engineering applications. Biomaterials 2002, 23, 1169–1185. [Google Scholar]
  9. Yeong, W.Y.; Chua, C.K.; Leong, K.F.; Chandrasekaran, M. Rapid prototyping in tissue engineering: Challenges and potential. Trends Biotechnol 2004, 22, 643–652. [Google Scholar]
  10. Bartolo, P.J.; Chua, C.K.; Almeida, H.A.; Chou, S.M.; Lim, A.S.C. Biomanufacturing for tissue engineering: Present and future trends. Virtual Phys. Prototyp 2012, 7, 13–24. [Google Scholar]
  11. Yang, S.; Leong, K.F.; Du, Z.; Chua, C.K. The design of scaffolds for use in tissue engineering. Part II. Rapid prototyping techniques. Tissue Eng 2002, 8, 1–11. [Google Scholar]
  12. Li, W.J.; Laurencin, C.T.; Caterson, E.J.; Tuan, R.S.; Ko, F.K. Electrospun nanofibrous structure: A novel scaffold for tissue engineering. J. Biomed. Mater. Res 2002, 60, 613–621. [Google Scholar]
  13. Miao, J.; Miyauchi, M.; Simmons, T.J.; Dordick, J.S.; Linhardt, R.J. Electrospinning of nanomaterials and applications in electronic components and devices. J. Nanosci. Nanotechnol 2010, 10, 5507–5519. [Google Scholar]
  14. Xin, X.; Hussain, M.; Mao, J.J. Continuing differentiation of human mesenchymal stem cells and induced chondrogenic and osteogenic lineages in electrospun PLGA nanofiber scaffold. Biomaterials 2007, 28, 316–325. [Google Scholar]
  15. Baker, S.C.; Atkin, N.; Gunning, P.A.; Granville, N.; Wilson, K.; Wilson, D.; Southgate, J. Characterisation of electrospun polystyrene scaffolds for three-dimensional in vitro biological studies. Biomaterials 2006, 27, 3136–3146. [Google Scholar]
  16. Yang, S.; Leong, K.F.; Du, Z.; Chua, C.K. The design of scaffolds for use in tissue engineering. Part I. Traditional Factors. Tissue Eng 2001, 7, 679–689. [Google Scholar]
  17. Depan, D.; Girase, B.; Shah, J.S.; Misra, R.D. Structure-process-property relationship of the polar graphene oxide-mediated cellular response and stimulated growth of osteoblasts on hybrid chitosan network structure nanocomposite scaffolds. Acta Biomater 2011, 7, 3432–3445. [Google Scholar]
  18. Depan, D.; Surya, P.K.; Girase, B.; Misra, R.D. Organic/inorganic hybrid network structure nanocomposite scaffolds based on grafted chitosan for tissue engineering. Acta Biomater 2011, 7, 2163–2175. [Google Scholar]
  19. Yuan, Q.; Hein, S.; Misra, R.D. New generation of chitosan-encapsulated ZnO quantum dots loaded with drug: Synthesis, characterization and in vitro drug delivery response. Acta Biomater 2010, 6, 2732–2739. [Google Scholar]
  20. Yuan, Q.; Shah, J.; Hein, S.; Misra, R.D. Controlled and extended drug release behavior of chitosan-based nanoparticle carrier. Acta Biomater 2010, 6, 61140–61148. [Google Scholar]
  21. Thein-Han, W.W.; Misra, R.D. Biomimetic chitosan-nanohydroxyapatite composite scaffolds for bone tissue engineering. Acta Biomater 2009, 5, 1182–1197. [Google Scholar]
  22. Thein-Han, W.W.; Saikhun, J.; Pholpramoo, C.; Misra, R.D.; Kitiyanant, Y. Chitosan-gelatin scaffolds for tissue engineering: Physico-chemical properties and biological response of buffalo embryonic stem cells and transfectant of GFP-buffalo embryonic stem cells. Acta Biomater 2009, 5, 3453–3466. [Google Scholar]
  23. Yuan, Q.; Venkatasubramanian, R.; Hein, S.; Misra, R.D. A stimulus-responsive magnetic nanoparticle drug carrier: Magnetite encapsulated by chitosan-grafted-copolymer. Acta Biomater 2008, 4, 1024–1037. [Google Scholar]
  24. Zhang, X.; Baughman, C.B.; Kaplan, D.L. In vitro evaluation of electrospun silk fibroin scaffolds for vascular cell growth. Biomaterials 2008, 29, 2217–2227. [Google Scholar]
  25. Meinel, A.J.; Kubow, K.E.; Klotzsch, E.; Garcia-Fuentes, M.; Smith, M.L.; Vogel, V.; Merkle, H.P.; Meinel, L. Optimization strategies for electrospun silk fibroin tissue engineering scaffolds. Biomaterials 2009, 30, 3058–3067. [Google Scholar]
  26. Bulysheva, A.A.; Bowlin, G.L.; Klingelhutz, A.J.; Yeudall, W.A. Low-temperature electrospun silk scaffold for in vitro mucosal modeling. J. Biomed. Mater. Res. A 2012, 100, 757–767. [Google Scholar]
  27. Lee, J.; Lee, S.Y.; Jang, J.; Jeong, Y.H.; Cho, D.W. Fabrication of patterned nanofibrous mats using direct-write electrospinning. Langmuir 2012, 28, 7267–7275. [Google Scholar]
  28. Dunn, J.C.; Chan, W.Y.; Cristini, V.; Kim, J.S.; Lowengrub, J.; Singh, S.; Wu, B.M. Analysis of cell growth in three-dimensional scaffolds. Tissue Eng 2006, 12, 705–716. [Google Scholar]
  29. Johnson, E.M.; Berk, D.A.; Jain, R.K.; Deen, W.M. Diffusion and partitioning of proteins in charged agarose gels. Biophys. J 1995, 68, 1561–1568. [Google Scholar]
  30. Androjna, C.; Gatica, J.E.; Belovich, J.M.; Derwin, K.A. Oxygen diffusion through natural extracellular matrices: Implications for estimating “critical thickness” values in tendon tissue engineering. Tissue Eng. Part A 2008, 14, 559–569. [Google Scholar]
  31. Soumpasis, D.M. Theoretical analysis of fluorescence photobleaching recovery experiments. Biophys. J 1983, 41, 95–97. [Google Scholar]
  32. Lawrence, J.R.; Wolfaardt, G.M.; Korber, D.R. Determination of diffusion coefficients in biofilms by confocal laser microscopy. Appl. Environ. Microbiol 1994, 60, 1166–1173. [Google Scholar]
  33. Arrio-Dupont, M.; Cribier, S.; Foucault, G.; Devaux, P.F.; D’Albis, A. Diffusion of fluorescently labeled macromolecules in cultured muscle cells. Biophys. J 1996, 70, 2327–2332. [Google Scholar]
  34. Ogston, A.G.; Preston, B.N.; Wells, J.D. On the transport of compact particles through solutions of chain-polymers. Proc. R. Soc. A 1973, 333, 297–316. [Google Scholar]
  35. Burns-Bellhorn, M.S.; Bellhorn, R.W.; Benjamin, J.V. Anterior segment permeability to fluorescein-labeled dextrans in the rat. Invest. Ophthalmol. Vis. Sci 1978, 17, 857–862. [Google Scholar]
  36. Reginald, H.G.; Charles, M.G. Biochemistry, 3rd ed; Thomson learning: Belmont, CA, USA, 2007; pp. 31–32. [Google Scholar]
  37. Stewart, P.S. Diffusion in biofilms. J. Bacteriol 2003, 185, 1485–1491. [Google Scholar]
  38. Bosma, J.C.; Wesselingh, J.A. Partitioning and diffusion of large molecules in fibrous structures. J. Chromatogr 2000, 743, 169–180. [Google Scholar]
  39. Mehmetoglu, U.; Ates, S.; Berber, R. Oxygen diffusivity in calcium alginate gel beads containing gluconobacter suboxydans. Artif. Cells Blood Substit. Immobil. Biotechnol 1996, 24, 91–106. [Google Scholar]
  40. Hulst, A.C.; Hens, H.J.H.; Buitelaar, R.M.; Tramper, J. Determination of the effective diffusion coefficient of oxygen in gel materials in relation to gel concentration. Biotechnol. Tech 1989, 3, 199–204. [Google Scholar]
  41. Lee, J.; Jang, J.; Oh, H.; Jeong, Y.H.; Cho, D.W. Fabrication of a three-dimensional nanofibrous scaffold with lattice pores using direct-write electrospinning. Mater. Lett 2013, 93, 397–400. [Google Scholar]
  42. Cheng, G.; Markenscoff, P.; Zygourakis, K. A 3D hybrid model for tissue growth: The interplay between cell population and mass transport dynamics. Biophys. J 2009, 97, 401–414. [Google Scholar]
  43. Heinemann, A.; Wischhusen, F.; Puschel, K.; Rogiers, X. Standard liver volume in the Caucasian populssation. Liver Transpl. Surg 1999, 5, 366–368. [Google Scholar]
  44. Li, A.P. Human hepatocytes: Isolation, cryopreservation and applications in drug development. Chem. Biol. Interact 2007, 168, 16–29. [Google Scholar]
  45. Kino-Oka, M.; Maeda, Y.; Yamamoto, T.; Sugawara, K.; Taya, M. A kinetic modeling of chondrocyte culture for manufacture of tissue-engineered cartilage. J. Biosci. Bioeng 2005, 99, 197–207. [Google Scholar]
  46. Croll, T.I.; Gentz, S.; Mueller, K.; Davidson, M.; O’Connor, A.J.; Stevens, G.W.; Cooper-White, J.J. Modelling oxygen diffusion and cell growth in a porous, vascularizing scaffold for soft tissue engineering applications. Chem. Eng. Sci 2005, 60, 4924–4934. [Google Scholar]
  47. Brown, D.A.; MacLellan, W.R.; Laks, H.; Dunn, J.C.; Wu, B.M.; Beygui, R.E. Analysis of oxygen transport in a diffusion-limited model of engineered heart tissue. Biotechnol. Bioeng 2007, 97, 962–975. [Google Scholar]

