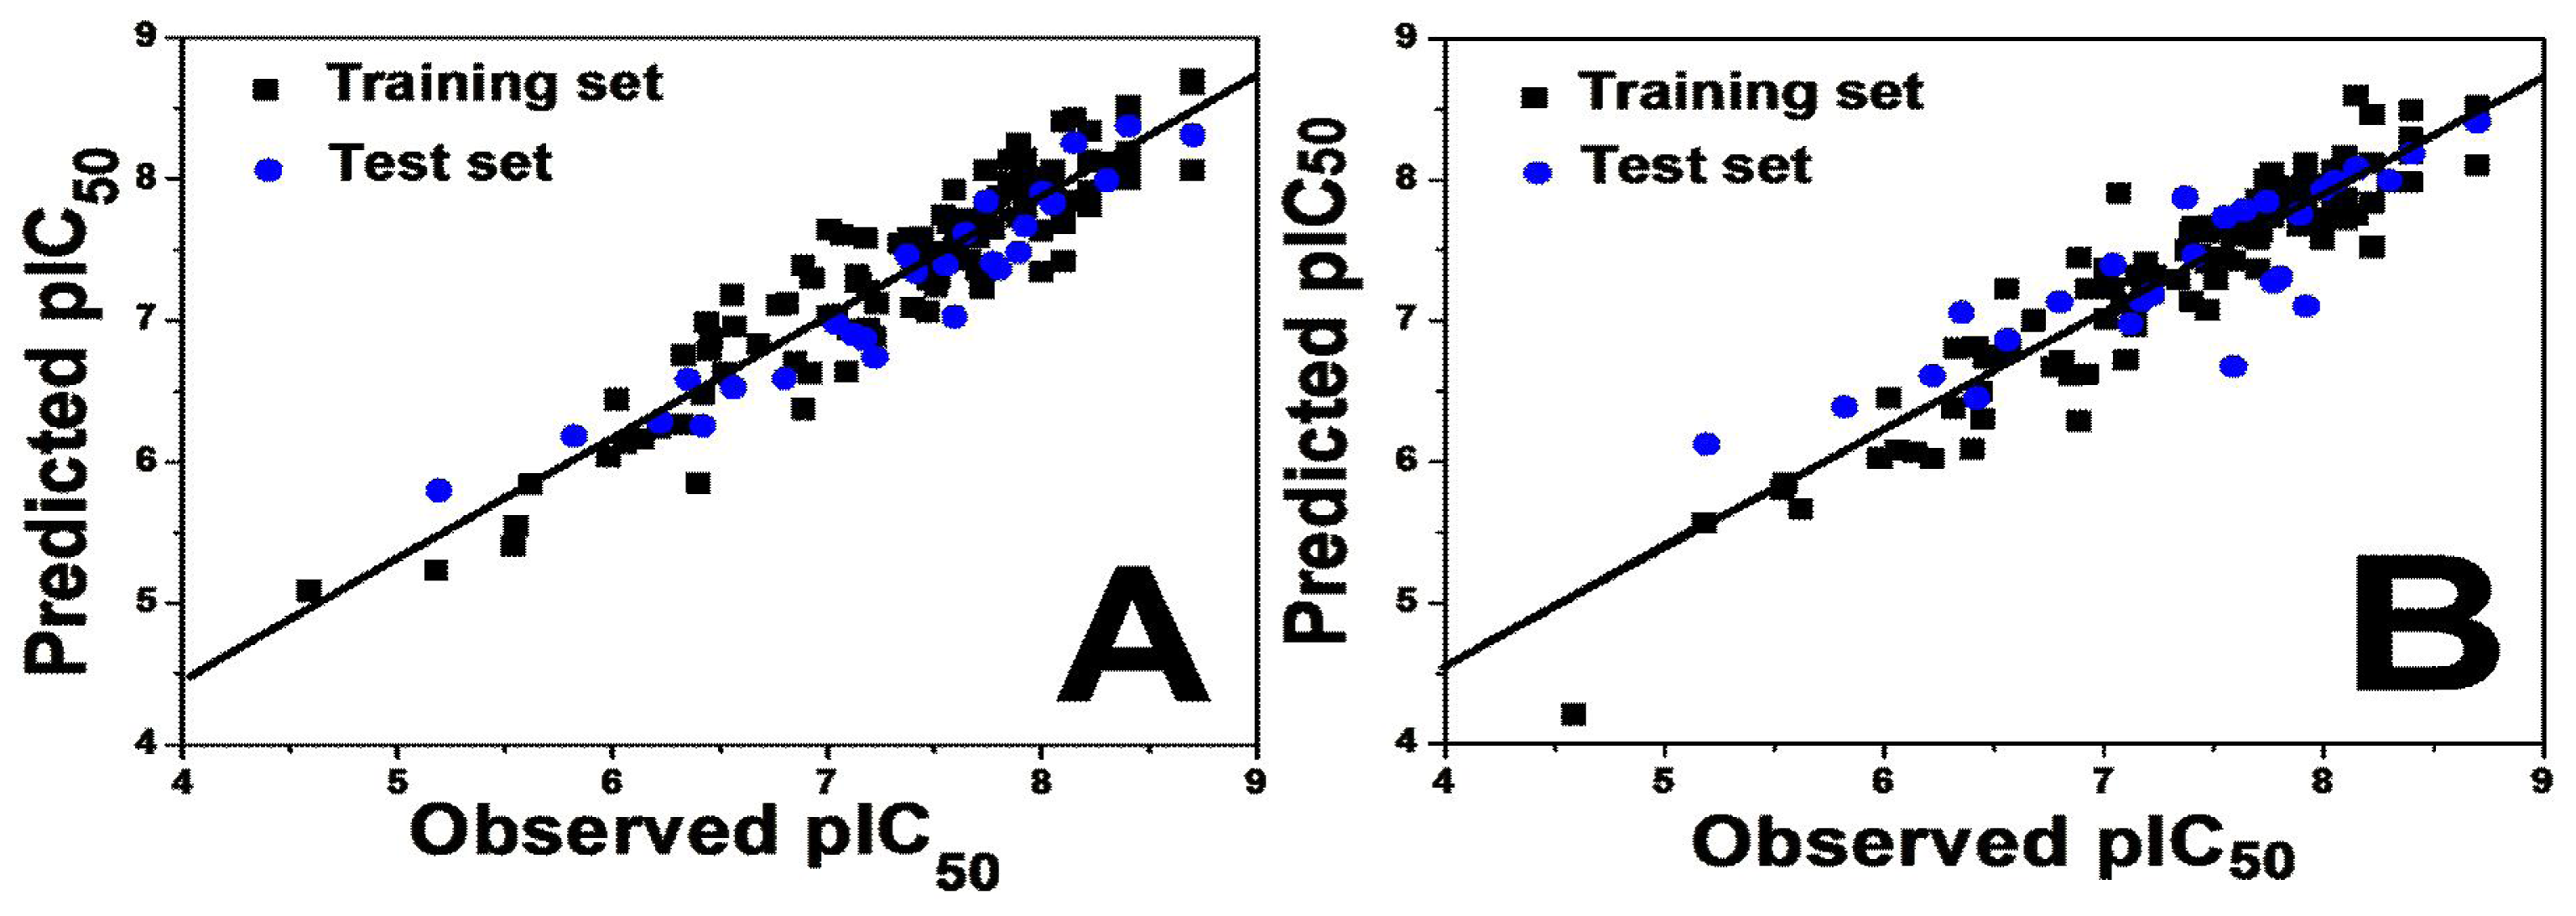
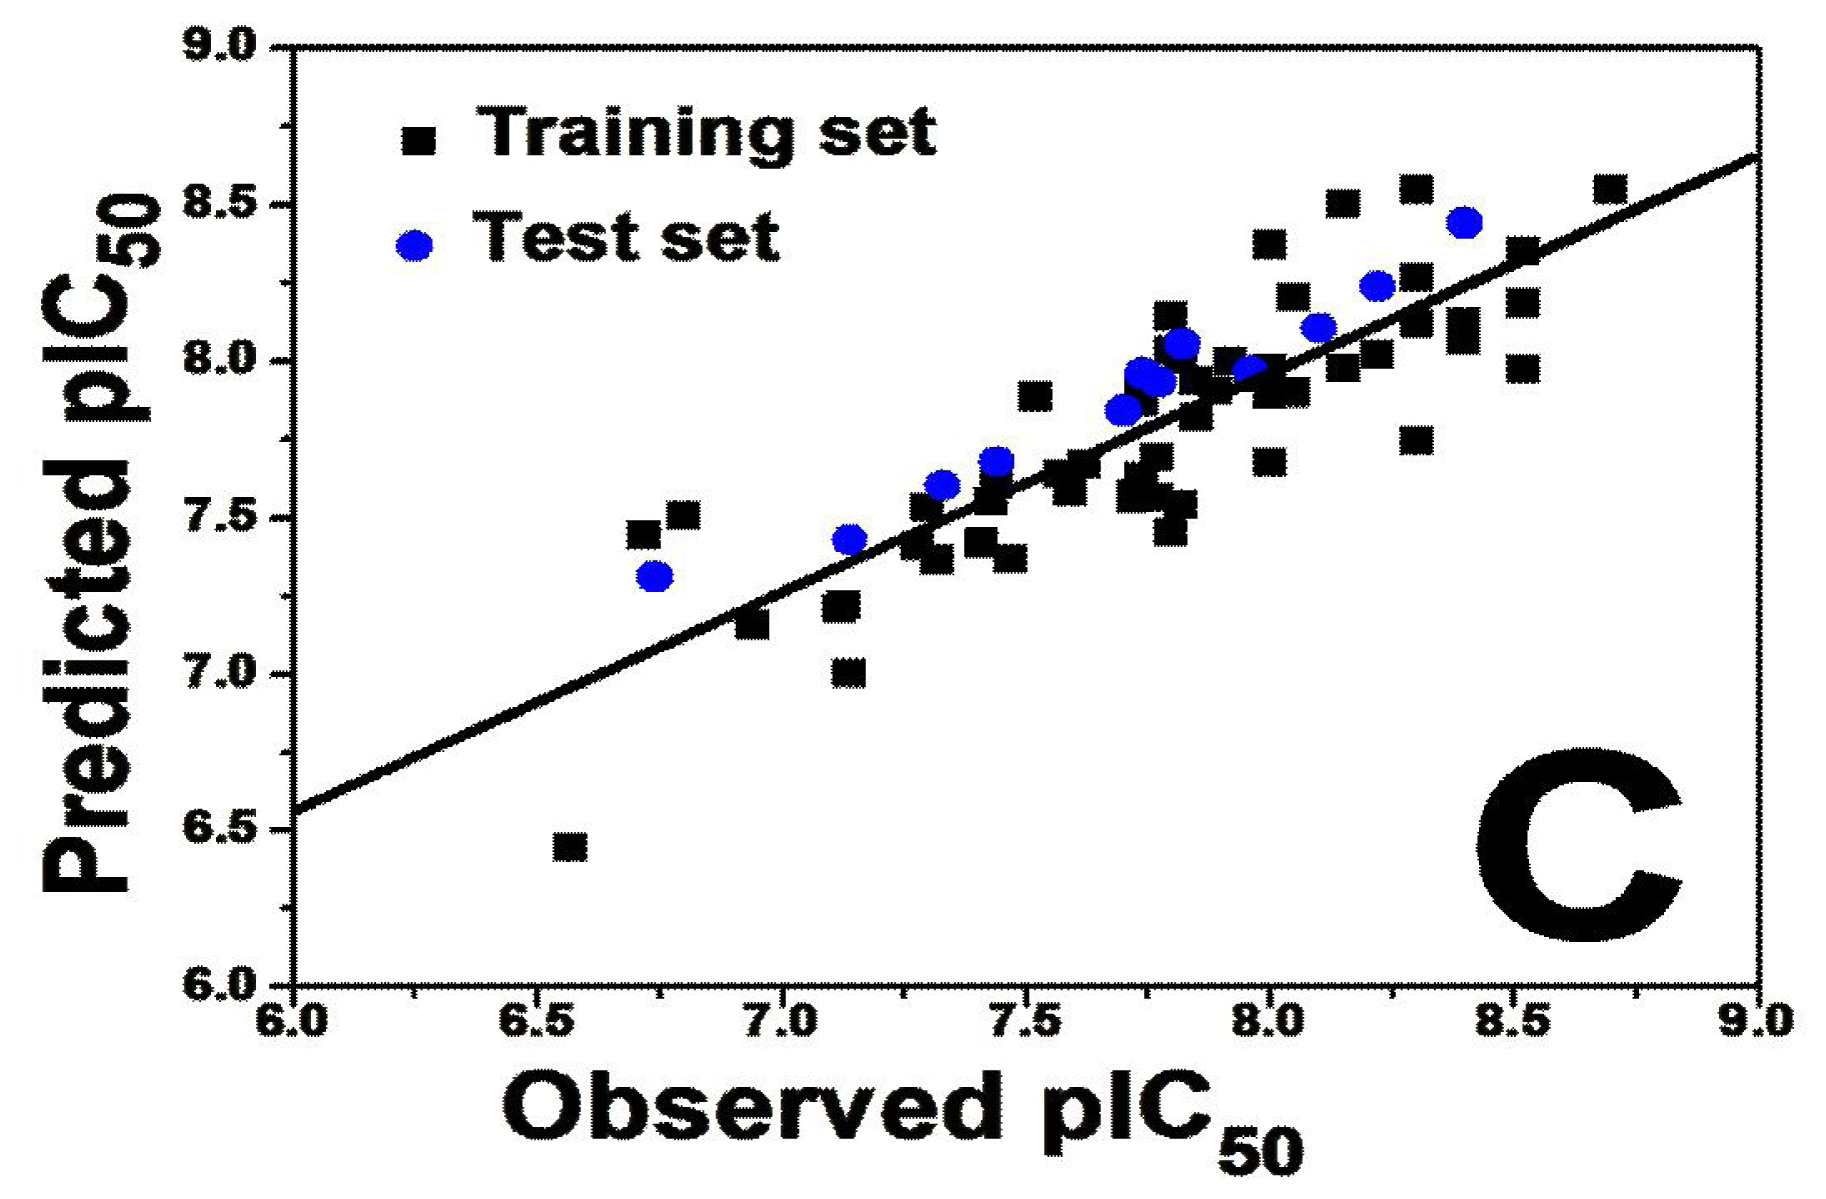
To judge whether a QSAR model is highly qualified, several statistical parameters including especially the cross-validated correlation coefficient (
Q2), non cross-validated correlation coefficient (
R2 ncv), standard error of estimate (SEE) and F-statistic values as well as the optimum number of components (OPN) should be evaluated. Various 3D-QSAR models were generated and the best model was selected based on the statistically significant parameters obtained. For both 3D-QSAR studies, good correlations were observed in the obtained CoMFA and CoMSIA models demonstrated by the high values of
Q2,
Rncv,
Rpred and other statistical results.
Table 1 summarizes the statistical results of the CoMFA and CoMSIA analyses.
2.3. Homology Modeling Results and Docking Study
In order to find the optimal orientation of the ligand in the binding pocket of the protein, docking studies were also attempted. However, a complete validated crystal structure for mGluR2 has not yet been established. Thus, a homology model must be built based on the amino acid sequence, with a proper protein with similar structure and sequence as template. Based on chain B of template 2e4u (obtained from protein data bank), a comparative model of mGluR2 with a high sequence identity of 65.4% covering regions 23 to 558 of a total of 872 amino acids (data shown in
Figure S3 contained by support information) was successfully created. The model established contains an orthosteric site, which is the active site of the protein. But according to the study of Woltering T.J., the orthosteric site is not the binding site of the series of antagonist we investigated [
12]. Instead, an allosteric site which locates in the 7 transmembrane (7TM) domain of mGluR2, maybe the binding site of the antagonist due to its non-competitive nature. The series of antagonists have been reported a high affinity for allosteric site [
12]. Furthermore, instead of a common allosteric site, multiple allosteric sites covering a larger binding region is suggested for mGluR2 negative allosteric modulators such as the antagonists we focus on. Their binding region is defined as the inward-facing top half of the 7TM helices [
5]. Unfortunately, according to the latest sequence reported by H.Y Zhou, the 7TM region happened to be in region 554 to 872, which is not contained in modeled residue range [
19].
Using bovine Rhodopsin crystal structures 1F88 and 1GZM, which is also a transmembrane protein, to build TM structure of GPCRs (G protein-coupled receptor) like mGluR1 and mGluR5, is applied recently [
20–
22]. Thus we attempted to build mGluR2 homology model based on 1F88 and 1GZM. In the present work, several homology models are built using this potentially effective template by a variety of modeling tools including the Swiss Model, Modweb, M4T, ESyPred3D and Modeller, but only receiving identities below 20% (data not shown), which made the model statistically insufficiently to be a valid mGluR2 structure. This may result from the low sequence identity (less than 20%) shared by different classes of GPCR, despite of their common confirmation of a hepta-helical architecture in the mGluR transmembrane [
5]. The homology model reveals low sequences identity and the unideal docking results. Thus to further investigate into the structure-activity relation of the series of antagonists, pharmacophore models were established based on the two activities.
2.4. Pharmacophore Modeling
Presently, models for mGluR2 antagonists is not developed yet, though pharmacophore models of mGluR2 agonists have been established [
23]. Herein, prior to quantitative pharmacophore development, a common-feature pharmacophore modeling study was conducted in order to identify the features required for effective mGluR2 antagonists.
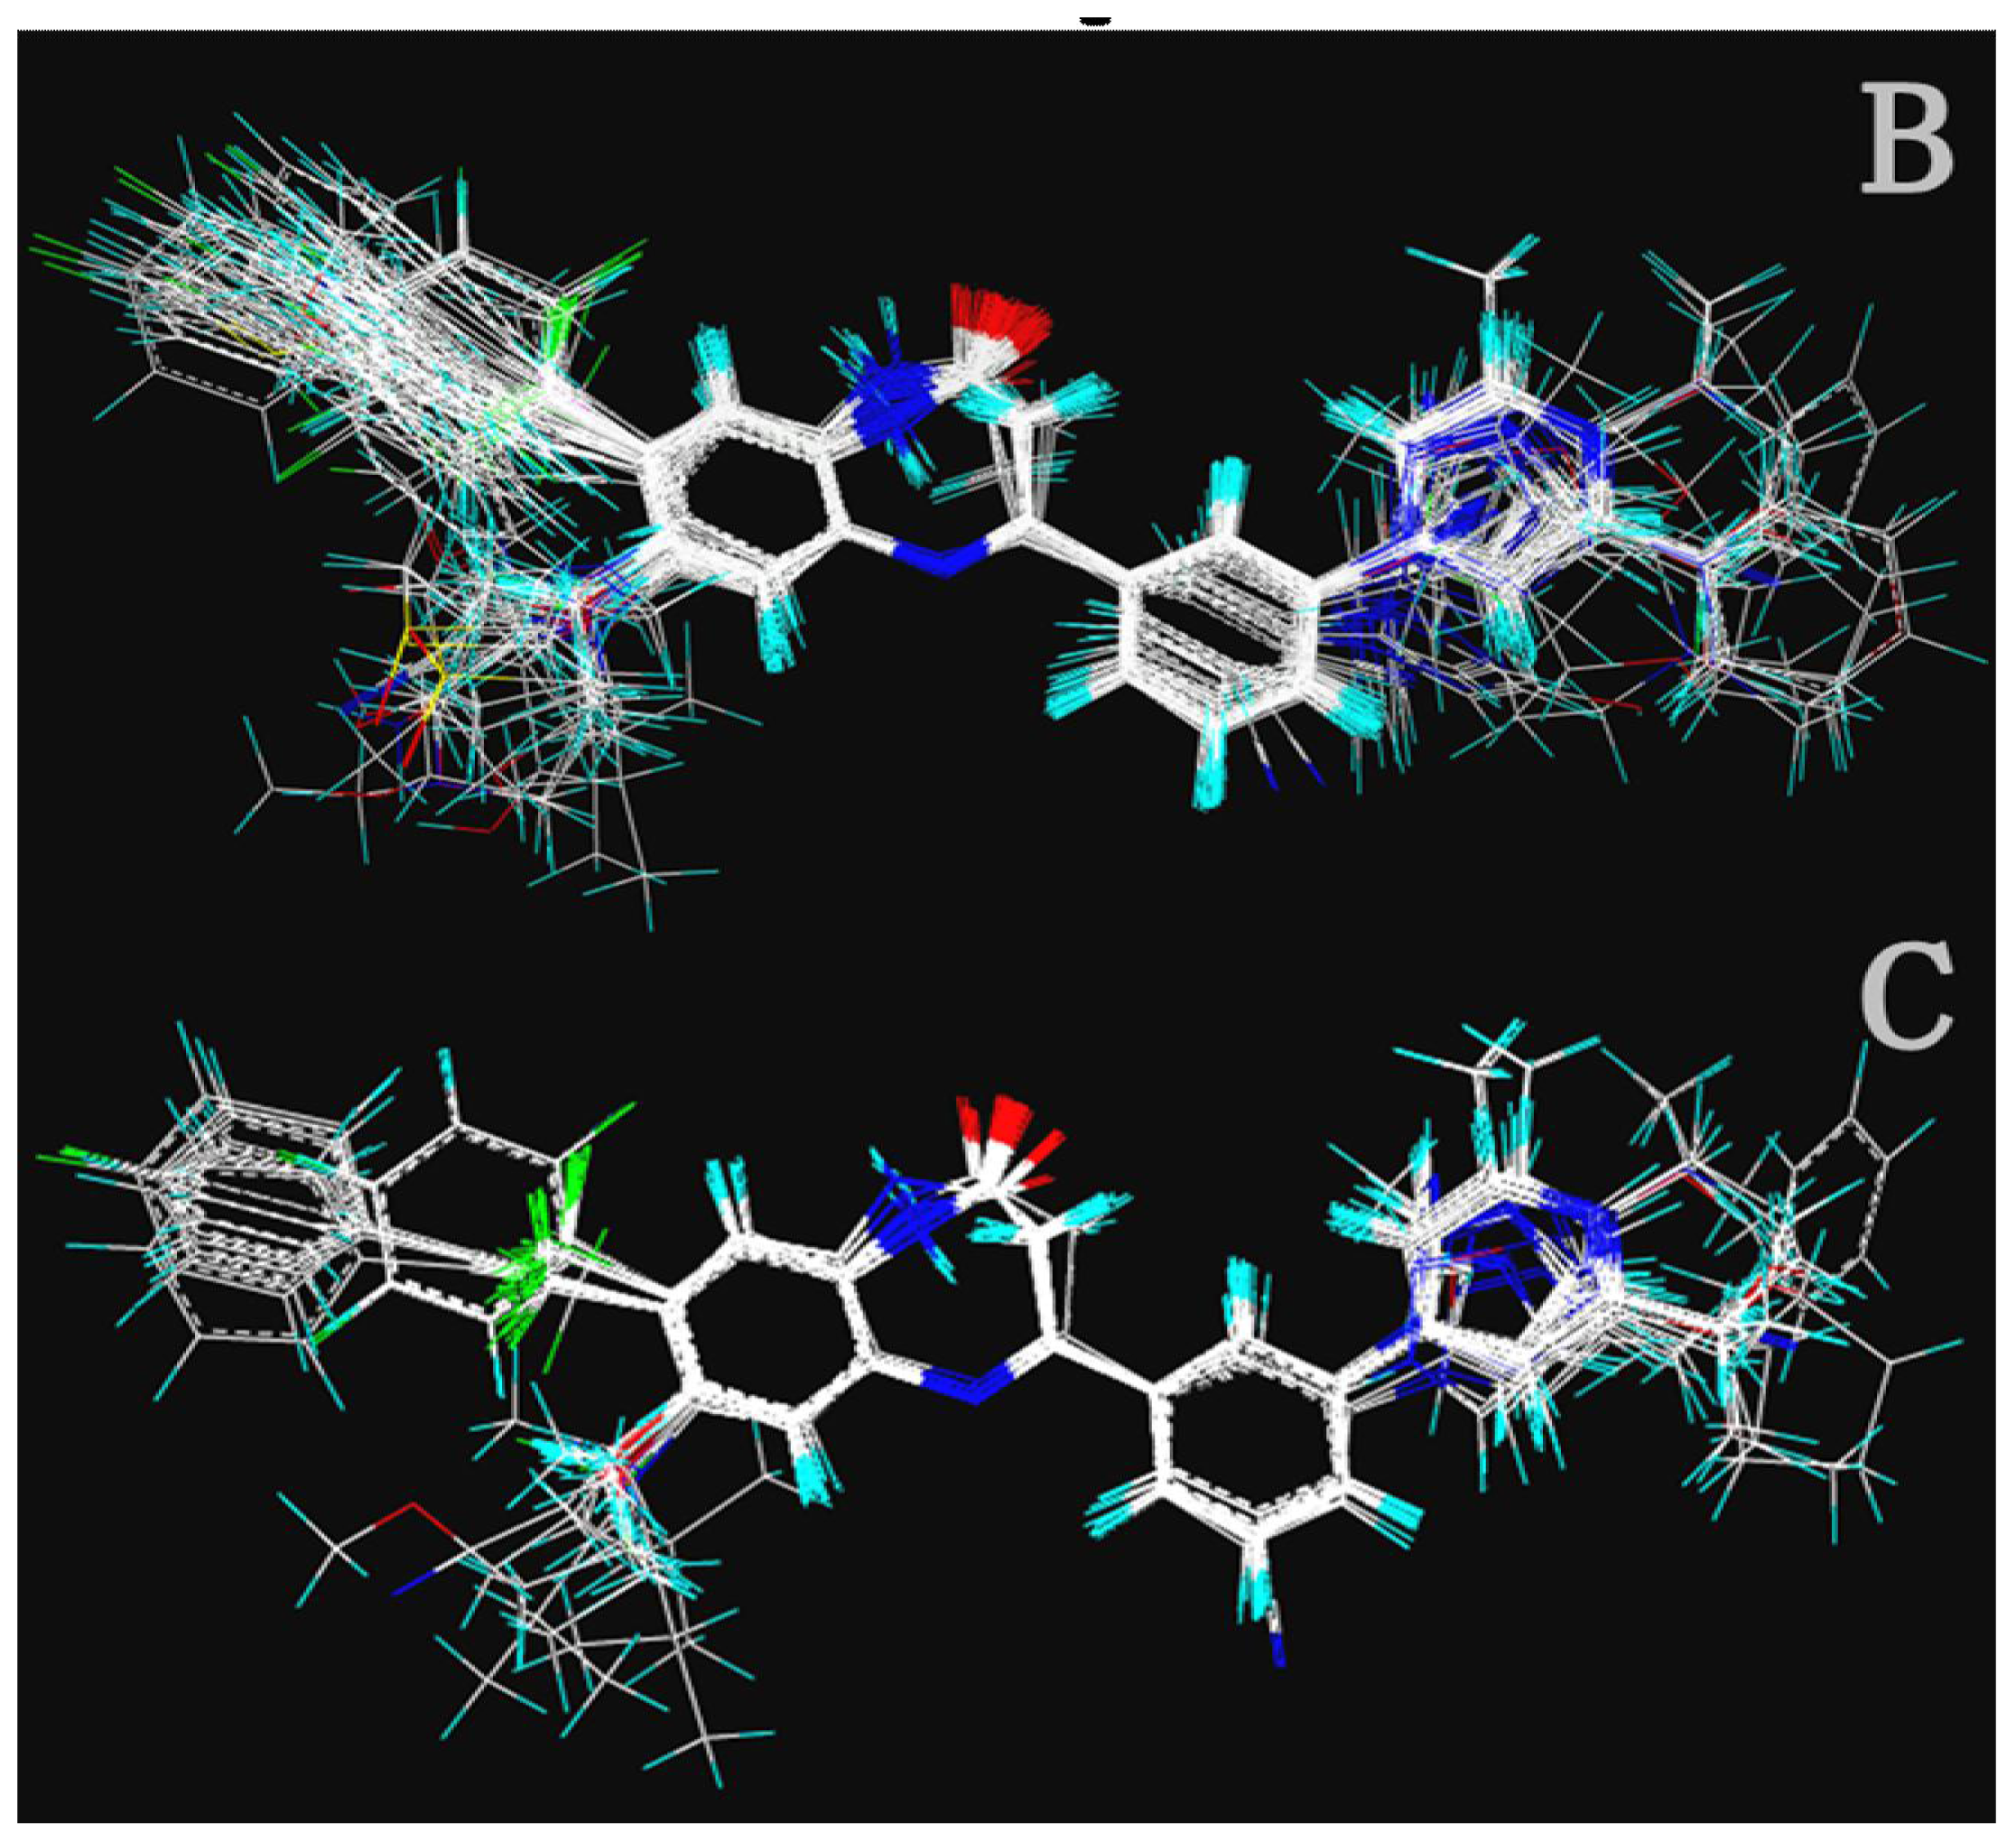
DiscoTECH was employed to generate a collection of pharmacophore queries from a series of compounds some or all of which are active against a particular biological target such that all or most of active compounds satisfy the queries. Presently, 50 highly active compounds participated in the establishment of pharmacophore model for the two activities separately. The most active compounds for activity I (8ao) and for activity II (8av) were selected as reference molecules for the two pharmacophore models respectively. The maximum number of conformers generated for each compound was 50, and seven conformers were then selected.
2.4.1. Pharmacophore Model for Activity I
In total, nine models (as shown in
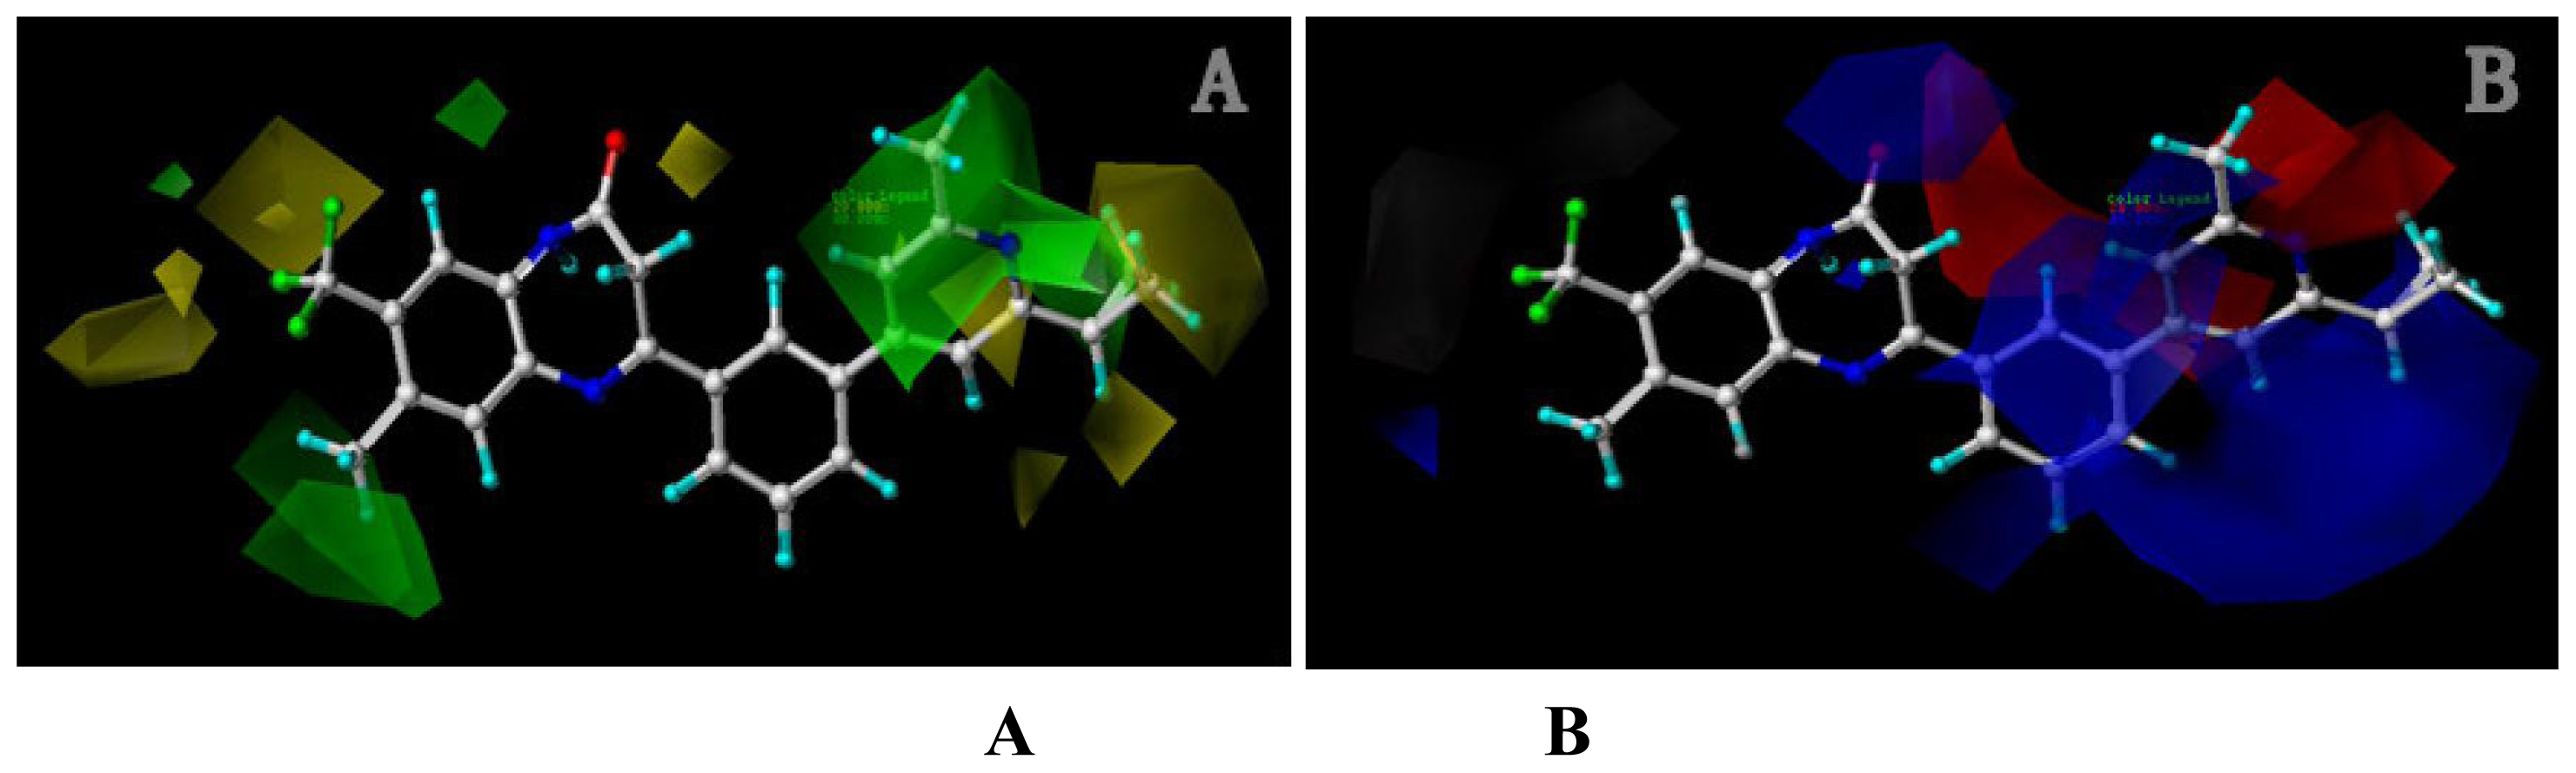
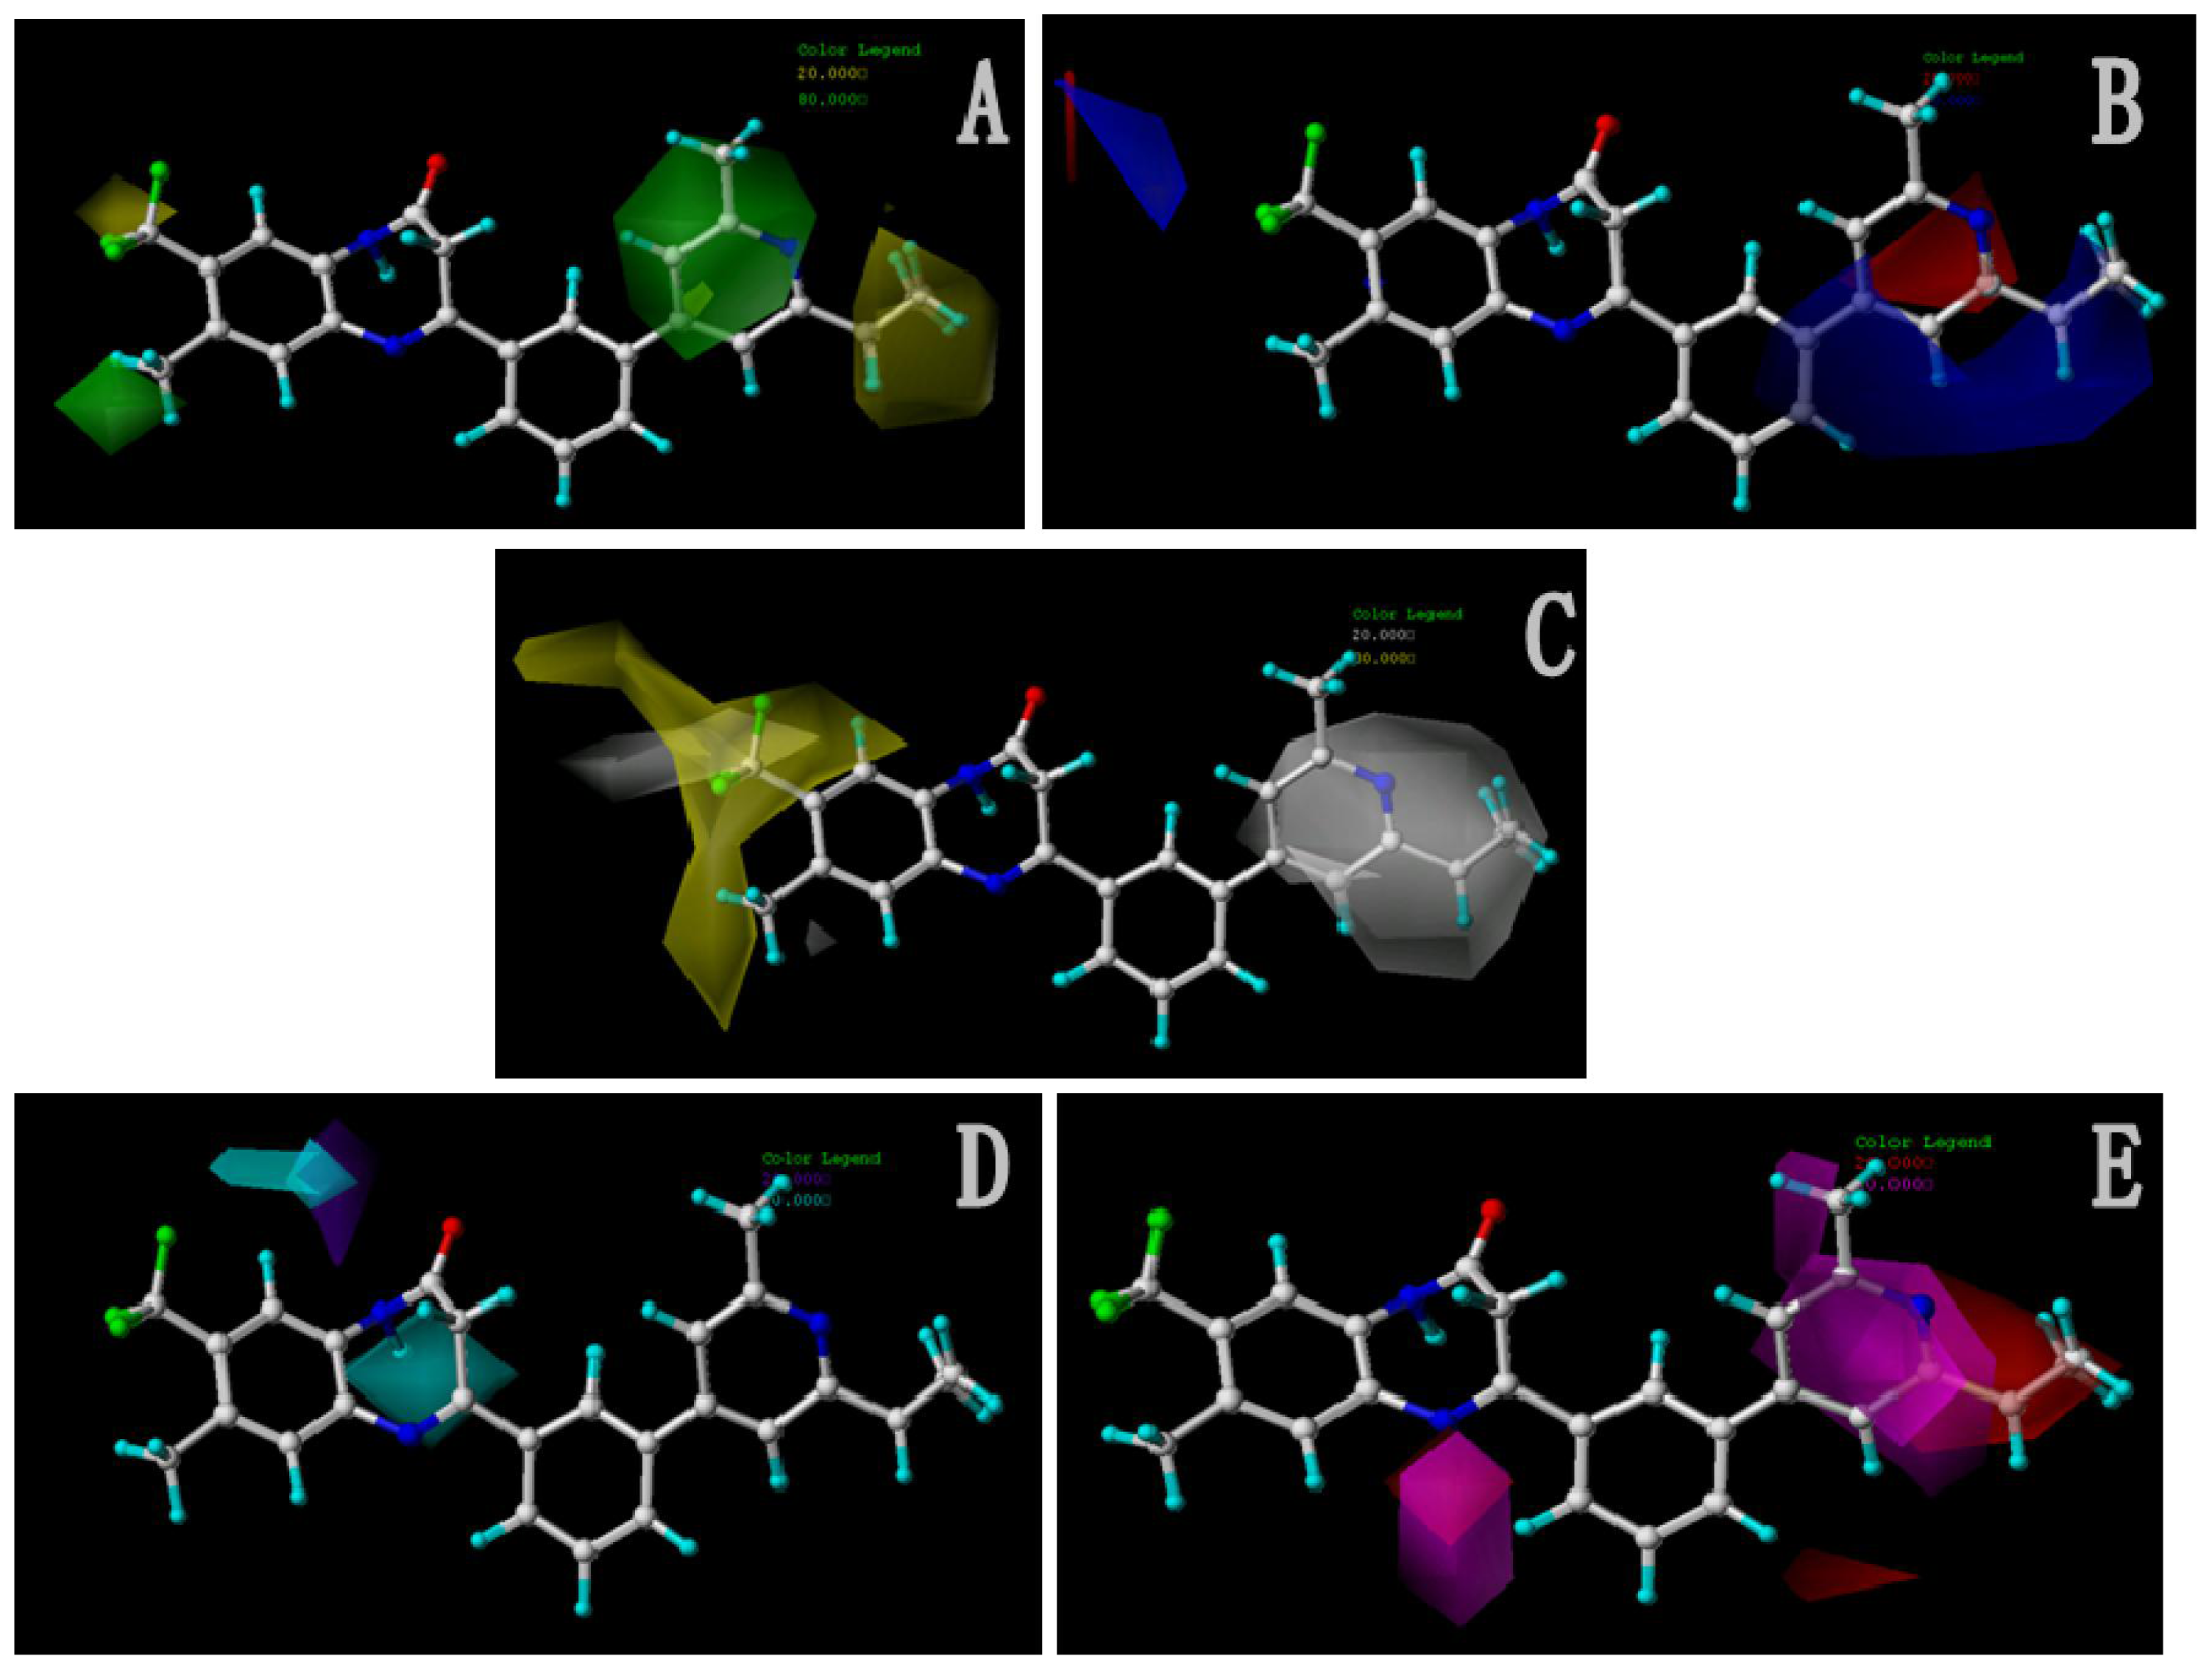
Table 2) were generated using the most active 50 antagonists with no omitting for activity I studies. Model_001 (
Figure 5A) was selected for subsequent studies despite its second highest score value (1.8562) because it has useful features of a higher diversity compared with model_002 (
Figure 5B), which possesses the highest score (2.3577).
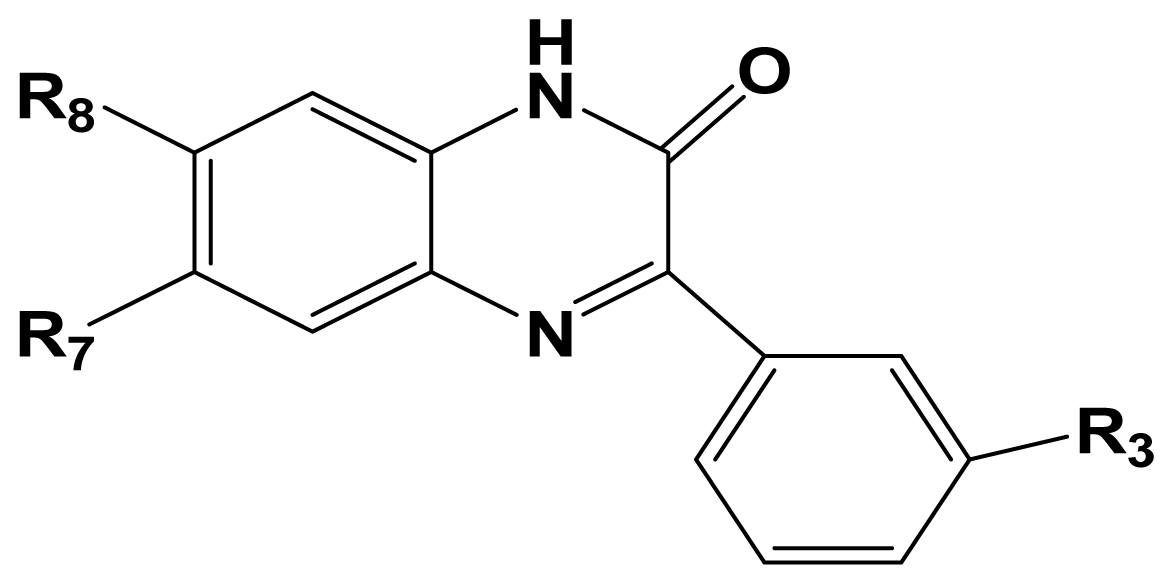
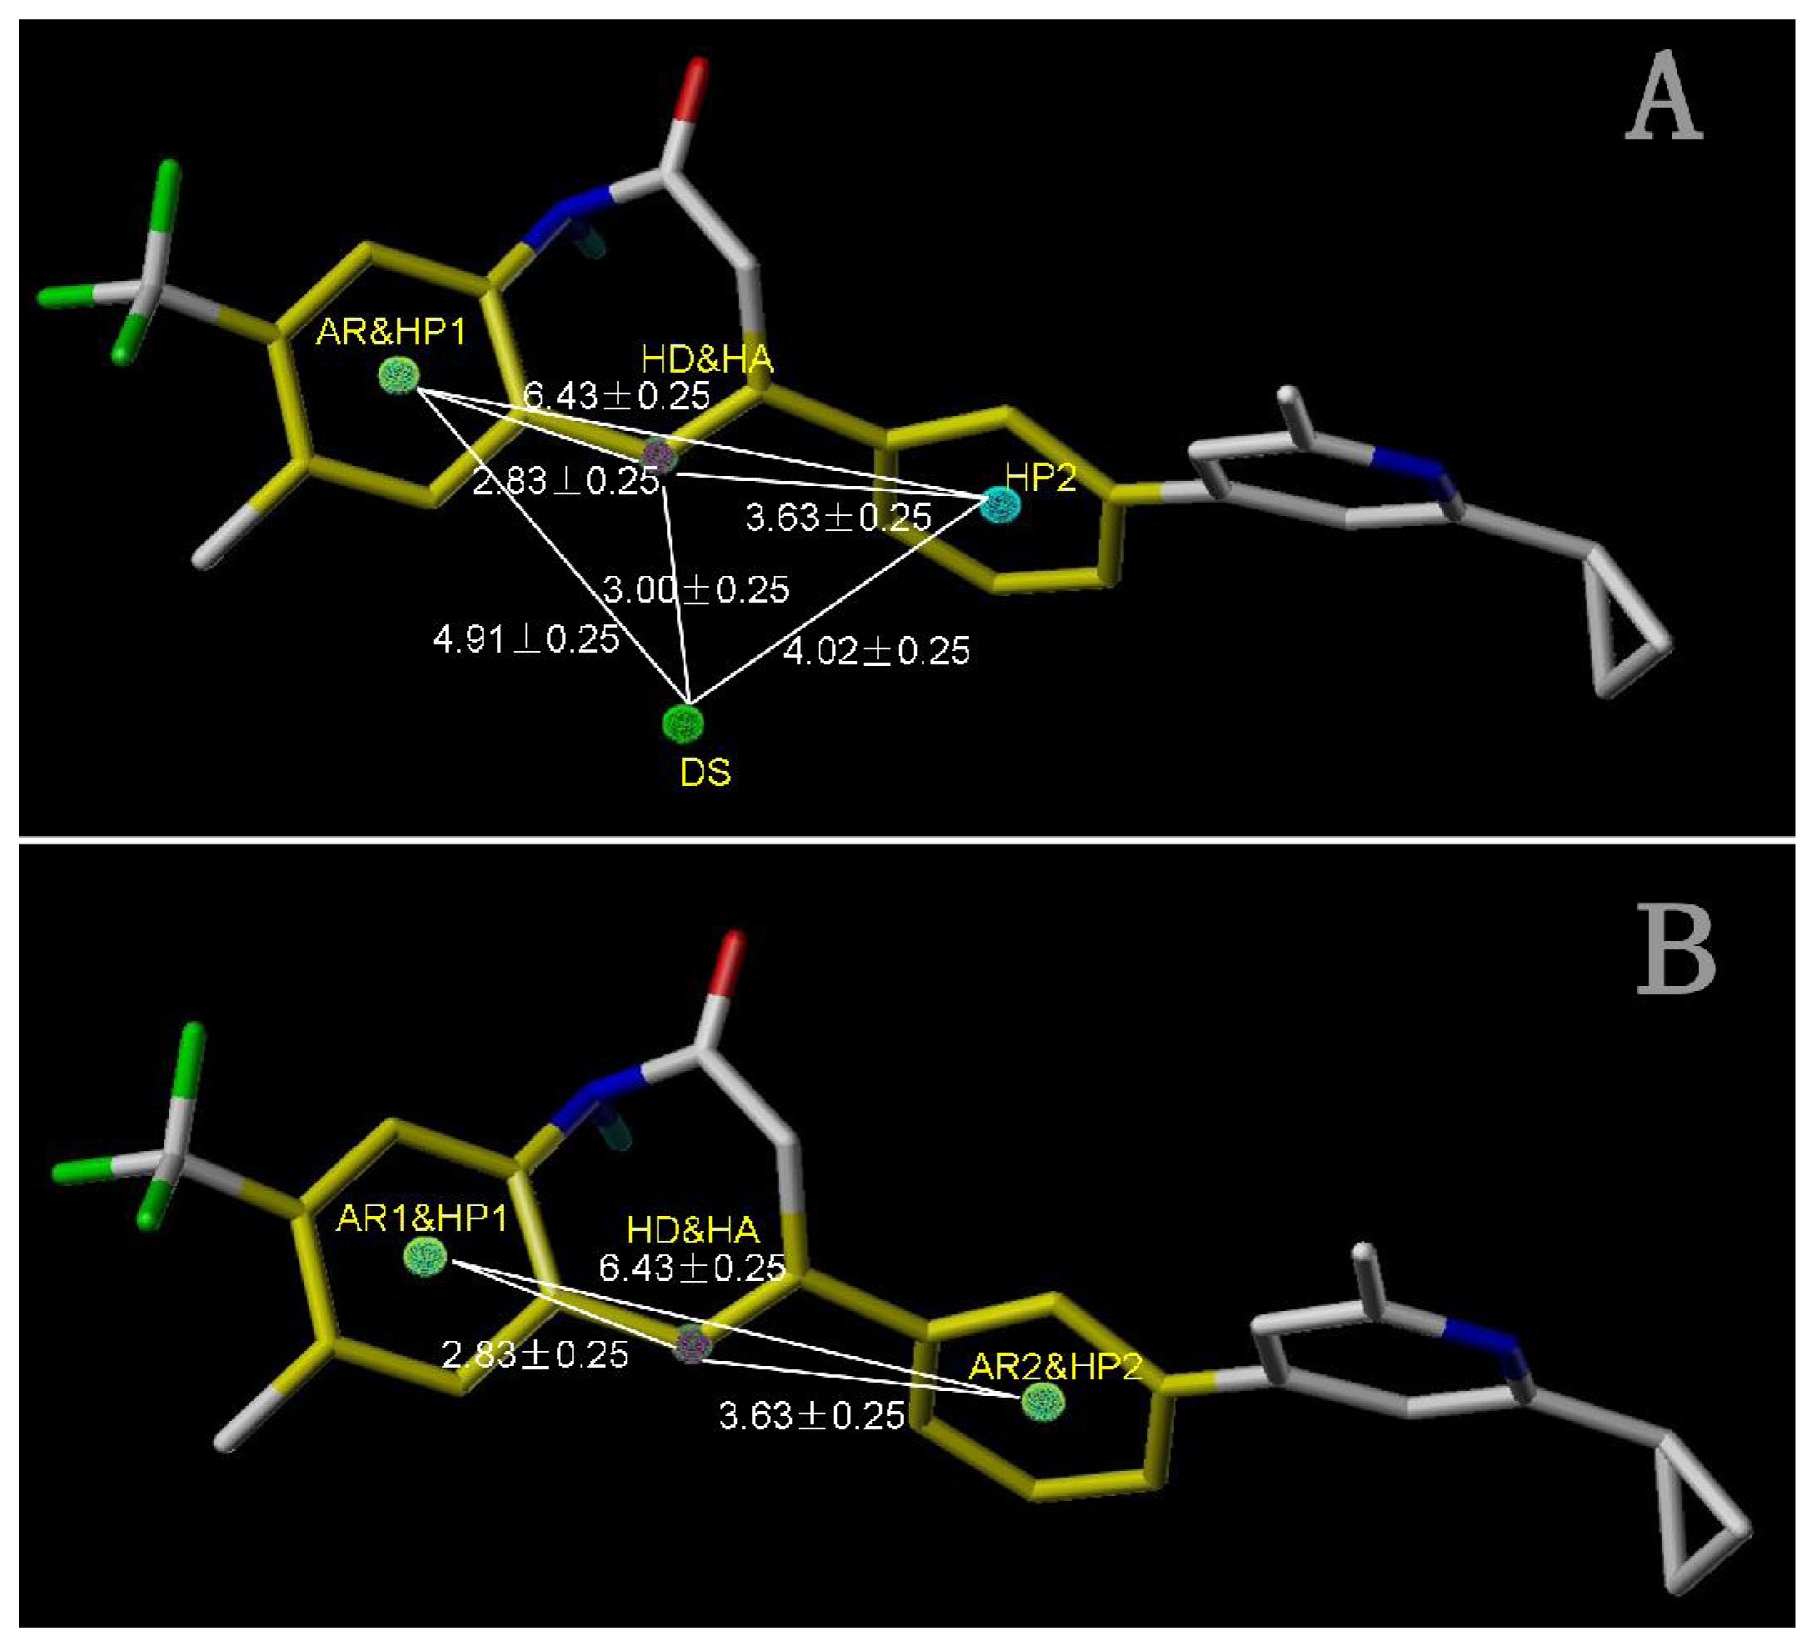
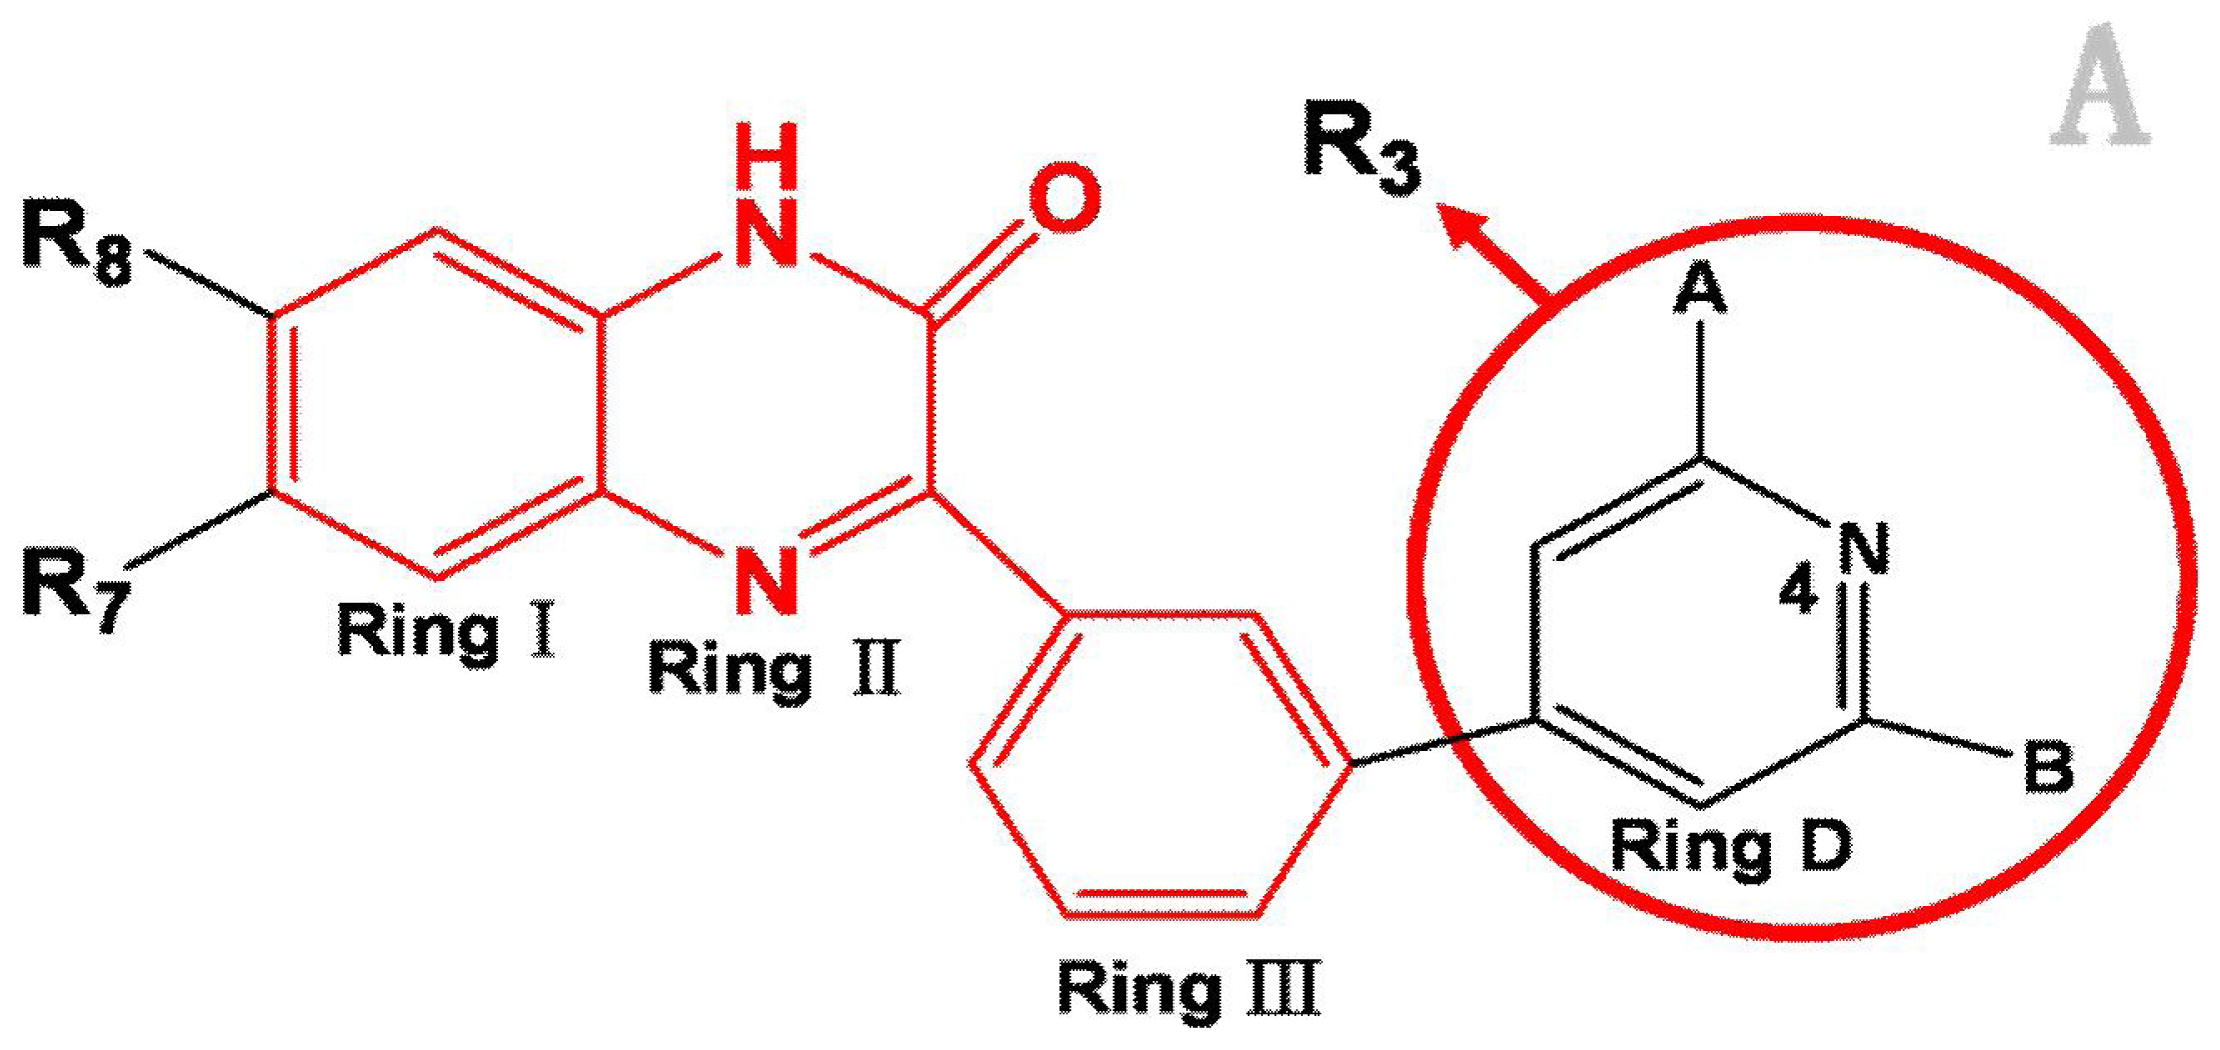
Figure 5A shows the optimal pharmacophore model (model_001) obtained with a score of 1.8562 and tolerance distance of 0.25 Å. The model has six essential features required for high receptor binding affinity, which contain two hydrophobic sites (HP1 and HP2), an H-bond donor atom (HD), an H-bond donor site (DS), one H-bond acceptor atom (HA) and an aromatic center (AR). The distances between these pharmacophoric features are listed in
Table 3. Two aromatic ring (ring I and ring III), a heterocyclic ring (ring II) containing N and a constrained conformation features are common in all the 50 chemicals. The hydrophobic center and the planar group serve as the rigid portion of the molecular scaffold that satisfies the overall geometric and steric requirements of binding.
This model has the characteristic features required for an ideal pharmacophoric query, because it possesses the important interactions required for this series of antagonists and was consistent with previously reported scaffold of potent antagonists [
12]. Closer inspection of the pharmacophore model reveals that H-bond donor and H-bond acceptor atoms were in agreement with the results from the CoMSIA model. To be considered as a hit, a compound has to fit all the features of the pharmacophore model consequently.
2.4.2. Pharmacophore Model for Activity II
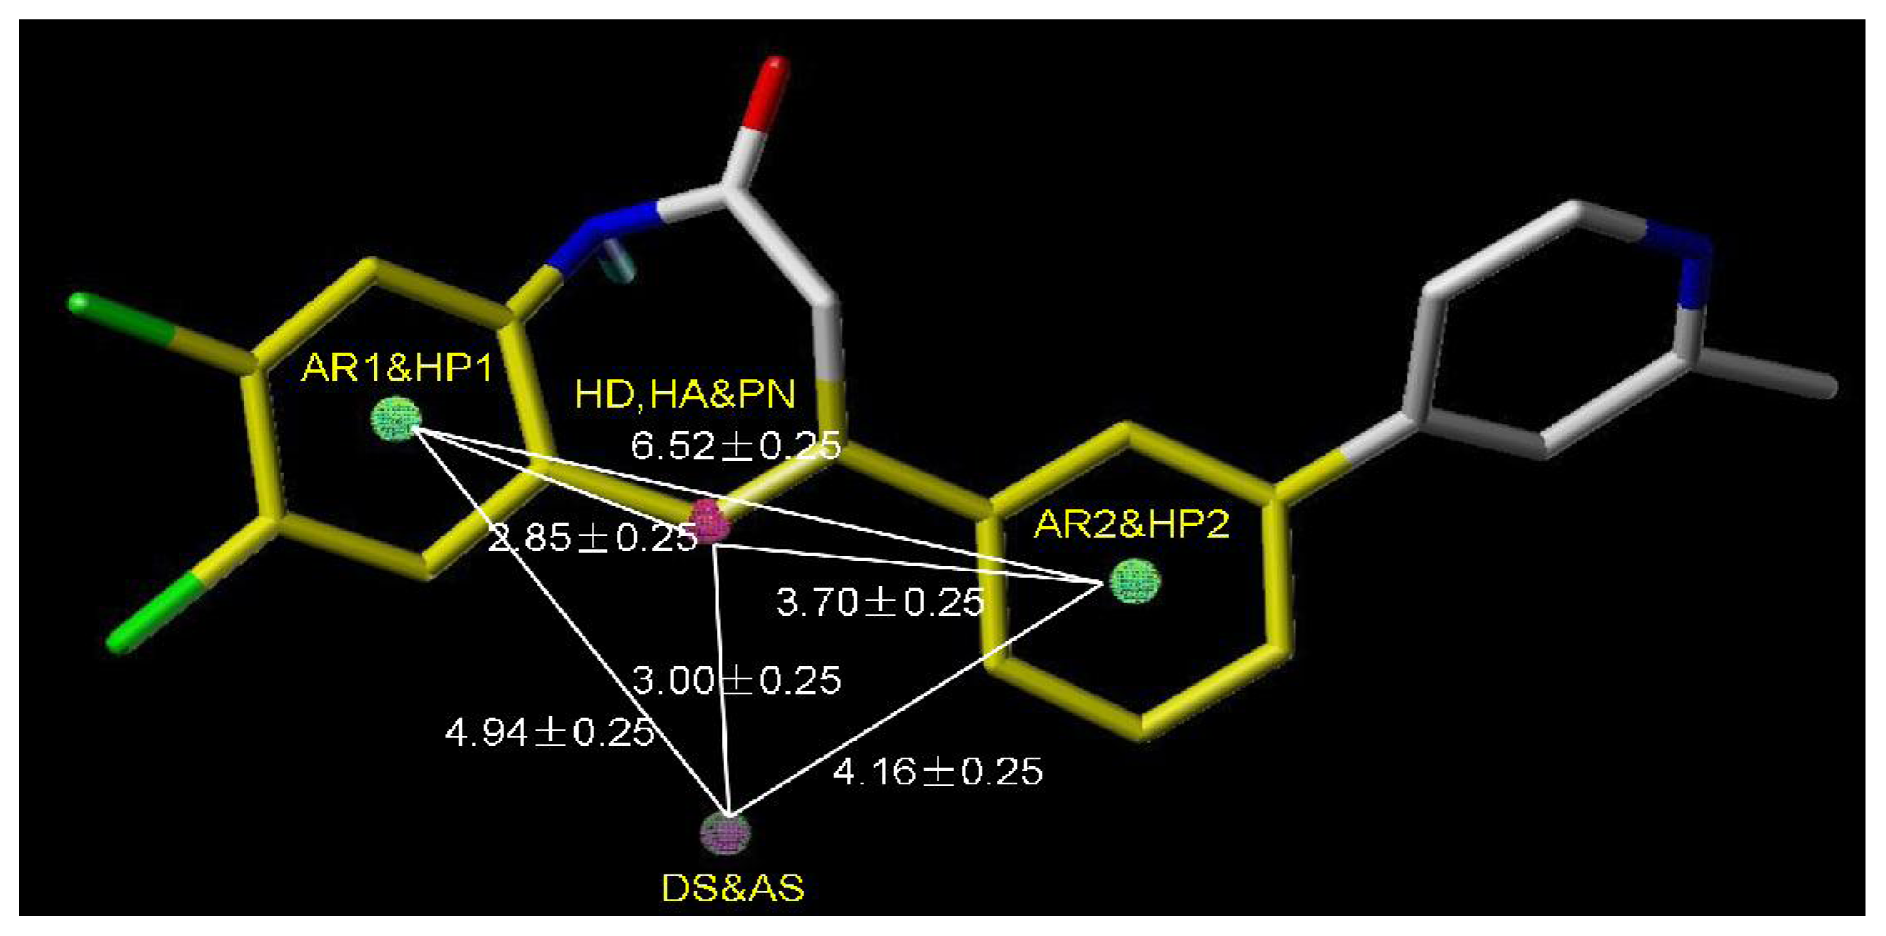
For activity II studies, based on 50 compounds of high antagonistic activity, only one model was obtained with a score of 1.8286 (as shown in
Table 4) and tolerance of 0.25 Å. Nine essential features are observed in this model required for the high antagonistic activity, including two hydrophobic sites (HP1 and HP2), an H-bond donor atoms (HD), one H-bond donor site (DS), one H-bond acceptor site (AS), one H-bond acceptor atom (HA), one positive N (PN) and two aromatic centers (AR1 and AR2).
Figure 6 shows the pharmacophoric features generated in this model, with the most active compound
8av for activity II as reference. The distances between these pharmacophoric features are listed in
Table 5.
An additional positive N, an acceptor site and an aromatic center are generated besides those similar features shared with the pharmacophore model generated previously for activity I, indicating a necessity of the presence of positive N and acceptor atom for the synthesis of potent mGluR2 antagonists that perform well in cAMP test. Compounds contain all the nine features of the pharmacophore model are supposed to be more capable of performing antagonistic activity towards mGluR2.
For both activity I and II studies, pharmacophore features derived are in range of the tricycle scaffold. This indicates that the basic scaffold features participate significantly in the pharmacologic effect of the antagonist. Using the models developed, a new effective scaffold that contains these phamacophore features can be synthesized. In addition, CoMFA and CoMSIA contour maps derived denote the favorable features of substituents. With a combination of phamacophore features and CoMFA, CoMSIA contour maps, new potent antagonists can be designed.
2.5. Comparison between the Two Activities
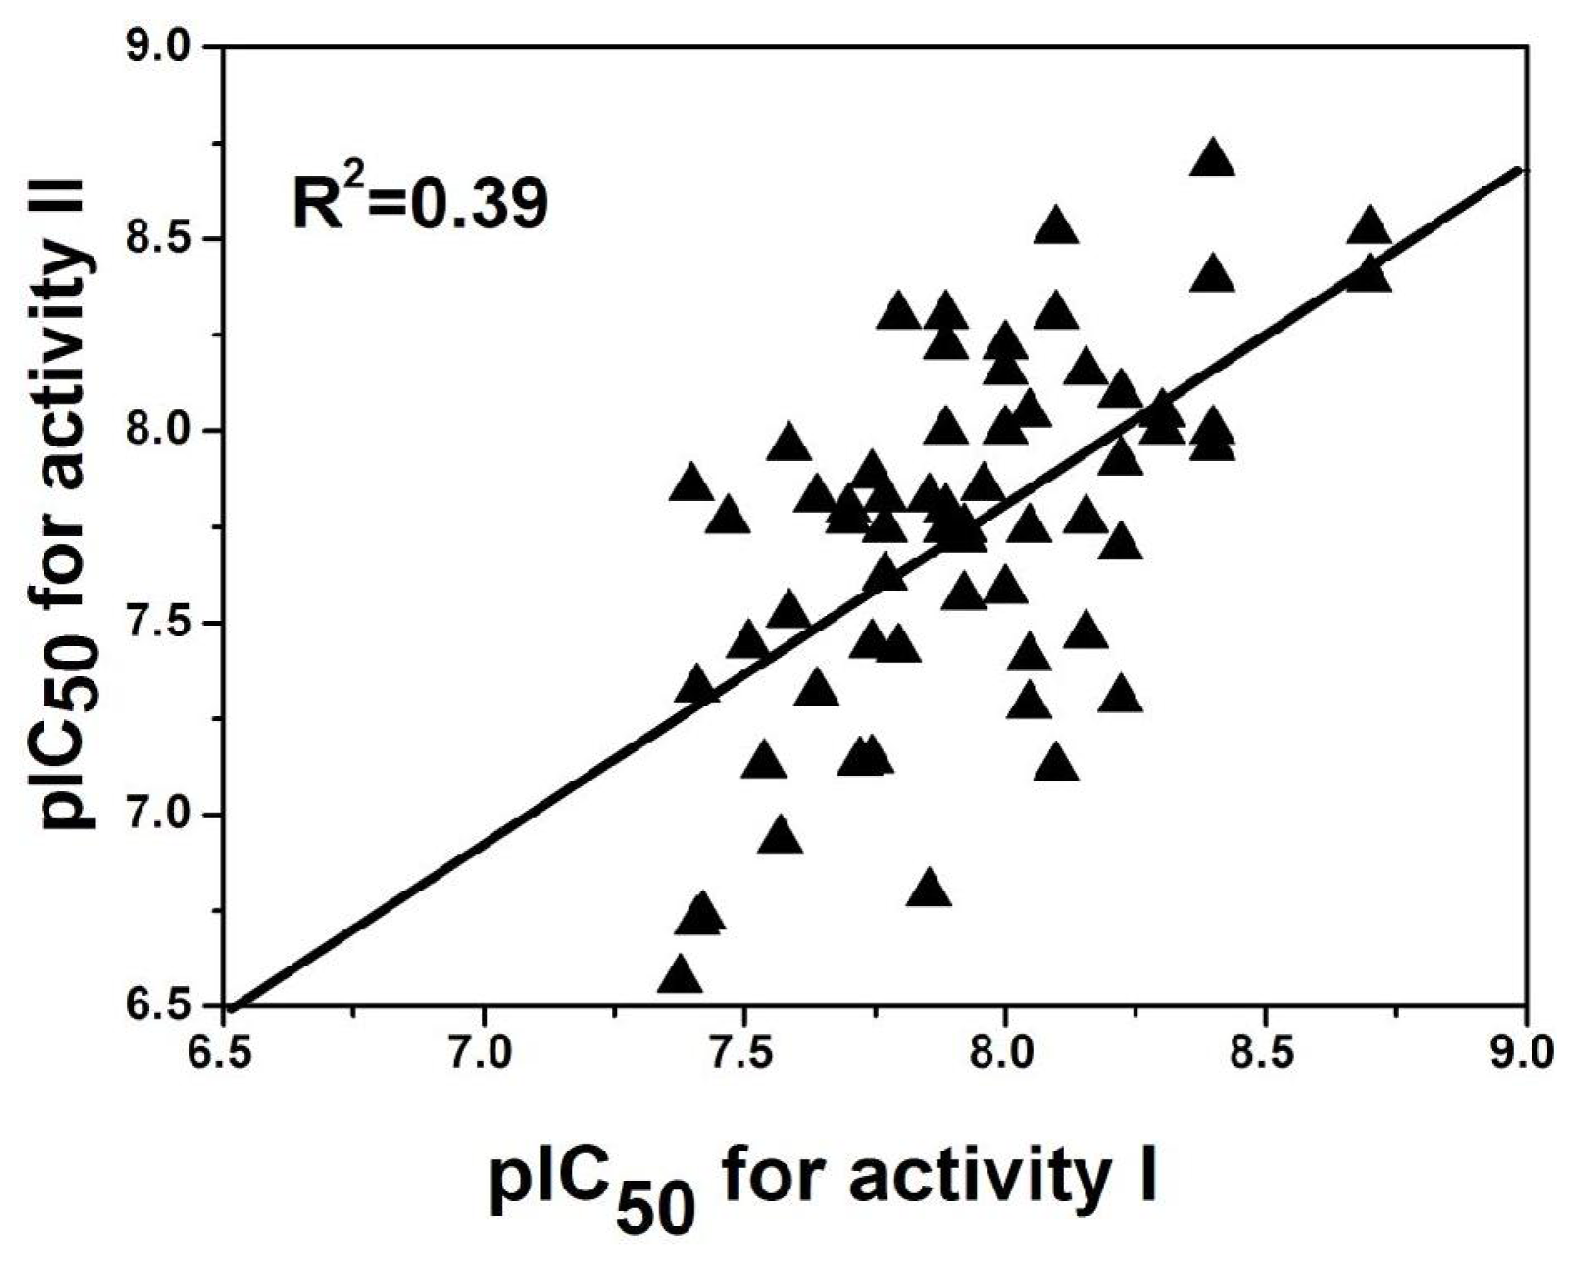
Out of the 137 compounds employed in the investigation, 69 have both antagonistic activity I and II. To explore the possible relationship of the two potencies, a mathematical model is established and its corresponding plot using activity I and II as the X and Y coordinate respectively is drawn (
Figure 7) based on these molecules. Clearly, a good linear correlationship is observed between the two activities with a correlation coefficient of
R2 = 0.39. This may suggests that the activities of these antagonist in radioligand binding studies (Rat mGluR2 [
3H]-LY354740 binding, activity I) and in functional Cyclase Inhibition Assay (cAMP assay, activity II), though differ considerably, correlate with each other to a significant extent. The prediction that the binding ratio reflected the functional efficacy of a compound was also supported by measurement of the ability of a number of compounds acting at dopamine receptors to inhibit rD2(444)-mediated inhibition of cyclic AMP production [
24]. However, the pIC
50 value of the two activities still differs from each other, due to the different mechanism of cAMP production and binding assay: Radioligand binding studies and cAMP assay are two strategies in drug screening technology to investigate the activity of a ligand. cAMP assay is based on a second messenger and assesses the antagonistic activity of a ligand through the level of cAMP. That enables us to appreciate the molecular features of inhibition by the regulatory subunits as well as the activation by cAMP [
25]. Radioligand binding studies do not involve the signal path, but directly investigate into the interaction between the radiolabelled ligands and the receptor. The first objective in binding assay is to ensure that the binding equilibrium is reached. Then K
D, a parameter to describe the affinity of a ligand for a receptor can be calculated [
26].
In general, CoMFA and CoMSIA statistic results for the two activities differ in several aspects. (I) The best models for activity I employ all field descriptors in both CoMFA and CoMSIA (steric and electrostatic in CoMFA and steric, electrostatic, hydrophobic, H-donor, H-acceptor in CoMSIA) analyses. While for activity II, optimal model contains only electrostatic field in CoMFA analysis; (II) Steric field exerts deeper influence on activity I rather than activity II, for in activity I study, it contributes considerable percentages in both CoMFA (48.8%) and CoMSIA (11.2%) analysis. However, for activity II study, neither the best CoMFA model nor the best CoMSIA model employs steric field as a contributor to the variance of the activity; (III) Electrostatic field clearly plays a dominant role in the variance of activity II, while for activity I, more factors including steric field, hydrophobic field, H-donor and H-acceptor field contribute to the variance of activity of the series of antagonists; (IV) The hydrophobicity of a antagonist exerts more influence on its activity II rather than activity I for two reasons. Firstly, hydrophobic field plays more essential role in the later one on improving the value of statistical parameters (Q2, R2 ncv, R2 pre) that are crucial for evaluating the reliability of the model. Thus, in the best CoMSIA models, hydrophobic field contributes a higher percentage to activity II (40.9%). Furthermore, ClogP, which is a well established measure of the compound’s hydrophobicity. Thus, it contributes more in cAMP functional assay (activity II), with 8.3% (activity II) over 5.1% (activity I) in CoMFA and 13.6% (activity II) over 3.5% (activity I) in CoMSIA. These differences in statistic result may result from the difference in mechanism of the two experiments revealing the activity of the antagonist.
From the differences above, we may conclude that factors like the steric feature, electrostatic feature, hydrophobicity of a function group all need to be considered to best improve the performance of the antagonists in radioligand binding assay. However, simply confusing on the electrostatic character as well as the hydrophobicity of the substituents may help design drugs showing potent antagonism in cAMP assay.
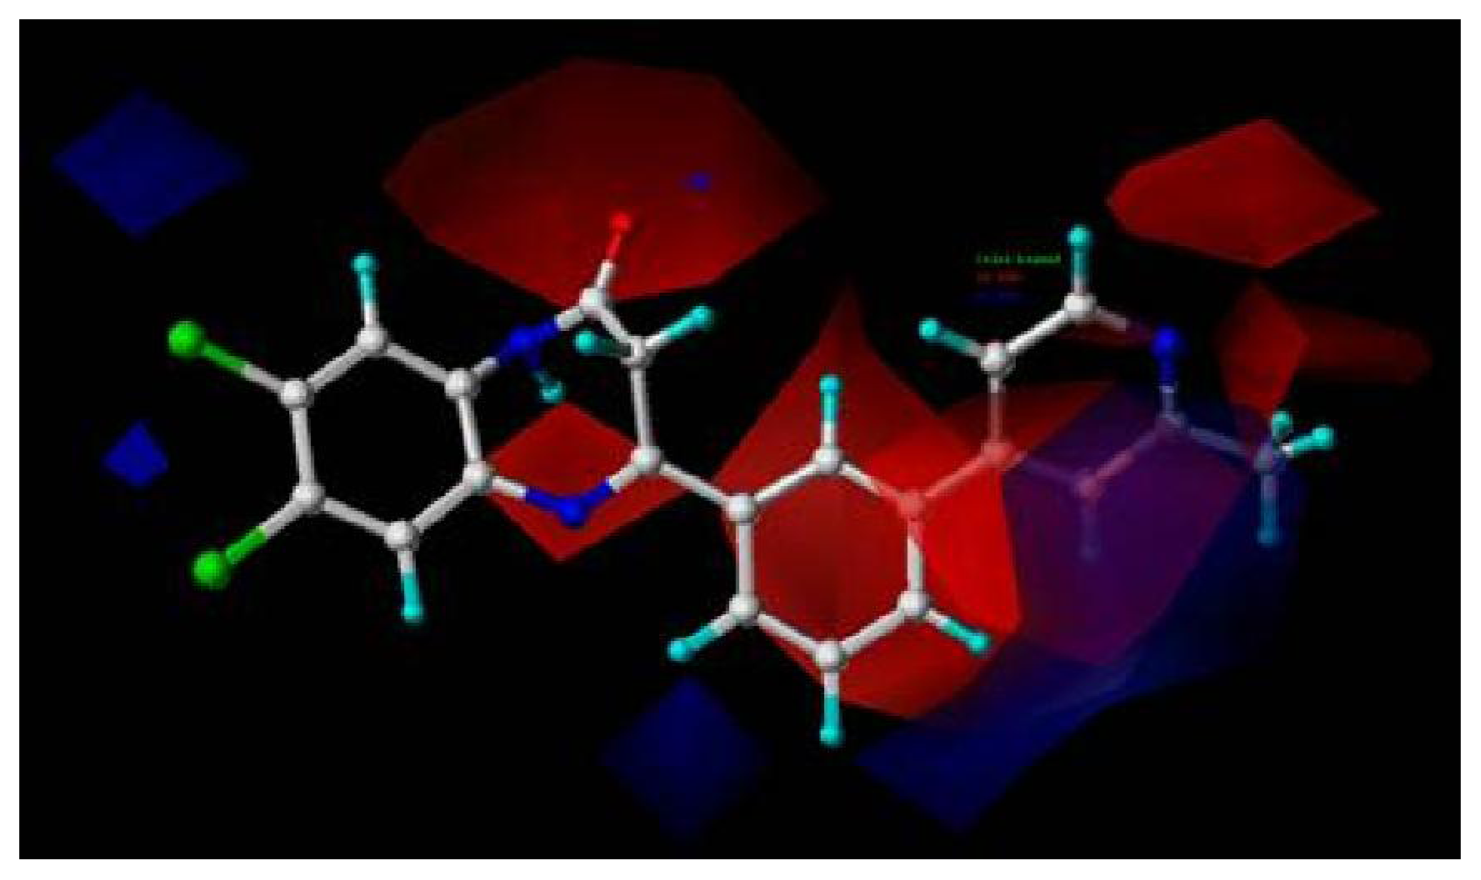
Analysis of the 3D-QSAR contour maps derived from activity I and activity II suggest that they generally have very similar structural requirements for potent ligands. The electrostatic contour maps all indicate that electropositive groups above N atom at position 4 of ring D will benefit the potency of the antagonist. Moreover, a large blue contour partially encompassing the pyridine ring is observed in all four of the contour maps. Still, a subtle difference exists: electropositive groups above the O atom of ring II decrease the activity I while favor the activity II. Also, large red contour around the N atom of ring II suggests a favor for electropositive substituents or atoms. These differences and similarities in molecular structural features of potent antagonists may help increasing or reducing the activity of the compound by changing its substituents.
In addition, the pharmacophore models derived from the two activities generally share the same features, excepting for a few difference. An H-donor atom, an H-donor acceptor atom, an H-donor site, two hydrophobic centers and an aromatic ring are common features for the two models. Besides, for pharmacophore model of activity II, a positive N, an H-bond acceptor site and an additional aromatic ring are featured as essential characters of potent drugs. Thus, here the active sites shared by the two models are considered fundamental pharmacophore features for potent mGluR2 antagonists. The highly similarity of the two models may reflect the predict ability of radioligand binding assay towards pharmacophore function of the antagonists. These models can be used as guidance for the design of new mGluR2 antagonists of high activity and selectivity.


