Spectroscopic Study of Solvent Effects on the Electronic Absorption Spectra of Flavone and 7-Hydroxyflavone in Neat and Binary Solvent Mixtures

Abstract
:1. Introduction
2. Results and Discussion
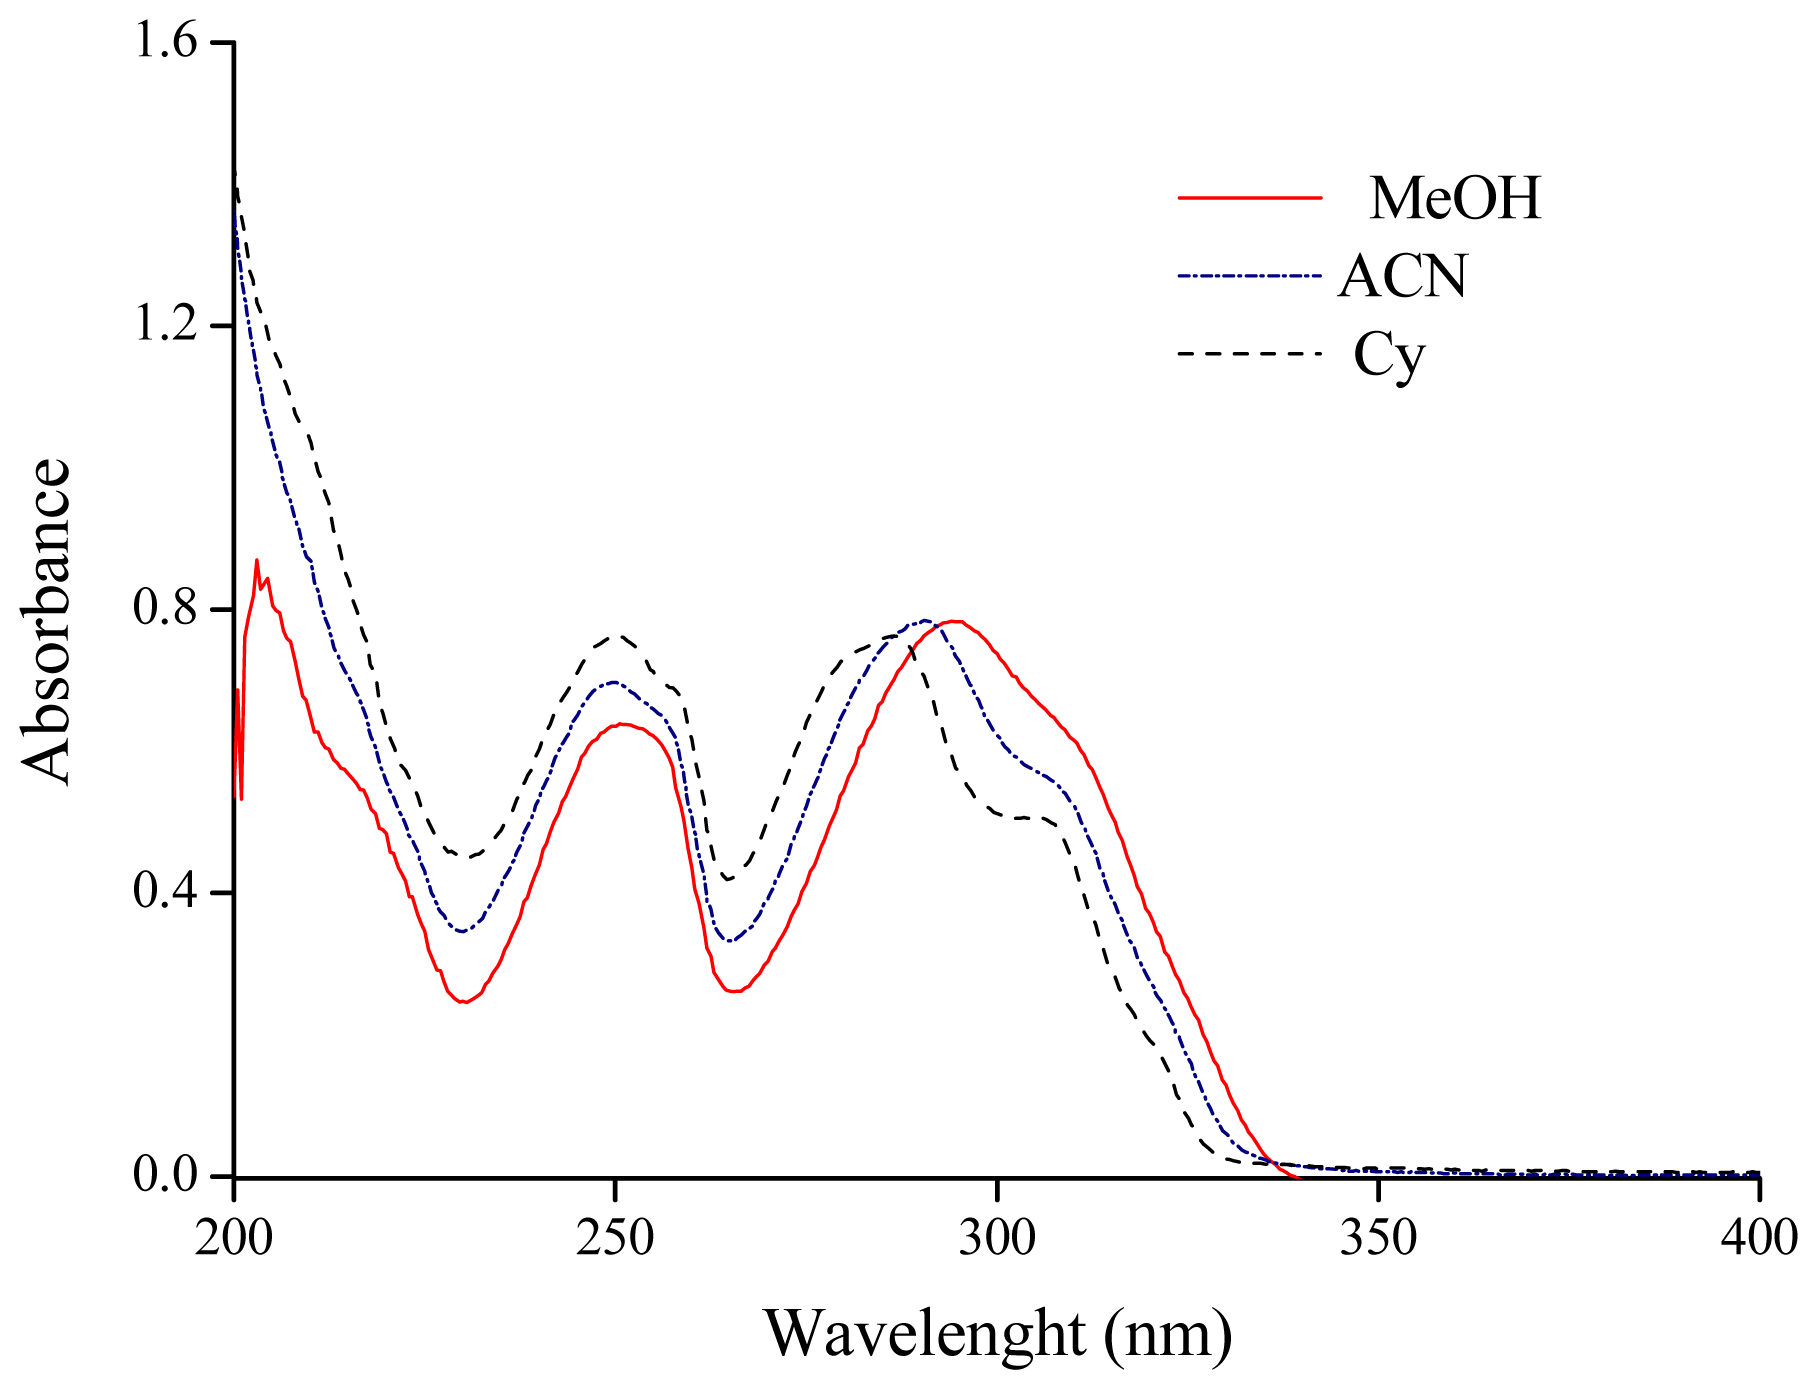
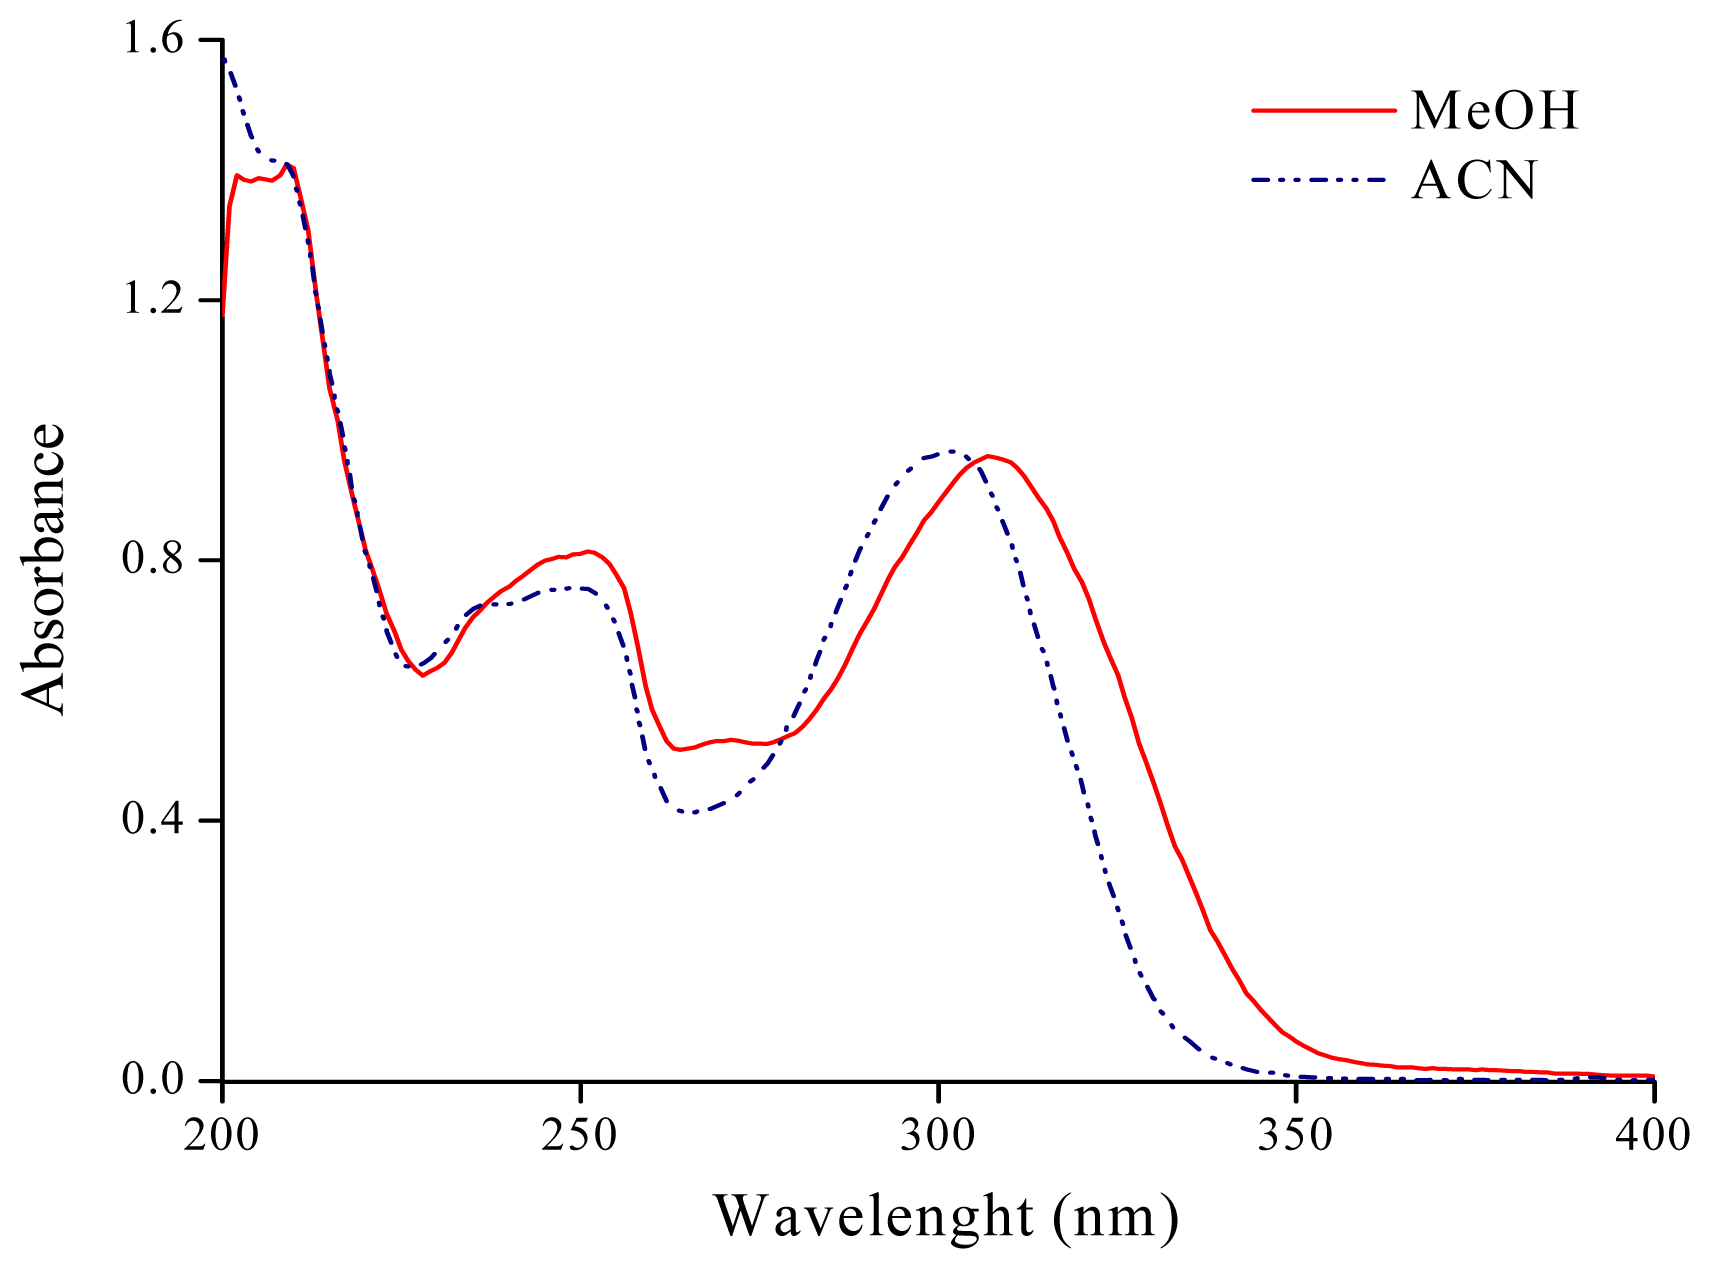
2.1. Solvatochromism of F and 7HF in Single Solvents
2.2. Solvatochromism of F and 7HF in Binary Solvent Mixtures
3. Experimental Section
3.1. Chemicals and Reagents
3.2. Procedures
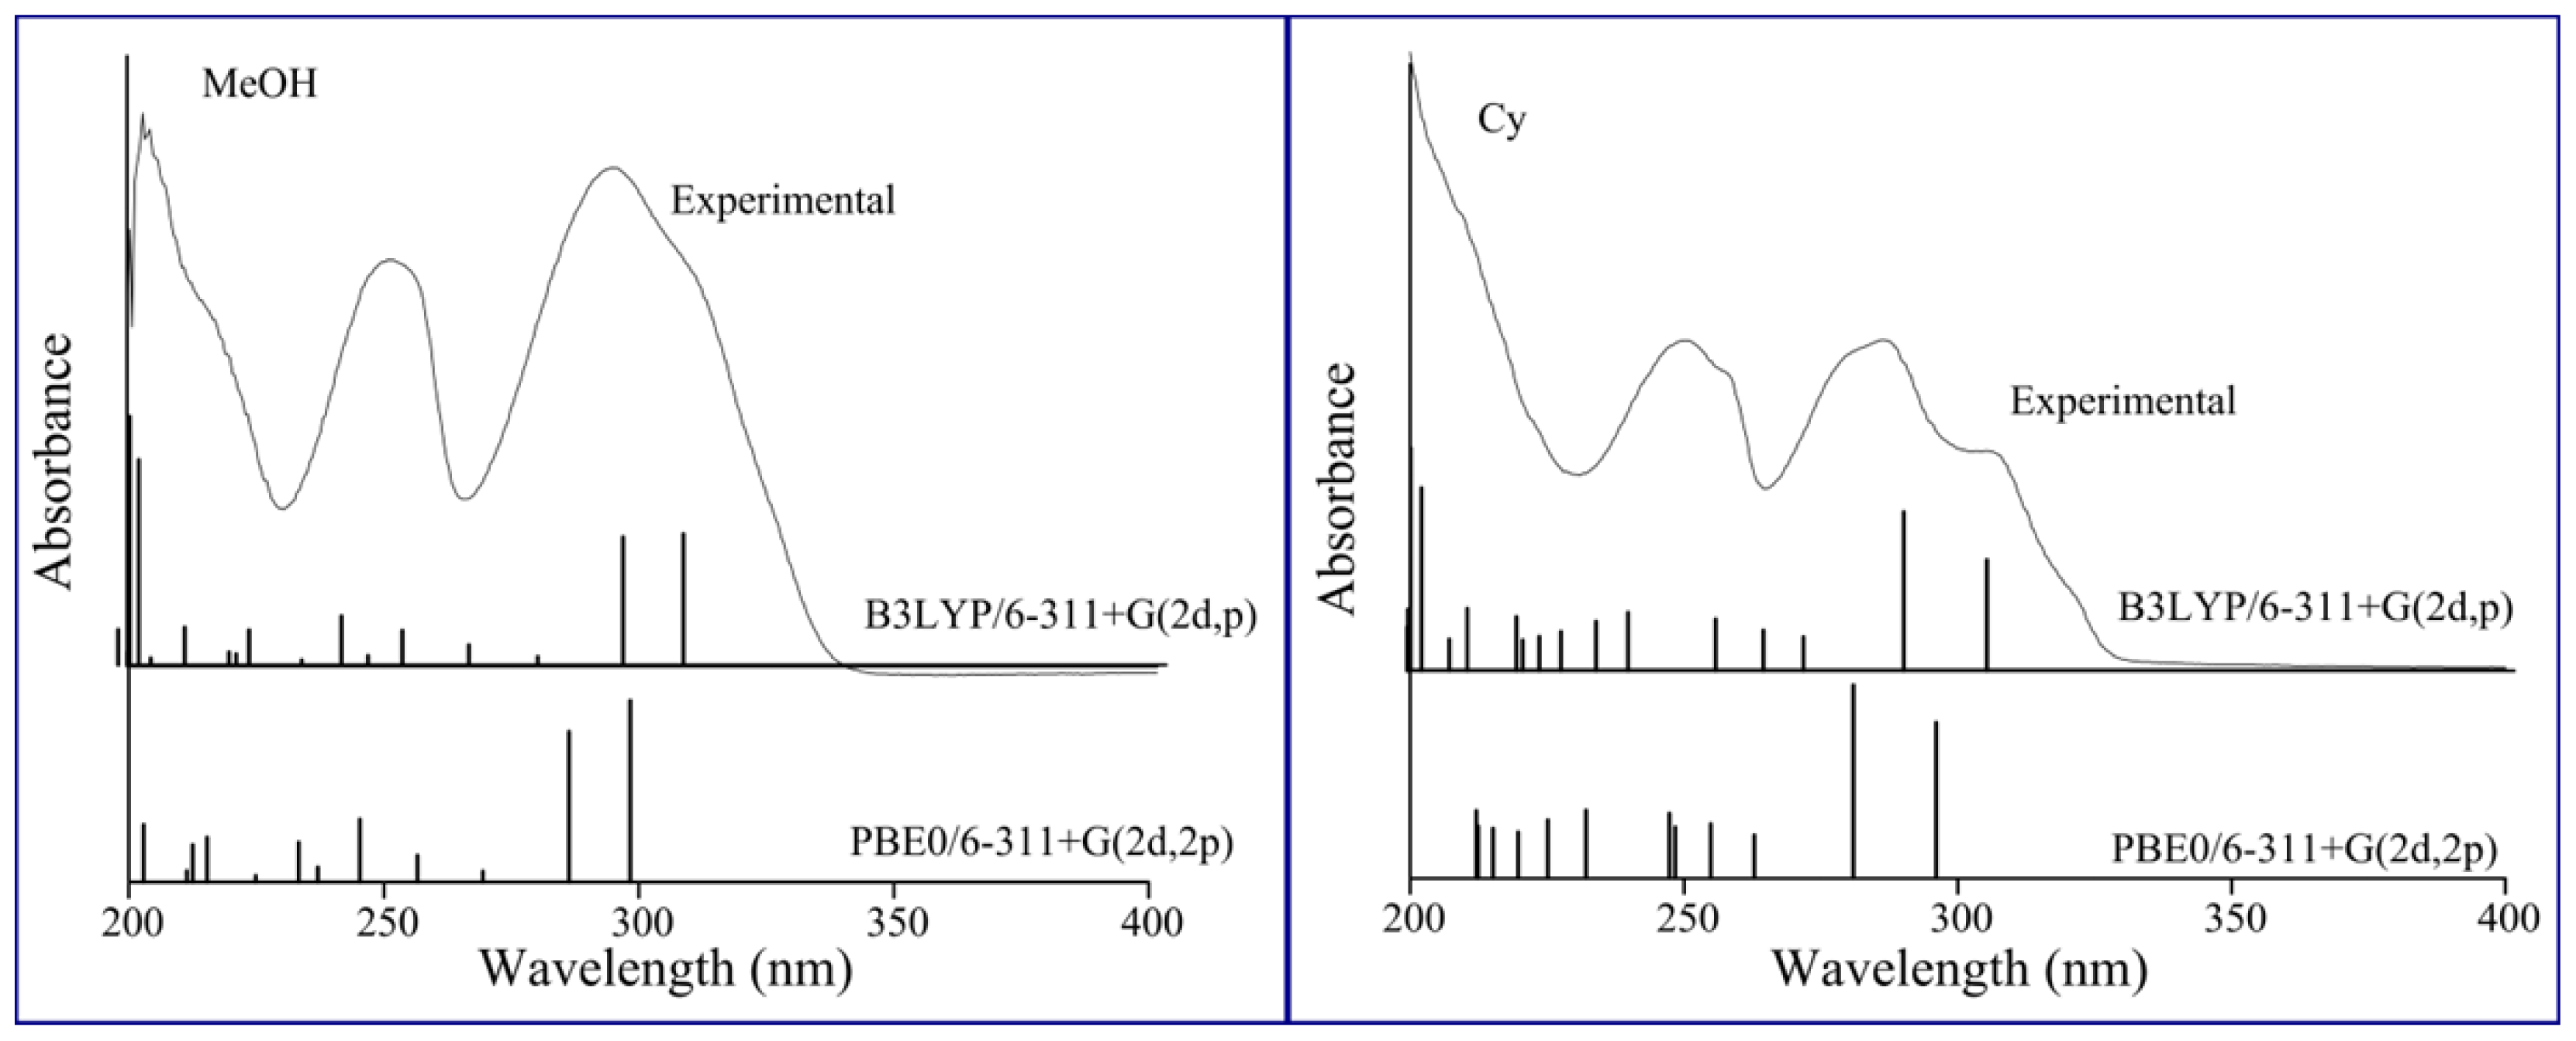
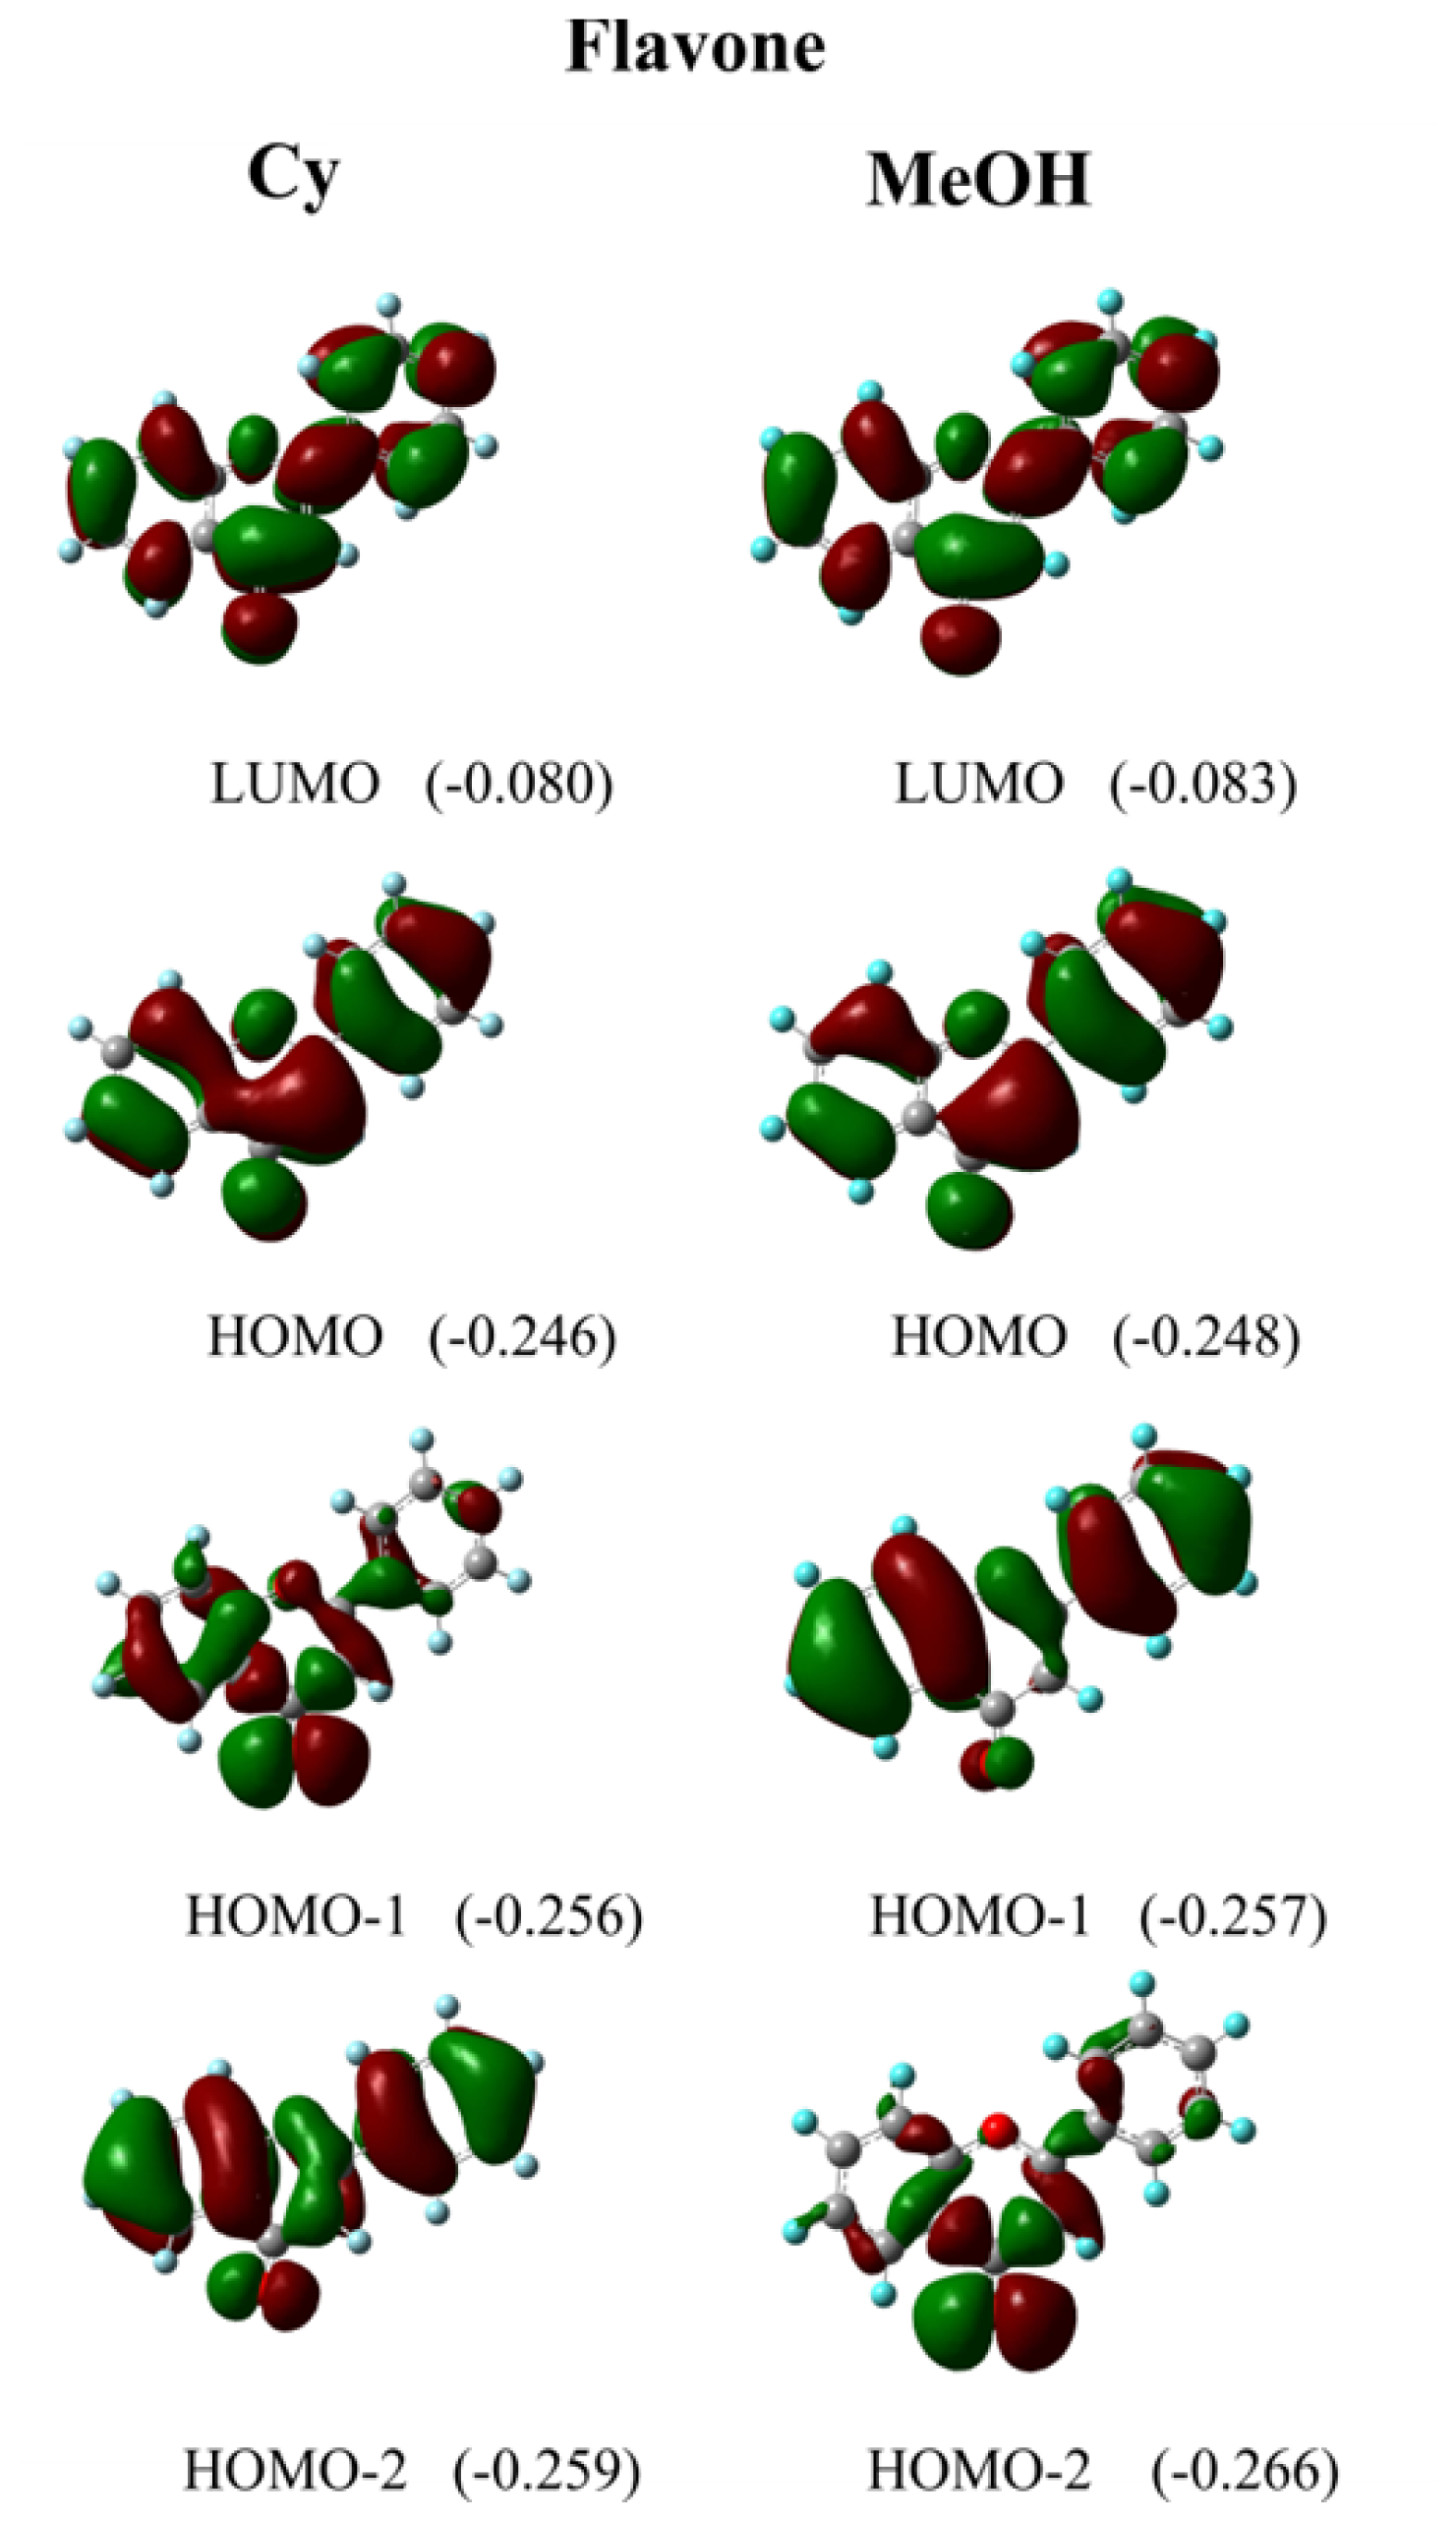
4. Computational Details
5. Conclusions
Supplementary Material
ijms-12-08895-s001.pdfAcknowledgments
References
- de Almeida, K.J.; Ramalho, T.C.; Rinkevicius, Z.; Vahtras, O.; Ågren, H.; Cesar, A. Theoretical study of specific solvent effects on the optical and magnetic properties of copper(II) acetylacetonate. J. Phys. Chem. A 2011, 115, 1331–1339. [Google Scholar]
- Kosenkov, D.; Slipchenko, L.V. Solvent effects on the electronic transitions of p-nitroaniline: A QM/EFP study. J. Phys. Chem. A 2011, 115, 392–401. [Google Scholar]
- Sidir, Y.G.; Sidir, I.; Taal, E.; Ermi, E. Studies on the electronic absorption spectra of some monoazo derivatives. Spectrochim. Acta A 2011, 78, 640–647. [Google Scholar]
- Adegoke, O.A.; Olakunle, S.I. Solvatochromic behaviours and structure–spectra relationships of 4-carboxyl-2,6-dinitrophenylazohydroxynaphthalenes. Spectrochim. Acta A 2010, 75, 719–727. [Google Scholar]
- Baughman, B.M.; Stennett, E.; Lipner, R.E.; Rudawsky, A.C.; Schmidtke, S.J. Structural and spectroscopic studies of the photophysical properties of benzophenone derivatives. J. Phys. Chem. A 2009, 113, 8011–8019. [Google Scholar]
- Han, W.; Liu, T.; Himo, F.; Toutchkine, A.; Bashford, D.; Hahn, K.M.; Noodleman, L. A theoretical study of the UV/Visible absorption and emission solvatochromic properties of solvent-sensitive dyes. Chemphyschem 2003, 4, 1084–1094. [Google Scholar]
- Józefowicz, M.; Kozyra, K.A.; Heldt, J.R.; Heldt, J. Effect of hydrogen bonding on the intramolecular charge transfer fluorescence of 6-dodecanoyl-2-dimethylaminonaphtalene. Chem. Phys 2005, 320, 45–53. [Google Scholar]
- Taft, R.W.; Kamlet, M.J. The solvatochromic comparison method. 2. The α-scale of solvent hydrogen-bond donor (HBD) acidities. J. Am. Chem. Soc 1976, 98, 2886–2894. [Google Scholar]
- Kamlet, M.J.; Doherty, R.; Taft, R.; Abraham, M. Linear solvation energy relationships. 26. Some measures of relative self-association of alcohols and water. J. Am. Chem. Soc 1983, 105, 6741–6743. [Google Scholar]
- Rice-Evans, C. Flavonoid antioxidants. Curr. Med. Chem 2001, 8, 797–807. [Google Scholar]
- Zeng, W.C.; Jia, L.R.; Zhang, Y.; Cen, J.Q.; Chen, X.; Gao, H.; Feng, S.; Huang, Y.N. Antibrowning and antimicrobial activities of the water-soluble extract from pine needles of Cedrus deodara. J. Food Sci 2011, 76, C318–C323. [Google Scholar]
- Martins, L.R.R.; Brenzan, M.A.; Nakamura, C.V.; Filho, B.P.D.; Nakamura, T.U.; Cortez, L.E.R.; Cortez, D.A.G. In vitro antiviral activity from Acanthospermum australe on herpesvirus and poliovirus. Pharm. Biol 2011, 49, 26–31. [Google Scholar]
- Larson, A.J.; Symons, J.D.; Jalili, T. Quercetin: A treatment for hypertension?—A review of efficacy and mechanisms. Pharmaceuticals 2010, 3, 237–250. [Google Scholar]
- ArunaDevi, R.; Lata, S.; Bhadoria, B.K.; Ramteke, V.D.; Kumar, S.; Sankar, P.; Kumar, D.; Tandan, S.K. Neuroprotective effect of 5,7,3′,4′,5′-pentahydroxy dihydroflavanol-3-O-(2″-O-galloyl)-β-d-glucopyranoside, a polyphenolic compound in focal cerebral ischemia in rat. Eur. J. Pharmacol 2010, 626, 205–212. [Google Scholar]
- Vitorino, J.; Sottomayor, M.J. DNA interaction with flavone and hydroxyflavones. J. Mol. Struct 2010, 975, 292–297. [Google Scholar]
- Košmrlj, B.; Šket, B. Photocyclization of 2-chloro-substituted 1,3-diarylpropan-1,3-diones to flavones. Org. Lett 2007, 9, 3993–3996. [Google Scholar]
- Norikane, Y.; Itoh, H.; Arai, T. Photophysical properties of 5-hydroxyflavone. J. Photochem. Photobiol. A 2004, 161, 163–168. [Google Scholar]
- Sarkar, M.; Sengupta, P.K. Influence of different micellar environments on the excited-state proton-transfer luminescence of 3-hydroxyflavone. Chem. Phys. Lett 1991, 179, 68–72. [Google Scholar]
- Józefowicz, M.; Heldt, J.R.; Heldt, J. Solvent effects on electronic transitions of fluorenone and 4-hydroxyfluorenone. Chem. Phys 2006, 323, 617–621. [Google Scholar]
- Sasirekha, V.; Umadevi, M.; Ramakrishnan, V. Solvatochromic study of 1,2-dihydroxyanthraquinone in neat and binary solvent mixtures. Spectrochim. Acta A 2008, 69, 148–155. [Google Scholar]
- Moyon, N.S.; Chandra, A.K.; Mitra, S. Effect of solvent hydrogen bonding on excited-state properties of luminol: A combined fluorescence and DFT study. J. Phys. Chem. A 2010, 114, 60–67. [Google Scholar]
- Marcus, Y. The properties of organic liquids that are relevant to their use as solvating solvents. Chem. Soc. Rev 1993, 22, 409–416. [Google Scholar]
- Lide, D.R. Handbook of Chemistry and Physics; CRC Press: New York, NY, USA, 1997–1998; pp. 6–173. [Google Scholar]
- Zhao, W.; Ding, Y.; Xia, Q. Time-dependent density functional theory study on the absorption spectrum of coumarin 102 and its hydrogen-bonded complexes. J. Comput. Chem 2010, 32, 545–553. [Google Scholar]
- Lapouge, C.; Cornard, J.P. Time dependent density functional theory study of electronic absorption properties of lead(II) complexes with a series of hydroxyflavones. J. Phys. Chem. A 2005, 109, 6752–6761. [Google Scholar]
- Ben-Naim, A. Preferential solvation in two-component systems. J. Phys. Chem 1989, 93, 3809–3813. [Google Scholar]
- Frankel, L.S.; Langford, C.H.; Stengle, T.R. Nuclear magnetic resonance techniques for the study of preferential solvation and the thermodynamics of preferential solvation. J. Phys.Chem 1970, 74, 1376–1381. [Google Scholar]
- Chatterjee, P.; Bagchi, S. Preferential solvation of a dipolar solute in mixed binary solvent: A study by UV-visible spectroscopy. J. Phys. Chem 1991, 95, 3311–3314. [Google Scholar]
- Chatterjee, P.; Bagchi, S. Preferential solvation in mixed binary solvents by ultraviolet-visible spectroscopy: N-ethyl-4-cyanopyridinium iodide in alcohol-acetone mixtures. J. Chem. Soc. Faraday Trans 1991, 87, 587–589. [Google Scholar]
- Gaussian 03, version B.01; Gaussian, Inc: Pittsburgh, PA, USA, 2003.
- Becke, A. Density-functional exchange-energy approximation with correct asymptotic behavior. Phys. Rev. A 1988, 38, 3098–3100. [Google Scholar]
- Lee, C.; Yang, W.; Parr, R.G. Development of the Colle-Salvetti correlation-energy formula into a functional of the electron density. Phys. Rev. B 1988, 37, 785–789. [Google Scholar]
- Cancès, E.; Mennucci, B.; Tomasi, J. A new integral equation formalism for the polarizable continuum model: Theoretical background and applications to isotropic and anisotropic dielectrics. J. Chem. Phys 1997, 107, 3032–3041. [Google Scholar]
- Stratmann, R.E.; Scuseria, G.E.; Frisch, M.J. An efficient implementation of time-dependent density-functional theory for the calculation of excitation energies of large molecules. J. Chem. Phys 1998, 109, 8218–8224. [Google Scholar]
- Ernzerhof, M.; Scuseria, G.E. Assessment of the Perdew-Burke-Ernzerhof exchange-correlation functional. J. Chem. Phys 1999, 110, 5029–5036. [Google Scholar]
- Adamo, C.; Barone, V.J. Toward reliable density functional methods without adjustable parameters: The PBE0 model. J. Chem. Phys 1999, 110, 6158–6170. [Google Scholar]
- Preat, J.; Jacquemin, D.; Wathelet, V.; André, J.M.; Parpète, E.A. TD-DFT investigation of the UV spectra of pyranone derivatives. J. Phys. Chem. A 2006, 110, 8144–8150. [Google Scholar]
- Jacquemin, D.; Parpète, E.A.; Assfeld, X.; Scalmani, G.; Frisch, M.J.; Adamo, C. The geometries, absorption and fluorescence wavelengths of solvated fluorescent coumarins: A CIS and TD-DFT comparative study. Phys. Chem. Lett 2007, 438, 208–212. [Google Scholar]


| Flavone | 7(OH)Flavone | |||||||
|---|---|---|---|---|---|---|---|---|
| Solvent | λ | λ× 10−3 | λ | ν̄× 10−3 | ɛ | π* | α | β |
| Cyclohexane (Cy) | 286.1 | 34.95 | NS | 2.023 | 0.00 | 0.00 | 0.00 | |
| n-Heptane (n-Hp) | 286.0 | 34.97 | NS | 1.920 | −0.08 | 0.00 | 0.00 | |
| Carbon tetrachloride (CCl4) | 289.0 | 34.60 | NS | 2.228 | 0.28 | 0.00 | 0.10 | |
| 1,4-Dioxane | 290.1 | 34.47 | 300.0 | 33.33 | 2.219 | 0.55 | 0.00 | 0.37 |
| Acetonitrile (ACN) | 290.4 | 34.44 | 301.5 | 33.17 | 36.64 | 0.75 | 0.19 | 0.40 |
| N,N-Dimethylformamide (DMF) | 292.0 | 34.25 | 305.6 | 32.72 | 38.25 | 0.88 | 0.00 | 0.69 |
| Dimethylsulfoxide (DMSO) | 294.0 | 34.01 | 308.1 | 32.46 | 46.70 | 1.00 | 0.00 | 0.76 |
| Chloroform (CHCl3) | 293.6 | 34.06 | NS | 4.900 | 0.58 | 0.44 | 0.00 | |
| 1-Octanol (1-Oc) | 294.9 | 33.91 | 310.1 | 32.25 | 10.30 | 0.40 | 0.77 | 0.81 |
| 1-Butanol (1-Bu) | 295.0 | 33.90 | 309.4 | 32.32 | 17.84 | 0.47 | 0.84 | 0.84 |
| 2-Propanol (2-Pr) | 294.0 | 34.01 | 308.5 | 32.41 | 20.18 | 0.48 | 0.76 | 0.84 |
| 1-Propanol (1-Pr) | 295.1 | 33.89 | 309.1 | 32.35 | 20.80 | 0.52 | 0.84 | 0.90 |
| Ethanol (EtOH) | 294.0 | 34.01 | 308.4 | 32.43 | 24.55 | 0.54 | 0.86 | 0.75 |
| Methanol (MeOH) | 294.1 | 34.00 | 308.4 | 32.43 | 32.63 | 0.60 | 0.98 | 0.66 |
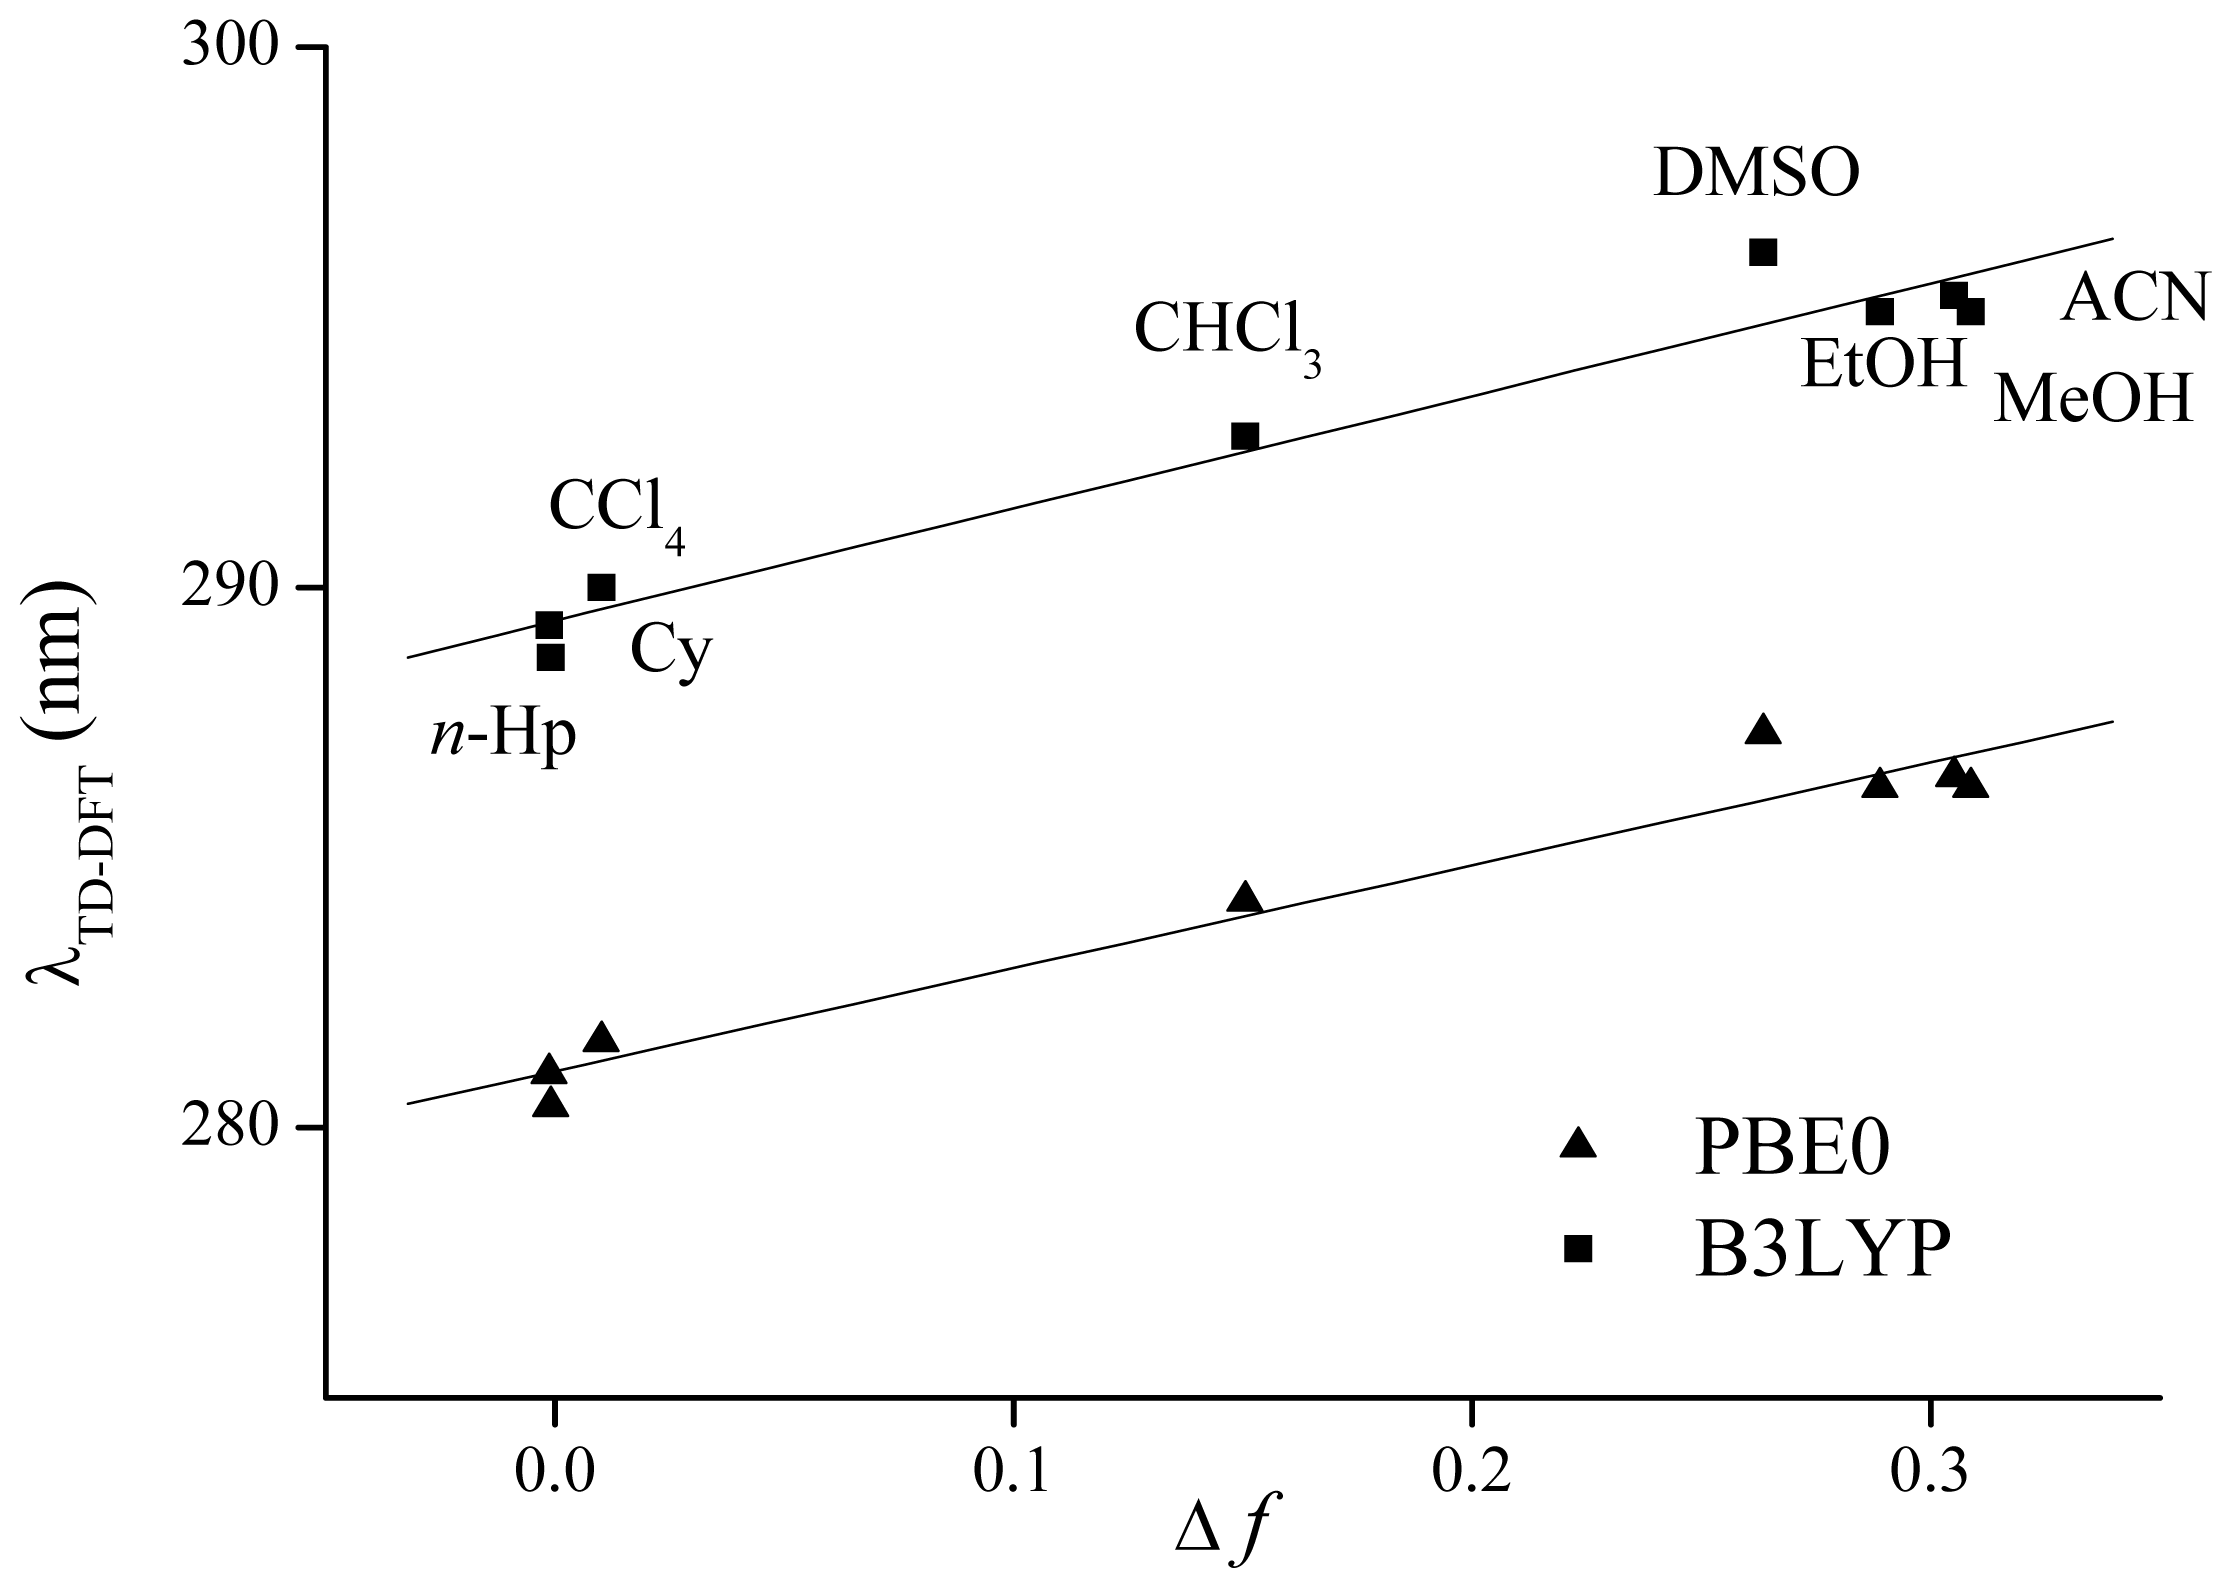
| Flavone | |||||||
|---|---|---|---|---|---|---|---|
| B3LYP | PBE0 | ||||||
| Solvent | λTD-DFT | f | MOs | λTD-DFT | f | MOs | λexp |
| Cy | 289.3 | 0.469 | H-2 → L (79%) | 281.0 | 0.452 | H-1 → L (48%) | 286.1 |
| n-Hp | 288.7 | 0.470 | H-2 → L (82%) | 280.4 | 0.453 | H-1 → L (55%) | 286.0 |
| CCl4 | 290.0 | 0.465 | H-2 → L (73%) | 281.6 | 0.448 | H-1 → L (55%) | 289.0 |
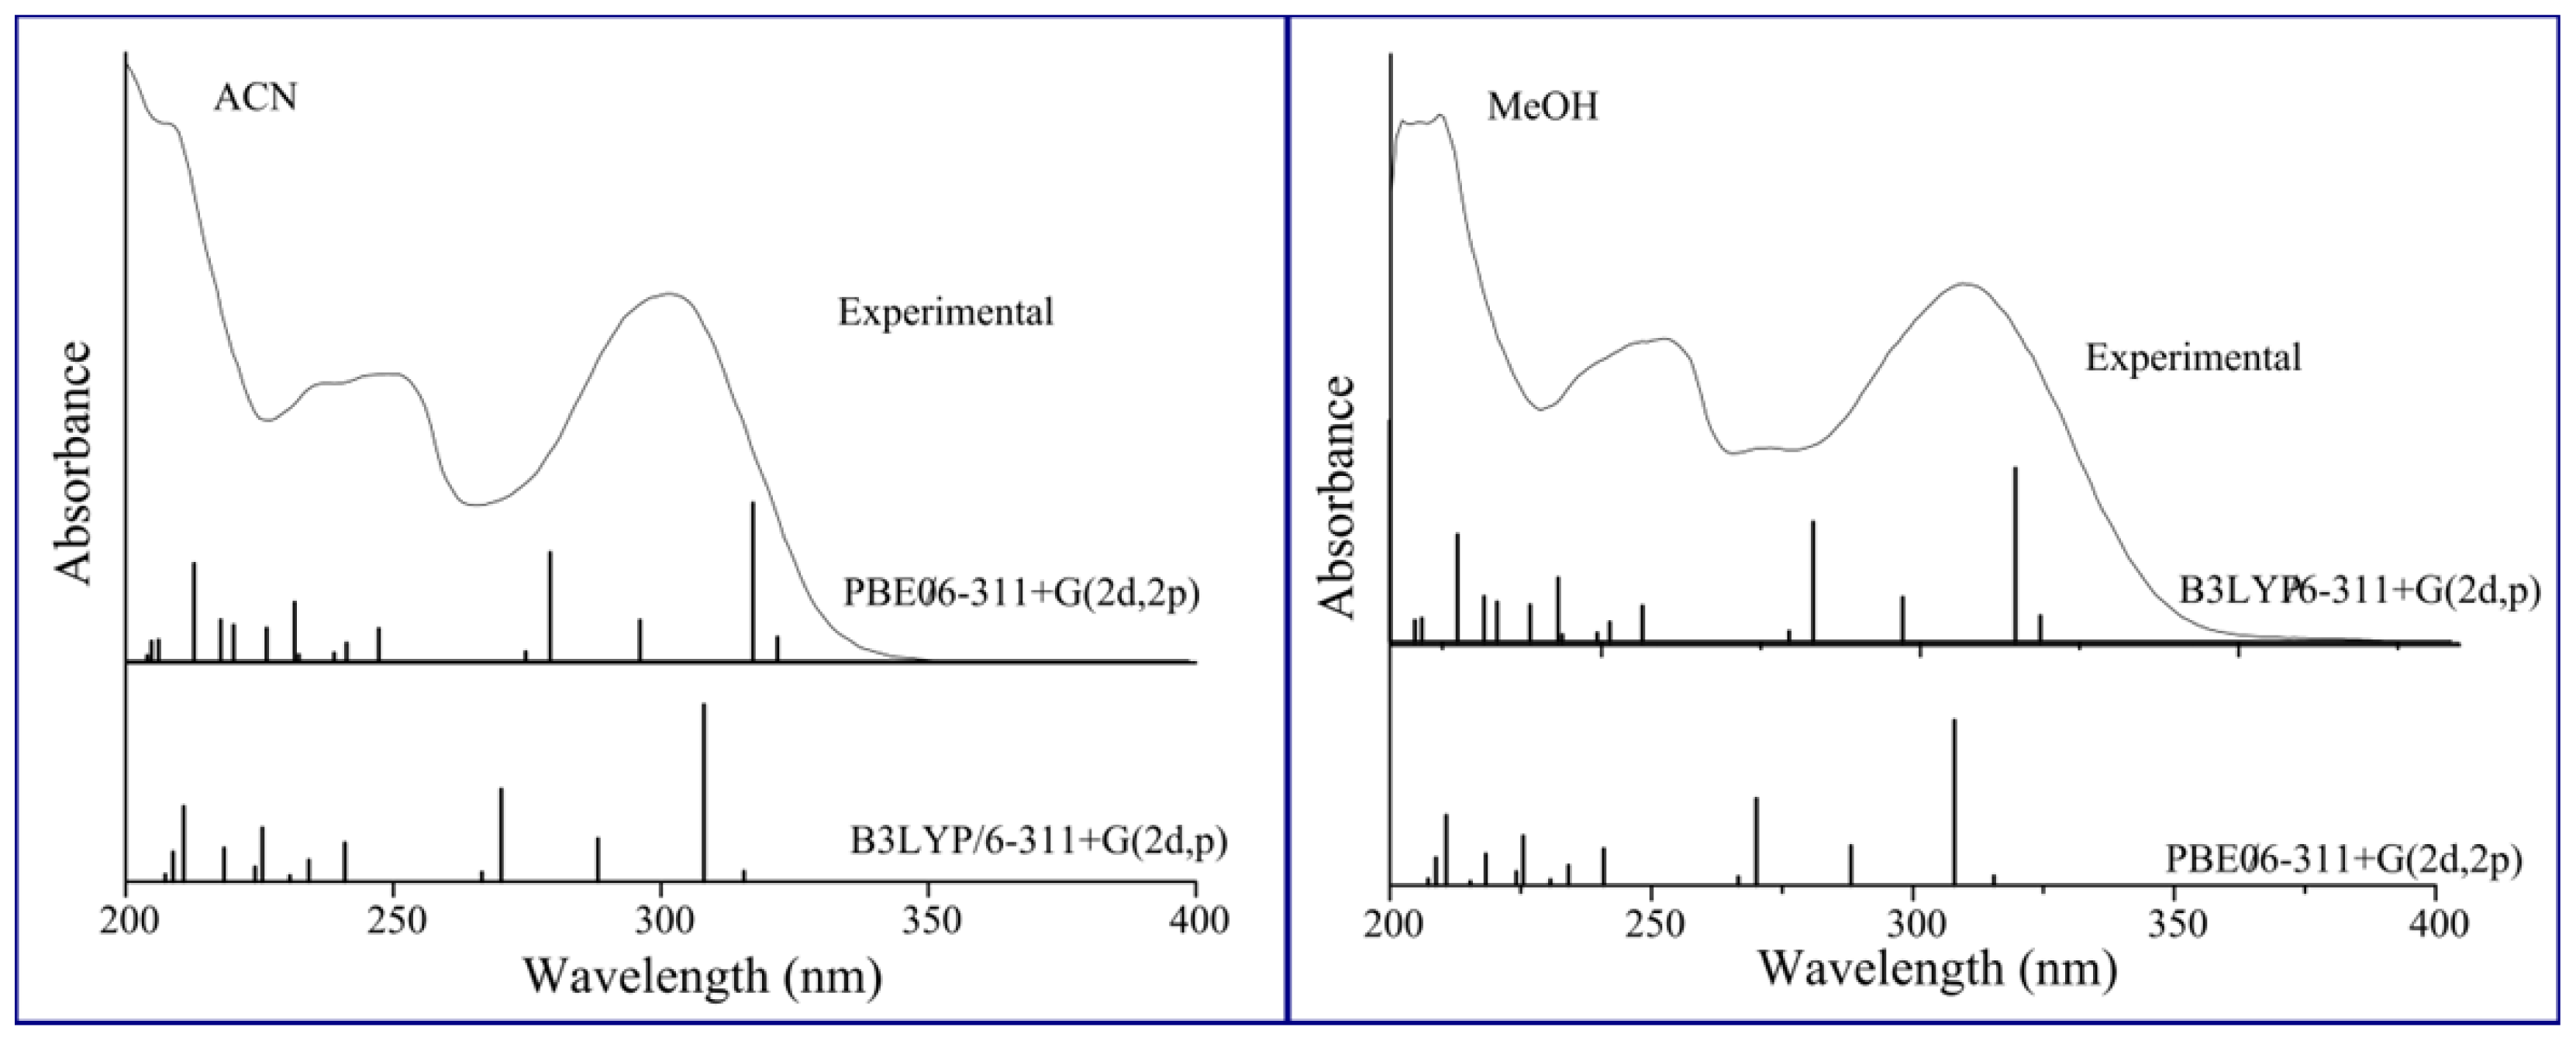
| ACN | 295.4 | 0.359 | H-1 → L (87%) | 286.5 | 0.346 | H-1 → L (87%) | 290.4 |
| DMSO | 296.2 | 0.355 | H-1 → L (88%) | 287.3 | 0.345 | H-1 → L (88%) | 294.0 |
| CHCl3 | 292.8 | 0.415 | H-1 → L (83%) | 284.2 | 0.401 | H-1 → L (85%) | 293.6 |
| EtOH | 295.1 | 0.364 | H-1 → L (87%) | 286.3 | 0.351 | H-1 → L (87%) | 294.0 |
| MeOH | 295.1 | 0.359 | H-1 → L (87%) | 286.3 | 0.346 | H-1 → L (87%) | 294.1 |
| 7(OH)Flavone | |||||||
| B3LYP | PBE0 | ||||||
| Solvent | λTD-DFT | f | MOs | λTD-DFT | f | MOs | λexp |
| Cy | 309.5 | 0.462 | H → L (76%) | 299.8 | 0.520 | H → L (83%) | NS |
| n-Hp | 308.9 | 0.450 | H → L (74%) | 299.2 | 0.508 | H → L (80%) | NS |
| CCl4 | 310.4 | 0.472 | H → L (79%) | 300.6 | 0.530 | H → L (84%) | NS |
| ACN | 318.1 | 0.395 | H → L (78%) | 308.6 | 0.478 | H → L (82%) | 301.5 |
| DMSO | 318.9 | 0.378 | H → L (70%) | 309.1 | 0.496 | H → L (85%) | 308.1 |
| CHCl3 | 314.3 | 0.468 | H → L (86%) | 304.4 | 0.524 | H → L (88%) | NS |
| EtOH | 317.7 | 0.411 | H → L (80%) | 307.7 | 0.485 | H → L (86%) | 308.4 |
| MeOH | 318.0 | 0.392 | H → L (78%) | 308.0 | 0.474 | H → L (85%) | 308.4 |
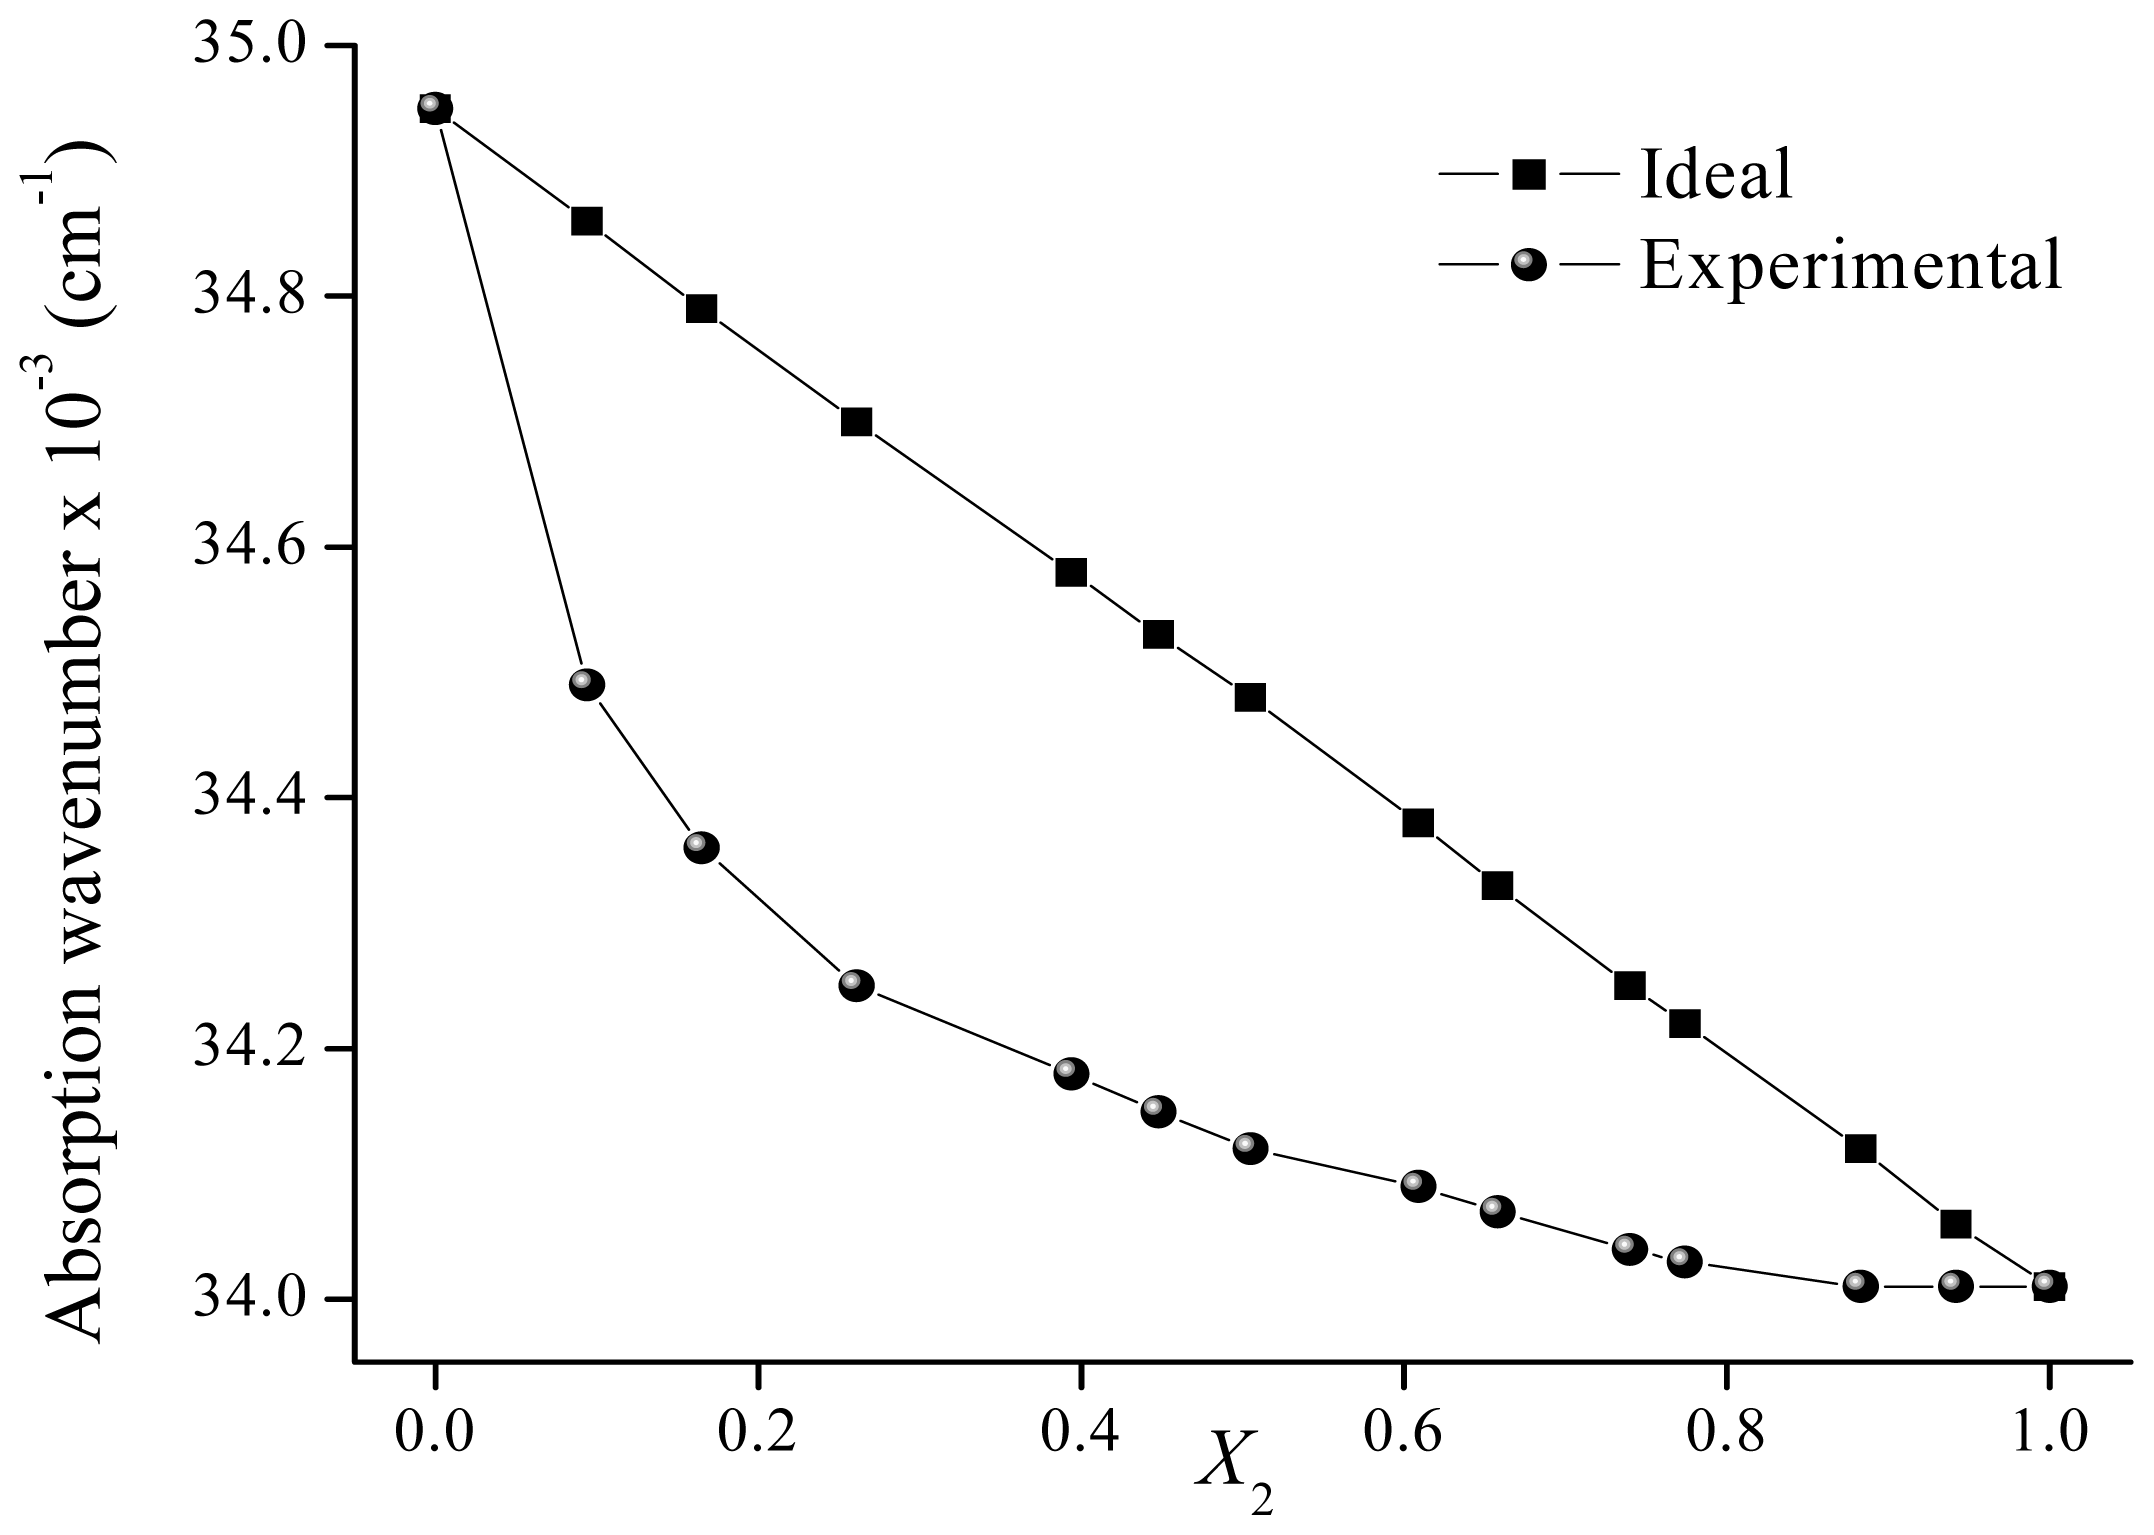
| Cy-EtOH | ACN-EtOH | ||||||
|---|---|---|---|---|---|---|---|
| X2 | ν̄12 × 10−3 | ν̄12 ideal × 10−3 | δS2 | X2 | ν̄12× 10−3 | ν̄12 ideal × 10−3 | δS2 |
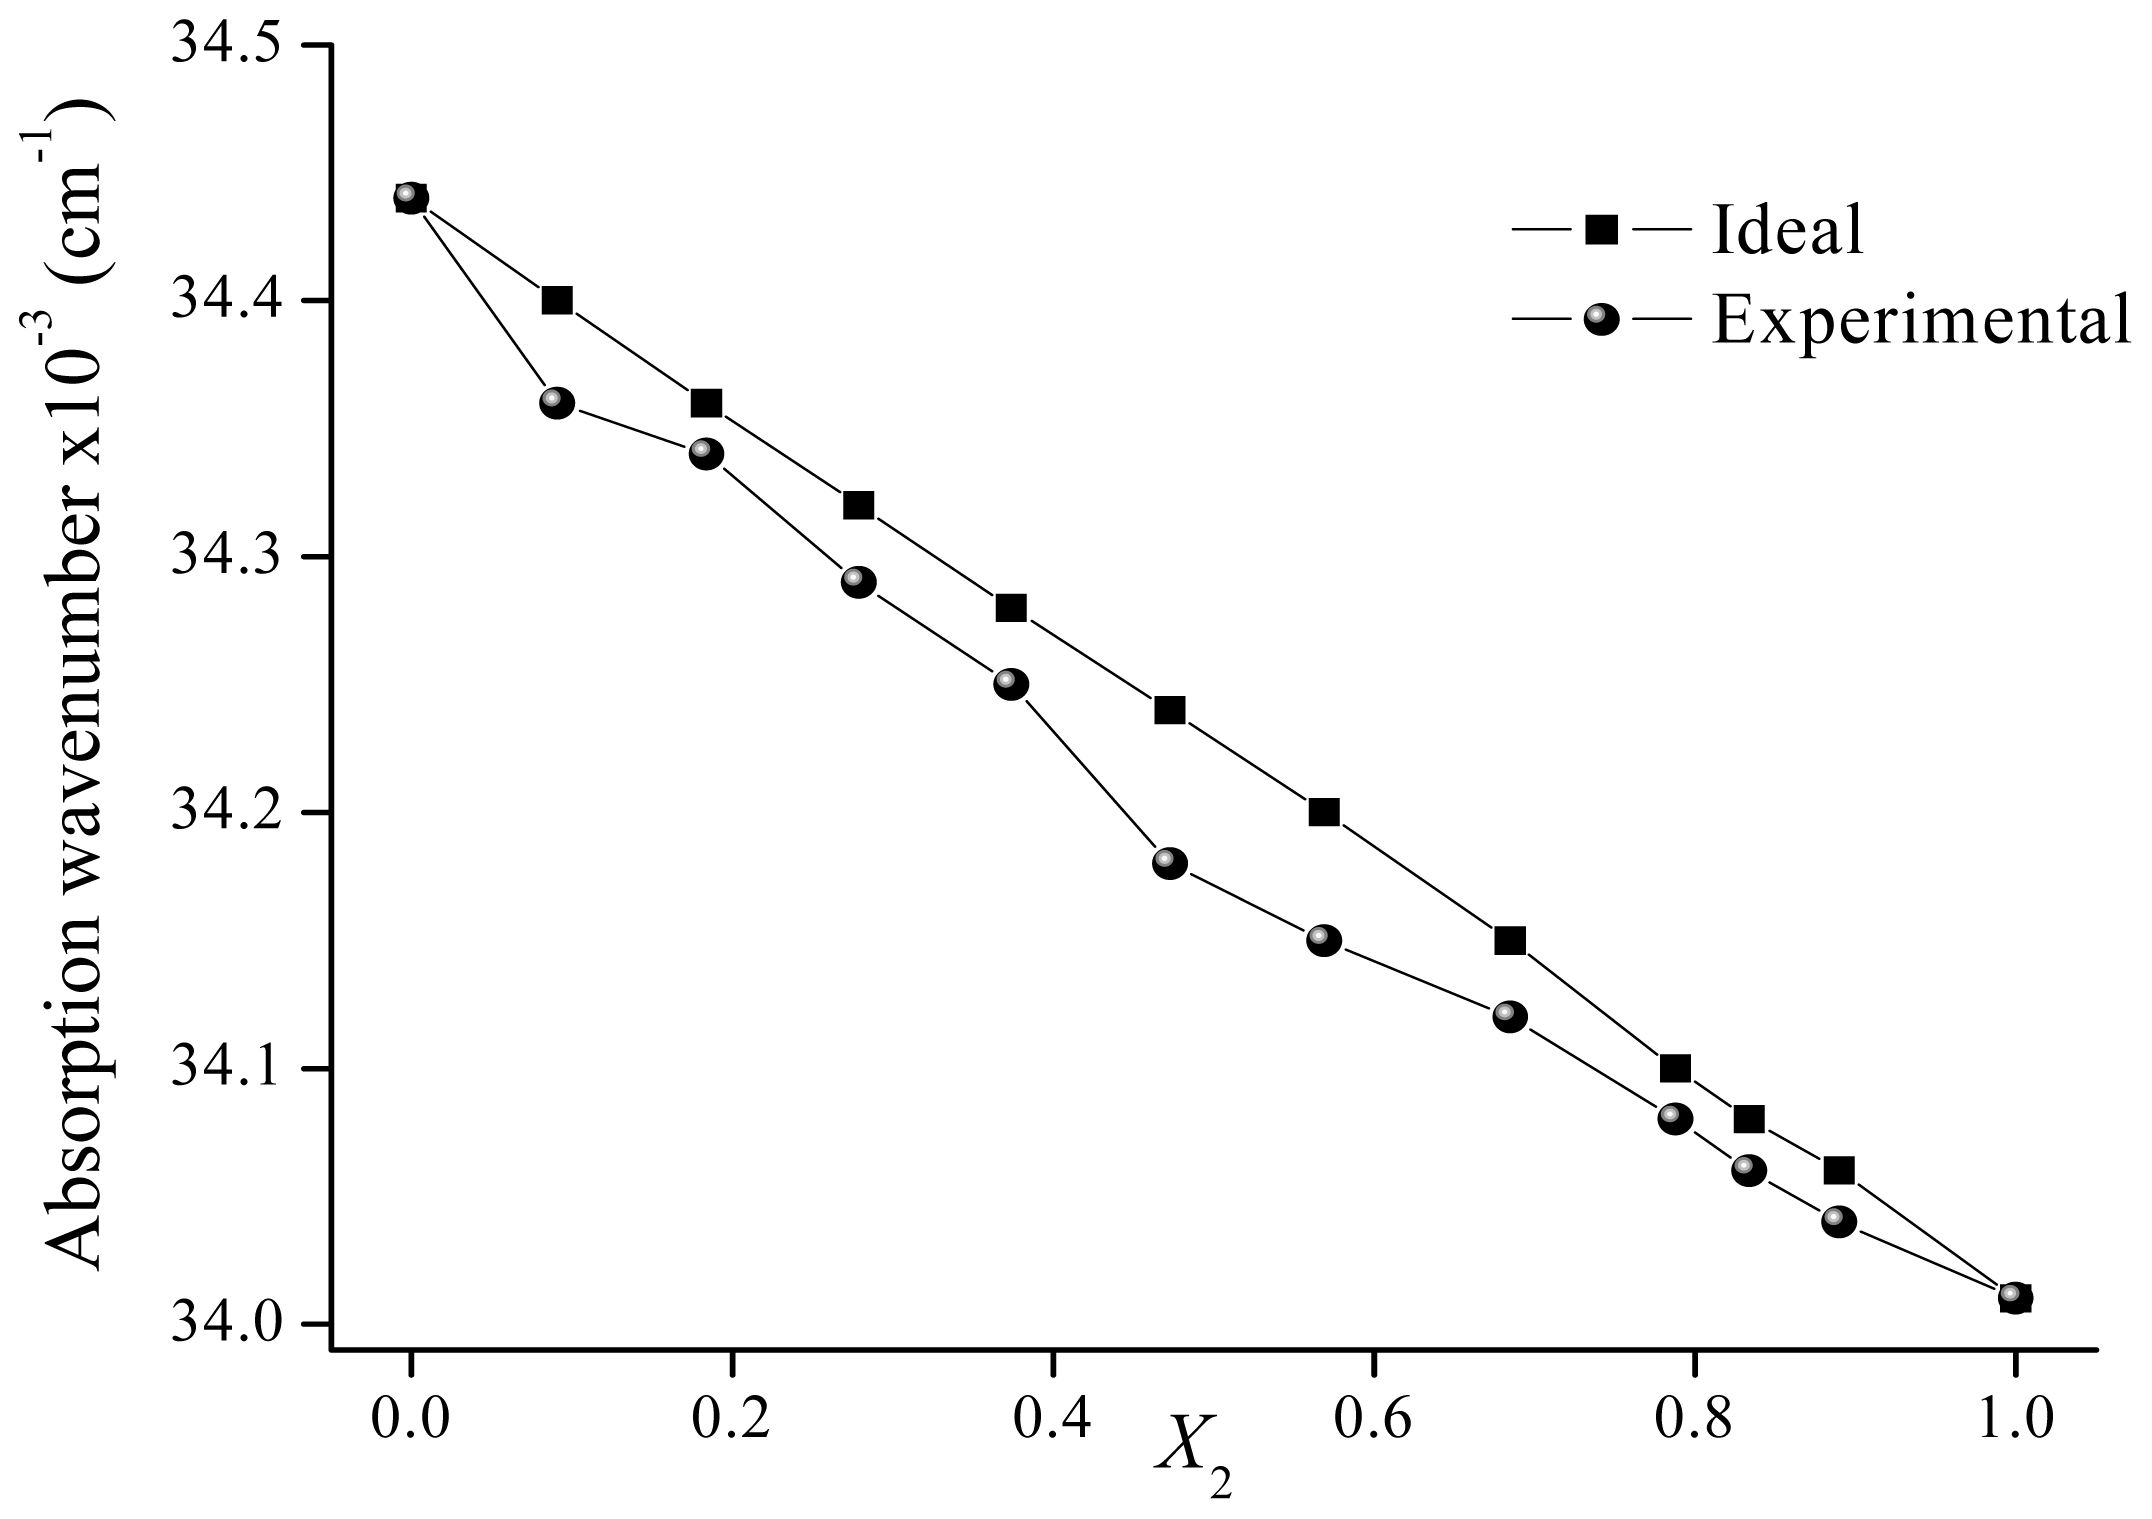
| 0.000 | 34.95 | 34.95 | 0.000 | 34.44 | 34.44 | ||
| 0.094 | 34.49 | 34.86 | 0.395 | 0.091 | 34.36 | 34.40 | 0.095 |
| 0.165 | 34.36 | 34.79 | 0.463 | 0.184 | 34.34 | 34.36 | 0.049 |
| 0.261 | 34.25 | 34.70 | 0.484 | 0.279 | 34.29 | 34.32 | 0.070 |
| 0.394 | 34.18 | 34.58 | 0.425 | 0.374 | 34.25 | 34.28 | 0.068 |
| 0.448 | 34.15 | 34.53 | 0.403 | 0.473 | 34.18 | 34.24 | 0.132 |
| 0.505 | 34.12 | 34.48 | 0.378 | 0.569 | 34.15 | 34.20 | 0.105 |
| 0.609 | 34.09 | 34.38 | 0.306 | 0.685 | 34.12 | 34.15 | 0.059 |
| 0.658 | 34.07 | 34.33 | 0.278 | 0.788 | 34.08 | 34.10 | 0.049 |
| 0.740 | 34.04 | 34.25 | 0.228 | 0.834 | 34.06 | 34.08 | 0.050 |
| 0.774 | 34.03 | 34.22 | 0.205 | 0.890 | 34.04 | 34.06 | 0.040 |
| 0.883 | 34.01 | 34.12 | 0.117 | 1.000 | 34.01 | 34.01 | |
| 0.942 | 34.01 | 34.06 | 0.058 | ||||
| 1.000 | 34.01 | 34.01 | |||||
| ACN-EtOH | |||
|---|---|---|---|
| X2 | ν̄12 × 10−3 | ν̄12 ideal × 10−3 | δS2 |
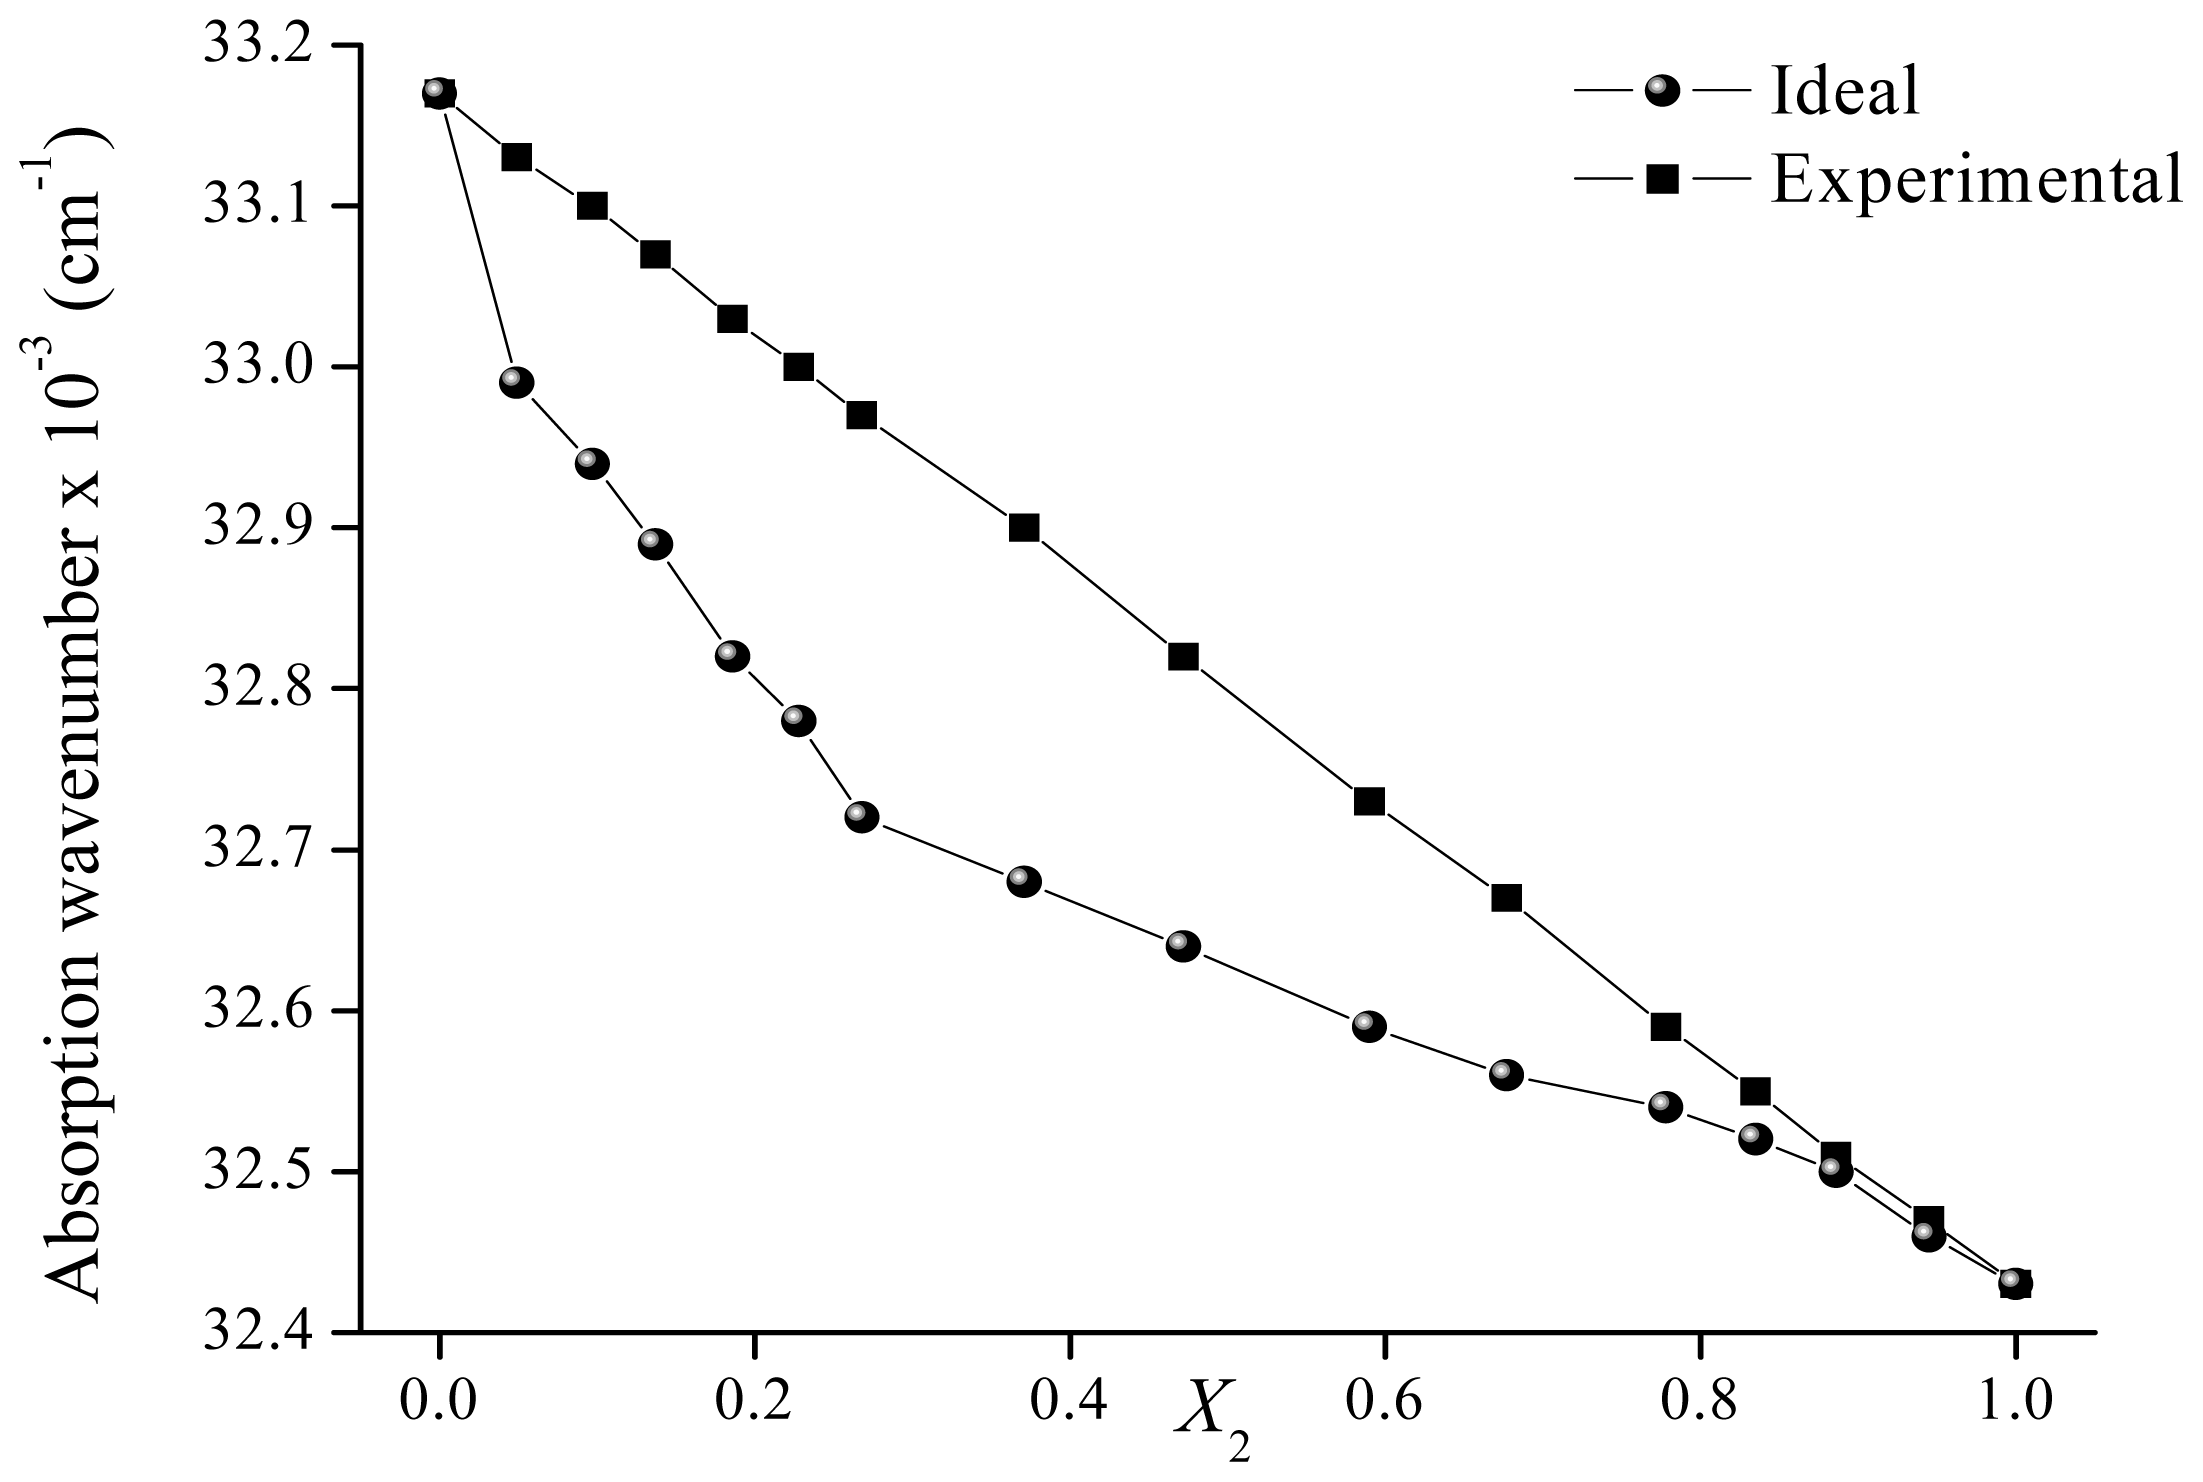
| 0.000 | 33.17 | 33.17 | |
| 0.049 | 32.99 | 33.13 | 0.194 |
| 0.097 | 32.94 | 33.10 | 0.214 |
| 0.137 | 32.89 | 33.07 | 0.241 |
| 0.186 | 32.82 | 33.03 | 0.287 |
| 0.228 | 32.78 | 33.00 | 0.299 |
| 0.268 | 32.72 | 32.97 | 0.340 |
| 0.371 | 32.68 | 32.90 | 0.291 |
| 0.472 | 32.64 | 32.82 | 0.244 |
| 0.590 | 32.59 | 32.73 | 0.194 |
| 0.677 | 32.56 | 32.67 | 0.147 |
| 0.778 | 32.54 | 32.59 | 0.073 |
| 0.835 | 32.52 | 32.55 | 0.043 |
| 0.886 | 32.50 | 32.51 | 0.019 |
| 0.945 | 32.46 | 32.47 | 0.014 |
| 1.000 | 32.43 | 32.43 | |
© 2011 by the authors; licensee MDPI, Basel, Switzerland. This article is an open-access article distributed under the terms and conditions of the Creative Commons Attribution license (http://creativecommons.org/licenses/by/3.0/).
Share and Cite
Sancho, M.I.; Almandoz, M.C.; Blanco, S.E.; Castro, E.A. Spectroscopic Study of Solvent Effects on the Electronic Absorption Spectra of Flavone and 7-Hydroxyflavone in Neat and Binary Solvent Mixtures. Int. J. Mol. Sci. 2011, 12, 8895-8912. https://doi.org/10.3390/ijms12128895
Sancho MI, Almandoz MC, Blanco SE, Castro EA. Spectroscopic Study of Solvent Effects on the Electronic Absorption Spectra of Flavone and 7-Hydroxyflavone in Neat and Binary Solvent Mixtures. International Journal of Molecular Sciences. 2011; 12(12):8895-8912. https://doi.org/10.3390/ijms12128895
Chicago/Turabian StyleSancho, Matias I., Maria C. Almandoz, Sonia E. Blanco, and Eduardo A. Castro. 2011. "Spectroscopic Study of Solvent Effects on the Electronic Absorption Spectra of Flavone and 7-Hydroxyflavone in Neat and Binary Solvent Mixtures" International Journal of Molecular Sciences 12, no. 12: 8895-8912. https://doi.org/10.3390/ijms12128895