Estimating the Octanol/Water Partition Coefficient for Aliphatic Organic Compounds Using Semi-Empirical Electrotopological Index

Abstract
:1. Introduction
2. Methods
2.1. Data Set and Calculation Models
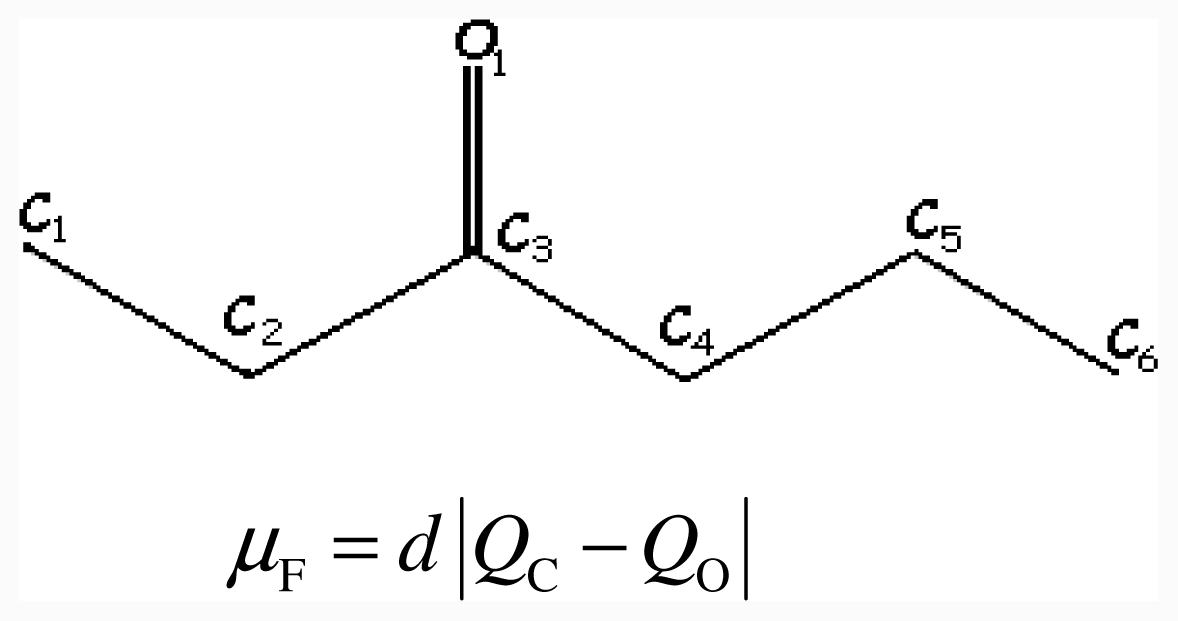
2.2. Semi-Empirical Electrotopological Index, ISET
3. Results and Discussion
4. Conclusions
Acknowledgments
References
- Sakuratani, Y; Kasai, K; Noguchi, Y; Yamada, Y. Comparison of predictivities of log P calculation models based on experimental data for 134 simple organic compounds. QSAR Comb. Sci 2007, 26, 109–116. [Google Scholar]
- Hughes, LD; Palmer, DS; Nigsch, F; Mitchell, JBO. Why are some properties more difficult to predict than others? A study of QSPR models of solubility, melting point, and log P. J. Chem. Inf. Model 2008, 48, 220–232. [Google Scholar]
- Meylan, WM; Howard, PH. Estimating log P with atom/fragments and water solubility with log P. Perspect. Drug Discov 2000, 19, 67–84. [Google Scholar]
- Mannhold, R; Rekker, RF. The hydrophobic fragmental constant approach for calculating log P in octanol/water and aliphatic hydrocarbon/water systems. Perspect. Drug Discov 2000, 18, 1–18. [Google Scholar]
- Mannhold, R; van de Waterbeemd, H. Substructure and whole molecule approaches for calculating log P. J. Comput. Aided Mol. Des 2001, 15, 337–354. [Google Scholar]
- Duchowicz, PR; Castro, EA; Toropov, AA; Nesterova, AI; Nabiev, OM. QSPR Modeling of the octanol/water partition coefficient of alcohols by means of optimization of correlation weights of local graph invariants. J. Argent. Chem. Soc 2004, 92, 29–42. [Google Scholar]
- Spafiu, F; Mischie, A; Ionita, P; Beteringhe, A; Constantinescu, T; Balaban, AT. New alternatives for estimating the octanol/water partition coefficient and water solubility for volatile organic compounds using GLC data (Kovàts retention indices). ARKIVOC 2009, 2009, 174–194. [Google Scholar]
- Mannhold, R; Poda, GI; Ostermann, C; Tetko, IV. Calculation of molecular lipophilicity: State-of-the-art and comparison of log P methods on more than 96,000 compounds. J. Pharm. Sci 2009, 98, 861–893. [Google Scholar]
- Fujita, T; Iwasa, J; Hansch, CJ. A new substituent constant, π, derived from partition coefficients. Am. Chem. Soc 1964, 86, 5175–5180. [Google Scholar]
- Hansch, C; Quinlan, JE; Lawrence, GL. The linear free-energy relationship between partition coefficients and aqueous solubility of organic liquids. Linear Free-Energy Relat 1968, 33, 347–350. [Google Scholar]
- Rekker, RF; Kort, HMD. Hidrophobic fragmental constant—Extension to a 1000 data point set. Eur. J. Med. Chem 1979, 14, 479–488. [Google Scholar]
- Ghose, AK; Crippen, GM. Atomic physicochemical parameters for three-dimensional-structure-directed quantitative structure-activity relationships. 2. Modeling dispersive and hydrophobic interactions. J. Chem. Inf. Comput. Sci 1987, 27, 21–35. [Google Scholar]
- Katritzky, AR; Petrukhin, R; Tatham, D. Interpretation of quantitative structure-property and activity relationships. J. Chem. Inf. Comput. Sci 2001, 41, 679–685. [Google Scholar]
- Devillers, J; Balaban, AT. Topological Indices and Related Descriptors in QSAR and QSPR; Gordon and Breach Science Publishers: Amsterdam, The Netherlands, 1999. [Google Scholar]
- Karelson, M. Molecular descriptors in QSAR/QSPR; Wiley-Interscience: New York, NY, USA, 2000. [Google Scholar]
- Todeschini, R; Consonni, V. Molecular Descriptors for Chemoinformatics, 2nd ed; Wiley-VCH: Weinheim, Germany, 2009. [Google Scholar]
- Héberger, K. Quantitative structure-(chromatographic) retention relationships. J. Chromatogr. A 2007, 1158, 273–305. [Google Scholar]
- Kier, LB; Hall, LH. Molecular Connectivity and Structure-Activity Analysis; Wiley-VCH: New York, NY, USA, 1986. [Google Scholar]
- Mihalic, M; Trinajstic, N. A graph-theoretical approach to structure-property relationships. J. Chem. Educ 1992, 69, 701–712. [Google Scholar]
- Ren, B. Novel atomic-level-based AI topological descriptors: Application to QSPR/QSAR modeling. J. Chem. Inf. Comput. Sci 2002, 42, 858–868. [Google Scholar]
- Randic, M. On interpretation of well-known topological indices. J. Chem. Inf. Comput. Sci 2001, 41, 550–560. [Google Scholar]
- Randic, M. On history of the Randic index and emerging hostility toward chemical graph theory. Match Commun. Math. Comput. Chem 2008, 59, 5–124. [Google Scholar]
- Souza, ES; Junkes, BS; Kuhnen, CA; Yunes, RA; Heinzen, VEF. On a new semi-empirical electrotopological index for QSRR models. J. Chemom 2008, 22, 378–384. [Google Scholar]
- Souza, ES; Kuhnen, CA; Junkes, BS; Yunes, RA; Heinzen, VEF. Modelling the semi-empirical electrotopological index in QSPR studies for aldehydes and ketones. J. Chemom 2009, 23, 229–235. [Google Scholar]
- Souza, ES; Kuhnen, CA; Junkes, BS; Yunes, RA; Heinzen, VEF. Quantitative structure-retention relationship modelling of esters on stationary phases of different polarity. J. Mol. Graph. Model 2009, 28, 20–27. [Google Scholar]
- Souza, ES; Kuhnen, CA; Junkes, BS; Yunes, RA; Heinzen, VEF. Development of semi-empirical electrotopological index using the atomic charge in QSPR/QSRR models for alcohols. J. Chemom 2010, 24, 149–157. [Google Scholar]
- MicroCal Origin, version 5; Microcal Software: Northampton, MA, USA, 1997.
- TsarTM 33 for windows; Oxford Molecular: Cambrige, UK, 2000.
- HyperChem for Windows, Release 7.01; serial number 12-701-150170036; Hypercube: Gainesvile, FL, USA, 2002.
- Ghose, AK; Viswanadhan, VN; Wendoloski, JJ. Prediction of hydrophobic (lipophilic) properties of small organic molecules using fragmental methods: An analysis of ALOGP and CLOGP methods. J. Phys. Chem. A 1998, 102, 3762–3772. [Google Scholar]
- Wildman, SA; Crippen, GM. Prediction of physicochemical properties by atomic contributions. J. Chem. Inf. Comput. Sci 1999, 39, 868–873. [Google Scholar]
- Leo, A; Jow, PYC; Silipo, C; Hansch, C. Calculation of hydrophobic constant (log P) from π and ϕ constants. J. Med. Chem 1975, 18, 865–868. [Google Scholar]
- Organic Chemistry Portal, ClogP calculation. Available online: http://www.organic-chemistry.org/prog/peo accessed on 14 August 2011.
- Virtual Computational Chemistry Laboratory, ALOGPS 2.1 program. Available online: http://www.vcclab.org/lab/alogps/start.html accessed on 14 August 2011.
- Moriguchi, L; Hirono, S; Liu, Q; Nakagome, I; Matsushita, Y. Simple method of calculating octanol/water partition coefficient. Chem. Pharm. Bull 1992, 40, 127–130. [Google Scholar]
- Bredow, T; Jug, K. Theory and range of modern semiempirical molecular orbital methods. Theor. Chem. Acc 2005, 113, 1–14. [Google Scholar]
- Kikuchi, O. Systematic QSAR procedures with quantum chemical descriptors. Quant. Struct. Act. Relat 1987, 6, 179–184. [Google Scholar]
- Smith, WB. Introduction to Theoretical Organic Chemistry and Molecular Modeling; Wiley-VCH: New York, NY, USA, 1996. [Google Scholar]
- Liu, F; Cao, C; Cheng, B. A quantitative structure-property relationship (QSPR) study of aliphatic alcohols by the method od dividing the molecular structure into substructure. Int. J. Mol. Sci 2011, 12, 2448–2462. [Google Scholar]
- Golbraikh, A; Tropsha, A. Beware of q2! J. Mol. Graph. Model 2002, 20, 269–276. [Google Scholar]
- Golbraikh, A; Shen, M; Xiao, Z; Xiao, YD; Lee, KH; Tropsha, A. Rational selection of training and test sets for the development of validated QSAR models. J. Comput. Aided Mol. Des 2003, 17, 241–253. [Google Scholar]

| No. | Class of compounds | ISET | ISET Log P | Ghose/Crippen Log P | AlogP | ClogP | MlogP | Log Pexp |
|---|---|---|---|---|---|---|---|---|
| Hydrocarbon | ||||||||
| 01 | Ethane | 1.9981 | 1.88 | 1.30 | 1.28 | 1.38 | 1.76 | 1.81 |
| 02 | Propane | 2.8148 | 2.40 | 1.69 | 1.74 | 1.84 | 2.28 | 2.36 |
| 03 | N-Butane | 3.6343 | 2.91 | 2.09 | 2.20 | 2.31 | 2.73 | 2.89 |
| 04 | N-Pentane | 4.4457 | 3.43 | 2.49 | 2.65 | 2.77 | 3.14 | 3.39 |
| 05 | N-Hexane | 5.2622 | 3.95 | 2.88 | 3.11 | 3.23 | 3.52 | 4.00 |
| 06 | N-Heptane | 6.0787 | 4.46 | 3.28 | 3.57 | 3.70 | 3.87 | 4.50 |
| 07 | N-Octane | 6.8952 | 4.98 | 3.67 | 4.02 | 4.16 | 4.20 | 5.15 |
| 08 | N-Nonane | 7.7117 | 5.49 | 4.07 | 4.48 | 4.63 | 4.52 | 5.65 |
| 09 | N-Decane | 8.5282 | 6.01 | 4.47 | 4.93 | 5.09 | 4.82 | 6.25 |
| 10 | N-Undecane | 9.3447 | 6.53 | 4.86 | 5.39 | 5.55 | 5.11 | 6.54 |
| 11 | N-Dodecane | 10.1612 | 7.04 | 5.26 | 5.85 | 6.02 | 5.40 | 6.80 |
| 12 | N-Tridecane | 10.9777 | 7.56 | 5.66 | 6.30 | 6.48 | 5.67 | 7.50 |
| 13 | N-Tetradecane | 11.7942 | 8.08 | 6.05 | 6.76 | 6.95 | 5.93 | 8.00 |
| 14 | 2-Methylpropane | 3.5421 | 2.86 | 2.02 | 1.99 | 2.18 | 2.73 | 2.76 |
| 15 | 3-Methylheptane | 6.7641 | 4.89 | 3.61 | 3.36 | 4.04 | 3.87 | |
| 16 | 2.4-Dimethylpentane | 5.8455 | 4.31 | 3.15 | 3.16 | 3.45 | 3.87 | |
| 17 | Ethene | 2.0294 | 1.20 | 1.13 | 0.95 | 1.15 | 0.70 | 1.13 |
| 18 | Propene | 2.8082 | 1.74 | 1.48 | 1.35 | 1.55 | 1.22 | 1.77 |
| 19 | 1-Butene | 3.5848 | 2.28 | 1.87 | 1.81 | 2.01 | 1.67 | 2.40 |
| 20 | 1-Pentene | 4.3996 | 2.84 | 2.27 | 2.26 | 2.48 | 2.08 | 2.80 |
| 21 | 1-Hexene | 5.2140 | 3.40 | 2.67 | 2.72 | 2.94 | 2.46 | 3.40 |
| 22 | 1-Heptene | 6.0305 | 3.96 | 3.06 | 3.17 | 3.40 | 2.81 | 3.99 |
| 23 | 1-Octene | 6.8606 | 4.53 | 3.46 | 3.63 | 3.87 | 3.15 | 4.57 |
| 24 | E-2-Octene | 6.7939 | 4.49 | 3.41 | 3.58 | 3.80 | 3.15 | 4.44 |
| 25 | 2-Ethylhexene | 6.5614 | 4.33 | 3.22 | 3.57 | 3.35 | 3.15 | 4.31 |
| Aldehyde | ||||||||
| 01 | Acetaldehyde | 3.3967 | −0.23 | −0.58 | −0.18 | 0.43 | −0.32 | −0.22 |
| 02 | Propionaldehyde | 4.1866 | 0.27 | 0.05 | 0.48 | 0.89 | 0.20 | 0.30 |
| 03 | Butyraldehyde | 5.0052 | 0.79 | 0.44 | 0.94 | 1.36 | 0.65 | 0.83 |
| 04 | Hexanal | 6.6508 | 1.85 | 1.24 | 1.85 | 2.28 | 1.44 | 1.89 |
| 05 | Heptanal | 7.4709 | 2.38 | 1.63 | 2.31 | 2.75 | 1.79 | 2.42 |
| 06 | Octanal | 8.2859 | 2.89 | 2.03 | 2.77 | 3.21 | 3.04 | 2.90 |
| 07 | 2-Methyl-1-Propanal | 5.6519 | 0.73 | 0.61 | 0.95 | 1.23 | 0.65 | 0.77 |
| 08 | E-2-Butenal | 3.8057 | 0.60 | 0.52 | 0.92 | 1.00 | 0.55 | 0.52 |
| 09 | E-2-Hexenal | 5.4466 | 1.68 | 1.32 | 1.83 | 1.93 | 1.34 | 1.58 |
| Ketone | ||||||||
| 01 | Acetone | 4.0158 | −0.08 | 0.38 | −0.24 | 0.74 | 0.20 | −0.24 |
| 02 | 2-Butanone | 4.5952 | 0.30 | 1.01 | 0.42 | 1.21 | 0.65 | 0.29 |
| 03 | 2-Pentanone | 5.3987 | 0.84 | 1.40 | 0.88 | 1.67 | 1.06 | 0.91 |
| 04 | 2-Hexanone | 6.1987 | 1.38 | 1.80 | 1.34 | 2.14 | 1.44 | 1.38 |
| 05 | 2-Heptanone | 7.0080 | 1.92 | 2.20 | 1.79 | 2.60 | 1.79 | 1.98 |
| 06 | 2-Octanone | 7.8306 | 2.48 | 2.59 | 2.25 | 3.06 | 2.13 | 2.37 |
| 07 | 2-Nonanone | 8.6458 | 3.02 | 2.99 | 2.70 | 3.53 | 3.36 | 3.14 |
| 08 | 2-Decanone | 9.4583 | 3.57 | 3.39 | 3.16 | 3.99 | 3.66 | 3.73 |
| 09 | 2-Undecanone | 10.2706 | 4.11 | 3.78 | 3.62 | 4.46 | 3.95 | 4.09 |
| 10 | 2-Dodecanone | 11.0872 | 4.66 | 4.18 | 4.07 | 4.92 | 4.23 | 4.55 |
| 11 | 3-Pentanone | 5.3900 | 0.84 | 1.64 | 1.09 | 1.67 | 1.06 | 0.99 |
| 12 | 3-Methyl-2-Butanone | 5.2258 | 0.73 | 1.57 | 0.88 | 1.55 | 1.06 | 0.84 |
| 13 | 4-Methyl-2-Pentanone | 6.0484 | 1.28 | 1.73 | 1.13 | 2.01 | 1.44 | 1.31 |
| 14 | 5-Nonanone | 8.5885 | 2.98 | 3.22 | 2.91 | 3.53 | 2.45 | 2.88 |
| 15 | 3-Hexanone | 6.1931 | 1.37 | 2.03 | 1.55 | 2.14 | 1.44 | 1.45 |
| 16 | 2.2 -Dimethyl-3 Butanone | 5.8039 | 1.11 | 2.24 | 1.30 | 2.06 | 1.44 | 1.20 |
| 17 | 5-Methyl-2-Hexanone | 6.8815 | 1.84 | 2.13 | 1.59 | 2.48 | 1.79 | 1.88 |
| 18 | 5-Methyl-2-Octanone | 8.5182 | 2.94 | 2.92 | 2.50 | 3.40 | 2.45 | 2.92 |
| 19 | 2.2.4.4-Tretramethyl-3-3-Pentanone | 7.7789 | 2.44 | 4.09 | 2.85 | 2.05 | 2.45 | 3.00 |
| 20 | 3-Methyl-2-Pentanone | 6.0746 | 1.30 | 1.97 | 1.34 | 2.01 | 1.44 | |
| 21 | 4-Methyl-3-Pentanone | 6.0227 | 1.26 | 2.20 | 1.55 | 2.01 | 1.44 | |
| 22 | 4-Heptanone | 7.0130 | 1.93 | 2.43 | 2.00 | 2.60 | 1.79 | |
| 23 | 2.4-Dimethyl-3-Pentanone | 6.6629 | 1.69 | 2.76 | 2.02 | 2.35 | 1.79 | |
| Ester | ||||||||
| 01 | Methyl Acetate | 5.2056 | 0.20 | −0.14 | 0.02 | 0.48 | 0.13 | 0.18 |
| 02 | Ethyl Acetate | 5.9566 | 0.72 | 0.21 | 0.37 | 0.91 | 0.59 | 0.73 |
| 03 | 2-Methylbutyl Acetate | 8.1580 | 2.23 | 1.47 | 1.67 | 2.18 | 1.73 | 2.29 |
| 04 | Propyl Acetate | 6.8215 | 1.31 | 0.67 | 0.89 | 1.38 | 1.00 | 1.24 |
| 05 | Butyl Acetate | 7.6480 | 1.88 | 1.07 | 1.35 | 1.84 | 1.37 | 1.82 |
| 06 | 3-Methylbutyl Acetate | 8.1012 | 2.19 | 1.40 | 1.60 | 2.18 | 1.73 | 2.25 |
| 07 | Propyl Butyrate | 8.3084 | 2.34 | 1.70 | 2.02 | 2.31 | 1.73 | 2.15 |
| 08 | Methyl Propionate | 5.9612 | 0.72 | 0.49 | 0.69 | 0.94 | 0.59 | 0.82 |
| 09 | Propyl Formate | 6.0387 | 0.77 | 0.47 | 0.85 | 1.11 | 0.59 | 0.83 |
| 10 | Isobutyl Isobutyrate | 8.5664 | 2.51 | 2.27 | 2.34 | 2.52 | 2.06 | 2.48 |
| 11 | Isopentyl Isovalerate | 9.9907 | 3.50 | 2.76 | 2.89 | 3.45 | 2.68 | 3.62 |
| 12 | Methyl Butyrate | 6.7703 | 1.27 | 0.89 | 1.14 | 1.41 | 1.00 | 1.29 |
| 13 | Methyl Isopentanoate | 7.2346 | 1.60 | 1.22 | 1.40 | 1.75 | 1.37 | 1.82 |
| 14 | Methyl Decanoate | 11.7131 | 4.55 | 3.37 | 3.88 | 4.19 | 3.88 | 4.41 |
| 15 | Ethyl Formate | 5.21385 | 0.20 | 0.0 | 0.32 | 0.64 | 0.13 | |
| 16 | Isopropyl Acetate | 6.3210 | 0.97 | 0.62 | 0.75 | 1.32 | 1.00 | |
| 17 | Isobutyl Acetate | 4.2872 | 1.69 | 1.08 | 1.21 | 1.72 | 1.37 | |
| 18 | Ethyl Butyrate | 7.5262 | 1.80 | 1.23 | 1.49 | 1.84 | 1.37 | |
| 19 | Ethyl Valerate | 8.3037 | 2.33 | 1.63 | 1.95 | 2.31 | 1.73 | |
| 20 | Ethyl Hexanoate | 9.1100 | 2.89 | 2.02 | 2.40 | 2.77 | 2.06 | |
| 21 | Ethyl Heptanoate | 9.9322 | 3.46 | 2.42 | 2.86 | 3.23 | 2.38 | |
| 22 | Ethyl Octanoate | 10.7424 | 4.02 | 2.82 | 3.32 | 3.7 | 3.59 | |
| 23 | Ethyl Nonanoate | 11.5522 | 4.58 | 3.21 | 3.77 | 4.16 | 3.88 | |
| 24 | Ethyl Decanoate | 12.3802 | 5.15 | 3.61 | 4.23 | 4.43 | 4.16 | |
| Alcohol | ||||||||
| 01 | Ethanol | 5.0258 | −0.03 | 0.08 | −0.01 | 0.43 | −0.17 | −0.31 |
| 02 | 1-Propanol | 5.8387 | 0.48 | 0.55 | 0.51 | 0.89 | 0.35 | 0.34 |
| 03 | 1-Butanol | 6.6371 | 0.99 | 0.94 | 0.97 | 1.35 | 0.80 | 0.84 |
| 04 | 1-Pentanol | 7.4533 | 1.51 | 1.34 | 1.43 | 1.82 | 1.21 | 1.40 |
| 05 | 1-hexanol | 8.2626 | 2.03 | 1.73 | 1.88 | 2.28 | 1.59 | 2.03 |
| 06 | 1-Heptanol | 9.0808 | 2.55 | 2.13 | 2.34 | 2.74 | 1.94 | 2.34 |
| 07 | 1-Octanol | 9.8913 | 3.07 | 2.53 | 2.80 | 3.21 | 3.19 | 3.15 |
| 08 | 1-Nonanol | 10.7101 | 3.60 | 2.92 | 3.25 | 3.67 | 3.50 | 3.57 |
| 09 | 1-Decanol | 11.5199 | 4.11 | 3.32 | 3.71 | 4.14 | 3.81 | 4.01 |
| 10 | 1-Dodecanol | 13.1499 | 5.15 | 4.11 | 4.62 | 5.07 | 4.38 | 5.13 |
| 11 | 1-Tetradecanol | 14.7791 | 6.20 | 4.91 | 5.53 | 5.99 | 4.91 | 6.11 |
| 12 | 1-Pentadecanol | 15.5986 | 6.72 | 5.30 | 5.99 | 6.46 | 5.17 | 6.64 |
| 13 | 1-Hexadecanol | 16.4091 | 7.24 | 5.70 | 6.45 | 6.92 | 5.42 | 7.17 |
| 14 | 1-octadecanol | 18.039 | 8.28 | 6.49 | 7.36 | 7.85 | 5.90 | 8.22 |
| 15 | 2-Propanol | 5.1764 | 0.061 | 0.49 | 0.37 | 0.83 | 0.35 | 0.05 |
| 16 | 2-Butanol | 6.1384 | 0.67 | 0.96 | 0.89 | 1.29 | 0.80 | 0.61 |
| 17 | 2-pentanol | 6.8713 | 1.14 | 1.36 | 1.35 | 1.76 | 1.21 | 1.14 |
| 18 | 2-Hexanol | 7.6936 | 1.67 | 1.75 | 1.80 | 2.22 | 1.59 | 1.61 |
| 19 | 2-Heptanol | 8.5136 | 2.19 | 2.15 | 2.26 | 2.68 | 1.94 | 2.31 |
| 20 | 2-Octanol | 9.3313 | 2.71 | 2.54 | 2.72 | 3.15 | 2.27 | 2.84 |
| 21 | 2-Nonanol | 10.1490 | 3.24 | 2.94 | 3.17 | 3.61 | 3.50 | 3.36 |
| 22 | 3-Pentanol | 6.9241 | 1.17 | 1.43 | 1.42 | 1.76 | 1.21 | 1.14 |
| 23 | 3-hexanol | 7.7334 | 1.69 | 1.82 | 1.87 | 2.22 | 1.59 | 1.61 |
| 24 | 3-Heptanol | 8.5339 | 2.20 | 2.22 | 2.33 | 2.68 | 1.94 | 2.31 |
| 25 | 3-Nonanol | 10.1594 | 3.24 | 3.01 | 3.24 | 3.61 | 2.59 | 3.36 |
| 26 | 4-Heptanol | 8.4277 | 2.14 | 2.22 | 2.33 | 2.68 | 1.94 | 2.31 |
| 27 | 4-Nonanol | 10.0707 | 3.19 | 3.01 | 3.24 | 3.61 | 2.59 | 3.36 |
| 28 | 5-Nonanol | 10.0579 | 3.18 | 3.01 | 3.24 | 3.61 | 2.59 | 3.36 |
| 29 | 2-Methyl-1-propanol | 6.7118 | 1.04 | 1.34 | 0.83 | 1.23 | 0.80 | 0.65 |
| 30 | 2-Methyl-1-pentanol | 8.0889 | 1.92 | 1.74 | 1.75 | 2.16 | 1.59 | 1.78 |
| 31 | 2-Methyl-2-propanol | 5.6439 | 0.36 | 0.57 | 0.57 | 0.98 | 0.80 | 0.37 |
| 32 | 2-Methyl-2-butanol | 6.4088 | 0.85 | 1.04 | 1.10 | 1.44 | 1.21 | 0.89 |
| 33 | 2-Methyl-2-pentanol | 7.2184 | 1.36 | 1.43 | 1.55 | 1.91 | 1.59 | 1.39 |
| 34 | 2-Methyl-2-hexanol | 8.0185 | 1.87 | 1.83 | 2.01 | 2.37 | 1.94 | 1.84 |
| 35 | 2-Methyl-3-pentanol | 7.6238 | 1.62 | 1.83 | 1.74 | 2.10 | 1.59 | 1.67 |
| 36 | 3-Methyl-1-butanol | 7.3289 | 1.43 | 1.27 | 1.22 | 1.69 | 1.21 | 1.42 |
| 37 | 3-Methyl-2-butanol | 6.7223 | 1.05 | 1.36 | 1.21 | 1.63 | 1.21 | 1.14 |
| 38 | 3-Methyl-2-pentanol | 7.5616 | 1.58 | 1.76 | 1.67 | 2.10 | 1.59 | 1.67 |
| 39 | 3-Methyl-3-pentanol | 7.1923 | 1.35 | 1.51 | 1.62 | 1.91 | 1.59 | 1.39 |
| 40 | 3-Methyl-3-hexanol | 7.9993 | 1.86 | 1.90 | 2.08 | 2.37 | 1.94 | 1.87 |
| 41 | 4-Methyl-1-pentanol | 8.1457 | 1.96 | 1.67 | 1.68 | 2.16 | 1.59 | 1.78 |
| 42 | 4-Methyl-2-pentanol | 7.5971 | 1.60 | 1.69 | 1.60 | 2.10 | 1.59 | 1.67 |
| 43 | 5-Methyl-2-hexanol | 8.4042 | 2.12 | 2.08 | 2.06 | 2.56 | 1.94 | 2.19 |
| 44 | 2-Ethyl-1-butanol | 8.0637 | 1.90 | 1.74 | 1.75 | 2.16 | 1.59 | 1.78 |
| 45 | 2-Ethyl-1-hexanol | 9.6883 | 2.94 | 2.53 | 2.66 | 3.08 | 2.27 | 2.84 |
| 46 | 3-Ethyl-3-pentanol | 7.9941 | 1.86 | 1.97 | 2.14 | 2.37 | 1.94 | 1.87 |
| 47 | 2.2-Dimethyl-1-propanol | 6.8319 | 1.11 | 1.45 | 1.11 | 1.74 | 1.21 | 1.36 |
| 48 | 2.2-Dimethyl-1-butanol | 7.6225 | 1.62 | 1.85 | 1.56 | 2.21 | 1.59 | 1.57 |
| 49 | 2.2-Dimethyl-1-pentanol | 8.0200 | 1.87 | 2.25 | 2.02 | 2.67 | 1.94 | 2.39 |
| 50 | 2.2-Dimethyl-3-pentanol | 7.9220 | 1.81 | 2.34 | 2.01 | 2.61 | 1.94 | 2.27 |
| 51 | 2.3-Dimethyl-1-butanol | 7.7752 | 1.72 | 1.68 | 1.54 | 2.03 | 1.59 | 1.17 |
| 52 | 2.3-Dimethyl-2-butanol | 7.1113 | 1.29 | 1.44 | 1.42 | 1.78 | 1.59 | 1.17 |
| 53 | 2.3-Dimethyl-2-pentanol | 7.9254 | 1.81 | 1.84 | 1.87 | 2.25 | 1.94 | 2.27 |
| 54 | 2.4-Dimethyl-1-pentanol | 8.7738 | 2.36 | 2.07 | 2.00 | 2.50 | 1.94 | 2.19 |
| 55 | 2.4-Dimethyl-2-pentanol | 7.7712 | 1.727 | 1.76 | 1.80 | 2.25 | 1.94 | 1.67 |
| 56 | 2.4-Dimethyl-3-pentanol | 8.0997 | 1.93 | 2.23 | 2.05 | 2.44 | 1.94 | 2.31 |
| 57 | 2.6-Dimethyl-4-heptanol | 9.8577 | 3.05 | 2.88 | 2.83 | 3.36 | 2.59 | 3.13 |
| 58 | 3.3-Dimethyl-1-butanol | 7.3456 | 1.44 | 1.71 | 1.43 | 2.21 | 1.59 | 1.57 |
| 59 | 3.3-Dimethyl-2-butanol | 7.2531 | 1.38 | 1.87 | 1.49 | 2.15 | 1.59 | 1.19 |
| 60 | 2.2.3-Trimethyl-3-pentanol | 8.2383 | 2.01 | 2.41 | 2.21 | 2.76 | 2.27 | 1.99 |
| Class | Method | N | a | b | r2 | r | F | s | rcv2 |
|---|---|---|---|---|---|---|---|---|---|
| Hydrocarbon | Ghose/Crippen Log P | 23 | −0.0740 | 1.3559 | 0.9925 | 0.9962 | 2760.8 | 0.1694 | 0.9907 |
| AlogP | 23 | 0.3080 | 1.1554 | 0.9952 | 0.9976 | 4345.4 | 0.1352 | 0.9940 | |
| ClogP | 23 | 0.1451 | 1.1513 | 0.9923 | 0.9961 | 2694.0 | 0.1715 | 0.9904 | |
| MlogP | 23 | −0.0923 | 1.2953 | 0.9565 | 0.9780 | 462.2 | 0.4066 | 0.9494 | |
| ISET Log P | 23 | 0.0039 | 0.9997 | 0.9971 | 0.9986 | 7289 | 0.1045 | 0.9964 | |
| Alcohol | Ghose/Crippen Log P | 60 | −0.6651 | 1.3623 | 0.9822 | 0.9911 | 3202.8 | 0.2196 | 0.9813 |
| AlogP | 60 | −0.3038 | 1.1600 | 0.9897 | 0.9949 | 5592.7 | 0.1668 | 0.9893 | |
| ClogP | 60 | −0.7966 | 1.1550 | 0.9914 | 0.9957 | 6651.4 | 0.1531 | 0.9910 | |
| MlogP | 60 | −0.4666 | 1.3344 | 0.9611 | 0.9803 | 1431.6 | 0.3249 | 0.9561 | |
| ISET Log P | 60 | 3,2482 | 0,6394 | 0.9876 | 0.9938 | 4612.6 | 0.1835 | 0.9870 | |
| Aldehyde | Ghose/Crippen Log P | 9 | 0.2243 | 1.2357 | 0.9539 | 0.9767 | 145.0 | 0.2318 | 0.9134 |
| AlogP | 9 | −0.2236 | 1.0954 | 0.9789 | 0.9894 | 324.6 | 0.1611 | 0.9613 | |
| ClogP | 9 | −0.6533 | 1.1187 | 0.9979 | 0.9990 | 3388.8 | 0.0503 | 0.9966 | |
| MlogP | 9 | 0.1668 | 1.0159 | 0.9489 | 0.9741 | 130.0 | 0.2566 | 0.8469 | |
| ISET Log P | 9 | 0.0016 | 1.0014 | 0.9972 | 0.9986 | 2525.9 | 0.0583 | 0.9961 | |
| Ketone | Ghose/Crippen Log P | 19 | −0.8484 | 1.2097 | 0.9188 | 0.9585 | 192.3 | 0.3861 | 0.8867 |
| AlogP | 19 | −0.1299 | 1.1494 | 0.9862 | 0.9931 | 1213.4 | 0.1593 | 0.9829 | |
| ClogP | 19 | −0.8479 | 1.1132 | 0.9115 | 0.9547 | 175.1 | 0.4031 | 0.8974 | |
| MlogP | 19 | −0.2586 | 1.1454 | 0.9694 | 0.9846 | 538.8 | 0.2370 | 0.9622 | |
| ISET Log P | 19 | −2.7182 | 0.6693 | 0.9864 | 0.9932 | 1229.7 | 0.1582 | 0.9831 | |
| Ester | Ghose/Crippen Log P | 14 | 0.3894 | 1.1472 | 0.9688 | 0.9843 | 372.9 | 0.2124 | 0.9573 |
| AlogP | 14 | 0.1815 | 1.1080 | 0.9681 | 0.9839 | 364.7 | 0.2147 | 0.9590 | |
| ClogP | 14 | −0.3054 | 1.1334 | 0.9943 | 0.9971 | 2076.6 | 0.0912 | 0.9928 | |
| MlogP | 14 | 0.1370 | 1.1742 | 0.9851 | 0.9925 | 791.6 | 0.1470 | 0.9630 | |
| ISET Log P | 14 | −3.1575 | 0.6587 | 0.9903 | 0.9951 | 1222.9 | 0.1186 | 0.9838 |
| No. | Compounds | Log Pexp | ISET | ΔISET Log P | ΔGhose/Crippen Log P | ΔAlogP | ΔClogP | ΔMlogP |
|---|---|---|---|---|---|---|---|---|
| 01 | 1-Undecanol | 4.42 | 12.3394 | −0.22 | 0.7 | 0.26 | −0.18 | 0.32 |
| 02 | 2-Undecanol | 4.42 | 11.7816 | 0.14 | 0.6 | 0.33 | −0.12 | 0.32 |
| 03 | 4-Octanol | 2.68 | 9.2504 | 0.02 | 0.06 | −0.1 | −0.47 | 0.41 |
| 04 | 2-Methyl-1-butanol | 1.14 | 7.2774 | −0.26 | −0.2 | −0.15 | −0.55 | −0.07 |
| 05 | 2-Methyl-3-hexanol | 2.19 | 8.2667 | 0.16 | −0.04 | 0 | −0.37 | 0.25 |
| 06 | 2.3-Dimethyl-3-pentanol | 1.67 | 7.78 | −0.05 | −0.24 | −0.27 | −0.58 | −0.27 |
| 07 | 4.4-Dimethyl-1-pentanol | 2.39 | 8.6815 | 0.09 | 0.29 | 0.51 | −0.28 | 0.45 |
© 2011 by the authors; licensee MDPI, Basel, Switzerland. This article is an open-access article distributed under the terms and conditions of the Creative Commons Attribution license (http://creativecommons.org/licenses/by/3.0/).
Share and Cite
Souza, E.S.; Zaramello, L.; Kuhnen, C.A.; Junkes, B.d.S.; Yunes, R.A.; Heinzen, V.E.F. Estimating the Octanol/Water Partition Coefficient for Aliphatic Organic Compounds Using Semi-Empirical Electrotopological Index. Int. J. Mol. Sci. 2011, 12, 7250-7264. https://doi.org/10.3390/ijms12107250
Souza ES, Zaramello L, Kuhnen CA, Junkes BdS, Yunes RA, Heinzen VEF. Estimating the Octanol/Water Partition Coefficient for Aliphatic Organic Compounds Using Semi-Empirical Electrotopological Index. International Journal of Molecular Sciences. 2011; 12(10):7250-7264. https://doi.org/10.3390/ijms12107250
Chicago/Turabian StyleSouza, Erica Silva, Laize Zaramello, Carlos Alberto Kuhnen, Berenice da Silva Junkes, Rosendo Augusto Yunes, and Vilma Edite Fonseca Heinzen. 2011. "Estimating the Octanol/Water Partition Coefficient for Aliphatic Organic Compounds Using Semi-Empirical Electrotopological Index" International Journal of Molecular Sciences 12, no. 10: 7250-7264. https://doi.org/10.3390/ijms12107250