Article

Production and Characterization of Fengycin by Indigenous Bacillus subtilis F29-3 Originating from a Potato Farm

Graduate School of Biotechnology and Bioengineering, Yuan Ze University, Chung-Li, Taoyuan 320, Taiwan
*
Author to whom correspondence should be addressed.
Int. J. Mol. Sci. 2010, 11(11), 4526-4538; https://doi.org/10.3390/ijms11114526
Submission received: 8 October 2010 / Revised: 24 October 2010 / Accepted: 10 November 2010 / Published: 12 November 2010
(This article belongs to the Special Issue Biosurfactants)

Abstract

:
Fengycin, a lipopeptide biosurfactant, was produced by indigenous Bacillus subtilis F29-3 isolated from a potato farm. Although inhibiting the growth of filamentous fungi, the fengycin is ineffective against yeast and bacteria. In this study, fengycin was isolated from fermentation broth of B. subtilis F29-3 via acidic precipitation (pH 2.0 with 5 N HCl) followed by purification using ultrafiltration and nanofiltration. The purified fengycin product was characterized qualitatively by using fast atom bombardment-mass spectrometer, Fourier transform infrared spectrometer, ultraviolet-visible spectrophotometer, 13C-nuclear magnetic resonance spectrometer and matrix assisted laser desorption ionization-time of flight, followed by quantitative analysis using reversed-phase HPLC system. This study also attempted to increase fengycin production by B. subtilis F29-3 in order to optimize the fermentation medium constituents. The fermentation medium composition was optimized using response surface methodology (RSM) to increase fengycin production from B. subtilis F29-3. According to results of the five-level four-factor central composite design, the composition of soybean meal, NaNO3, MnSO4·4H2O, mannitol-mannitol, soybean meal-mannitol, soybean meal-soybean meal, NaNO3-NaNO3 and MnSO4·4H2O-MnSO4·4H2O significantly affected production. The simulation model produced a coefficient of determination (R2) of 0.9043, capable of accounting for 90.43% variability of the data. Results of the steepest ascent and central composite design indicated that 26.2 g/L of mannitol, 21.9 g/L of soybean meal, 3.1 g/L of NaNO3 and 0.2 g/L of MnSO4·4H2O represented the optimal medium composition, leading to the highest production of fengycin. Furthermore, the optimization strategy increased the fengycin production from 1.2 g/L to 3.5 g/L.

1. Introduction

As a structurally diverse group of surface-active molecules produced by microorganisms, biosurfactants have unique amphiphthic properties derived from their complex structures, including a hydrophilic moiety and a hydrophobic portion. Biosurfactants are commonly categorized as (i) glycolipids, (ii) lipopeptides, (iii) fatty acids, neutral lipids, and phospholipids, (iv) polymeric surfactants, and (v) particulate biosurfactants [16]. Biosurfactants have received considerable attention in recent years owing to their low toxicity, high biodegradability, enhanced environmental compatibility, high foaming ability, high selectivity as well as specific activity at extreme temperatures, pH and salinity [7]. However, biosurfactants have limited applications owing to their high production costs, which can be lowered by optimizing biosurfactant production and downstreaming processing strategies [7,8].
B. subtilis strains produce a broad range of bioactive peptides with a strong potential for biotechnological and pharmaceutical applications. A prominent class of such compounds is lipopeptides, including surfactin, fengycin and members of the iturin family (iturin, mycosubtilin, bacillomycin), which are amphiphilic membrane active biosurfactants and peptide antibiotics with potent antimicrobial activities [9,10]. In particular, surfactin is a thoroughly studied and well-characterized biosurfactant [11]. Such lipopeptide-type biosurfactants are characterized by their excellent surface- and membrane-active properties along with superior emulsifying and foaming properties, making them highly promising for use in food biotechnology and in the agricultural sector. Additionally, lipopeptides belonging to the iturin family are potent antifungal agents that can be used as biopesticides for plant protection [10,12].
As an antifungal, lipopeptide complex produced by B. subtilis strain F29-3, fengycin is a cyclic lipodecapeptide containing a β-hydroxy fatty acid with a side-chain length of 16–19 carbon atoms [12]. Particularly active against filamentous fungi, fengycin inhibits the enzymes phospholipase A2 and aromatase [12]. Similar to other lipopeptides produced by B. subtilis, feygycin appears as a mixture of isoforms that vary in both the length and branching of the β-hydroxy fatty acid moiety, as well as in the amino-acid composition of the peptide ring [13]. For instance, position 6 d-alanine (denoted as fengycin A) can be replaced by d-valine (denoted as fengycin B) [4,12]. Fengycin comprises two main components that differ by one amino acid exchange. Fengycin A consists of 1 d-Ala, 1 l-Ile, 1 l-Pro, 1 d-allo-Thr, 3 l-Glx, 1 d-Tyr, 1 l-Tyr, 1 d-Orn, whereas in fengyicn B, d-Ala is replaced by d-Val. The lipid moiety of both analogs is variable, as fatty acids have been identified as anteiso-pentadecanoic acid (ai-C15), iso-hexadecanoic acid (i-C16), n-hexadecanoic acid (n-C16); evidence suggests further saturated and unsaturated residues up to C18 [12,13].
This study attempts to purify fengycin produced by B. subtilis F29-3 through a combination of ultrafiltration and nanofiltration methods. The chemical structure of the purified fengycin is also characterized based on fast atom bombardment-mass (FAB-MS) spectrometer, Fourier transform infrared (FT-IR) spectrometer, ultraviolet-visible (UV-VIS) spectrophotometer, 13C-nuclear magnetic resonance (13C-NMR) spectrometer and matrix assisted laser desorption ionization-time of flight (MALDI-TOF). Additionally, the concentration of fengycin is assayed by performing reverse-phase HPLC analysis. Moreover, the fractions collected from the reverse-phase HPLC system are characterized based on MALDI-TOF mass spectrometry. This study also attempts to maximize the fengycin production by B. subtilis F29-3 in shaker flask fermentation by using statistical experimental design approaches. In addition to producing the lowest number of experimental runs, the response surface methodology (RSM) can also help to identify the effect of individual variables on medium components, evaluate the relative significance, seek the optimum constituents, and determine the factor settings that optimize the desired response, i.e., fengycin production.

2. Results and Discussion

2.1. Characterization of Fengycin

2.1.1. IR Spectrometric Analyses

The IR spectrum of fengycin in KBr reveals bands appearing at 3400 cm−1 for amino- and hydroxyl groups of amino acids. The bands appearing at 2860 cm−1 and 2930 cm−1 reflect the aliphatic side chains and at 2060 cm−1, the phenolic ring of tyrosine. At 1650 and 1520 cm−1 strong bands appeared due to the peptide bonds. The shoulder peak appearing at 1760 cm−1 could be attributed to an ester linkage (Figure S1(a)). The IR spectrum of fengycin from B. subtilis F29-3 was also consistent with the literature (Figure S1(b)) [5].

2.1.2. UV Spectrometric Analyses

UV absorption maxima of the fengycin complex at 278 nm in methanol and at 293 nm in alkaline methanolic solution are indicative of tyrosyl peptides (data not shown).

2.1.3. NMR Spectrometric Analyses

The 13C NMR spectrum exhibits carbonyl resonances between 173 and 177 ppm, both of which are carbon signals of various amino acids known from amino acid analyses. The resonances of the various fatty acid chains are found mainly between 10 and 40 ppm (Figures S2(a) and S2(c)), most of which could be assigned by a comparison with published data (Figures S2(b) and S2(d)) [14]. Some of the unsaturated carbon atoms showing resonances at 122.4 and 131.5 can be attributed to olefinic fatty acid residues.

2.1.4. MALDI-TOF/MASS Analyses

For various homologues of fengycin, the signals responsible for fengycin in MALDI-TOF/MASS spectra ranged from 1435–1529 m/z (Table 1). During HPLC analysis, samples were collected from two to 16 minutes of elution time at one minute intervals and the collected fractions were then subjected to MALDI-TOF/MASS analysis. Table 1 summarizes the mass number of fengycin lipopeptide families observed in the MALDI-TOF mass spectra (data not shown). The mass peak appearing at m/z 1475.8 could be attributed to a fengycin isoform containing a β-hydroxy fatty acid with a chain length of 17 carbon atoms containing one double bond. The compounds with mass numbers of m/z 1497.8 and m/z 1505.8 were identified as fengycins with β-hydroxy fatty acid components possessing the chain lengths of 17 carbon atoms. The first species (m/z 1497.8) is sodium adduct of a C17 isoform with an alanine at position 6. The other compound (m/z 1505.8) is a protonated form of a C17 isoform with a valine instead of an alanine at position 6 (Table 1).

2.2. Optimization of Medium Constituents for Fengycin Production by RSM

2.2.1. Fractional Factorial Design

Exactly how seven variables affect fengycin production by B. subtilis F29-3 was analyzed based on fractional factorial design. Table 2 summarizes the regression analysis results of the fractional factorial. The model had a coefficient of determination (R2) of 0.9109, suggesting that the sample variation exceeding 91.09% was attributed to the variables, while the model could not explain only 8.91% of the total variance. The F-value of 11.69 suggested that the model was significant. Moreover, four of the several variables examined, i.e., mannitol, soybean meal, NaNO3 and MnSO4·4H2O, significantly affected fengycin production according to the ‘Prob > F’ value (Table 3) (considering ‘Prob > F’ values of less than 0.05 as significant). Thus, concentrations of mannitol, soybean meal, NaNO3 and MnSO4·4H2O were selected as independent variables to perform response surface analysis. According to the fractional factorial design, the preferable medium composition (g/L) consisted of the following: mannitol, 27.1; soybean meal, 20.8; NaNO3, 2.5; FeCl2·4H2O, 0.55; MgSO4·7H2O, 3.0; MnSO4·4H2O, 0.1; Na2MoO4, 0.055.

2.2.2. Steepest Ascent Method

Although a highly effective means of screening variables, fractional factorial can neither estimate the optimum levels of the variables, nor determine the appropriate range of the selected variables for response surface method design. Therefore, the steepest ascent method was applied to increase fengycin production. The path of the steepest ascent was determined based on Table 4 to identify the proper direction of changing variables in order to increase fengycin production. According to this table, fengycin production was increased by elevating the concentrations of mannitol and soybean meal as well as by decreasing the concentrations of NaNO3 and MnSO4·4H2O. This table also revealed the yield plateau reached during the third step. Therefore, these variables were selected for further optimization via RSM design.

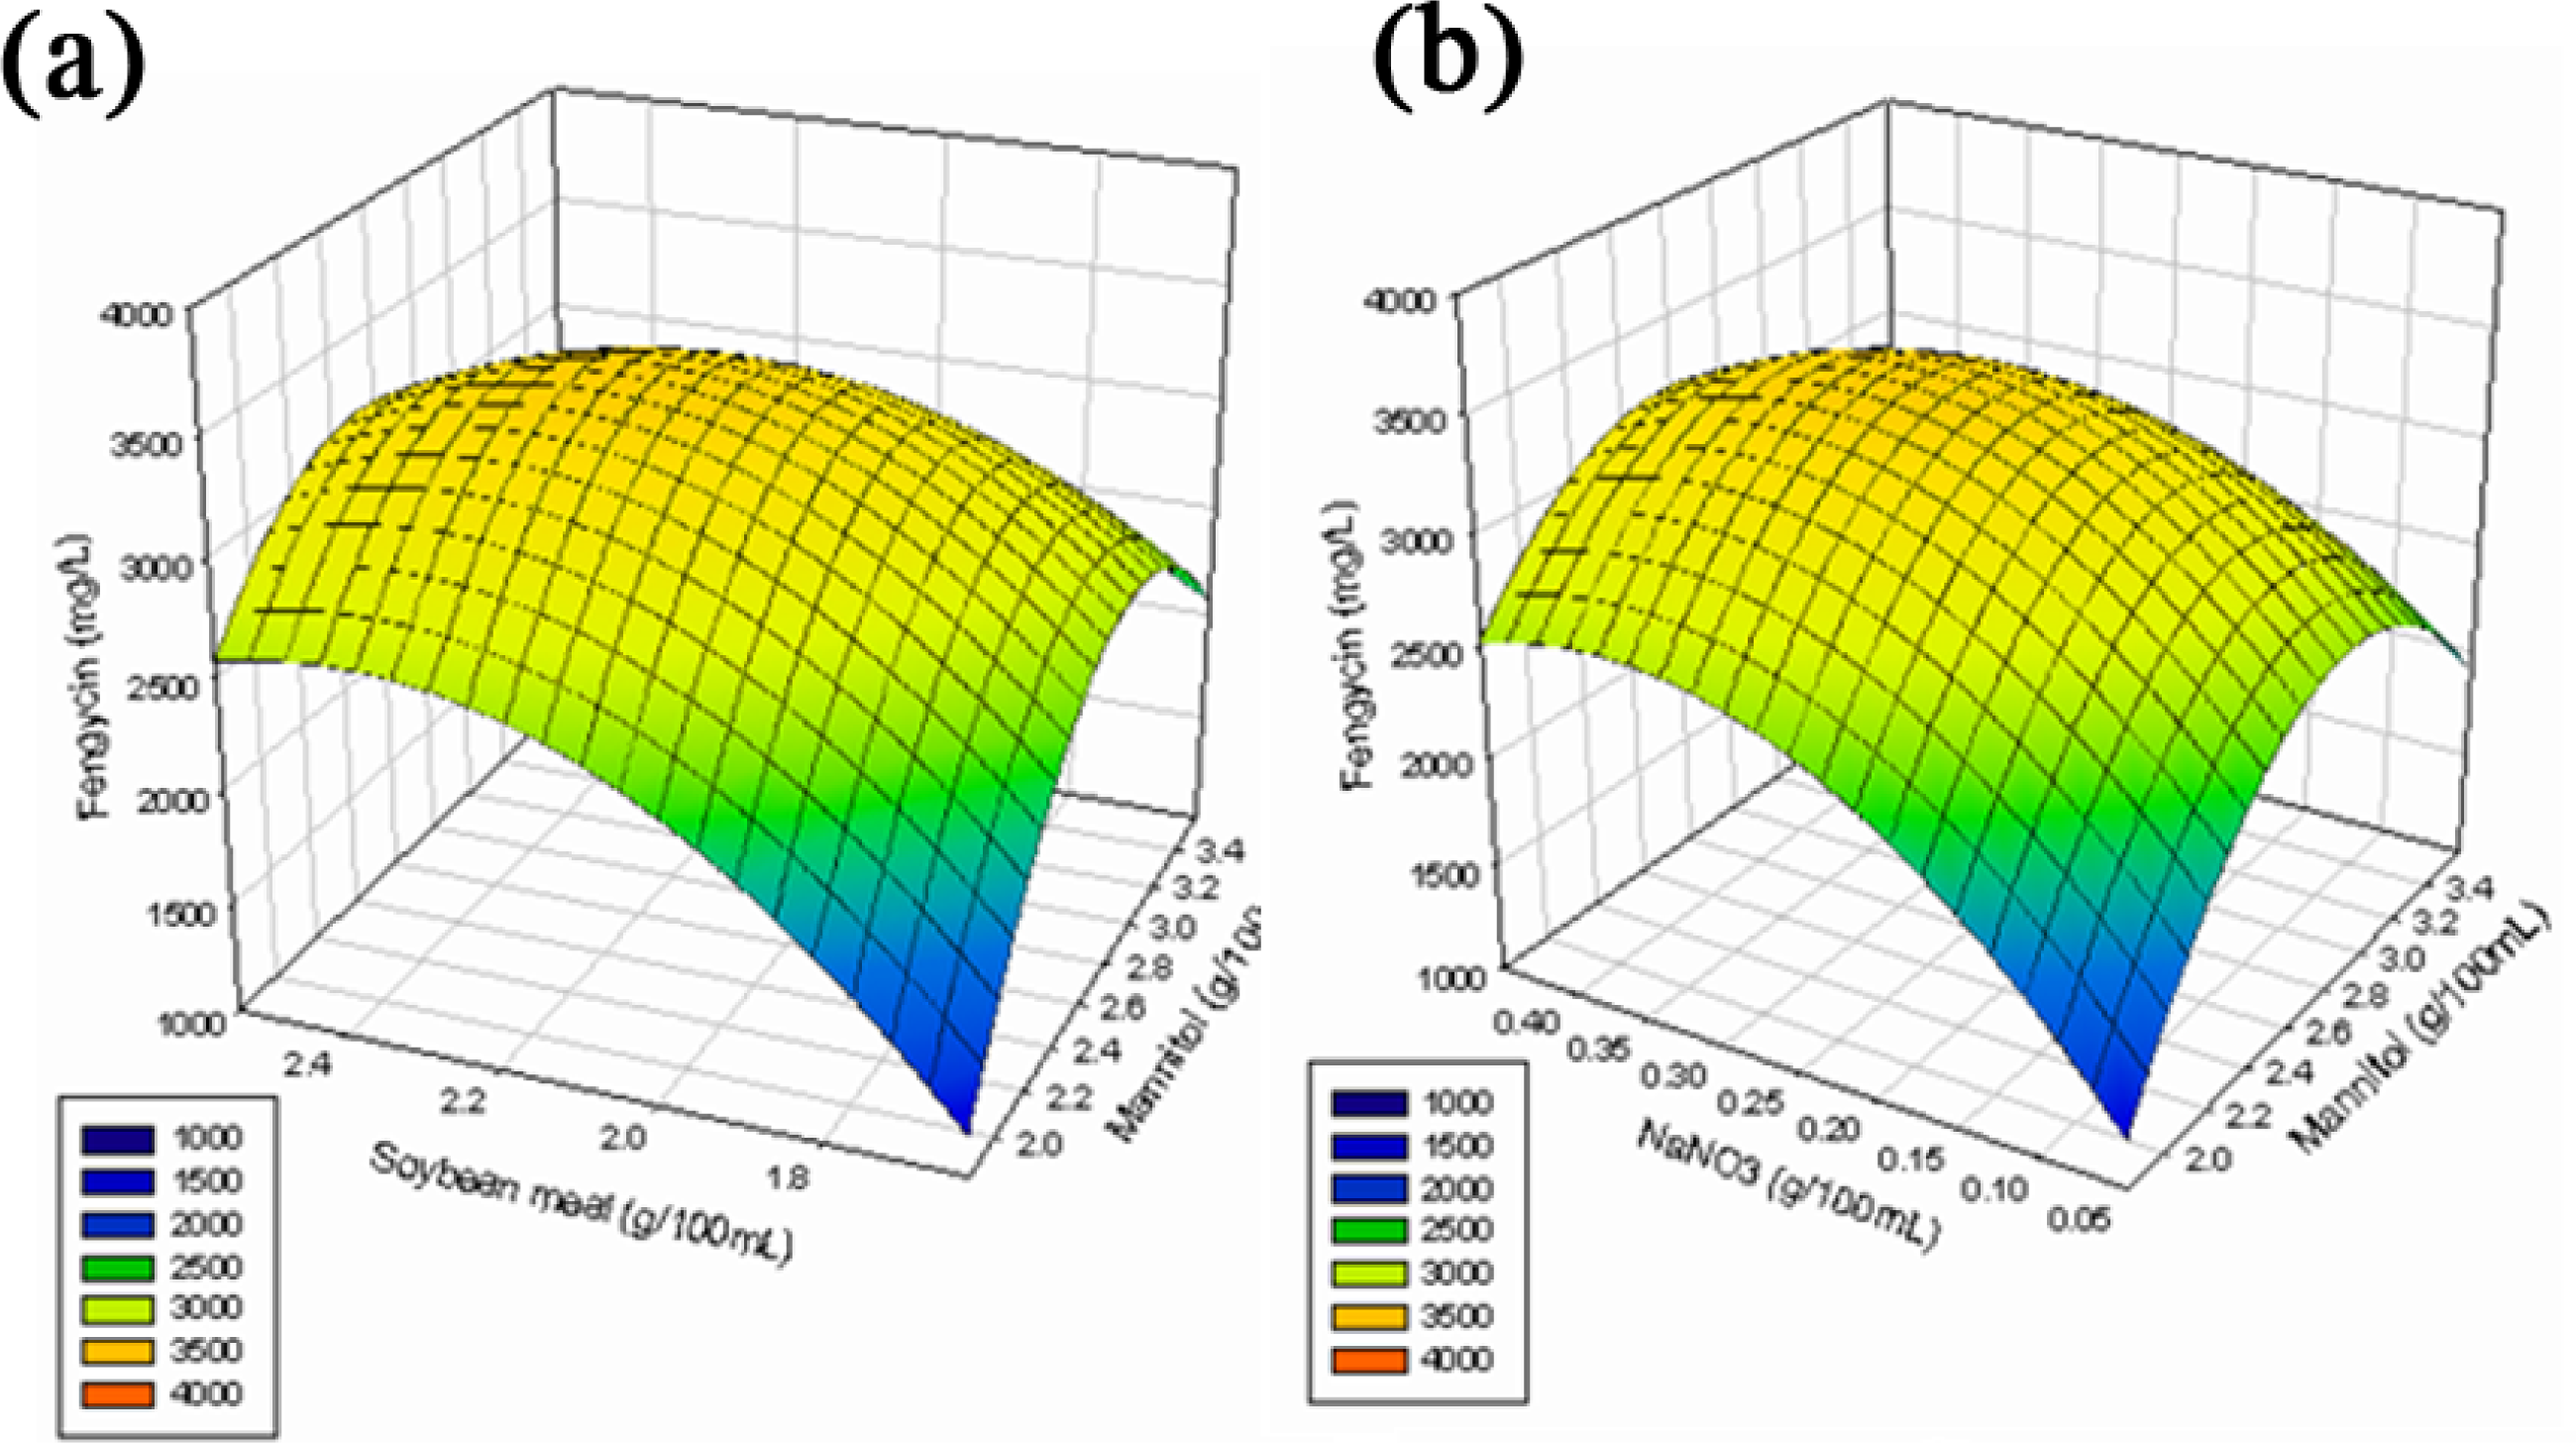
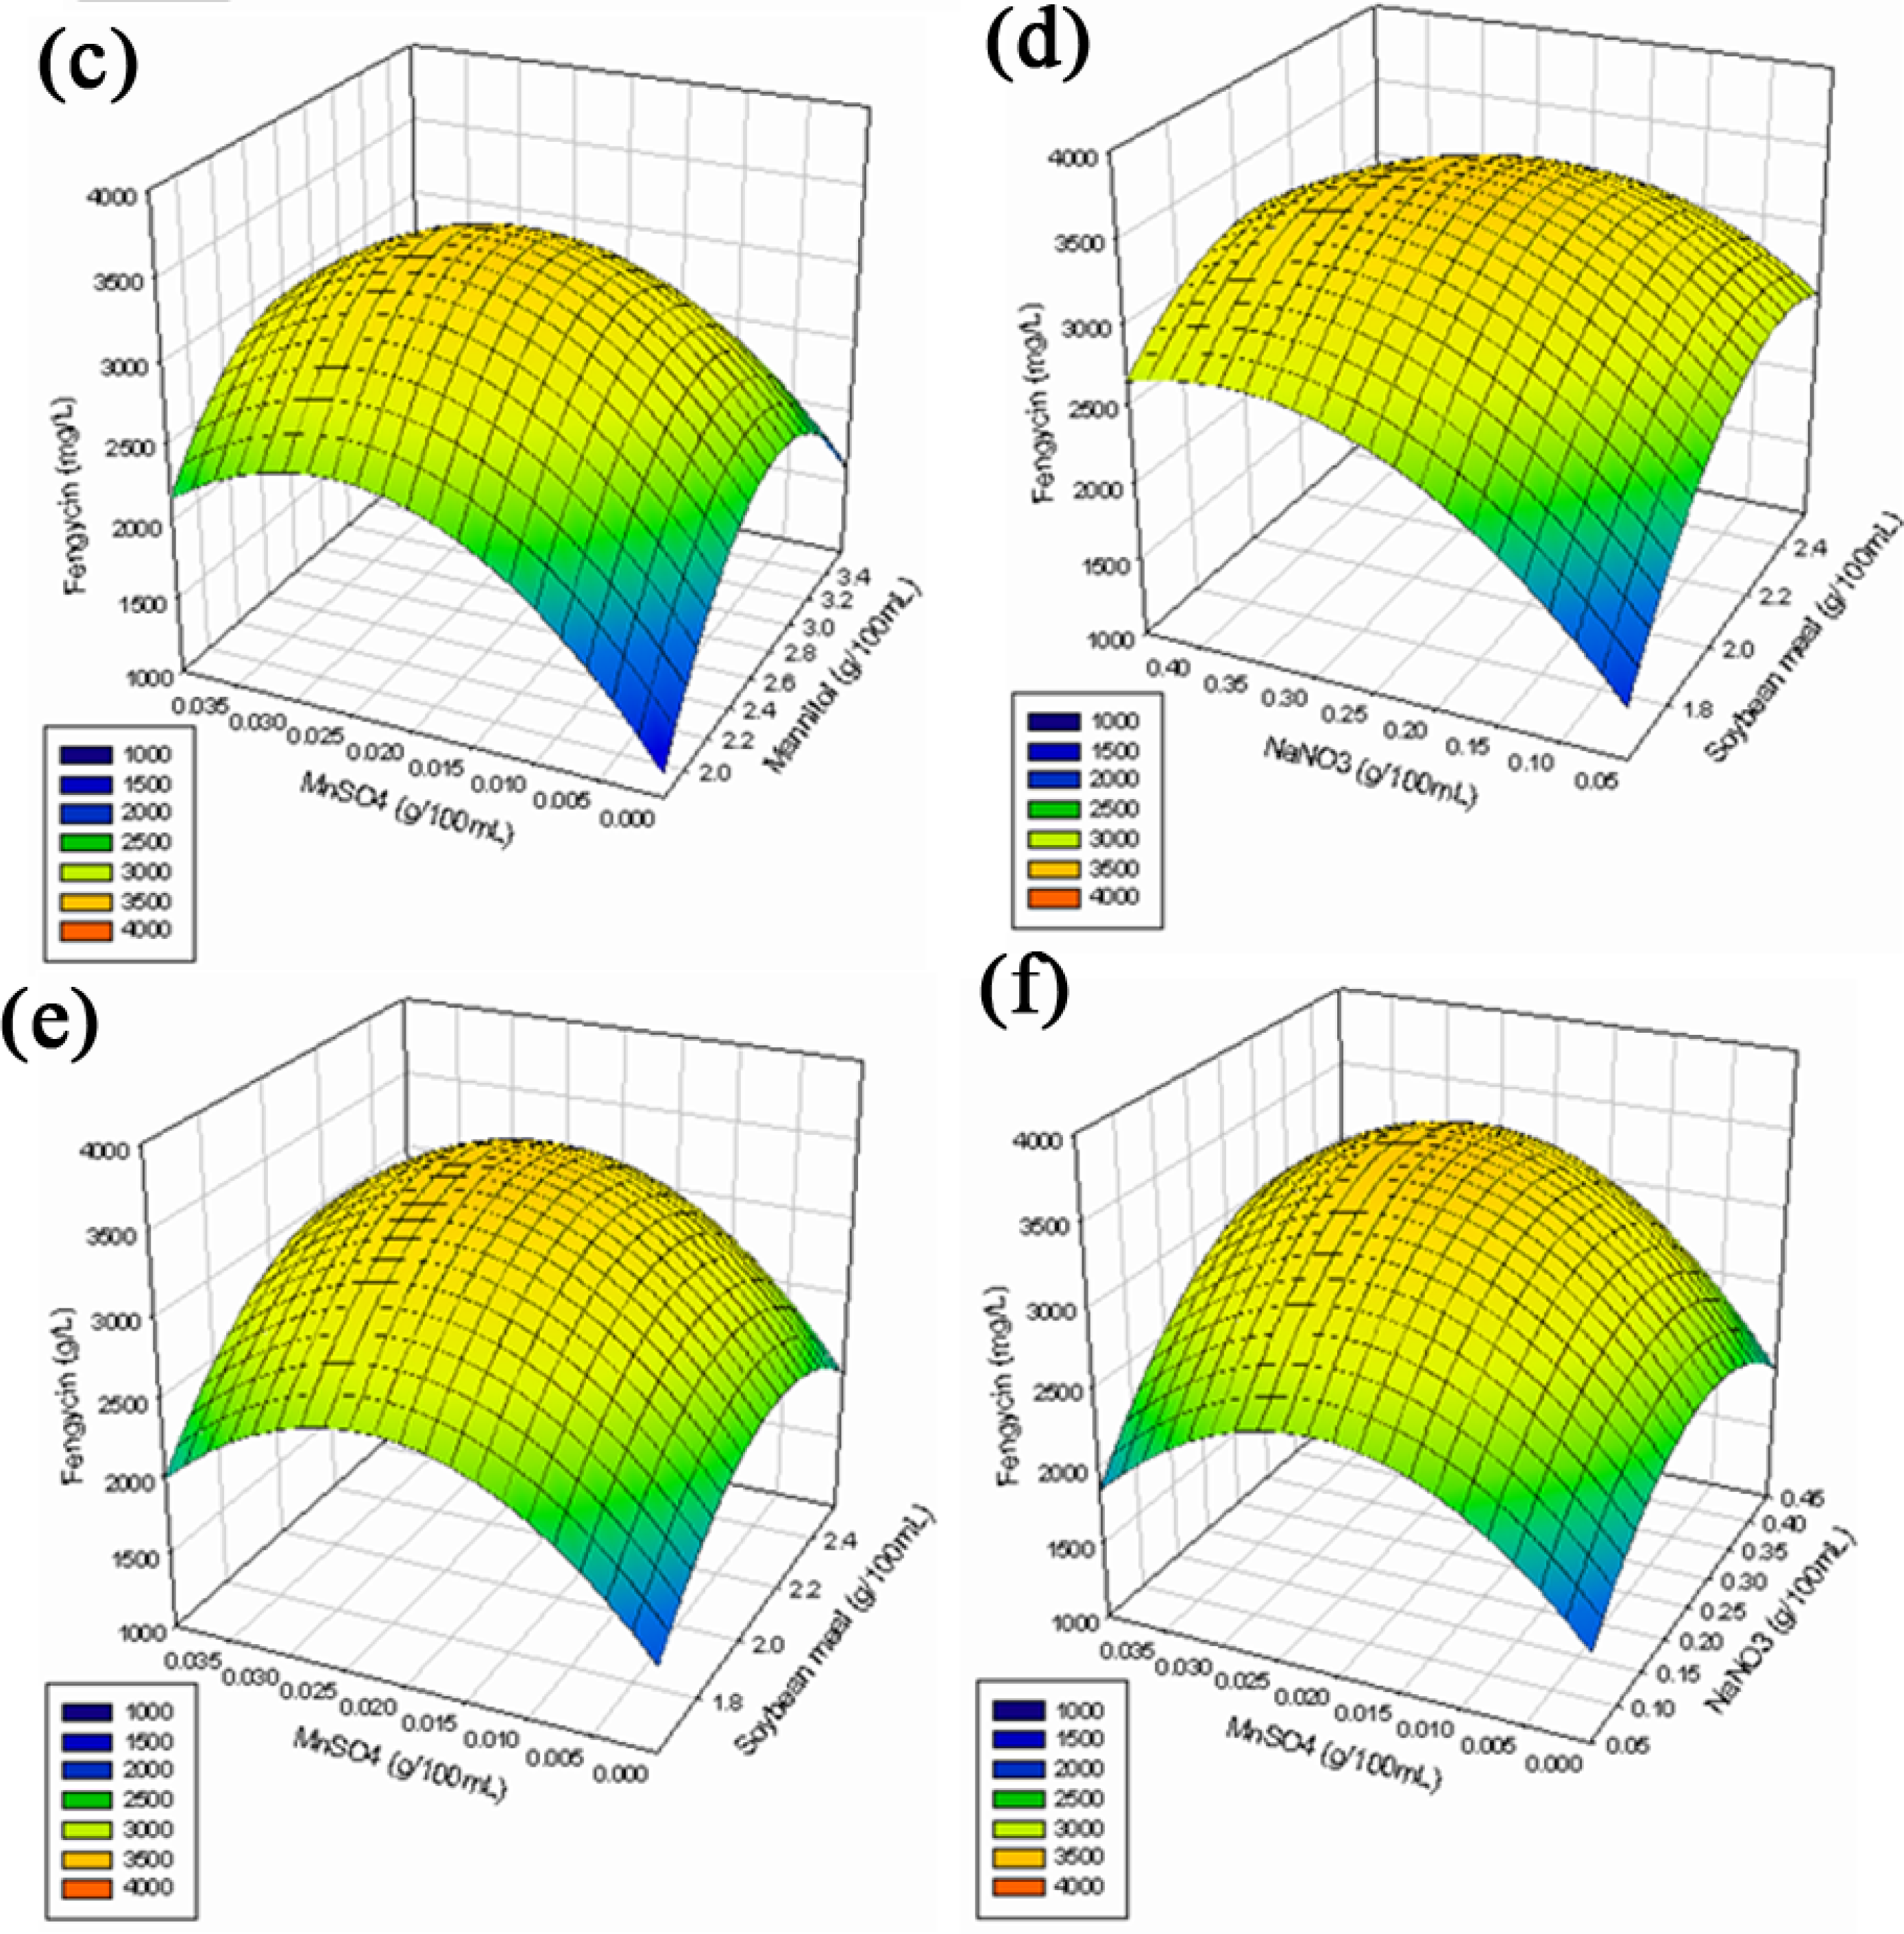
2.2.3. Response Surface Methodology (RSM)

Based on the results of fractional factorial design and the steepest ascent method, the optimal medium composition was determined based on four variables, i.e., mannitol, soybean meal, NaNO3 and MnSO4·4H2O, which significantly influenced fengycin production, leading to optimization of fengycin production. The optimal levels of the four factors, and exactly how interactions between the four factors affect fengycin production, were determined based on central composite design (CCD) of RSM. The CCD results were analyzed by standard analysis of variance (ANOVA). Table 5 lists the mean predicted and observed responses. Thirty experiments with various combinations of mannitol (X1), soybean meal (X2), NaNO3 (X3) and MnSO4·4H2O (X4) were performed (Tables 5 and 6). A second order regression equation (Equation 1) describes the levels of fengycin production as a function of initial values of mannitol, soybean meal, NaNO3 and MnSO4·4H2O. Based on the simulation results, the response surface can be estimated by the following equation (Equation 1):
Y = 3371.8333 + 18.958333 X 1 + 145.125 X 2 229.3021 X 1 2 100.1875 X 2 X 1 136.5521 X 2 2 169.5417 X 3 150.625 X 4 139.0521 X 3 2 40.3125 X 3 X 4 194.6771 X 4 2 + 79.0625 X 3 X 1 + 79.8125 X 3 X 2 + 48.81 X 4 X 1 20.6875 X 4 2
where Y refers to fengycin production, and X1, X2, X3 and X4 refers to the coded value of mannitol, soybean meal, NaNO3 and MnSO4·4H2O concentration, respectively. Model terms with values of ‘Prob > F’ less than 0.05 are considered significant, whereas those exceeding 0.10 are insignificant. According to the proposed model, three (X2, X3 and X4) out of the four linear terms and all of the squared model terms X12, X22, X32, and X42 were significant for fengycin production (Table 6). Coefficient of determination (R2) for fengycin production was estimated as 0.9043 (a value of R2 > 0.75 indicated the aptness accuracy of the model, which can explain up to 90.43% variability of the response. Next, the optimum level of each variable and exactly how their interactions affect fengycin production were studied by plotting three dimensional response surface curves against any two independent variables, while maintaining other variables at their respective ‘0’ levels. Figures 1(a) to 1(f) display the three dimensional curves of the estimated responses from the interaction between mannitol and soybean, mannitol and NaNO3, mannitol and MnSO4·4H2O, soybean meal and NaNO3, soybean meal and MnSO4·4H2O, and NaNO3 and MnSO4·4H2O, respectively. Estimated results of the response surface model equation indicated that a combination of adjusting the mannitol concentration to 26.2 g/L, increasing the soybean meal concentration to 21.9 g/L, decreasing the NaNO3 concentration to 3.1 g/L and adjusting the MnSO4·4H2O concentration to 0.15 g/L, would maximize fengycin production, yielding a fengycin production of 3.5 g/L. This value is significantly higher than the control value (1.45 g/L) obtained from the SMN medium, indicating that the RSM design strategy markedly improved fengycin production. Confirmation experiments based on optimal medium composition also indicated a fengycin yield of 3.55 g/L, which is consistent with the model estimates.

3. Experimental Section

3.1. Microorganism

The strain B. subtilis F29-3 [1417] was a gift from Professor Shih-Tung Liu (Chang Gung University, Taiwan) and was incubated at 30 °C and 200 rpm. The cultures were stored frozen in 50% glycerol at −80 °C.

3.2. Growth Medium and Culture Conditions

For fengycin production, strain F29-3 was grown aerobically on a SMN medium containing (per liter) 20.0 g of soybean meal (Sigma, St. Louis, MO), 20.0 g of mannitol (Sigma), and 10.0 g of NaNO3 (Sigma). The pH of the medium was also adjusted with KOH (Sigma) to 7.5 ± 0.1. Erlenmeyer flask (250 mL) containing 50 mL of medium was then inoculated and incubated at 30 °C and 200 rpm for 16 h to prepare the inoculums in a rotary shaking incubator. Next, a 1% (v/v) inoculum was added aseptically to a flask (500 mL) containing 100 mL of medium. Additionally, the culture was incubated for 96 h at 30 °C and 200 rpm in a rotary shaking incubator. Finally, the growth condition was monitored by evaluating the optical density at 600 nm [14].

3.3. Purification of Fengycin

Following growth of strain F29-3 on SMN medium at 30 °C for 96 h, the bacterial cells were removed by centrifugation at 12000 × g for 30 min at 4 °C. The cell free fengycin was precipitated by adding 5 N HCl (Sigma) to a final pH of 2.5. The precipitates were then collected by centrifugation at 8000 × g for 10 min at 4 °C, followed by dissolution in ethanol/water (1:1, v/v, Sigma) solvent system. Next, the solution was adjusted by adding 1 N NaOH to a final pH of 7.5, and the supernatants were collected by centrifugation at 8000 × g for 10 min at 4 °C. Additionally, the filtrate was collected by filtering the supernatant through a 30 K membrane (ultrafiltration, Sigma) and, then, collecting the concentrate (about 50 mL) by filtering through a 1 K membrane (nanofiltration, Sigma). Moreover, the concentrate was diluted with 200 mL water, and fengycin was precipitated by adding 5 N HCl (Sigma) to a final pH of 2.5. Finally, the precipitate was collected by centrifugation at 12000 × g for 30 min at 4 °C and dried at 50 °C to obtain the purified fengycin powder. Our own repeat purified fengycin (i.e., via acidic precipitation and followed by purification using ultrafiltration and nanofiltration more than 5 times) is used as the standard fengycin for calibration and analysis. The purity of repeat purified standard fengycin is also defined as 100%. Based on the repeat purified standard fengycin, relative purity of the purified fengycin, as applied to all the analyses, was determined as around 95%.

3.4. Characterization of Fengycin

3.4.1. Fast Atom Bombardment-Mass Spectrometry (FAB-MS)

The purified fengycin powder was analyzed using FAB-MS (Model JMS-700, JEOL, Tokyo, Japan). FAB-MS spectra were collected over a range of 0 to 2,000 m/z.

3.4.2. IR Spectrometric Analyses

Once identified on a KRS-5 cell, the purified fengycin powder was analyzed using Fourier transform-infrared spectrum (FT-IR) (PerkinElmer, Paragon 500, U.S.). FTIR spectra were collected between 400 and 4,000 wave numbers (per centimeter).

3.4.3. UV Spectrometric Analyses

The purified fengycin powder was analyzed by UV spectrophotometry (Spectronic 601, Milton Roy, U.S.). UV spectra were collected between a range of 200 to 900 nm using methanol as the solvent and between a range of 240 to 900 nm using methanol/0.5 N NaOH (Sigma) as the solvent.

3.4.4. NMR Analysis

The sample was dissolved in CD3OD and analyzed by NMR (Bruker, Rheinstetler, Germany).

3.4.5. MALDI-TOF/MASS

The purified fengycin powder and all of the fractions collected from HPLC elutant were analyzed using MALDI-TOF/MASS (Bruker, Daltonic, Germany).

3.5. Quantification of Fengycin

The resulting powder was dissolved in pH of 11.0 NaOH solution (Sigma) and filtered through a PVDF syringe filters (0.45 μm) (Sigma). The culture samples were then prepared by centrifugation at 13,000 × g for 10 min to pellet the bacterial cell, followed by filtration using PVDF syringe filters (0.45 μm) (Sigma). Next, fengycin was detected and quantified by reversed-phase HPLC as follows. The above described filtrate was injected into a HPLC column (Merck), (C18, particle diameter of 5 μm, internal diameter of 4.6 m × 25 cm (length)). The mobile phase was 0.1% trifluoroaceic acid (TFA)/acetonitrile (4:6, v/v) (Sigma), and the elution rate was set at 1 mL/min. Finally, the elution absorbance was monitored at 220 nm and the injection volume was 20 μL [14,18,19].

3.6. Optimization of Medium Composition for Fengycin Production

3.6.1. Fractional Factorial Design

The most significant parameters affecting fengycin production by B. subtlis F29-3 were screened based on fractional factorial design. Seven variables, i.e., mannitol, soybean meal, NaNO3, FeCl2·4H2O, MgSO4·7H2O, MnSO4·4H2O and Na2MoO4, were studied in 16 experiments (Table 2). Each variable was represented at two levels, i.e., high and low, as denoted by (+) and (−) signs, respectively. Concentration ranges for the variables were determined based on an extensive literature survey [19]. Finally, experiments were performed following the instruction of a design matrix (Table 3).

3.6.2. Steepest Ascent Method

The central point and ranges of the variables that significantly influenced fengycin production used for response surface methodology (RSM) experimental design, were determined based on a single steepest ascent experiment (Table 4) [19].

3.6.3. Response Surface Methodology (RSM)

Following selection of the ranges of appropriate variables, the optimum concentration of these variables was determined using RSM to increase fengycin production. Based on a central composite design (CCD) the concentration of the variables, i.e., medium constitutes, was optimized along with their interactions studied. Each variable was then presented at five levels, denoted by (−2), (−1), (0), (+1), (+2), respectively (data not shown). A 24 factorial design was used with eight axial points and six replicates at the center point with a total of 30 experiments (Table 5). Fengycin production was taken as the response (Y), and multiple regression analysis of the data was performed to derive an empirical model that relates the response measured to the independent variables. The system behavior was described according to the following quadratic equation (Equation 2):
Y = β 0 + β 1 X 1 + β 2 X 2 + β 3 X 3 + β 4 X 4 + β 11 X 1 2 + β 22 X 2 2 + β 33 X 3 2 + β 44 X 4 2 + β 1 β 2 X 1 X 2 + β 1 β 3 X 1 X 3 + β 1 β 4 X 1 X 4 + β 2 β 3 X 2 X 3 + β 2 β 4 X 2 X 4 + β 3 β 4 X 3 X 4
where, Y refers to the predicted response, β0 refers to the intercept, β1, β2, β3, β4 refer to the linear coefficients, β1,1, β2,2, β3,3, β4,4 refer to the squared coefficients, β1,2, β1,3, β1,4, β2,3, β2,4, β3,4 refer to the interaction coefficients, and X1, X2, X3, X4 refer to the independent variables [2023].

4. Conclusions

This study demonstrated not only that the biosurfactant produced by B. subtilits F29-3 is fengycin, but also that the statistical experimental designs approach markedly enhances the fengycin production. The optimal values of the tested variables to maximize fengycin production were (per liter): 26.2 g of mannitol, 21.9 g of soybean meal, 3.1 g of NaNO3, and 0.15 g of MnSO4·4H2O. The predicted fengycin yield was 3.5 g/L, which closely corresponds to the model estimates.

Supplementary Material

ijms-11-04526-s001.pdf

Acknowledgments

The authors are grateful to the Wei-Bin Lu for supporting the suggestions and ideas of RSM experiment design and Shih-Tung Liu for supporting the skill of MALDI-TOF analysis.

References

  1. Cameotra, SS; Makkar, RS; Kaur, J; Mehta, SK. Synthesis of biosurfactants and their advantages to microorganisms and mankind. Adv. Exp. Med. Biol 2010, 672, 261–280. [Google Scholar]
  2. Baker, SC; Chen, CY. Enrichment and purification of lipopeptide biosurfactants. Adv. Exp. Med. Biol 2010, 672, 281–288. [Google Scholar]
  3. Lourith, N; Kanlayavattanakul, M. Natural surfactants used in cosmetics: glycolipids. Int. J. Cosmet. Sci 2009, 31, 255–261. [Google Scholar]
  4. Vater, J; Kablitz, B; Wilde, C; Franke, P; Mehta, N; Cameotra, SS. Matrix-Assisted Laser Desorption Ionization-Time of Flight Mass Spectrometry of Lipopeptide Biosurfactants in Whole Cells and Culture Filtrates of Bacillus subtilis C-1 Isolated from Petroleum Sludge. Appl. Environ. Microbiol 2002, 68, 6210–6219. [Google Scholar]
  5. Wei, YH; Chu, IM. Enhancement of surfactin production in iron-enriched media by Bacillus subtilis ATCC 21332. Enzyme Microbial. Technol 1998, 22, 724–728. [Google Scholar]
  6. Chen, SY; Lu, WB; Wei, YH; Chen, WM; Chang, JS. Improved production of biosurfactant with newly isolated Pseudomonas aeruginosa S2. Biotechnol. Prog 2007, 23, 661–666. [Google Scholar]
  7. Wei, YH; Lai, HC; Chen, SY; Yeh, MS; Chang, JS. Biosurfactant production by Serratia marcescens SS-1 and its isogenic strain SMdeltaR defective in SpnR, a quorum-sensing LuxR family protein. Biotechnol. Lett 2004, 26, 799–802. [Google Scholar]
  8. Perfumo, A; Rancich, I; Banat, IM. Possibilities and challenges for biosurfactants use in petroleum industry. Adv. Exp. Med. Biol 2010, 672, 135–145. [Google Scholar]
  9. Sen, R. Surfactin: biosynthesis, genetics and potential applications. Adv. Exp. Med. Biol 2010, 672, 316–323. [Google Scholar]
  10. Steller, S; Vollenbroich, D; Leenders, F; Stein, T; Conrad, B; Hofemeister, J; Jacques, P; Thonart, P; Vater, J. Structural and functional organization of the fengycin synthetase multienzyme system from Bacillus Subtilis b213 and A1/3. Chem. Biol 1999, 6, 31–41. [Google Scholar]
  11. Wei, YH; Wang, LF; Chang, JS; Kung, SS. Identification of induced acidification in iron-enriched cultures of Bacillus subtilis during biosurfactant fermentation. J. Biosci. Bioeng 2003, 96, 174–178. [Google Scholar]
  12. Steller, S; Vater, J. Purification of the fengycin synthetase multienzyme system from Bacillus subtilis b213. J. Chromato. Biomed. Sci 2000, 737, 267–275. [Google Scholar]
  13. Loeffler, W; Tschen, JSM; Vanittanakom, N; Kugler, M; Knorpp, E; Hsieh, TF; Wu, TG. Antifungal Effects of Bacilysin and Fengymycin from Bacillus subtilis F-29-3 A comparsion with Activities of Other Bacillus Antibiotics. J. Phytopath 1986, 115, 204–213. [Google Scholar]
  14. Vanittanakom, N; Loeffler, W; Koch, U; Jung, G. Fengycin—a novel antifungal lipopeptide antibiotic produced by Bacillus Subtilis F-29-3. J. Antibiot 1986, 39, 888–901. [Google Scholar]
  15. Lin, SC; Minton, MA; Sharma, MM; Georgiou, G. Structural and immunological characterization of a biosurfactant produced by Bacillus licheniformis JF-2. Appl. Environ. Microbiol 1994, 60, 31–38. [Google Scholar]
  16. Ke, WJ; Chang, BY; Lin, TP; Liu, ST. Activation of the promoter of the fengycin synthetase operon by the UP element. J. Bacteriol 2009, 191, 4615–4623. [Google Scholar]
  17. Lin, TP; Chen, CL; Fu, HC; Wu, CY; Lin, GH; Huang, SH; Chang, LK; Liu, ST. Functional analysis of fengycin synthetase FenD. Biochim. Biophys. Acta 2005, 1730, 159–164. [Google Scholar]
  18. Wei, YH; Wang, LF; Chang, JS. Optimizing iron supplement strategies for enhanced surfactin production with Bacillus subtilis. Biotechnol. Prog 2004, 20, 979–983. [Google Scholar]
  19. Sun, Y; Han, B; Liu, W; Zhang, J; Gao, X. Substrate induction and statistical optimization for the production of chitosanase from Microbacterium sp. OU01. Bioresour. Technol 2006, 98, 1548–1553. [Google Scholar]
  20. Kumar, P; Satyanarayana, T. Optimization of culture variables for improving glucoamylase production by alginate-entrapped Thermomucor indicae-seudaticae using statistical methods. Bioresour. Technol 2007, 98, 1252–1259. [Google Scholar]
  21. Donato, P; Stancanelli, R; Calabro, ML; Tommasini, S; Cutroneo, P; Guardo, M; Pagano, B; Chimirri, A; Ficarra, P; Ficarra, R. Optimization of a LC method for the enantioseparation of a non-competitive glutamate receptor antagonist, by experimental design methodology. J. Pharm. Biomed. Anal 2006, 42, 543–548. [Google Scholar]
  22. Sen, R. Response Surface Optimization of the Critical Media Components for the Production of Surfactin. J. Chem. Technol. Biotechnol 1997, 68, 263–270. [Google Scholar]
  23. Pal, MP; Vaidya, BK; Desai, KM; Joshi, RM; Nene, SN; Kulkarni, BD. Media optimization for biosurfactant production by Rhodococcus erythropolis MTCC 2794: artificial intelligence versus a statistical approach. J. Ind. Microbiol. Biotechnol 2009, 36, 747–756. [Google Scholar]
Figure 1. (a) Response surface curve based on mannitol and a soybean meal; (b) Response surface curve based on mannitol and NaNO3; (c) Response surface curve based on mannitol and MnSO4·4H2O; (d) Response surface curve based on a soybean meal and NaNO3; (e) Response surface curve based on a soybean meal and MnSO4·4H2O; (f) Response surface curve based on NaNO3 and MnSO4·4H2O.
Ijms 11 04526f1aIjms 11 04526f1b
Table 1. Fengycin homologues and isoforms produced by B. subtilis F29-3 following growth for 96 hrs on SMN medium. The purified fengycin product was identified and quantified by reverse-phase HPLC analysis and MALDI-TOF/MASS analysis.
Retention Time (min)Main MALDI-TOF Peak(s) (m/z)Assignment
5, 61523.865, 1509.855B-C16 and C17 fengycin [M + Na]+
6, 71509.855, 1477.828, 1491.825B-C16 fengycin [M + Na]+
A-C17 fengycin [M + H]+
B-C16 fengycin [M + H]+
7, 81491.825, 1505.851B-C16 and C17 fengycin [M + H]+
8, 91505.898, 1527.901B-C17 fengycin [M + H]+
B-C17 fengycin [M + Na]+
9, 101475.844A-C17 fengycin [M + H]+
10, 111475.852, 1497.859A-C17 fengycin [M + H]+
A-C17 fengycin [M + Na]+
11, 121475.817, 1497.816A-C17 fengycin [M + H]+
A-C17 fengycin [M + Na]+
12, 131475.793, 1505.808A-C17 fengycin [M + H]+
B-C17 fengycin [M + H]+
13, 141511.853B-C16 fengycin [M + Na]+
14, 151489.836B-C16 fengycin [M + H]+
15, 161489.912B-C16 fengycin [M + H]+
Table 2. Fractional factorial design for screening important variables that affect fengycin production (n = 3).
Run No.Variables
Mannitol (g/100 mL)Soybean Meal (g/100 mL)NaNO3 (g/100 mL)FeCl2·4H2O (g/100 mL)MgSO4·7H2O (g/100 mL)MnSO4·4H2O (g/100 mL)Na2MoO4 (g/100 mL)Fengycin Production (mg/L)
1−1−1−1−1−1−1−1337 ± 31
2−1−1−111111161± 104
3−1−11−111−1708 ± 63
4−1−111−1−11542 ± 72
5−11−1−11−11447 ± 51
6−11−11−11−11688 ± 137
7−111−1−1111066 ± 101
8−11111−1−1644 ± 75
91−1−1−1−1111712 ± 148
101−1−111−1−11598 ± 193
111−11−11−111054 ± 119
121−111−11−11527 ± 124
1311−1−111−12311 ±254
1411−11−1−112527 ± 285
15111−1−1−1−11556 ± 199
1611111111853 ± 162
Table 3. Identifying significant variables for fengycin production using fractional factorial design a.
SourceDFSum of SquaresF-RatioProb > F
Model75925107.911.70.0012
Mannitol13557939.149.10.0001
Soybean meal1745200.610.30.0125
NaNO31500910.16.90.0302
FeCl2·4H2O1344862.64.80.0606
MgSO4·7H2O186877.61.20.3052
MnSO4·4H2O1689315.19.50.0150
Na2MoO413.10.00.9950
aCoefficient of determination (R2) = 0.9109.
Table 4. Experimental design of steepest ascent and corresponding responses (n = 3).
Experiment No.Mannitol (g/100 mL)Soybean Meal (g/100 mL)NaNO3 (g/100 mL)MnSO4·4H2O (g/100 mL)
43.22.30.20.01
32.72.10.30.02
22.31.90.40.03
11.81.60.50.04
01.41.40.60.05
−11.01.20.70.06
−20.50.90.80.07
Table 5. Experimental design and results of central composite design (CCD) of response surface method to optimize fengycin production (n = 3).
Run No.Mannitol (g/100 mL)Soybean Meal (g/100 mL)NaNO3 (g/100 mL)MnSO4·4H2O (g/100 mL)Fengycin Production (mg/L)
ExperimentalPredicted
1−1−1−1−13033 ± 3132956 ± 315
2−1−1−112394 ± 2592517 ± 281
3−1−11−12461 ± 2162218 ± 215
4−1−1111981 ± 2381941 ± 221
5−11−1−13351 ± 3153327 ± 381
6−11−112699 ± 2892807 ± 252
7−111−12682 ± 2782909 ± 264
8−11112623 ± 2422550 ± 281
91−1−1−12867 ± 2362938 ± 312
101−1−112968 ± 2562695 ± 261
111−11−12613 ± 2812516 ± 274
121−1112414 ± 2612435 ± 253
1311−1−12858 ± 2752909 ± 287
1411−112343 ± 2842584 ± 261
15111−12933 ± 2132807 ± 271
1611112554 ± 2152643 ± 284
1700003263 ± 3263371 ± 391
1800003418 ± 3213371 ± 337
1900003297 ± 3233371 ± 312
2000003449 ± 3243371 ± 353
21−20002413 ± 2112416 ± 252
2220002506 ± 2302492 ± 240
230−2002302 ± 2202535 ± 311
2402002242 ± 2543115 ± 335
2500−202375 ± 2573154 ± 291
2600202352 ± 2152476 ± 245
27000−22782 ± 2482894 ± 281
2800022414 ± 2612291 ± 322
2900003379 ± 3573371 ± 352
3000003425 ± 3223371 ± 336
Table 6. Model coefficients estimated by multiple linear regression analysis a.
SourceCoefficientStandard Errort-ValueProb > t
Intercept3371.874.645.2<0.0001
X118.95837.30.50.6184
X2145.137.33.90.0014
X3−169.537.3−4.60.0004
X4−150.637.3−4.00.0011
X1*X1−229.334.9−6.6<0.0001
X2*X1−100.245.7−2.20.0444
X2*X2−136.634.9−3.90.0014
X3*X179.145.71.70.1038
X3*X279.845.71.80.1009
X3*X3−139.134.9−4.00.0012
X4*X148.845.71.10.3019
X4*X2−20.745.7−0.50.6569
X4*X340.345.70.90.3912
X4*X4−194.734.9−5.6<0.0001
aCoefficient of determination (R2) = 0.9043.

