Article

Phenolic Compounds Protect Cultured Hippocampal Neurons against Ethanol-Withdrawal Induced Oxidative Stress

1
Department of Pharmacology & Neuroscience, University of North Texas Health Science Center, Fort Worth, TX, USA
2
Department of Molecular Biology & Immunology, University of North Texas Health Science Center, Fort Worth, TX, USA
*
Author to whom correspondence should be addressed.
Int. J. Mol. Sci. 2009, 10(4), 1773-1787; https://doi.org/10.3390/ijms10041773
Submission received: 24 February 2009 / Revised: 27 March 2009 / Accepted: 15 April 2009 / Published: 20 April 2009
(This article belongs to the Special Issue Phenolics and Polyphenolics)

Abstract

:
Ethanol withdrawal is linked to elevated oxidative damage to neurons. Here we report our findings on the contribution of phenolic antioxidants (17β-estradiol, p-octyl-phenol and 2,6-di-tert-butyl-4-methylphenol) to counterbalance sudden ethanol withdrawal-initiated oxidative events in hippocampus-derived cultured HT-22 cells. We showed that ethanol withdrawal for 4 h after 24-h ethanol treatment provoked greater levels of oxidative damage than the preceding ethanol exposure. Phenolic antioxidant treatment either during ethanol exposure or ethanol withdrawal only, however, dose-dependently reversed cellular oxidative damage, as demonstrated by the significantly enhanced cell viability, reduced malondialdehyde production and protein carbonylation, compared to untreated cells. Interestingly, the antioxidant treatment schedule had no significant impact on the observed neuroprotection. In addition, the efficacy of the three phenolic compounds was practically equipotent in protecting HT-22 cells in spite of predictions based on an in silico study and a cell free assay of lipid peroxidation. This finding implies that free-radical scavenging may not be the sole factor responsible for the observed neuroprotection and warrants further studies to establish, whether the HT-22 line is indeed a suitable model for in vitro screening of antioxidants against EW-related neuronal damage.

1. Introduction

Neurotoxicity induced by ethanol causes tissue damage to a variety of organs in humans, a finding which has been corroborated by numerous studies using animal models [1]. A major cause of this detrimental effect is believed to be elevated oxidative stress levels via ethanol-induced generation of reactive oxygen species and impairment of the antioxidant defense system [2].
The brain is especially sensitive to oxidative stress, because it has high oxidative metabolic rate and low levels of antioxidant enzymes compared to other tissues [3]. Additionally, it contains high concentrations of redox-active metals [4] that may promote Fenton and Fenton-like reactions [5]. Large amount of unsaturated lipids are also present in the brain that are easy targets for free radicals because they provide readily removable hydrogens [6]. The resulting lipid radicals then rapidly react with molecular oxygen to form peroxyl radicals. This lipid peroxidation (LPO) initiates a series of complex, autocatalytic propagation reactions that generate a variety of thiobarbituric acid reactive substances (TBARs) such as the genotoxic malondialdehyde (MDA), as their end products [7]. Like free radicals, MDA and related carbonyl compounds are highly reactive and could enhance or extend the cellular damage caused by localized radical reactions. On the protein level, they give rise to protein carbonyls [8,9], further disrupting normal functions of the organism.
Unfortunately, not only chronic ethanol exposure, but also abrupt withdrawal can produce significant neurotoxicity due to oxidative stress [1012]. While ethanol itself is pro-oxidant because it directly generates reactive oxygen species during its metabolism [13], ethanol withdrawal (EW) produces oxidative stress indirectly through the activation of excitatory neurotransmitter receptors and the concomitant alteration of intracellular calcium levels [14]. It has been shown that sudden EW results in an increase in glutamate levels/glutamate receptor activity and a compensatory up-regulation of N-methyl-D-aspartate (NMDA) receptors [15,16] as well as in a decrease in GABA levels/GABA-receptor activity [17,18]. These events will eventually lead to oxidative stress [19]. Therefore, free-radical scavenging antioxidants may be beneficial to alleviate oxidative stress-initiated neuronal cell death during EW.
A plethora of evidence support that estrogens are powerful neuroprotectants. It has been established that the involvement of the nuclear estrogen receptors are not necessary to achieve neuroprotection [20]. Estrogens enhance cell survival by suppressing the neurotoxic stimuli partly via their direct radical-scavenging antioxidant activity [5]. We have previously shown that 17β-estradiol (E2, Figure 1) protects against insults associated with EW at neuronal, behavioral and signal transduction levels in rats [2123]. Brain tissues obtained from female rats showed increased LPO after EW in a manner that correlated with behavioral impairment, but was prevented with treatment by E2. We have also recently adopted an in vitro paradigm, the HT-22 immortalized hippocampal cell line, as a cellular model for EW [24,25]. We found that E2 treatment provided protection against cell death and LPO induced by EW toxicity. In the present exploratory study, we extended our investigation on the contribution of non-steroidal phenolic antioxidants to reduce the adverse effects of EW on this cell line. Specifically, we compared the efficacy of E2 with that of p-octylphenol (OP) and 2,6-di-tert-butyl-4-methylphenol (BHT), known phenolic antioxidants, to enhance HT-22 cell viability and reduce cellular oxidative damage upon EW. Here the antioxidant treatments started either simultaneously with the ethanol exposure [24] or only with EW. Control experiments were also done using an E2-derivative lacking the free phenolic OH believed to be the quintessential feature to achieve free radical scavenging antioxidant activity by phenolic compounds [26,27]. Additionally, an in silico study and a well-established cell-free assay of LPO [28,29] have also been done to predict the antioxidant potency of the test compounds.

2. Results and Discussion

2.1. Computational and cell-free inhibition of LPO studies

The chemical structures of phenolic compounds used in the present studies are shown in Figure 1. Earlier, we have found that the protective effect of estrogens against EW-induced neurotoxicity is in part due to their antioxidant activity [5], classifying them as simple phenolic antioxidants in this regard [20,27]. The antioxidant property of such compounds is attributed to the presence of the free phenolic OH group. Therefore, first an in silico prediction of the antioxidant potency of the test compounds was done by calculating the bond dissociation enthalpy (BDE) of the phenolic O-H bond (Table 1). BDE of this bond is one of the most important predictors for the antioxidant potency [3032] because this type of antioxidants exerts their action via an initial hydrogen transfer reaction to free radicals. The rate constant for this process depends on the strength of the O-H bond. As such, the potency of a phenolic antioxidant usually correlates well with BDE; although other factors, such as lipophilicity may also influence the free radical scavenging potency. (The test compounds used in our studies are all highly lipophilic molecules; logP of E2 is around 4 [33] and is approximately 1 log unit higher for BHT and OP [34,35]). For the polycyclic estrogens, planarity has also been proposed as a contributing factor contributing to cytoprotection [27].
Table 1 shows that based on the calculated BDE values BHT is projected to be the most potent free radical scavenging antioxidant (BDE = 77.0 kcal/mol), while E2 and OP may be considered equipotent. As mentioned above, LPO is a common marker of oxidative damage; therefore, we employed a widely used cell-free assay [28,29] to predict the capacity of E2, OP and BHT to inhibit LPO using linoleic acid as a lipid model. We chose this cell-free model because we first wanted to experimentally assess the “pure” antioxidant potency elicited by our selected test compounds. With both the ferric thiocyanate (FTC, [36]) and TBARS [37] methods, the inhibition of LPO is measured in the presence of various concentrations of the test compounds. The FTC method measures the amount of peroxides in initial stages of autooxidation. During the oxidation process, peroxides gradually decompose to carbonyls such as MDA which are measured with the TBARS method. Therefore, the two assays are complementary when they are used to evaluate antioxidant capacity to inhibit LPO.
In the cell free model, BHT showed the highest potency for suppressing the autooxidation of linoleic acid with both the FTC and TBARS methods, although with the latter method a similar IC50 was measured for E2 (Table 1). The high potency of BHT is not unexpected considering it is a hindered orto-disubstituted phenol derivative known to be a more effective antioxidant compared to the monosubstituted counterpart [38]. Altogether, the cell-free model for LPO has confirmed the in silico prediction regarding antioxidant potency of the test compounds based on BDE values.

2.2. Oxidative stress by continuous ethanol exposure and its subsequent removal on HT-22 cells

When the HT-22 cellular model was exposed to a steady concentration of 100 mM ethanol for 24 h as reported earlier [11,24,25,39], the cell viability (expressed as % of control and quantified by the Calcein AM assay [2426]) decreased significantly compared to the ethanol-free control cells (counted as 100%), as shown in Figure 2. Simultaneously, the levels of MDA and protein carbonylation enhanced significantly compared to those of the control cells. The cellular oxidative damage was even more profound when alcohol was suddenly removed and replaced with the culture media (Figure 2). EW further amplified LPO and protein carbonylation compared to those of the ethanol-treated cells, showing that EW, indeed, causes more oxidative damage in our in vitro model than a steady concentration of prolonged ethanol exposure. A similar tendency was also observed at higher concentration of alcohol exposure, while further extending the time of alcohol treatment did not significantly changed the outcome of oxidative markers (data not shown). As such, our data confirmed previous findings [11,24,25] that sudden EW eventually produces more oxidative stress than continuous ethanol treatment per se; therefore, this cell line is a more suitable model for EW than ethanol exposure.

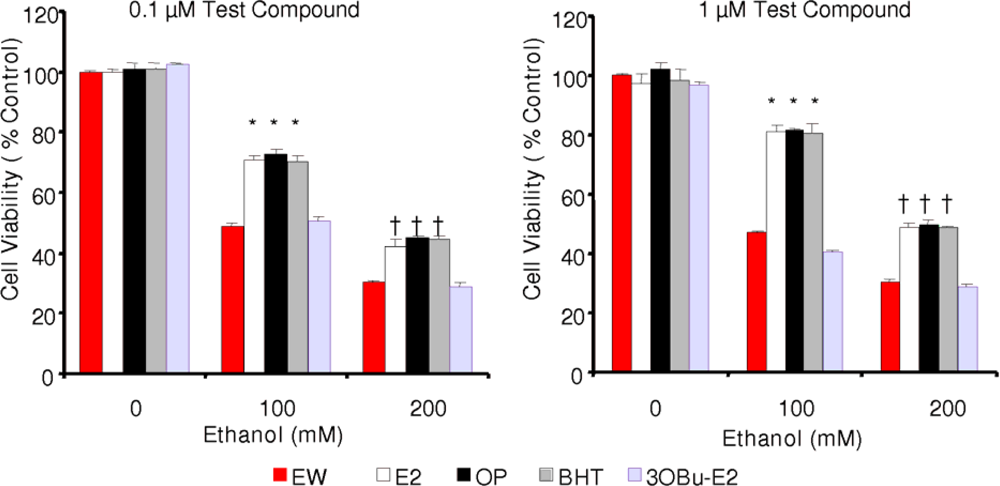
2.3. Effect of phenolic antioxidants on cell survival of EW-subjected HT-22 cells

In one set of experiments, HT-22 cells were treated with one of the phenolic antioxidants (E2, BHT or OP) at 0.1 μM or 1 μM concentration (in dimethyl sulfoxide, DMSO) at the same time the cells were exposed to the 24-h neurotoxic insult (100 mM or 200 mM ethanol, respectively). Following the 4-h EW [24], cell viability was assessed. Figure 3 shows, that there was a significant and dose-dependent increase in cell survival upon treating the cells with E2, OP or BHT at both doses of ethanol compared to control cells (EW cells without antioxidants treatment). At 0.1 μM antioxidant concentration cell viability increased by approximately 40% and at 1 μM dose by approximately 50%, respectively after both concentrations of ethanol treatment compared to the control. Surprisingly, these phenolic compounds were essentially equipotent to rescue the cells against the toxic insult, in spite of predictions shown in Table 1.
In order to demonstrate the crucial role of the free phenolic OH in reducing EW-induced oxidative stress by free radical scavenging antioxidant action, we also tested an E2 derivative, 3OBu-E2 (Figure 1) in which the phenolic OH is blocked by forming its butyl ether [26]. As expected, 3OBu-E2 was ineffective at counterbalancing the damaging effect of EW on cell survival, due to this compound’s inability to function as a phenolic antioxidant. In another set of experiments, antioxidant treatments started concomitantly with EW only; i.e., after the alcohol was removed and replaced with vehicle-containing medium and test compound. Notably, we obtained no significant difference in cell survivals (data not shown) from those measured after the co-treatment schedule described above (Figure 3). As such, E2, OP and BHT were basically equipotent at both concentrations (0.1 μM and 1.0 μM) demonstrating significant (p<0.001) and dose-dependent cell survival enhancement at both concentrations of ethanol exposure (100 mM and 200 mM, respectively), independently from the antioxidant treatment schedule. This observation may suggest that cells can be treated concomitantly with EW only to ameliorate cellular damage.

2.4. Effect of phenolic antioxidants on EW-induced lipid peroxidation

For exploring how EW induces LPO, cells were treated analogously to those of the cell survival studies. Without antioxidant treatment as shown in Figure 2, EW induced approximately a 1.5-fold increase in MDA production after 100 mM ethanol (and approximately a 2-fold increase after 200 mM ethanol exposure, data not shown) compared to that of the ethanol-free control group. When the cells were treated simultaneously with alcohol and a test compound E2, OP, or BHT, but not 3OBu-E2, were essentially equipotent in reducing LPO (Figure 4). For example, MDA levels decreased by approximately 15% and 30% at 200 mM ethanol exposure, when 0.1 μM and 1 μM of phenolic antioxidants were used, respectively. Moreover, in agreement with the cell survival studies, there was no significant effect of the treatments schedules; thus, antioxidant treatment during EW only produced practically the same decrease in LPO (data not shown) than co-treatment with EtOH (Figure 4). Additionally, there was no significant difference in the LPO–reducing potency of the phenolic test compounds under the experimental conditions used in our studies. This observation warrants further studies to ascertain the utility of HT-22 cells for testing various antioxidants to reduce LPO upon EW.

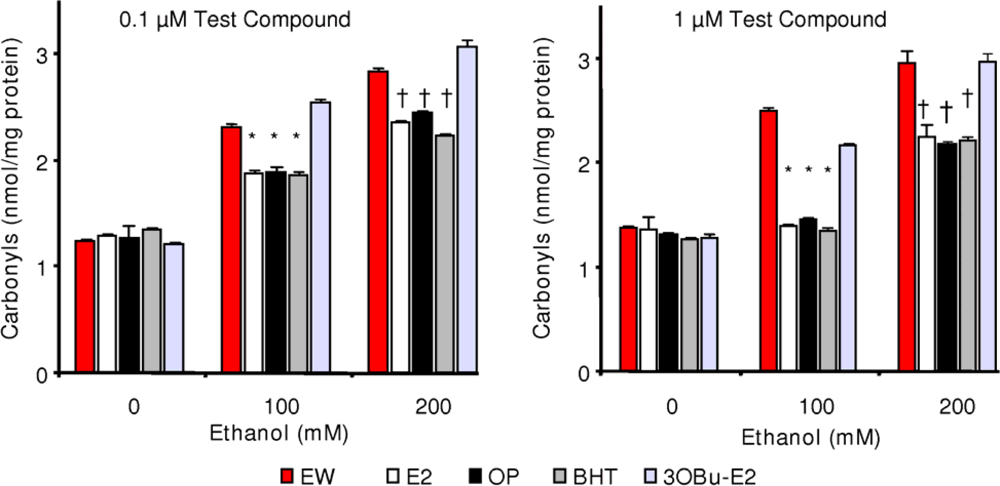
2.5. Effect of phenolic antioxidants on protein carbonylation

Consistent with the cell survival and LPO studies, antioxidant treatment had a profound effect on lowering protein carbonylation compared to the control cells (EW only), as shown in Figure. 5. Protein carbonylation in cells treated with E2, OP or BHT were significantly (p<0.01) lower than that of control cells (no antioxidant treatment after EW, Figure 2) or cells treated with 3-OBu-E2 at both doses of ethanol. As such, when e.g., 1.0 μM of antioxidant (E2, OP or BHT) treatment was used concomitantly with 100-mM ethanol exposure, the protein carbonyl levels decreased to approximately 1.4 nmol/mg protein from approximately 2.4 nmol/mg protein measured in the control cells. As with the cell survival and LPO studies, no statistically significant difference was observed in the protein carbonyl content among the antioxidants used here as well as between the treatment schedules (antioxidant treatment during ethanol exposure or during EW only) suggesting that antioxidant treatment is sufficient only during EW to prevent EW-induced oxidative damage to the cells.

3. Experimental Section

3.1. Materials

17β-Estradiol (E2) was purchased from Steraloids (New Port, RI). p-Octylphenol (OP) and 2,6-di-tert-butyl-4-methylphenol (BHT), as well as other chemicals used for cell culture studies were purchased from Sigma (St. Louis, MO). 3-O-Butyl-17β-estradiol (3OBu-E2) was prepared as reported before [26]. HT22 cells, a murine hippocampal cell line, were the generous gift of Dr. David Schubert (Salk Institute, San Diego, CA).

3.2. Computational studies

Bond dissociation enthalpies (BDEs) were calculated by a method incorporated into the window-based molecular modeling software BioMedCAChe (version 6.1, Fujitsu, Beaverton, OR) using PM5 semi-empirical quantum chemical approximation. Calculations were done after performing full geometry optimization (RMS gradient <0.1 kcal/[Å · mol]) and energy minimization by using the PM3 semi-empirical method with open-shell wave functions [unrestricted Hartree-Fock (UHF) approach], implemented in the BioMedCAChe (Fujitsu, Beaverton, OR) molecular modeling program (version 6.1).

3.3. Inhibition of lipid peroxidation

The capacity of the test compounds to inhibit LPO in a cell-free medium was studied according to published methods [28,29,40]. Incubation mixtures consisted of 2 mL of test compounds (at varying concentrations), 2.05 mL of 2.5% (v/v) linoleic acid in ethanol, 4 mL of 0.05 M phosphate buffer (pH 7.0) and 1.95 mL water, in a vial with a screw cap. Control experiments were also done using 2.05 ml EtOH only. The incubations were carried out in the dark at 40°C for nine days. Then, the samples were analyzed using both the FTC [36] and the TBARS methods [37]. For FTC, 0.1 mL incubation mixture and, then 0.1 mL of 30% (w/v) aqueous NH4SCN were added into 9.7 mL of 75% (v/v) aqueous ethanol. Thirty seconds after the addition of the NH4SCN, 0.1 mL of 0.02 M FeCl2 in 3.5% (v/v) HCl was added and 3 min later absorbance of the solution was measured. For TBARS, 0.4 mL 20% (w/v) trichloroacetic acid and 0.4 mL 0.67% (w/v) aqueous thiobarbituric acid were added to 0.2 mL of incubation mixture. After being kept at 90°C for 10 minutes, the sample was allowed to cool and a supernatant was obtained by centrifugation at 10,000 rpm for 40 minutes. The absorbance of the supernatant was measured at 532 nm. The percentage of inhibition was calculated as (1 – A/A0) * 100; where A was the absorbance of the solution containing the inhibitor and A0 represented the absorbance of the control. IC50 values were determined by non-lineal fitting to sigmoid dose–response profiles with the Scientist for Windows program (version 2.0, MicroMath, Salt Lake City, UT).

3.4. Cell culture

The HT-22 line was originally selected from HT4 cells that were immortalized from primary hippocampal neurons using a temperature-sensitive Small Virus-40 T antigen [41]. The cells were grown in Dulbecco’s Modified Eagle Medium, supplemented with 10% charcoal-stripped Fetal Bovine Serum (HyClone, Logan, UT) and gentamicin (50 μg/mL), at 37°C in an atmosphere containing 5% CO2 and 95% air. Protein contents were determined by the Bradford method [42] using BSA as a reference.

3.5. HT-22 cell treatments [24,25]

For the assessment of cell viability, HT-22 cells were plated into 96-well tissue culture plates at 4,000 cells per well in 100 μL of cell culture medium. The following day, the cells were continuously exposed to 0, 100 or 200 mM of alcohol for 24 hours. The culture plates or Petri dishes were tightly sealed with parafilm immediately after ethanol treatment to prevent its evaporation. For the continuous EtOH exposure condition, cell viability and oxidative markers were measured at the end of the 24-h ethanol exposure. In EW experiments, the ethanol-containing medium was replaced by vehicle-containing medium for 4 h immediately after the 24-h EtOH exposure [43,44]. No measurable alcohol could be detected under this condition of EW and the concentration of ethanol was steady during alcohol treatment. Additionally, no significant difference was measured in cell viability between the 24-h and 28-h ethanol treatment groups. At the end of the 4-h EW, cell viability and oxidative markers were measured. Stock solutions of test compounds were prepared at a concentration of 0.1 μM and 1.0 μM in DMSO and were given to cells either together with the 24-h EtOH exposure [24] or only at the beginning of EW. Vehicle-treated control cultures were exposed in parallel to the same concentration of DMSO present in the experimental cultures. There were no measurable effects of DMSO treatment on cell viability under these conditions. Additionally, in experiments using the phenolic compounds only (no alcohol exposure), no significant change in cell viability was measured compared to the vehicle-treated cells; therefore, these compounds are deemed to be non-toxic to the HT-22 cell line.

3.6. Calcein-AM viability assay

Cell viability was quantitated using the membrane-permeant Calcein-AM dye (Molecular Probes, Eugene, OR). Following the removal of the medium from the 96-well plates, the cells were rinsed once with phosphate-buffered saline (PBS, pH 7.4) and incubated in a solution of 2.5 μM Calcein-AM in PBS. Twenty minutes later, fluorescence was determined using a Bio-Tek FL600 microplate reader (Winooski, VT) with an excitation/emission filter set at 485/530 nM. Cell culture wells treated with methanol served as blanks.

3.7. MDA assay

For the assessment of MDA content, the cells were plated into Petri dishes (Greiner Bio-One, Monroe, NC) at approximately 106 cells per dish. The levels of MDA were assessed using a colorimetric assay (Calbiochem, San Diego, CA) in which a chromogenic reagent (1-methyl-2-phenylindole) reacts with MDA under acidic (HCl) condition and yields a stable chromophore with maximal absorbance at 586 nM. Cells treated with EtOH were washed with PBS, centrifuged (100,000 x g for 60 minutes at 4°C), and suspended in 1 mL of PBS. Cell lysis was then done by sonication. Cell homogenates and the chromogenic reagent were incubated at 45°C for 60 min then the samples were cooled off, and the absorbance was read at 586 nm.

3.8. Measurement of protein carbonyl formation

For the assessment of carbonyl content the cells were plated into Petri dishes (Greiner Bio-One, Monroe, NC) at approximately 106 cells per dish. The assay was performed according to Levine et al. [45] using the classical derivatizing agent, 2,4-dinitrophenylhydrazine (DNPH). First, cells were collected and protein assay was conducted to normalize samples. Cells were then centrifuged at 200 x g for 5 min at 4 °C. The pellets were resuspended in monobasic sodium phosphate (100 mM) buffer (pH=6.8) containing 3 % sodium dodecyl sulfate. A 500 μL sample at 1 mg/mL was made and then 10 mM of DNPH in 100 μl of 2N HCl was added. The samples were then vortexed followed by a 1h-incubation at room temperature in the dark. The protein was precipitated with equal volume of trichloroacetic acid (20%, v/v) upon incubation on ice for 10 min followed by centrifugation for 5 min at 5,000 rpm. The pellets were washed with 1 mL of ethanol and ethyl acetate (1:1,v/v), sonicated, and centrifuged for 10 min at 5000 rpm, then they were resuspended in the denaturing buffer, dissolved overnight at room temperature, and the absorbance was read at 360 nm. Carbonyl contents were expressed as nmol carbonyls/mg protein.

3.9. Statistical analysis

Each dose/time group contained seven to 10 observations and each experiment was repeated four times. Data are presented as mean ± S.E.M. Except for the control experiments (no test compounds were used), all data were analyzed by two-way ANOVA (ethanol dose x compounds) at each dose of compounds (0.1 and 1 μM). When significance (P<0.05) was observed, one- way (test compound) ANOVA was conducted to determine whether test compound treatments alter dependent variables (cell viability, protein carbonyls, and MDA) at each dose of ethanol (100 and 200 mM) followed by a post hoc Tukey test to identify which compound treatments made the differences. For the control experiments, two-way ANOVA (ethanol dose x EW or ethanol condition) followed by a post hoc Tukey test was conducted to identify whether dependent variables differ between ethanol treatment and EW conditions.

4. Conclusions

The HT-22 cell line is a widely used paradigm for the study of neuroprotective agents, such as estrogens, against a variety of toxic insults, although different modes of action (genomic vs. nongenomic) have been reported for this cellular model [46,47]. We have previously shown that E2 treatment produced significant neuroprotection against EW in this in vitro model. The goal of the present exploratory studies was to examine the efficacy of non-steroidal and simple phenolic antioxidants, specifically BHT and OP, to prevent oxidative stress induced by EW. Computational chemistry [3032] and a well-established cell-free assay of LPO [28,29] have also been done to assess the “pure” antioxidant potency of our test compounds. We concluded that BHT possessed the highest antioxidant potency (Table 1), and, thus, was expected to produce the maximal neuroprotection among the test compounds on the cell line.
We showed that EW produced more damage to the cells than ethanol exposure per se (Figure 2). When the cells were treated with E2, BHT or OP, a significant and dose-dependent reduction of cell death, LPO, and protein carbonylation was obtained after EW. However, contrary to theoretical prediction and cell-free measurements of antioxidant potencies, the three compounds were practically equipotent under the experimental conditions used in our in vitro studies (Figures 35). During these experiments, antioxidant treatment was done simultaneously with the 24-h ethanol insult. When the cells were exposed to the antioxidants during the 4-h EW only, the outcome was not significantly different (data not shown) from that obtained with the co-treatment schedule. Therefore, it may be sufficient to treat the cells with an antioxidant during EW only to alleviate the adverse effects of this neurotoxic insult. This finding will be explored in another study. On the other hand, an E2 derivate without free phenolic OH (3OBu-E2, Figure 1) had no effect on cell survival, MDA, and protein carbonyl formation, further implying the crucial role of free radical scavenging during EW to achieve neuroprotection. The lack of correlation between predictions derived from an in silico study and a cell-free assay in terms of antioxidant potency suggest, however, that it is highly unlikely that a single mechanism (i.e., the free-radical scavenging antioxidant action probed by our investigation) is responsible for the observed reduction of EW-initiated oxidative events with these phenolic compounds. Specifically, while E2 may be a less potent antioxidant than BHT, its protective effects may also involve a variety of genomic and non-genomic mechanisms implicated in estrogen neuroprotection [27]. Estrogenicity of OP has also been demonstrated [48] and it may contribute to the observed neuroprotection. It is worth emphasizing that the mechanism of neuroprotection observed in the HT-22 cell line has been proposed via both genomic and non-genomic routes [46,47]. In addition, these compounds may mediate neuroprotection by an interaction with the redox modulatory site at the NMDA receptor complex [49], although, there has been conflicting reports on the expression of functional NMDA in the HT-22 cell line [50,51].
In conclusion, our findings presented here imply that free-radical scavenging may not be the sole factor responsible for the observed neuroprotection during EW. Moreover, further studies are also needed to establish, whether the HT-22 line is indeed a suitable model for in vitro screening of antioxidants against EW-related neuronal damage.

Acknowledgments

We wish to thank to Andrew Wilson and Daniel Metzger for their technical assistance. This work was partially supported by the NIH grants AA013864, AA015982 (M.E.J.), NS044765 and AG025384 (L.P.). L.P. is the Robert A. Welch Professor at the UNTHSC (endowment number BK-0031).

References

  1. Sun, AY; Sun, GY. Ethanol and oxidative mechanisms in the brain. J. Biomed. Sci 2001, 8, 37–43. [Google Scholar]
  2. Gauvin, V. Free radical production during ethanol intoxication, dependence, and withdrawal. Alcohol. Clin. Exp. Res 1997, 2, 275–285. [Google Scholar]
  3. Shulman, RG; Rothman, D; Behar, KL; Hyder, F. Energetic basis of brain activity: Implications for neuroimaging. Trends Neurosci 2004, 27, 489–495. [Google Scholar]
  4. Bush, AI. Metals and neuroscience. Curr. Opin. Chem. Biol 2000, 4, 184–191. [Google Scholar]
  5. Prokai, L; Prokai-Tatrai, K; Perjesi, P; Zharikova, AD; Perez, EJ; Liu, R; Simpkins, JW. Quinol-based cyclic antioxidant mechanism in estrogen neuroprotection. Proc Natl Acad Sci USA 2003, 100, 11741–11746. [Google Scholar]
  6. Wagner, BA; Buettner, GR; Burns, CP. Free radical-mediated lipid peroxidation in cells: Oxidizability is a function of cell lipid bis-allylic hydrogen content. Biochemistry 1995, 33, 4449–4453. [Google Scholar]
  7. Janero, DR. Malondialdehyde and thiobarbituric acid-reactivity as diagnostic indices of lipid peroxidation and peroxidative tissue injury. Free Radical Biol. Med 1990, 9, 515–540. [Google Scholar]
  8. Prokai, L; Jun Yan, L; Vera-Serrano, JL; Stevens, SM, Jr; Forster, MJ. Mass spectrometry-based survey of age-associated protein carbonylation in rat brain mitochondria. J. Mass Spectrom 2007, 42, 1583–1589. [Google Scholar]
  9. Rauniyar, N; Stevens, SM; Prokai-Tatrai, K; Prokai, L. Characterization of 4-hydroxy-2-nonenal-modified peptides by liquid chromatography–tandem mass spectrometry using data-dependent acquisition: Neutral Loss-Driven MS3 versus Neutral Loss-Driven electron capture dissociation. Anal. Chem 2009, 81, 782–789. [Google Scholar]
  10. Nagy, J; Müller, F; László, L. Cytotoxic effect of alcohol-withdrawal on primary cultures of cortical neurons. Drug Alcohol. Depend 2001, 61, 155–162. [Google Scholar]
  11. Nagy, J; Horváth, C; Farkas, S; Kolok, S; Szombathely, Z. NR2B subunit selective NMDA antagonists inhibit neurotoxic effect of alcohol-withdrawal in primary cultures of rat cortical neurons. Neurochem. Int 2004, 44, 17–23. [Google Scholar]
  12. Crews, FT; Morrow, AL; Criswell, H; Breese, G. Effects of ethanol on ion channels. Int. Rev. Neurobiol 1996, 39, 283–367. [Google Scholar]
  13. Mantle, D; Preedy, VR. Free radicals as mediators of alcohol toxicity. Adverse Drug React. Toxicol. Rev 1999, 18, 235–252. [Google Scholar]
  14. N’Gouemo, P; Morad, M. Ethanol withdrawal seizure susceptibility is associated with upregulation of L- and P-type Ca2+ channel currents in rat inferior colliculus neurons. Neuropharmacology 2003, 45, 429–437. [Google Scholar]
  15. Tsai, GE; Ragan, P; Chang, R; Chen, S; Linnoila, VM; Coyle, JT. Increased glutamatergic neurotransmission and oxidative stress after alcohol withdrawal. Am. J. Psychiatry 1998, 155, 726–732. [Google Scholar]
  16. Rossett, ZL; Carboni, S. Ethanol withdrawal is associated with increased extracellular glutamate in the rat striatum. Eur. J. Pharmacol 1995, 283, 177–183. [Google Scholar]
  17. Hu, XJ; Ticku, MK. Functional characterization of a kindling-like model of ethanol withdrawal in cortical cultured neurons after chronic intermittent ethanol exposure. Brain Res 1997, 767, 228–234. [Google Scholar]
  18. Kumar, S; Fleming, RL; Morrow, AL. Ethanol regulation of gammaaminobutyric acid A receptors: genomic and nongenomic mechanisms. Pharmacol. Ther 2004, 101, 211–226. [Google Scholar]
  19. Girouard, H; Wang, G; Gallo, EF; Anrather, J; Zhou, P; Pickel, VM; Iadecola, C. NMDA receptor activation increases free radical production through nitric oxide and NOX2. J. Neurosci 2009, 29, 2545–2552. [Google Scholar]
  20. Prokai, L; Prokai-Tatrai, K; Perjesi, P; Simpkins, JW. Mechanistic insights into the direct antioxidant effects of estrogens. Drug Dev Res 2006, 66, 118–125. [Google Scholar]
  21. Jung, ME; Yang, SH; Brun-Zinkernagel, AM; Simpkins, JW. Estradiol protects against cerebellar damage and motor deficit in ethanol-withdrawn rats. Alcohol 2002, 26, 83–93. [Google Scholar]
  22. Jung, ME; Rewal, M; Perez, E; Wen, Y; Simpkins, JW. Estrogen protects against brain lipid peroxidation in ethanol-withdrawn rats. Pharmacol. Biochem. Behav 2004, 79, 573–586. [Google Scholar]
  23. Jung, ME; Gatch, BM; Simpkins, JW. The role of female sex steroids in chronic ethanol/ethanol withdrawal toxicity: potential mechanisms of estrogenic protection: review article. Exp. Biol. Med 2005, 230, 8–22. [Google Scholar]
  24. Jung, ME; Wilson, AM; Simpkins, JW. A nonfeminizing estrogen analog protects against ethanol withdrawal toxicity in immortalized hippocampal cells. J. Pharmacol. Exp. Ther 2006, 319, 543–550. [Google Scholar]
  25. Jung, ME; Wilson, AM; Ju, X; Wen, Y; Metzger, DB; Simpkins, JF. Ethanol withdrawal provokes opening of the mitochondrial membrane permeability transition pore in an estrogen preventable manner. J. Pharmacol. Exp. Ther 2009, 328, 692–698. [Google Scholar]
  26. Prokai, L; Oon, SM; Prokai-Tatrai, K; Abboud, K; Simpkins, JW. Synthesis and biological evaluation of 17β-alkoxyestra-1,3,5(10)-trienes as potential neuroprotectants against oxidative stress. J Med Chem 2001, 44, 110–114. [Google Scholar]
  27. Prokai, L; Simpkins, JW. Structure–nongenomic neuroprotection relationship of estrogens and estrogen-derived compounds. Pharmacol. Ther 2007, 114, 1–12. [Google Scholar]
  28. Koch, RB; Stern, B; Ferrari, CG. Linoleic acid and trilinolein as substrates for soybean lipoxidase(s). Arch. Biochem. Biophys 1958, 78, 165–179. [Google Scholar]
  29. Huang, D; Ou, B; Prior, RL. The chemistry behind antioxidant capacity assays. J. Agric. Food Chem 2005, 23, 1841–1856. [Google Scholar]
  30. Lucarini, M; Pedulli, GF. Bond dissociation enthalpy of α-tocopherol and other phenolic antioxidants. J. Org. Chem 1994, 59, 5063–5070. [Google Scholar]
  31. Zhang, HY; Sun, YM; Chen, DZ. O–H bond dissociation energies of phenolic compounds are determined by field/inductive effect or resonance effects? A DTF study and its implications. Quant. Struct.-Act. Relat 2001, 20, 148–152. [Google Scholar]
  32. Wright, JS; Johnson, ER; DiLabio, GA. Predicting the activity of phenolic antioxidants: theoretical method, analysis of substituent effects, and application to major families of antioxidants. J. Am. Chem. Soc 2001, 123, 11730–1183. [Google Scholar]
  33. Aĉanski, MM. Chromatographic behavior and lipophilicity of estradiol derivatives. Chromatographia 2005, 62, 475–482. [Google Scholar]
  34. Bizzozero, OA; Reyes, S; Ziegler, J; Smerjac, S. Lipid peroxidation scavengers prevent the carbonylation of cytoskeletal brain proteins induced by glutathione depletion. Neurochem. Res 2007, 32, 2114–2122. [Google Scholar]
  35. Jung, YJ; Kiso, Y; Park, HJ; Nishioka, K; Min, KS. Rejection properties of NF membranes for alkylphenols. Desalination 2006, 202, 278–285. [Google Scholar]
  36. Kikuzaki, H; Nakatani, N. Antioxidant effects of some ginger constituents. J. Food Sci 1993, 58, 1407–1410. [Google Scholar]
  37. Du, Z; Bramlage, WJ. Modified thiobarbituric acid assay for measuring lipid oxidation in sugar-rich plant tissue extracts. J. Agric. Food Chem 1992, 40, 1566–1570. [Google Scholar]
  38. Miller, CP; Jirkovsky, I; Hayhurst, DA; Adelman, SJ. In vitro antioxidant effects of estrogens with a hindered 3-OH function on the copper-induced oxidation of low density lipoprotein. Steroids 1991, 65, 305–308. [Google Scholar]
  39. Smothers, CT; Mrotek, JJ; Lovinger, DMN. Chronic ethanol exposure leads to a selective enhancement of N-methyl-D-aspartate receptor function in cultured hippocampal neurons. J. Pharmacol. Exp. Ther 1997, 293, 1214–1222. [Google Scholar]
  40. Ramarathnam, N; Osawa, T; Namiki, M; Kawakishi, S. Chemical studies on novel rice hull antioxidants. 1. Isolation, fractionation, and partial characterization. J. Agric. Food Chem 1988, 36, 732–737. [Google Scholar]
  41. Morimoto, BH; Koshland, DE, Jr. Induction and expression of long- and short-term neurosecretory potentiation in a neural cell line. Neuron 1990, 5, 875–880. [Google Scholar]
  42. Bradford, MM. A rapid and sensitive method for the quantitation of microgram quantities of protein utilizing the principle of protein-dye binding. Anal. Biochem 1976, 72, 248–254. [Google Scholar]
  43. Mostallino, MC; Mascia, MP; Pisu, MG; Busonero, F; Talani, G; Biggio, G. Inhibition by miltirone of up-regulation of GABAA receptor alpha4 subunit mRNA by ethanol withdrawal in hippocampal neurons. Eur. J. Pharmacol 2004, 494, 83–90. [Google Scholar]
  44. Li, HF; Kendig, JJ. Ethanol withdrawal hyper-responsiveness mediated by NMDA receptors in spinal cord motor neurons. Br. J. Pharmacol 2003, 139, 73–80. [Google Scholar]
  45. Levine, RL; Garland, D; Oliver, CN; Amici, A; Climent, I; Lenz, AG; Ahn, BW; Shaltiel, S; Stadtman, ER. Determination of carbonyl content in oxidatively modified proteins. Methods Enzymol 1990, 186, 464–478. [Google Scholar]
  46. Behl, C; Widmann, M; Trapp, T; Holsboer, F. 17-Beta estradiol protects neurons from oxidative stress-induced cell death in vitro. Biochem. Biophys. Res. Commun 1995, 216, 473–482. [Google Scholar]
  47. Deecher, DC; Daoud, P; Bhat, RA; O’Connor, LT. Endogenously expressed estrogen receptors mediate neuroprotection in hippocampal cells (HT22). J. Cell. Biochem 2005, 95, 302–312. [Google Scholar]
  48. Laws, SC; Carey, SA; Ferrell, JM; Bodman, GJ; Cooper, RL. Estrogenic activity of octylphenol, nonylphenol, bisphenol A and methoxychlor in rats. Toxicol. Sci 2000, 54, 154–167. [Google Scholar]
  49. Johansson, T; Frändberg, PA; Nyberg, F; Le Grevès, P. Molecular mechanisms for nanomolar concentrations of neurosteroids at NR1/NR2B receptors. J Pharmacol Exp Ther 2008, 324, 759–768. [Google Scholar]
  50. Zaulyanov, LL; Green, PS; Simpkins, JW. Glutamate receptor requirement for neuronal death from anoxia-reoxygenation: an in Vitro model for assessment of the neuroprotective effects of estrogens. Cell. Mol. Neurobiol 1999, 19, 705–718. [Google Scholar]
  51. Martin, AM; Kuhlmann, C; Trossbach, S; Jaeger, S; Waldron, E; Roebroek, A; Luhmann, HJ; Laatsch, A; Weggen, S; Lessmann, V; Pietrzik, CU. The functional role of the second NPXY motif of the LRP1 beta-chain in tissue-type plasminogen activator-mediated activation of Nmethyl-D-aspartate receptors. J. Biol. Chem 2008, 283, 12004–12013. [Google Scholar]
Figure 1. Chemical structures of E2, OP, BHT and 3OBu-E2.
Ijms 10 01773f1
Figure 2. Oxidative stress (OS) markers on HT-22 cells after 24-h ethanol (EtOH, 100 mM) exposure and subsequent 4-h ethanol withdrawal (EW). In control experiments (vehicle only) cell viability was counted as 100%, MDA level was 173 ± 6.5 nmol/mg protein and protein carbonyl content was 1.28 ± 0.01 nmol/mg protein. Data are given as mean ± S.E.M. for n=4. Both ethanol exposure ( Ijms 10 01773i01) and EW ( Ijms 10 01773i02
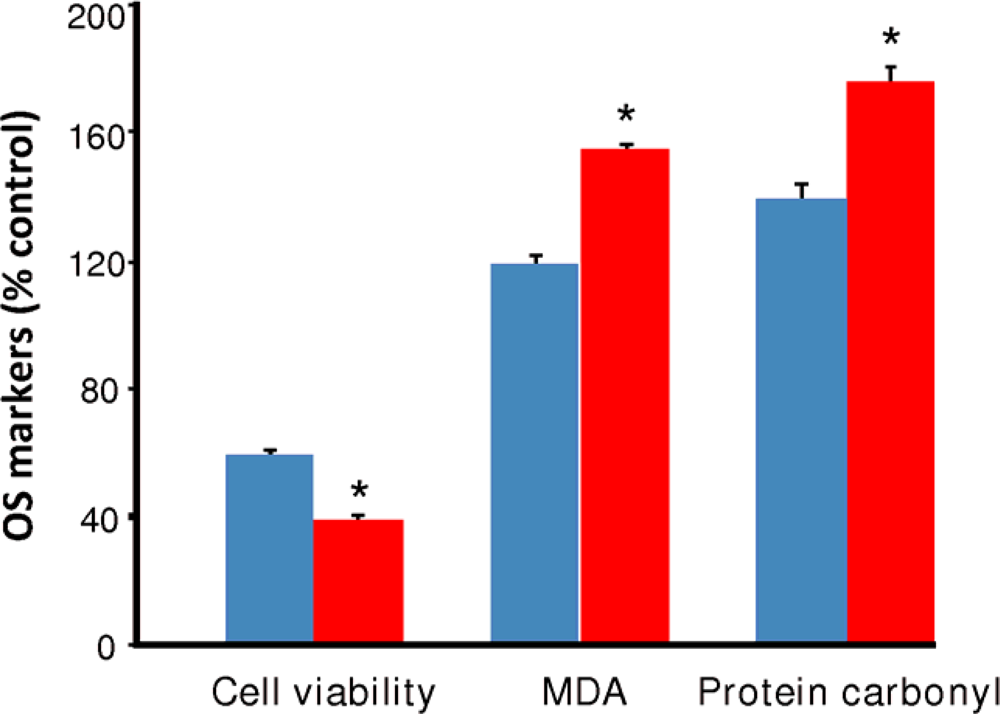
), produced a statistically significant difference (p<0.001) in OS markers from those measured in control experiments. Asterisk indicates a significant difference (p<0.01) between EW vs EtOH exposure only.
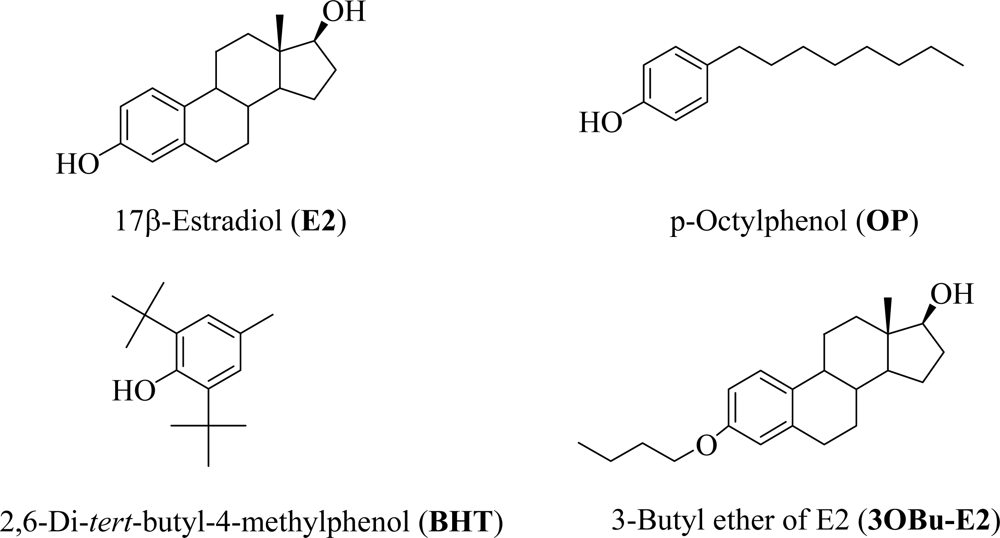
Ijms 10 01773f2
Figure 3. Effect of E2, OP, BHT and 3OBu-E2 on EW-induced cytotoxicity. Data are given as mean ± S.E.M. (n=4),*p<0.001 and †p<0.01 vs. corresponding EW control (no test compound) experiments.
Ijms 10 01773f3
Figure 4. Effect of E2, OP, BHT and 3OBu-E2 on EW-induced lipid peroxidation. Data are given as mean ± S.E.M. (n=4). *p<0.001 and p<0.01 vs. corresponding EW control.
Ijms 10 01773f4
Figure 5. Effects of E2, OP, BHT and 3OBu-E2 on EW-induced protein carbonylation. Data are given as mean ± S.E.M. for n=4. *p<0.001 and p<0.01 vs. corresponding EW.
Ijms 10 01773f5
Table 1. Calculated BDE of the phenolic O–H and a cell-free LPO inhibitory potency of E2, OP and BHT, respectively.
CompoundBDE (kcal/mol)IC50 (μM)
FTCTBARS
E281.111.8 ± 1.63.9 ± 0.4
OP80.7130.0 ± 1864.8 ± 5.3
BHT77.04.4 ± 0.63.5 ± 0.5
BDE and IC50 values were determined as described in Section 3.

