Article

A Chemiluminescent Method for the Detection of H2O2 and Glucose Based on Intrinsic Peroxidase-Like Activity of WS2 Quantum Dots

by
Mahsa Haddad Irani-nezhad
1,2,
Alireza Khataee
2,3,*,
Javad Hassanzadeh
2 and
Yasin Orooji
1,*
1
College of Materials Science and Engineering, Nanjing Forestry University, No. 159, Longpan Road, Nanjing 210037, Jiangsu, China
2
Research Laboratory of Advanced Water and Wastewater Treatment Processes, Department of Applied Chemistry, Faculty of Chemistry, University of Tabriz, Tabriz 51666-16471, Iran
3
Health Promotion Research Center, Iran University of Medical Sciences, Tehran 1449614535, Iran
*
Authors to whom correspondence should be addressed.
Molecules 2019, 24(4), 689; https://doi.org/10.3390/molecules24040689
Submission received: 8 January 2019 / Revised: 7 February 2019 / Accepted: 13 February 2019 / Published: 14 February 2019
(This article belongs to the Special Issue Novel Fluorescent Metal Nanoclusters as Biosensors)

Abstract

:
Currently, researchers are looking for nanomaterials with peroxidase-like activity to replace natural peroxidase enzymes. For this purpose, WS2 quantum dots (WS2 QDs) were synthesized via a solvothermal method, which improved the mimetic behavior. The resulting WS2 QDs with a size of 1–1.5 nm had a high fluorescence emission, dependent on the excitation wavelength. WS2 QDs with uniform morphology showed a high catalytic effect in destroying H2O2. The peroxidase-like activity of synthesized nanostructures was studied in H2O2 chemical and electrochemical reduction systems. The mimetic effect of WS2 QDs was also shown in an H2O2–rhodamine B (RB) chemiluminescence system. For this aim, a stopped-flow chemiluminescence (CL) detection system was applied. Also, in order to confirm the peroxidase-like effect of quantum dots, colorimetry and electrochemical techniques were used. In the enzymatic reaction of glucose, H2O2 is one of the products which can be determined. Under optimum conditions, H2O2 can be detected in the concentration range of 0–1000 nmol·L−1, with a detection limit of 2.4 nmol·L−1. Using this CL assay, a linear relationship was obtained between the intensity of the CL emission and glucose concentration in the range of 0.01–30 nmol·L−1, with a limit of detection (3S) of 4.2 nmol·L−1.

1. Introduction

Hydrogen peroxide, used in biological, pharmaceutical, clinical, food, chemical, and environmental processes, became an interesting subject for research since its discovery (1818). Hydrogen peroxide, as one of the most reactive oxygen forms, is an essential intermediate in different fields such as sterilization, paper bleaching, liquid fuel cells, and organic oxidation [1]. Many analytical methods were developed to measure hydrogen peroxide, namely fluorescence [2], colorimetric [3], resonance dispersion [4], chromatography [5], and electrochemical methods [6].
Glucose is a simple sugar that circulates in the blood of animals as blood glucose. Containing six carbon atoms, glucose is a subset of monosaccharides which is considered as a hexose. d-Glucose is one of 16 aldo-hexosuric stereoisomers. It can be obtained by hydrolyzing carbohydrates such as lactose, sucrose, maltose, cellulose, glycogen, etc. A higher or lower concentration than 4.4–6.6 mmol·L−1 in human blood causes serious hyperglycemia and hypoglycemia, respectively [7].
Various analytical methods used to determine H2O2 and glucose are not suitable for fast and economical measurement. Some of these methods are simple and economical, but have low sensitivity; some are sensitive, selective and valid, whereas they are time-consuming, expensive, or need skilled personnel; and others are quick and sensitive, but they are not selective [3]. Meanwhile, chemiluminescence (CL) attracted a lot of attention due to its high sensitivity, simple arrangement, fast response, and low background signal. CL, as a phenomenon, occurs when the product in an excited electronic state, resulting from an exoergic reaction, returns to the ground state via the emission of photons [8]. CL assays are applied in batch, flow injection mode, or stopped-flow procedures [9,10]. Both flow and batch CL processes can forgather as stopped flow [11].
Pokropiony and Ivanovsky presented a classification for nanomaterials, which includes zero- (0D), one- (1D), two- (2D), and three-dimensional (3D) nanomaterials [12]. Zero-dimensional nanomaterials, including uniform particle arrangements (quantum dots), shell–cavity quantum dots, particle heterogeneous arrangements, layered nanostructures, nanolenses, and hollow cores were synthesized by various research groups [13,14,15,16]. The 0D nanoparticles, such as quantum dots (QDs), are widely used in light-emitting diodes (LEDs) [17], solar cells [18], single-electron transistors [19], and lasers [20]. The QDs are crystals in the nanometer range, so that hundreds to a few thousand atoms can fit in the same direction. They are composed of a semiconductor, such as silicon, and because they act like an atom, they are called synthetic atoms. The crystal lattice of semiconductor QDs affects the electronic wave function. The QDs have a special energy spectrum, depending on the band gap and the special density of the electron-out-of-crystal mode [21,22].
Peroxidases constitute a large family of enzymes that normally catalyze the reactions as follows:
R O O R + 2 e + 2 H + R O H + R O H .
Hydrogen peroxide and organic hydro-peroxides such as lipid peroxides are favorable substrates for peroxidase. The nature of the electron donor is highly dependent on the enzyme’s structure. The peroxidase activity of enzymes has enormous practical applications, such as reducing toxicity by catalyzing the oxidation of organic materials, eliminating dyes in wastewater refinement, or use as a diagnostic tool [23]. Despite the limitations of the natural enzyme, such as enzyme structural changes by pH, temperature, and solvent variations, the short life span of the enzyme, and the cost-effective preparation and purification process, it is widely used in the manufacture of sensors for the detection of the oxidase products of enzymatic reactions [24,25]. Many artificial enzymes were synthesized to compensate for the limitations of natural enzymes and improve the stability of these catalysts over a wide range of pH and temperature [26]. Some nanomaterials including MoS2 nanosheets [27], Co3O4 nanoparticles [28], V2O5 nanowires [29], carbon nanotubes [30], graphene oxide [31], and carbon QDs [32] have catalytic peroxidase activity.
Transition metal dichalcogenides are layered compounds with weak interlayer interactions and strong bindings within the layers. WS2 is one of the members of this family that is applied as a lubricant, catalyst, a component of lithium batteries, and so on [33,34]. Nanoscale WS2 has desirable properties such as high specific surface area and remarkable electronic properties that bulk WS2 materials do not demonstrate [35,36]. There are several methods to synthesize WS2 nanosheets such as liquid exfoliation [37,38,39], chemical vapor deposition [40], and mechanical exfoliation [41]. WS2 QDs can be generated by reducing the lateral size of nanosheets [42,43,44].
In this study, WS2 QDs were synthesized using a solvothermal process. The synthesized quantum dots were characterized using transmission electron microscopy (TEM), X-ray diffraction (XRD), and photoluminescence (PL) techniques. Then, the peroxidase-like activity of the synthesized quantum dots was studied in the chemical and electrochemical reduction of H2O2 systems. For this aim, CL, colorimetry, and electrochemical techniques were exploited. Effective parameters in selected systems, including type and concentration of reagents such as rhodamine B (RB), sodium dodecyl sulfate (SDS), and QDs, were optimized. Finally, the suggested method was tested for determination of glucose in real samples. Glucose participates in an enzymatic oxidation reaction, leading to the production of hydrogen peroxide, which then can be detected by a developed CL system based on WS2 QDs. The product of this reaction has a strong CL emission proportional to the H2O2 or glucose concentration (Scheme 1).

2. Results and Discussion

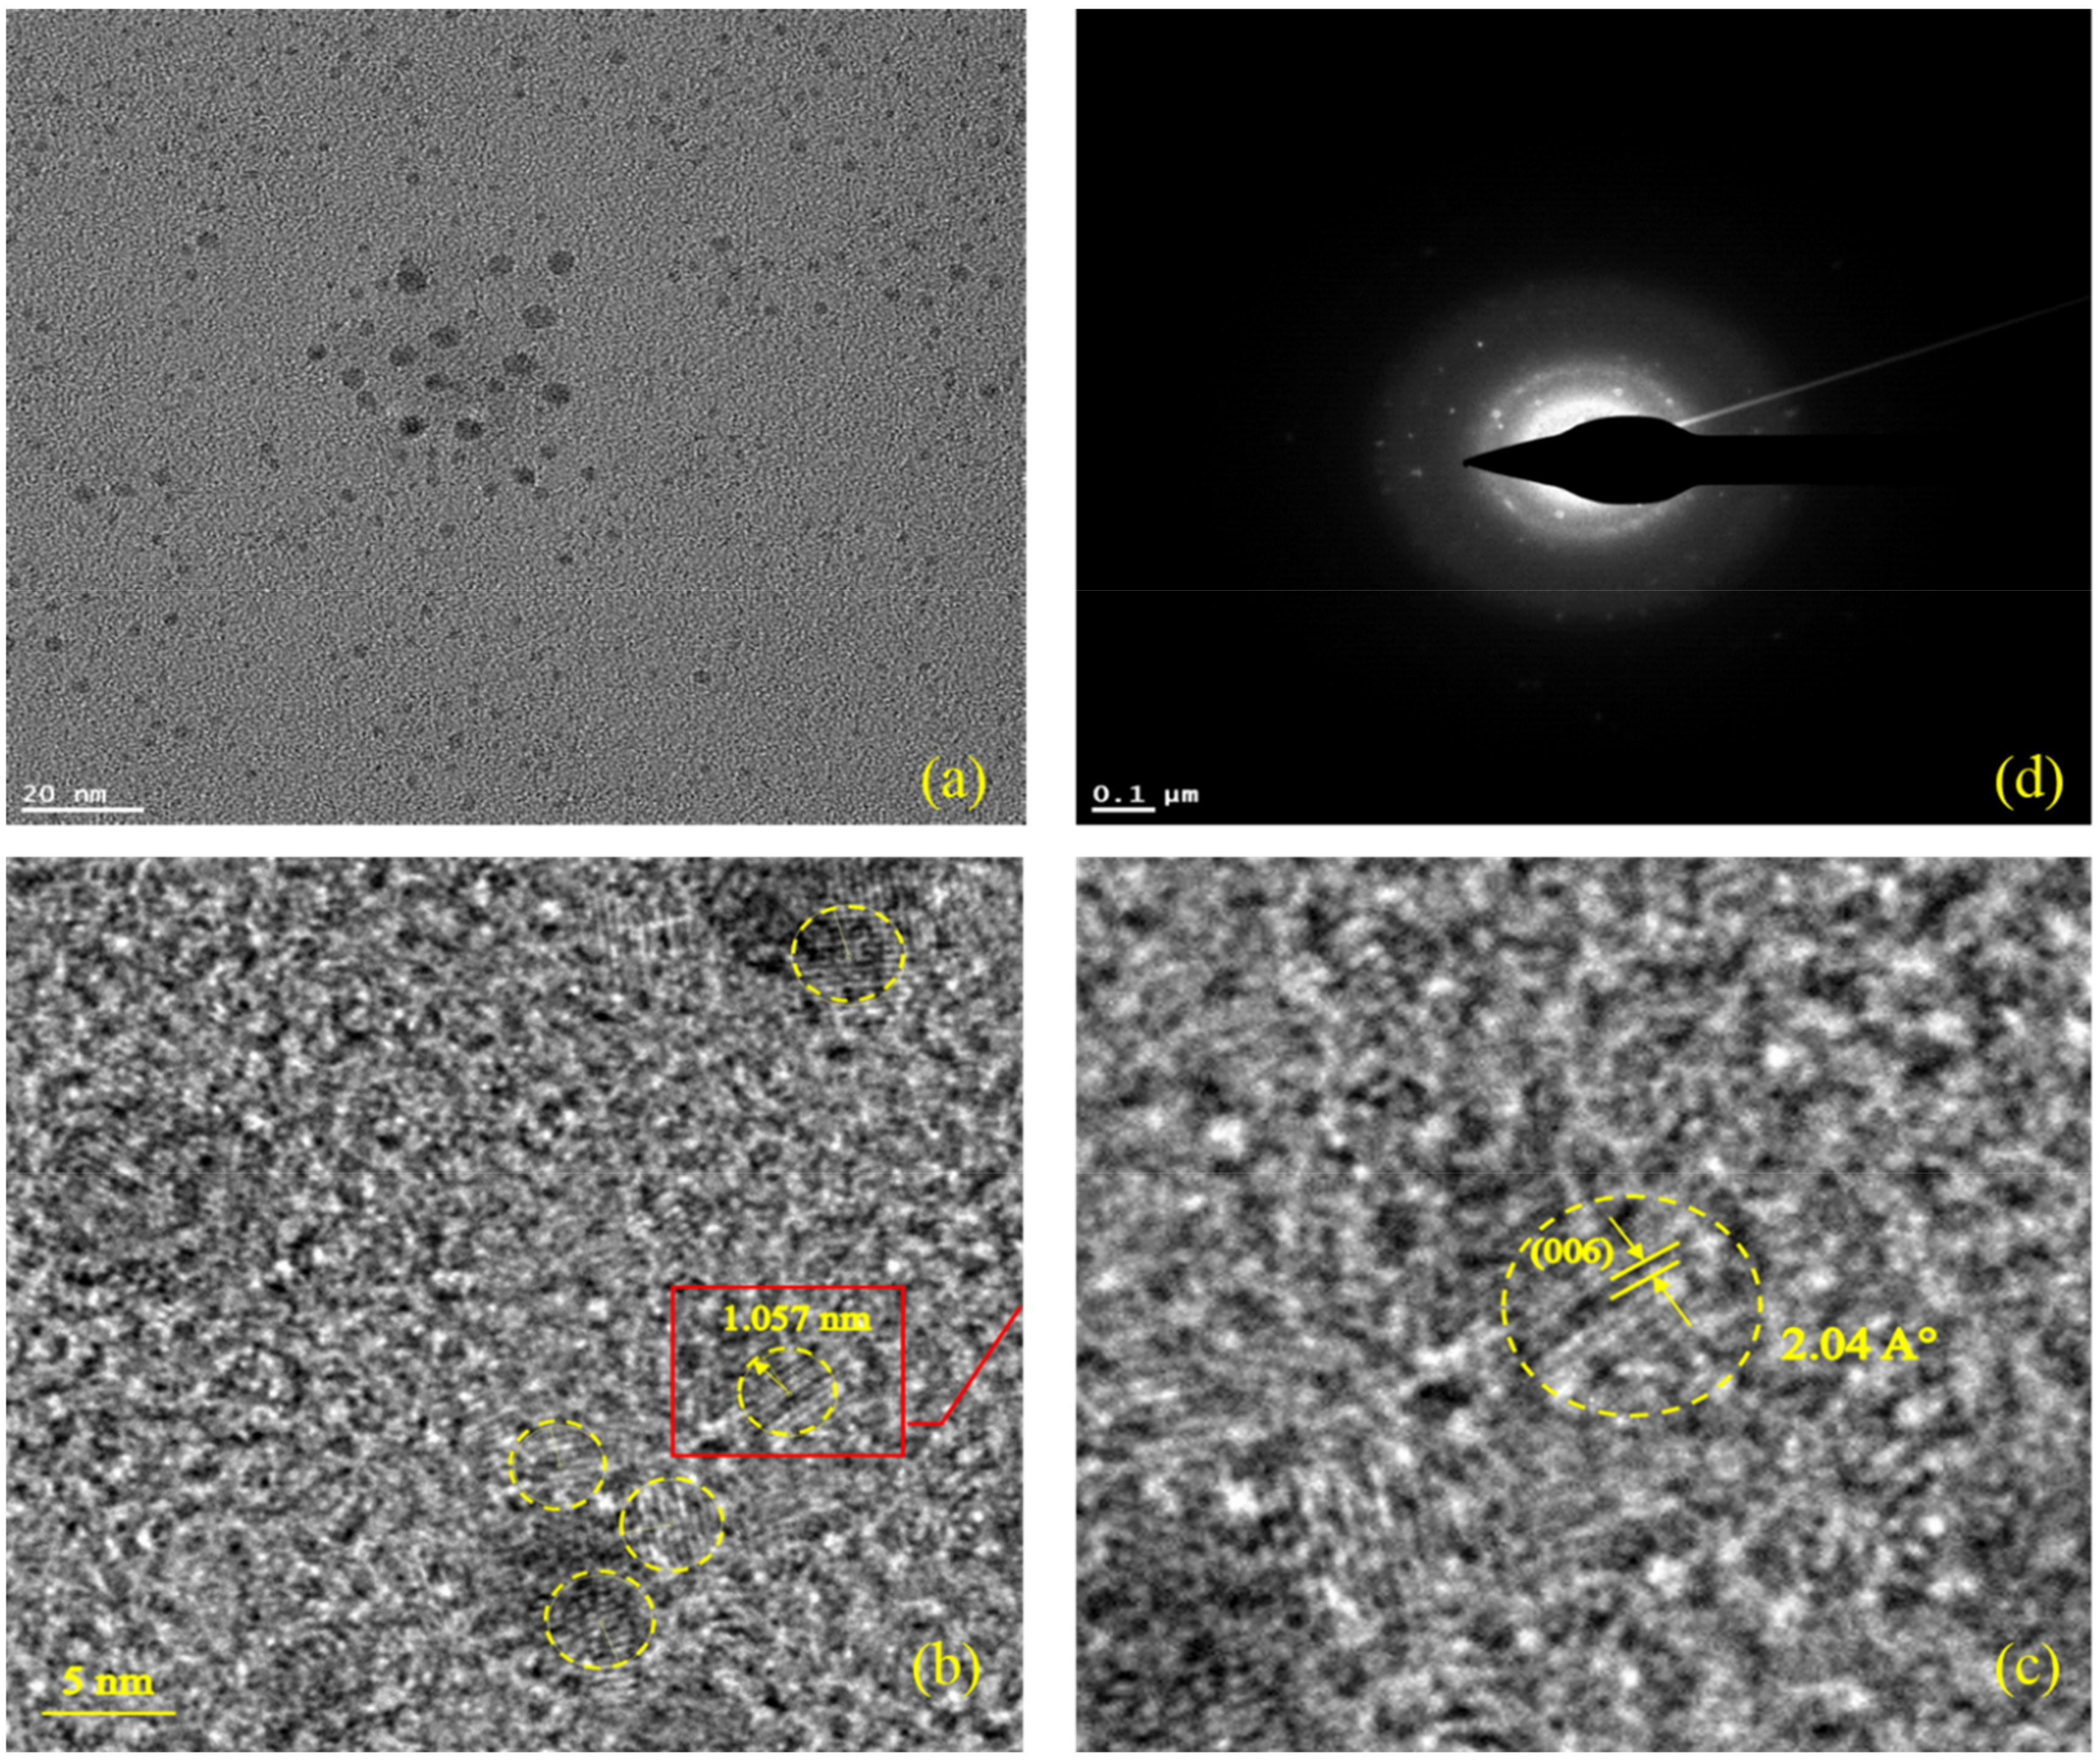
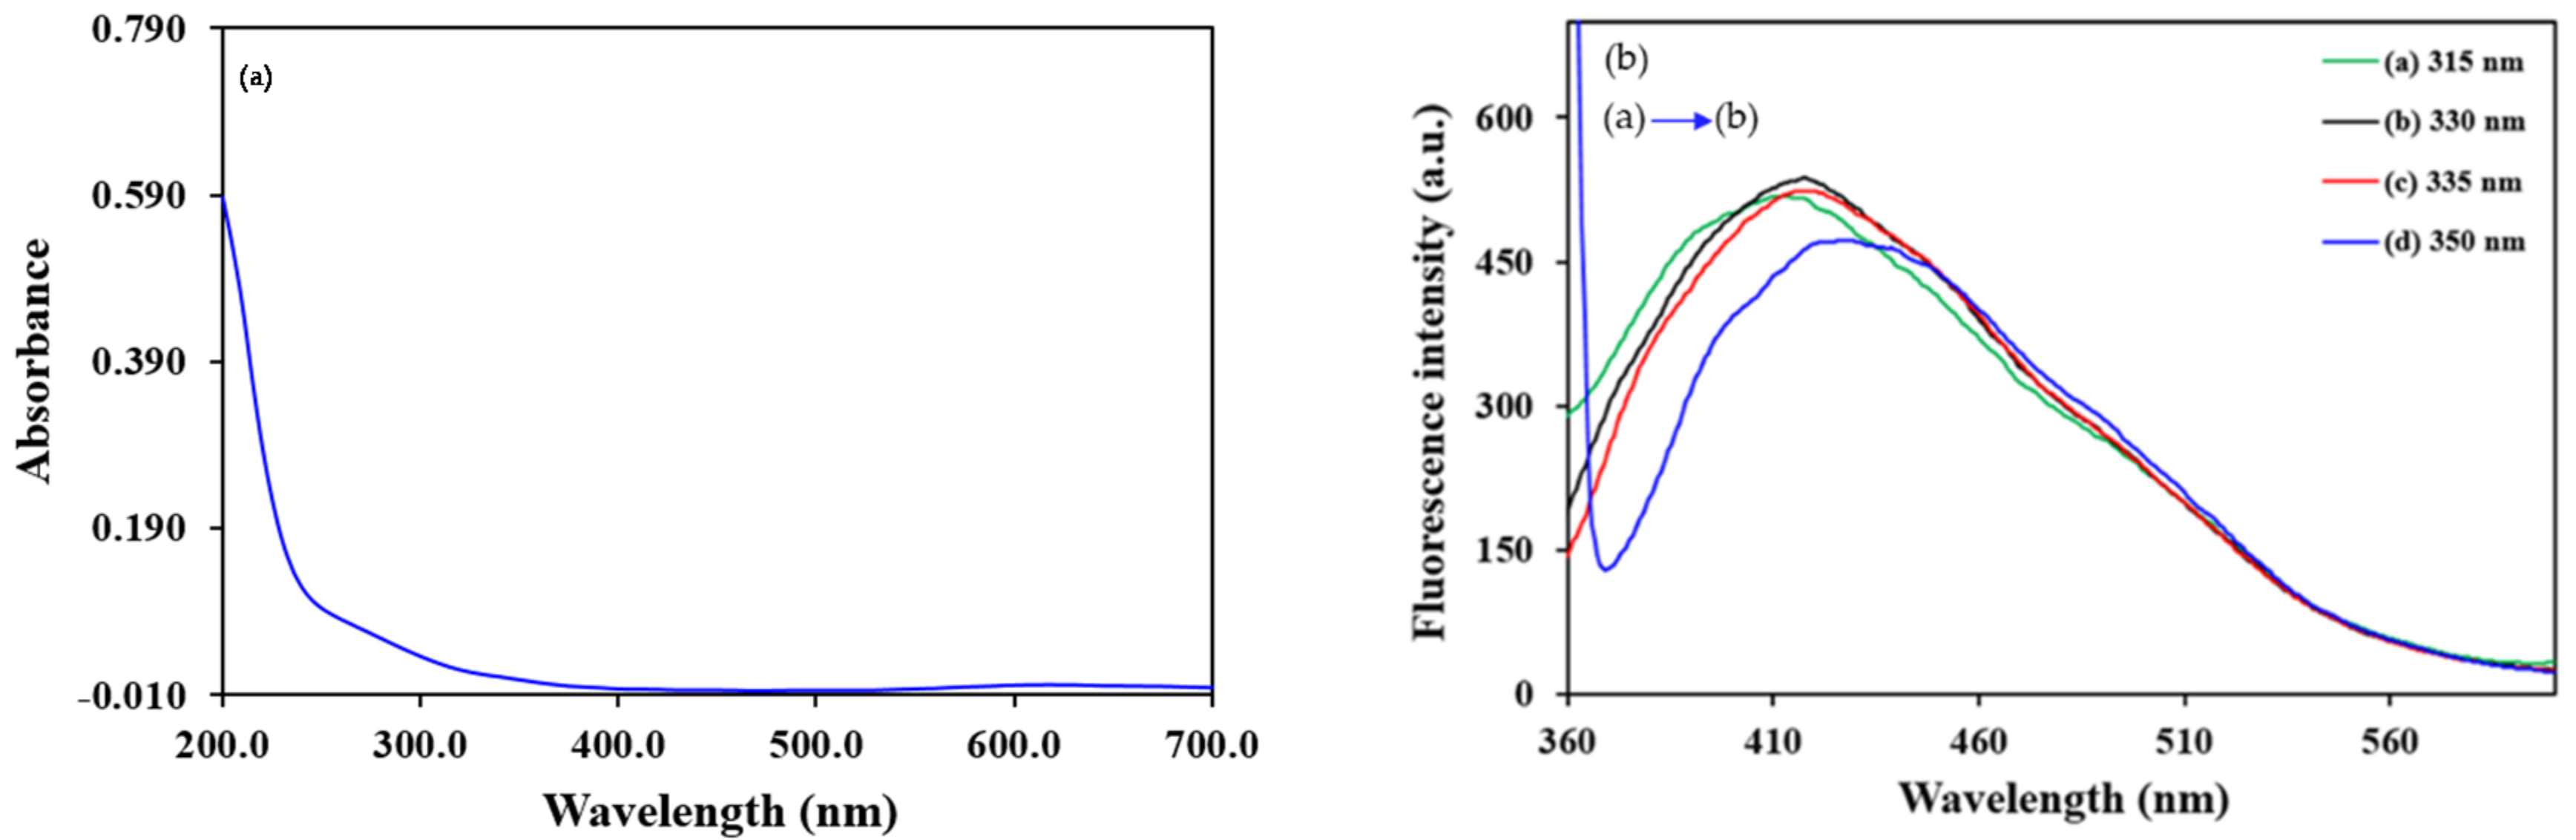
2.1. Study of Chemical Structure and Morphology of WS2 QDs

In order to study the crystal phase and purity of the as-synthesized WS2 QDs, XRD was utilized. As reported in previous literature, WS2, in the form of QDs, does not show any signal in XRD pattern [37,45]. The results showed no peak that was related to the very small sizes of QDs (Figure S1, Supplementary Materials).
The morphology of WS2 QDs was investigated by TEM and high-resolution TEM (HRTEM). As seen in Figure 1, QDs are high crystalline. Synthesized WS2 nanocrystals showed an average diameter of 1.057 nm and a lattice spacing of 2.04 Å, which corresponds to the (006) phase of the WS2 crystal (JCPDS 08-0237). The selected area electron diffraction pattern (SAED) was used for further verification of the structure. The results confirmed WS2 QDs as being polycrystalline, distinct from bulk WS2. This demonstrates that the bulk WS2 was exfoliated during the sonication and hydrothermal processes.
The solution of WS2 QDs was clear and yellow and showed bright-blue PL. As shown in Figure 2a, only a weak peak around 300 nm was observed due to the excitonic feature of the QDs. Figure 2b indicates the PL spectra of the WS2 QD solution prepared by the method described above at a distinct excitation wavelength. Changing the excitation wavelength in the range of 315–350 nm caused shifting of the fluorescence peak from 400 nm to 440 nm. It was observed that the maximum emission was at about 420 nm with an excitation wavelength of 330 nm. The intensity of the fluorescence increased up to λex = 330 nm and then decreased, as observed in the previously reported WS2 QDs synthesis methods [46,47]. Changing the electronic structure of WS2 from an indirect band gap to a direct band gap led the observation of PL in QDs. The strong peak at 420 nm (with λex = 330) was attributed to the strong quantum confinement with a shoulder at 435 nm (with λex = 350) due to the incorporation of defect states created during exfoliation.

2.2. Investigation of Peroxidase-Like Activity of WS2 QDs

Initial experiments demonstrated that WS2 QDs have intrinsic peroxidase mimetic activity in the dissociation reaction of H2O2 to hydroxyl radicals, which offers many advantages in comparison with horseradish peroxidase (HRP). Several detection methods such as colorimetry, electrochemical methods, and CL were applied to investigate the peroxidase effect of synthesized QDs. It is worth mentioning that all experiments were done in optimized conditions (including type of buffer, pH, and concentration of reactants).

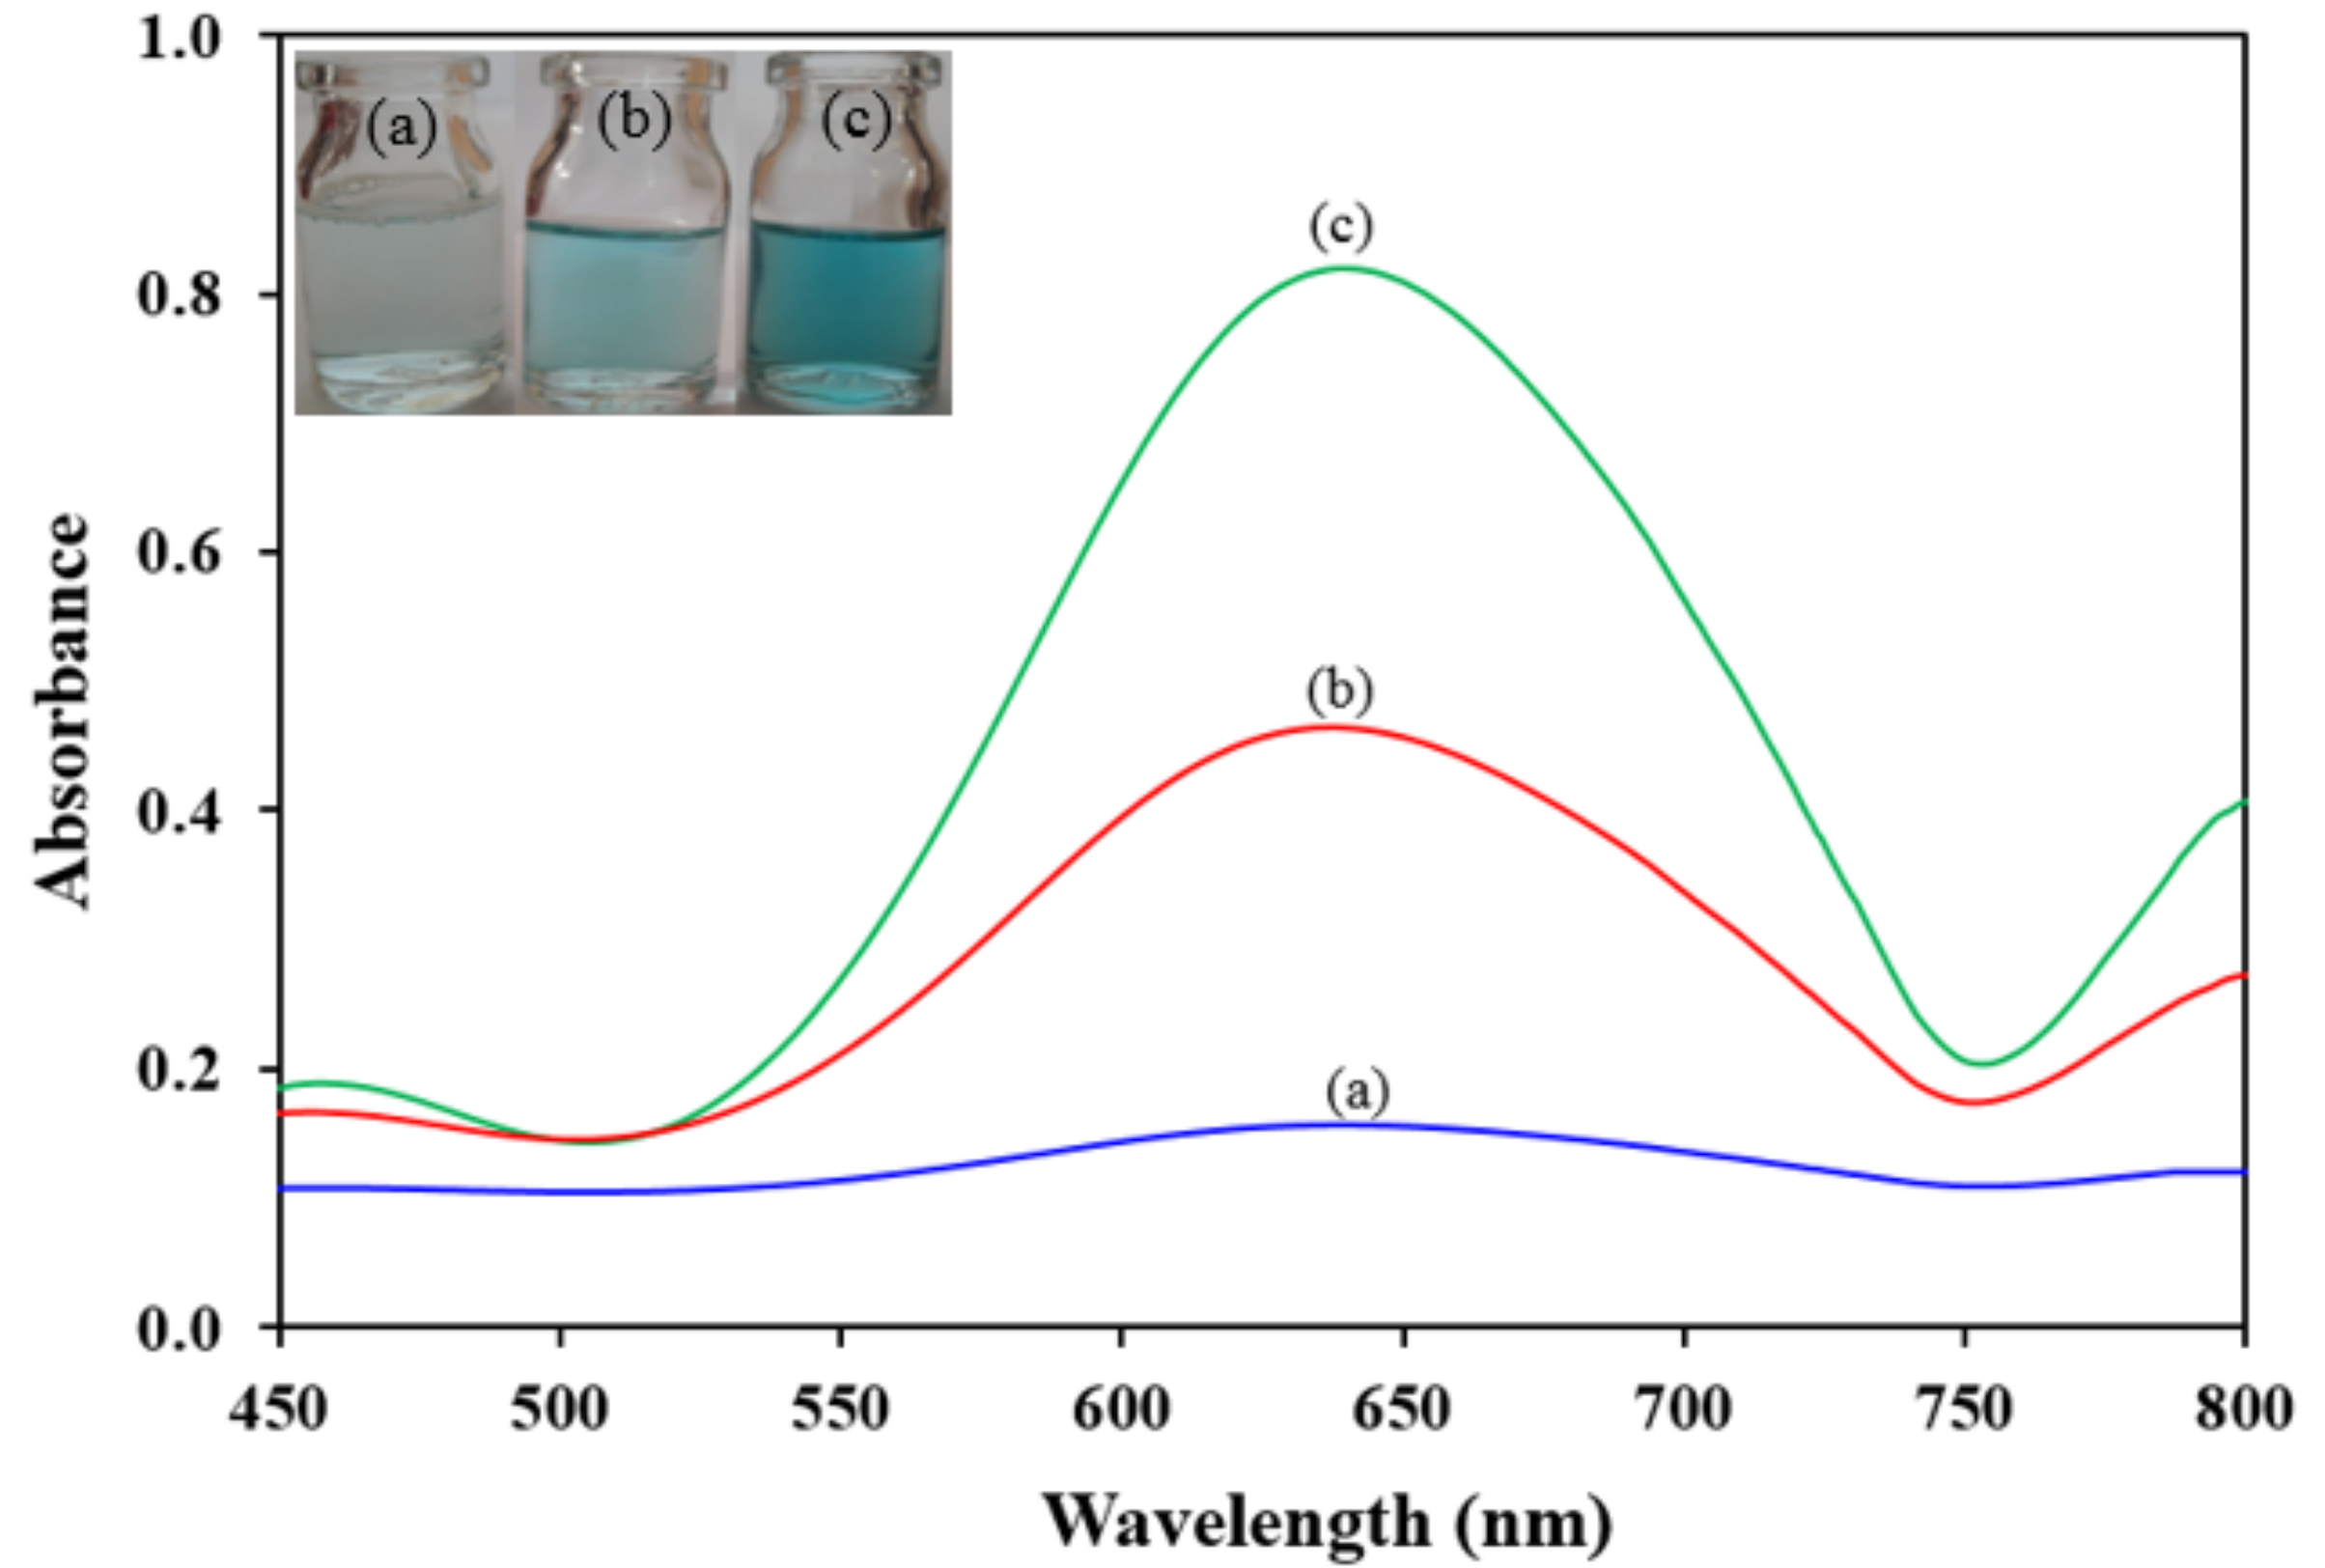
2.2.1. Colorimetry Investigations

The compound 3,3′,5,5′-tetramethylbenzidine (TMB) was used as a peroxidase substrate to study the peroxidase mimetic behavior of prepared QDs. WS2 QDs can catalyze the oxidation of substrate by reacting with H2O2 in order to produce the colorful productions. As a result of TMB oxidation, a product with the maximum absorbance at the wavelength of 652 nm was generated (Figure 3). As can be seen from the results, the solution including WS2 QDs was more colorful than the others. Moreover, in the absence of H2O2 or QDs, no reactions happened between TMB and H2O2, indicating that the presence of both is necessary for TMB oxidation, just as in the case occurring with natural peroxidase HRP.
The high peroxidase activity of WS2 QDs was studied via steady-state kinetics. The Michaelis–Menten equation was used for obtaining initial rates of each series of reactions (Figures S2a,b, Supplementary Materials):
1 / υ = ( K m / V m ) . ( 1 / [ S ] ) + 1 / V m a x .
Values of Km and Vmax were calculated from Lineweaver–Burk graphs (Figure S2c,d, Supplementary Materials) and the results were compared with the amounts of HRP (Table S1, Supplementary Materials). The lower Km indicates a higher affinity of WS2 QDs for the substrates (both TMB and H2O2). Accordingly, a very low concentration of substrate was needed to reach the maximum performance. The prepared nanoperoxidase had higher efficiency in the TMB–H2O2 reaction compared with HRP (Table S1, Supplementary Materials).

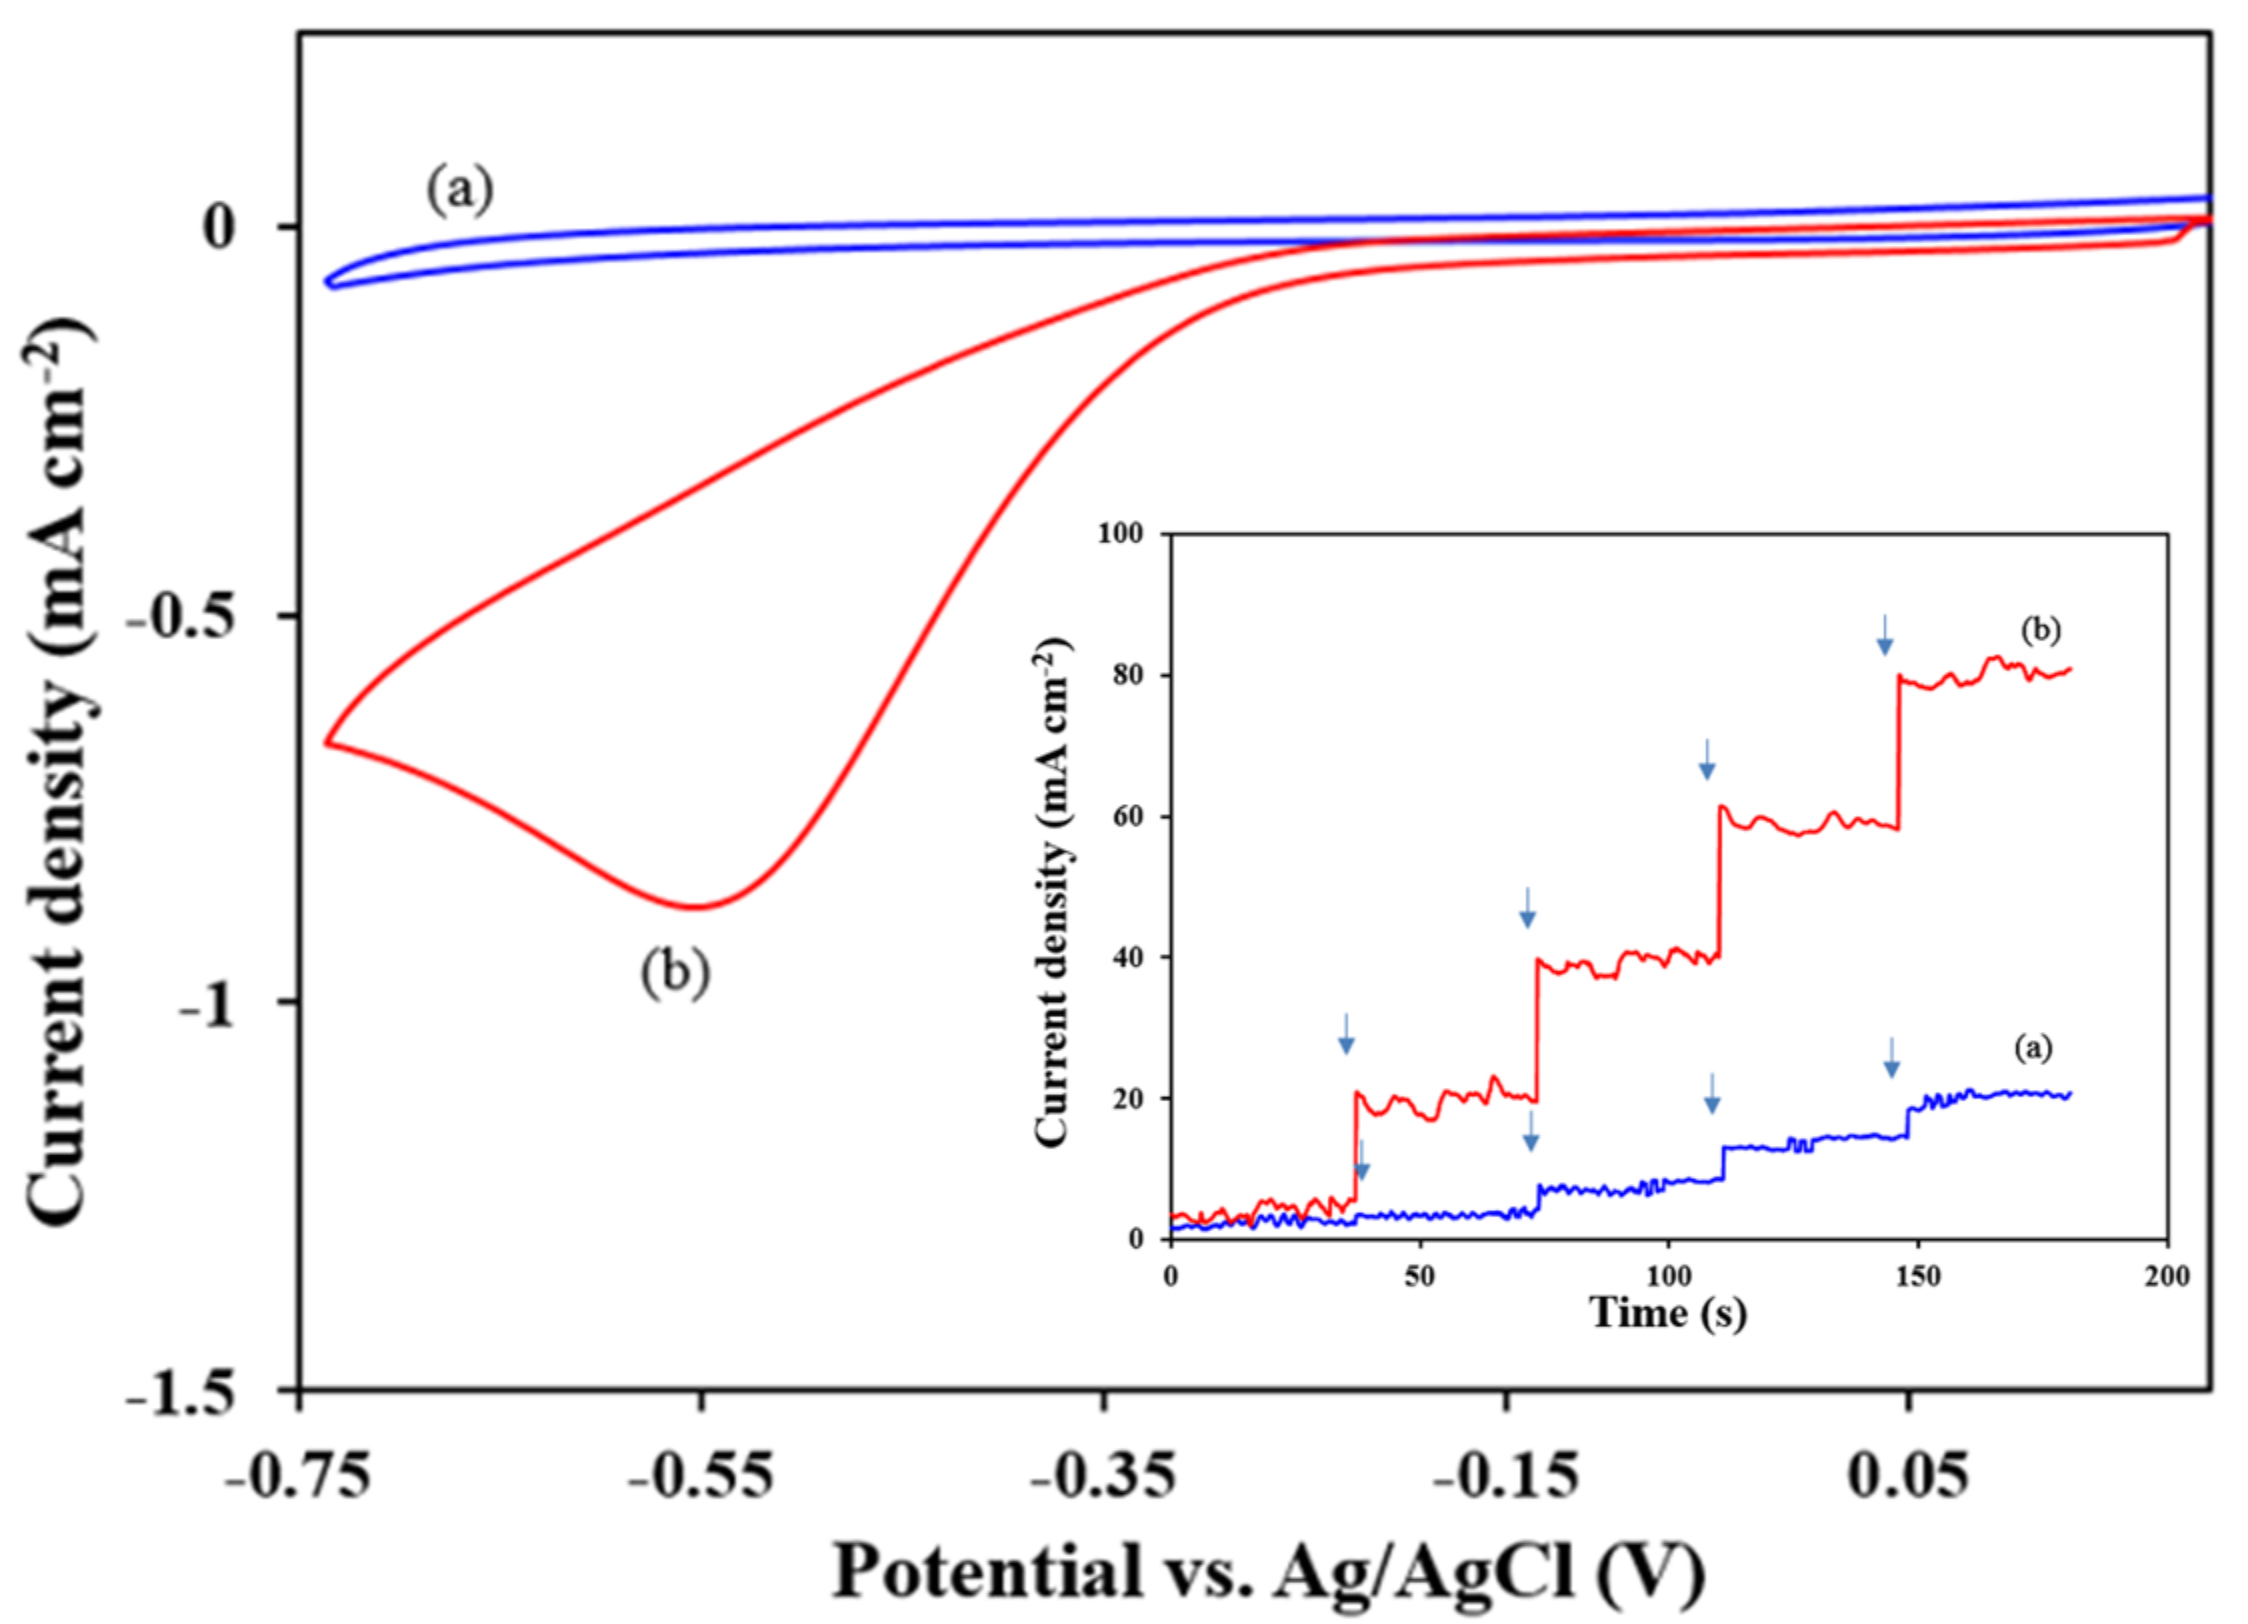
2.2.2. Electrochemical Investigations

The activity mechanism of WS2 QDs in H2O2 reactions was also studied via an electrochemical method. A modified glassy carbon electrode (GCE) was prepared, and its electrocatalytic activity in the electrochemical reduction of H2O2 was investigated via cyclic voltammetry and amperometry methods (Figure 4). In the presence of H2O2, the electrode indicated an obvious current. However, no evident current was observed in the absence of H2O2. The data demonstrated that electrons were transferred from electrode to H2O2 molecules due to the presence of WS2 QDs that facilitated electron transfer from the electrode to H2O2. As a result, the electron transfer to H2O2 could occur with a higher rate, which enhanced the reduction rate of H2O2.

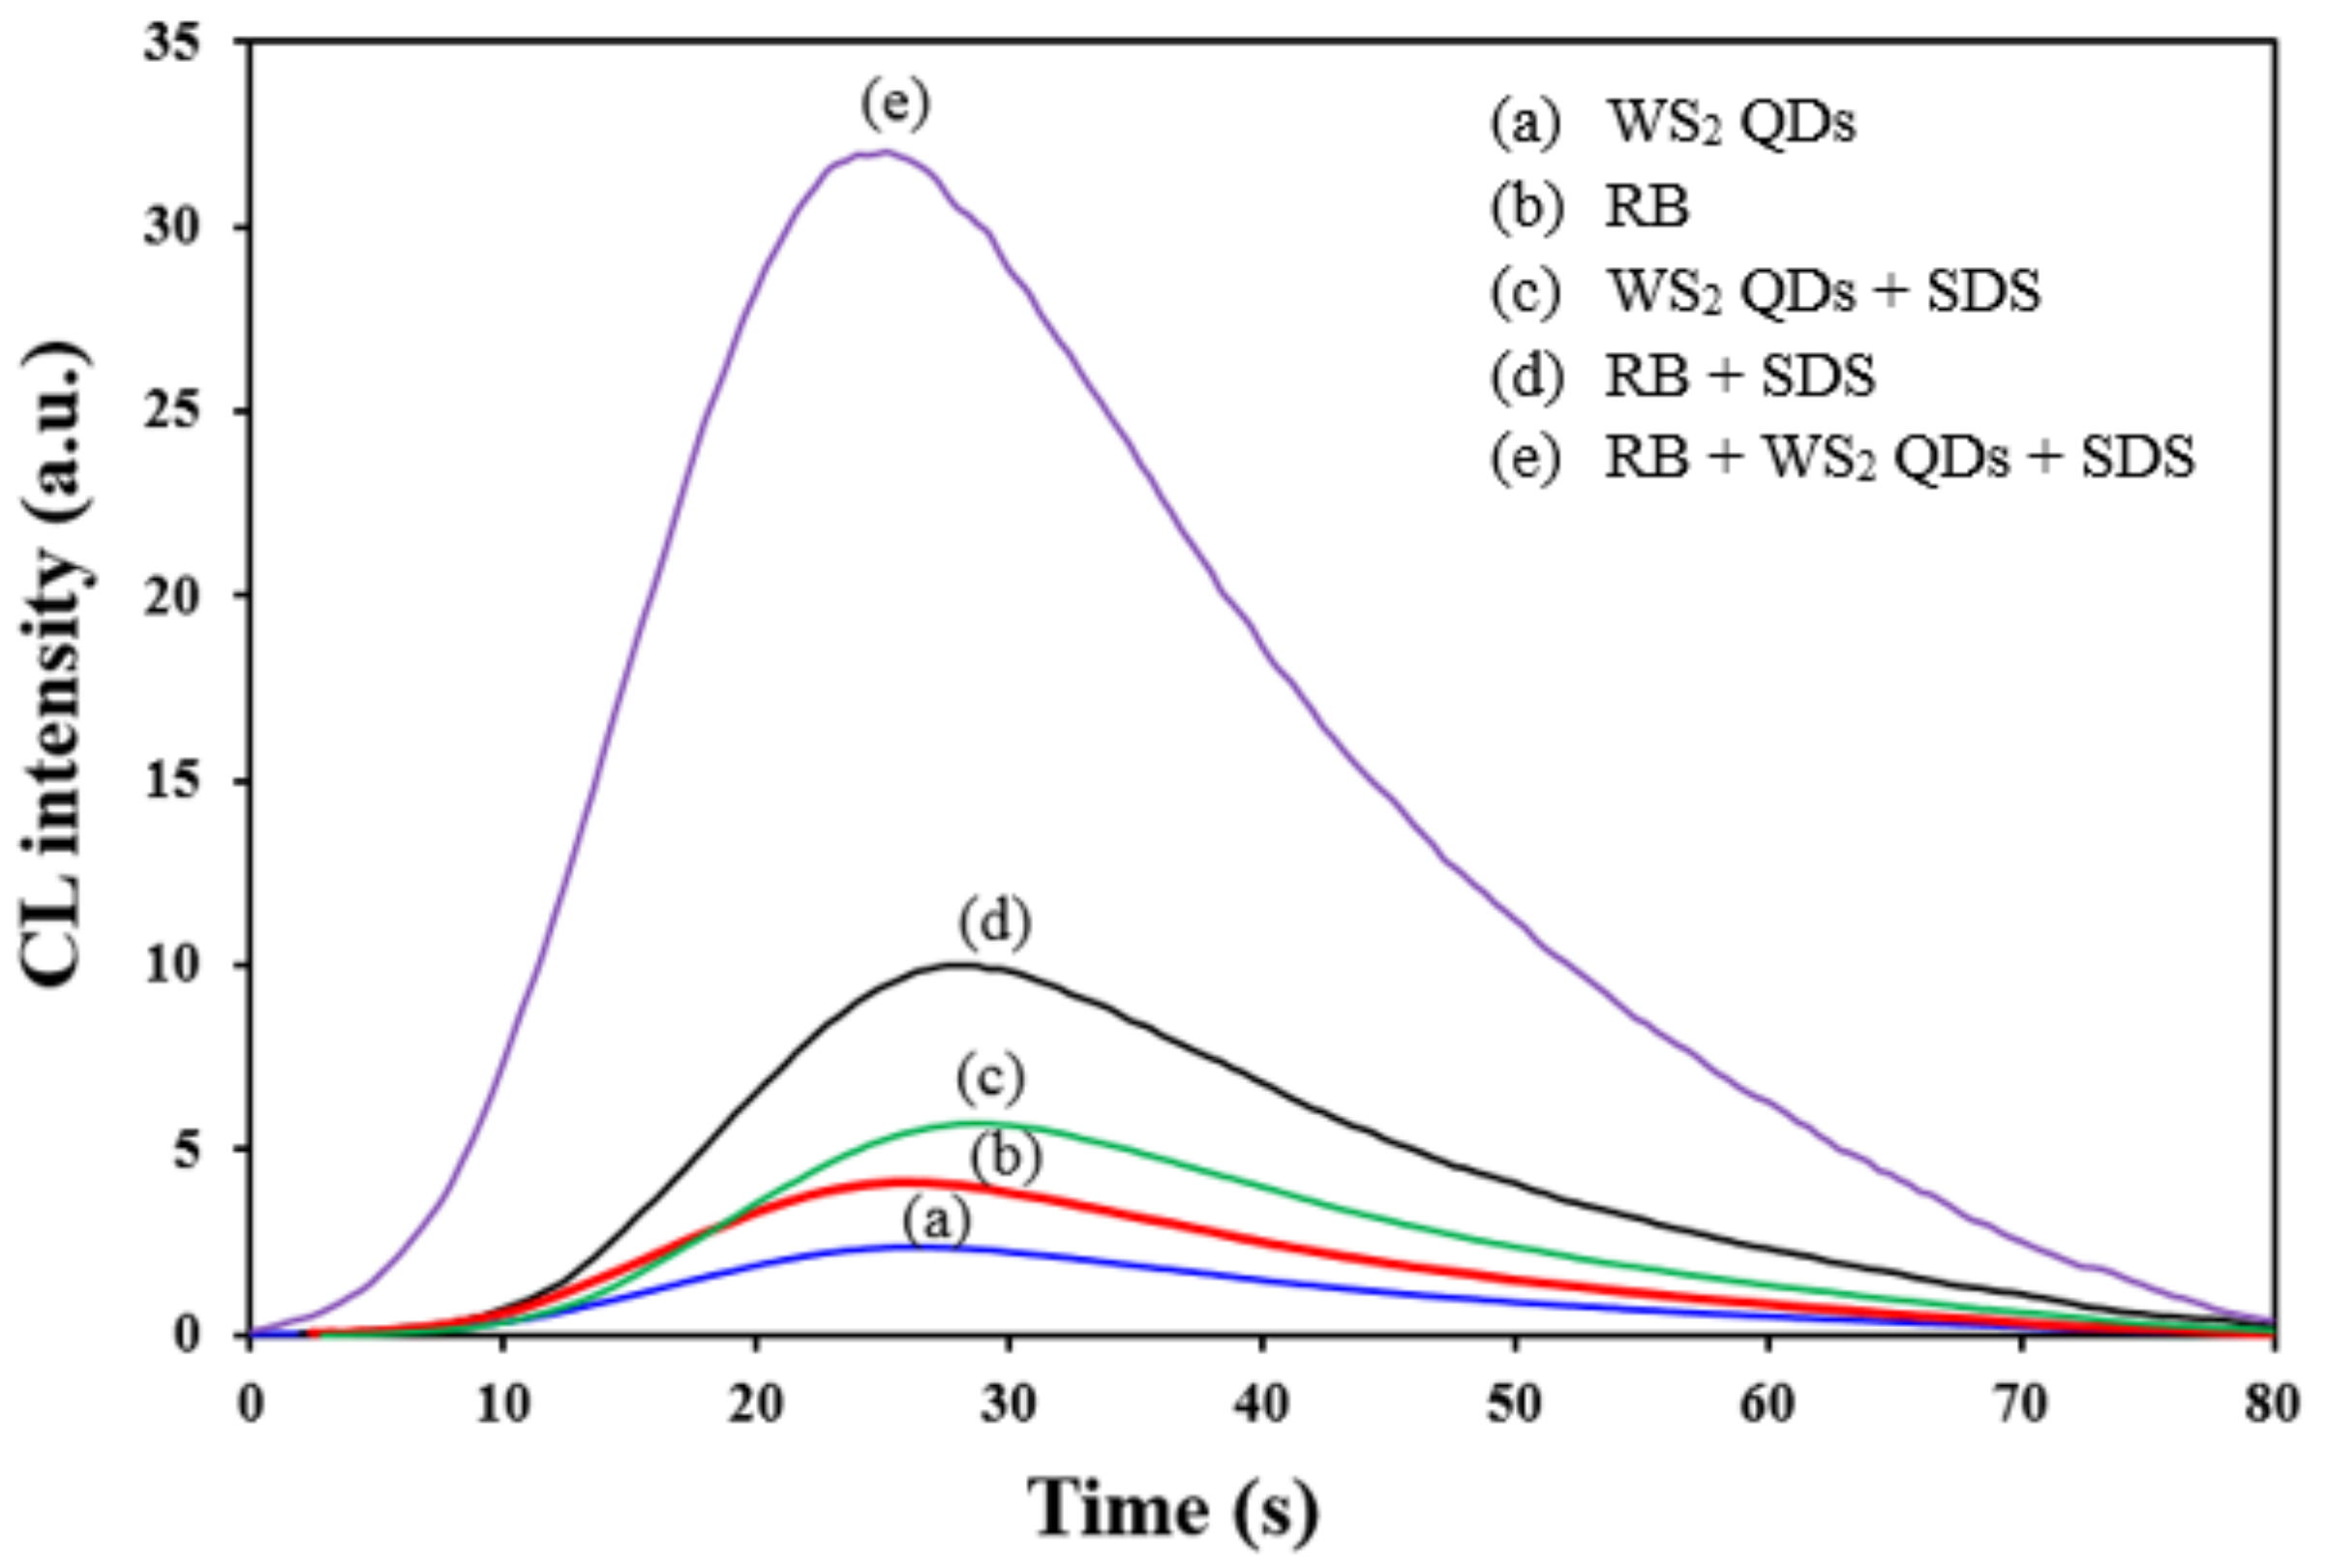
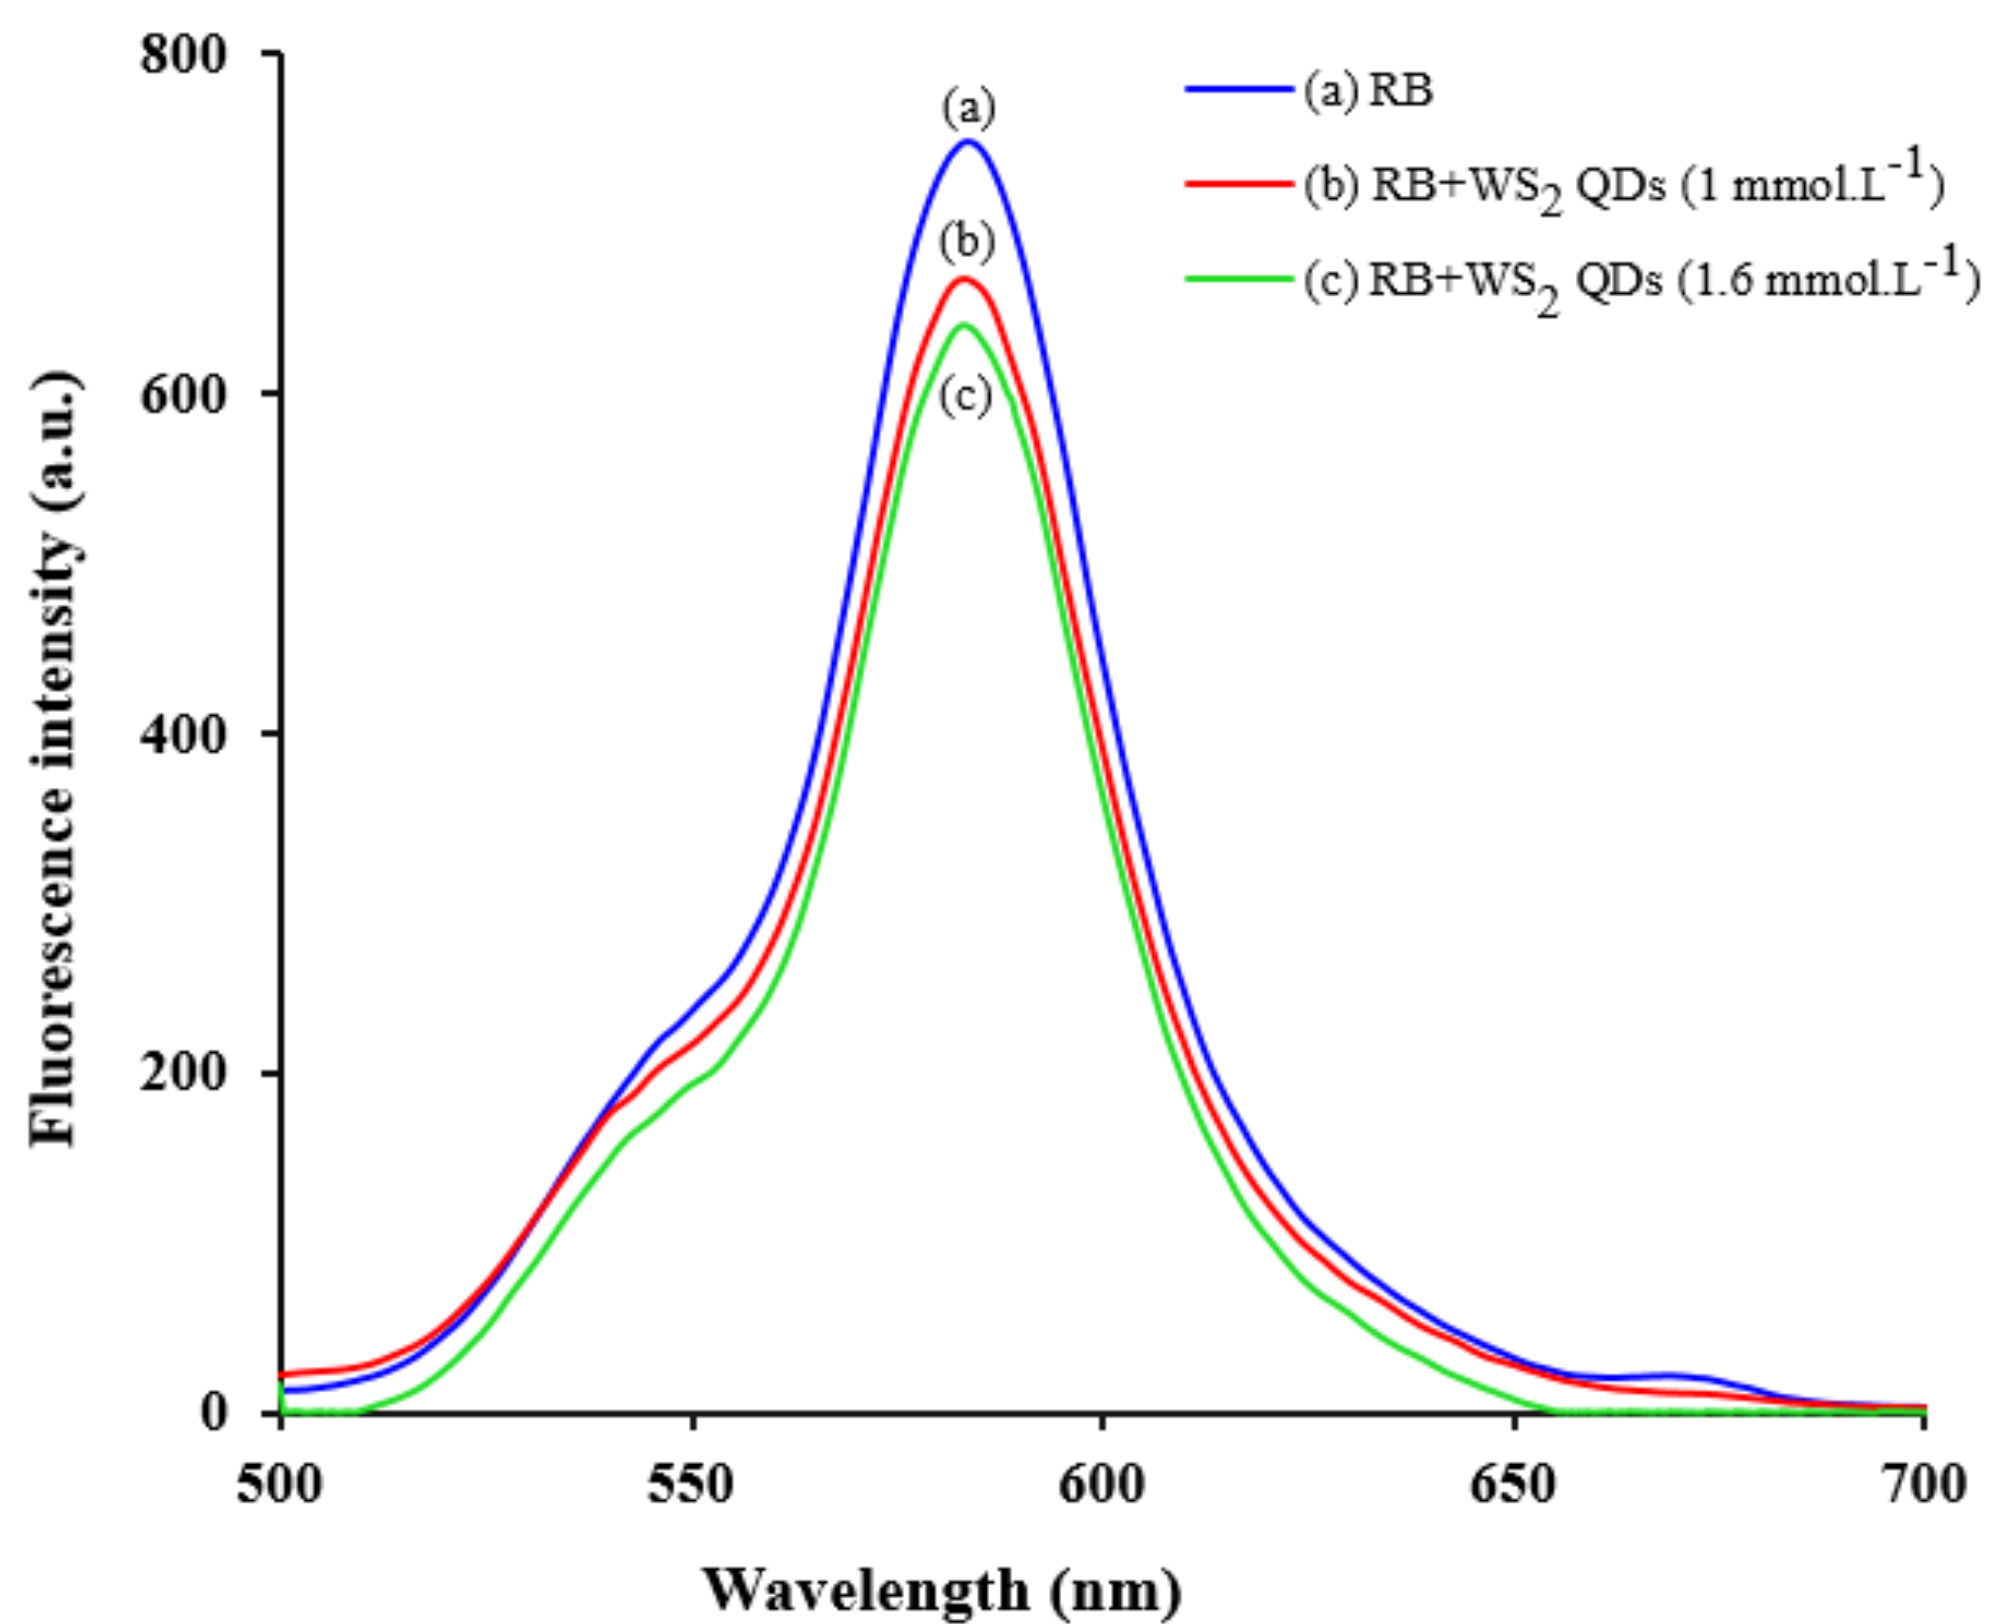
2.2.3. Chemiluminescence Investigations

As reported in previous literature, H2O2 could oxidize RB in an alkaline environment and produce weak CL emission [48]. In this study, it was observed that the presence of WS2 QDs along with SDS led to a significant increase in CL emission (Table S2, Supplementary Materials). SDS was indicated as facilitating behavior in a similar reaction. Time profiles of CL emission (Figure 5) confirmed the catalytic activity of QDs in the RB–H2O2 reaction. On the other hand, the reactants used for the synthesis of the nanomaterials did not show an obvious enhancement effect on the intensity of emission (Table S2, Supplementary Materials). Thus, the observed catalytic activity was attributed to the presence of WS2 QDs.

2.3. Catalytic Activity of WS2 QDs

The catalytic effect of used QDs is described below.
QDs catalyze H2O2 decomposition and lead to the production of more anionic radicals (OH and O2•−) and, therefore, improve RB oxidation. The catalytic capacity of WS2 QDs was discriminated by its incremental effect on CL intensity (Figure 5). The oxidation reaction of RB could generate oxidized RB molecules in an electronically excited state [RB]*ox and RB* which could emit at λ ≈ 425 nm [49,50] and λ ≈ 575 nm [51,52], respectively. As reported in previous research [51,52], [RB]*ox is the most oxidized form that is produced in alkaline environment. In addition, there is an efficient energy transfer between RB molecules and the [RB]*ox species via external plasmon process, which generates RB * as emitters [53]. On the other hand, the probable interaction between RB molecules and QDs was studied based on their fluorescence spectra (Figure 6). Because of this interaction, RB molecules could be adsorbed onto the surface of the QDs, causing the quenching of the fluorescence emission of RB.
In order to appraise the effect of anionic radicals, some experiments were carried out. Firstly, tert-butyl alcohol (as a common OH radical scavenger) was used to investigate the effect of OH radicals. In the presence of 0.2 mmol·L−1 tert-butyl alcohol, about 79% of the CL intensity was attenuated. The result signed that the OH radicals were highly reactive. Then, to evaluate the role of O2−• radicals, 0.6 mmol·L−1 benzoquinone (as an O2−• radical scavenger) was added to the system. By adding benzoquinone, just 25% of CL emission was quenched. As a result, O2−• radicals have a lower effect on the oxidation of RB than OH radicals.

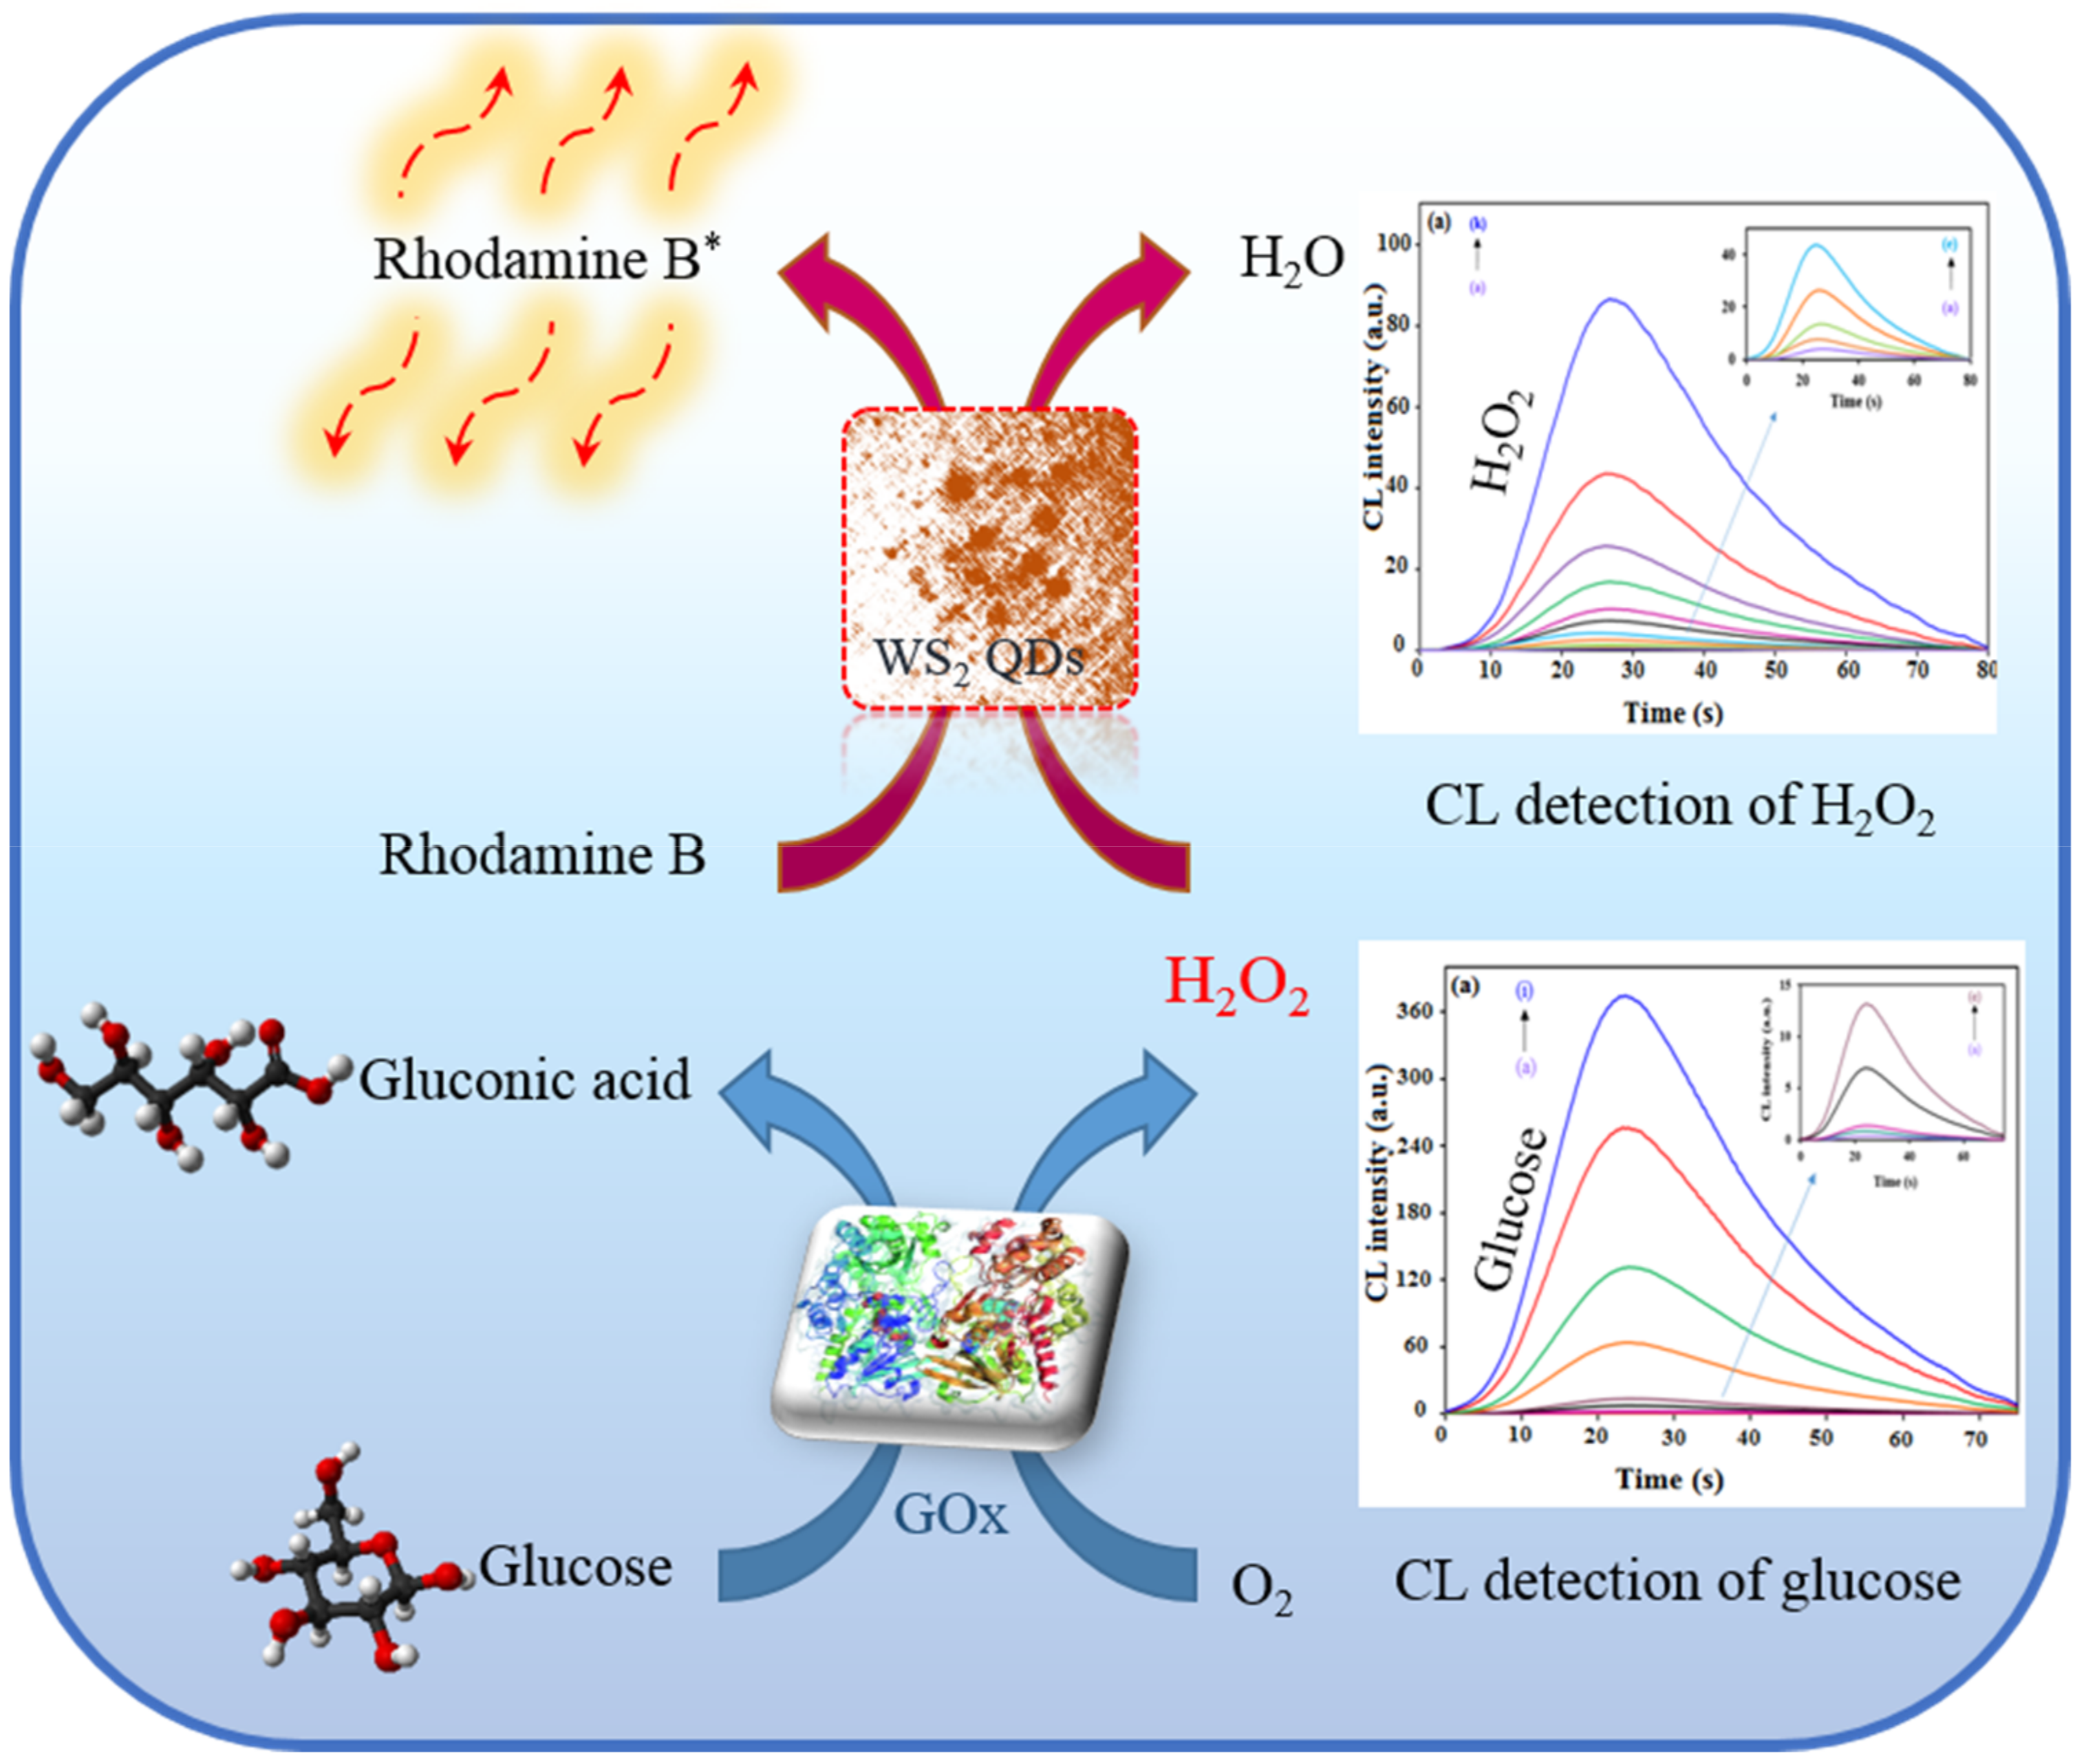
2.4. Determination of H2O2 and Glucose Using a CL System

In order to apply the synthesized peroxidase-like nanomaterials in an analytical scope, they were used for measuring glucose and H2O2. In comparison with other investigated techniques, the described stopped-flow CL method had high sensitivity. H2O2 and gluconic acid were the products of enzymatic oxidation of glucose by free O2 and glucose oxidase (GOx). The produced H2O2 was injected to the CL flow-cell on WS2 QDs and SDS-containing RB solution. The currents of the reagents were stopped by switching off the peristaltic pump instantly after observation of first CL emission. Maximum intensity of emitted CL against time was considered as the detection signal.
In order to attain the highest sensitivity, key factors in both the enzymatic process and CL detection step were optimized (Figure S3, Supplementary Materials). As can be seen from the results, the highest signal was obtained via 10 U·mL−1 GOx at 6.6 mmol·L−1 acetate buffer and 4.4 pH. Also, the optimal amounts in the CL detection process were 10−5 mol·L−1 RB, 10−4 mol·L−1 WS2 QDs, 4 × 10⁻³ mol·L−1 SDS, and 10−2 mol·L−1 NaOH. The higher values of WS2 QDs caused a decrease in the signal that was attributed to its tendency to react with emitter intermediates.

2.4.1. Analytical Figures of Merit

At optimized conditions, the CL emission intensity of the present system correlated with H2O2 concentration (Figure S4a, Supplementary Materials). A calibration graph of emitted CL intensity against concentration of H2O2 was obtained in the concentration range of 4–1000 nmol·L−1 at optimized conditions (Figure S4b, Supplementary Materials). The detection limit was calculated as 2.4 nmol·L−1 for H2O2 via 3Sb/m (m: slope of calibration graph, and Sb: standard deviation of signals for repetitive determination of five blank solutions) and the linear relationship corresponded to ICL = 866.15C + 34 (R2 = 0.9999). The previous methods based on nanomaterials for determination of H2O2 are provided in Table 1, showing the great features of the described method. Furthermore, the introduced CL system was examined for the determination of glucose. As investigated in Figure S5 (Supplementary Materials), the CL intensity was increased by rising glucose concentration, and a linear calibration graph was obtained using I against C (I and C indicate CL intensity and glucose concentration, respectively). The linear range of the abovementioned method for detection of glucose was 0.01–30 µmol·L−1 with a limit of detection (LOD) of 4.2 nmol·L−1, and the linear relationship was obtained as ICL = 1011C + 11465 (R2 = 0.9996). Good sensitivity with a lower detection limit of the mentioned CL method can be observed from the comparison of its analytical figures with other reported CL systems (Table S3, Supplementary Materials). On the other hand, because of the reliability and rapidity of this method, it is useful for the detection of glucose and other biomolecules.
On the other hand, the precision of the developed method was investigated by computing relative standard deviation (RSD) for the measurement of five similar standard solutions (with a constant concentration of glucose). The RSD values were obtained as 3.15% and 2.69% for 10 and 0.5 µmol·L−1 glucose solutions, respectively.
In order to study the stability of the prepared sensor, it was used in defined intervals. The results indicated that this sensor could be kept at 4 °C for at least a month, without significant alteration of the CL intensity (Figure S6, Supplementary Materials). Thus, application of this biosensor in public laboratories for medical applications can be useful.

2.4.2. Selectivity

A series of experiments were done to demonstrate the selectivity of the prepared probe for the measurement of constant concentration (1 µmol·L−1) of glucose solutions, in the presence of various concentrations of possible interfering compounds. An endurance limit of 5% was considered for the interfering effect of examined species. The data shown in Figure S7 (Supplementary Materials) indicate that most of studied compounds had no significant interfering effect. Moreover, a 1:500 dilution of real samples was helpful in further elimination of the interfering compound’s effects, such that the most of tested species did not show any considerable interfering effect, even at a higher concentration (5 mmol·L−1). Moreover, no important influence was seen in the presence of common cations or anions on the signal of the probe (Table S4, Supplementary Materials). The results confirm the application of the designed biosensor for measuring glucose in real blood samples.

2.4.3. Analysis of Real Samples

The reliability of the improved method was investigated for measuring glucose in human serum samples using a standard addition process (Table S5, Supplementary Materials). For this purpose, the prepared spiked samples were analyzed by adding certain amounts of standard glucose solution to real blood samples. The obtained efficiency demonstrated the reliability of the probe for glucose measuring.
Furthermore, for affirmation of the introduced probe, it was applied for the measurement of a standard reference material (SRM 965 b, frozen serum) (Table S6, Supplementary Materials). The results (4.092 ± 1.435 µmol·L−1) had good compatibility with a certified value (4.194 ± 0.059 µmol·L−1) for SRM which was allotted by the National Institute of Standards and Technology (NIST).

3. Materials and Methods

3.1. Instruments and Materials

GOx, WS2, HRP, benzoquinone, tert-butyl alcohol, and TMB were acquired from Sigma Co. (St. Louis, MO, USA, www.sigmaaldrich.com). Rhodamine B (RB), NaOH, H2O2, glucose, and SDS were obtained from Merck Co. (Darmstadt, Germany, www.merck.com). All chemicals were obtained in analytical grade and used without any treatment. All experimental solutions were prepared by double-deionized (DI) water. The morphological assessments of synthesized nanosheets were carried out with a JEOL HR-TEM (JEM-2200FS, acting at 200 kV, Tokyo, Japan, www.jeol.co.jp). XRD patterns were acquired using a Siemens D5000 X-ray diffractometer (Berlin, Germany, www.siemens.com) with a Cu Kα exciting source (λ = 1.54056 Å). Florescence analyses were performed using an LS-45 PerkinElmer spectrofluorometer (Waltham, MA, USA, www.perkinelmer.com). An S2000 spectrophotometer (WPA Lightwave, Cambridge, England, www.biochrom.co.uk) was used to obtain UV–visible absorption data. An IviumStat potentiostat/galvanostat (Eindhoven, The Netherlands, www.ivium.nl) was utilized for electrochemical investigations. CL experiments were done using a Berthold FB12 luminometer (Bad Wildbad, Germany, www.berthold.com).

3.2. Synthesis of WS2 QDs

For this purpose, 1 g of tungsten sulfide powder was weighed and added to 100 mL of dimethylformamide (DMF). The solution was sonicated for 3 h. The obtained solution was then stirred vigorously in a closed container for 6 h at 140 °C. The yellow solution above the sediment represented the WS2 QDs, and the sediment was a composite of nanosheets and QDs of tungsten sulfide. In order to eliminate the excessive solvent, the supernatant was evaporated under vacuum at a certain temperature and redispersed in water for further use.

3.3. Investigation of Peroxidase-Like Activity of WS2 QDs

Colorimetry, electrochemical, and CL techniques were utilized to investigate the peroxidase-like activity of prepared QDs. It should be noted that all of the studies for each method were accomplished in optimized conditions (including pH, buffer type, catalyst, and reagents concentration). Details can be found in the Supplementary Materials.

3.3.1. Colorimetric Experiments

Colorimetric experiments were based on the TMB–H2O2 reaction. Briefly, 1 mL of WS2 QDs (1 mmol·L−1) and SDS (4 × 10⁻³ mol·L−1) were added to a 2.5-mL reaction solution containing 2 mmol·L−1 TMB and 0.1 mol·L−1 acetate buffer (pH 4). Then, 1 mL H2O2 solution was added to the mixture and the final volume reached 5 mL with deionized water. After a time period of 10 min, the absorbance of the solution was recorded at 652 nm.

Process for the Investigation of Steady-State Kinetics

The experiments were performed based on the TMB–H2O2 reaction using constant conditions. Briefly, a series of solutions containing 0.05 mol·L−1 acetate buffer (pH 4) and a certain amount of catalyst (WS2 QDs (1 mmol.L−1)) were prepared. Then, 500 µL of TMB solution (5 mmol·L−1) and different amounts of H2O2 (varied from 1 to 200 µmol·L−1) were added. On the other hand, the second series of solutions containing 0.05 mol·L−1 acetate buffer (pH 4) and a certain amount of catalyst (WS2 QDs (1 mmol·L−1)) were prepared. Then, a 500-µL H2O2 solution (2 mmol·L−1) and different amounts of TMB (varied from 50 to 800 µmol·L−1) were added. The conditions were entirely fixed for all of solutions and their final volumes reached 5 mL using deionized water. Finally, the initial reaction velocities for all solutions were obtained by following their absorbance at 652 nm. In order to obtain Figure S2a,b, the velocities were plotted against the varied concentrations of TMB or H2O2. Also, the reciprocal velocities against the reciprocal concentrations resulted in Figure S2c,d.

3.3.2. Electrochemical Experiments

Electrochemical experiments were performed using modified glassy carbon electrodes (GCE). A dispersion of 3 mg of catalyst (WS2 QDs and SDS) in 450 μL of DMF and 50 μL of Nafion was mixed and sonicated for 25 min to create a homogeneous ink. On the other hand, GCE electrode was suitably polished and washed by its ultrasonication in ethanol. Then, a small volume of prepared ink (5 μL) was placed on the polished surface of GCE. After evaporation of liquids under infrared light, the electrode was applied to evaluate the H2O2 reduction using cyclic voltammetry (CV) and amperometry techniques.

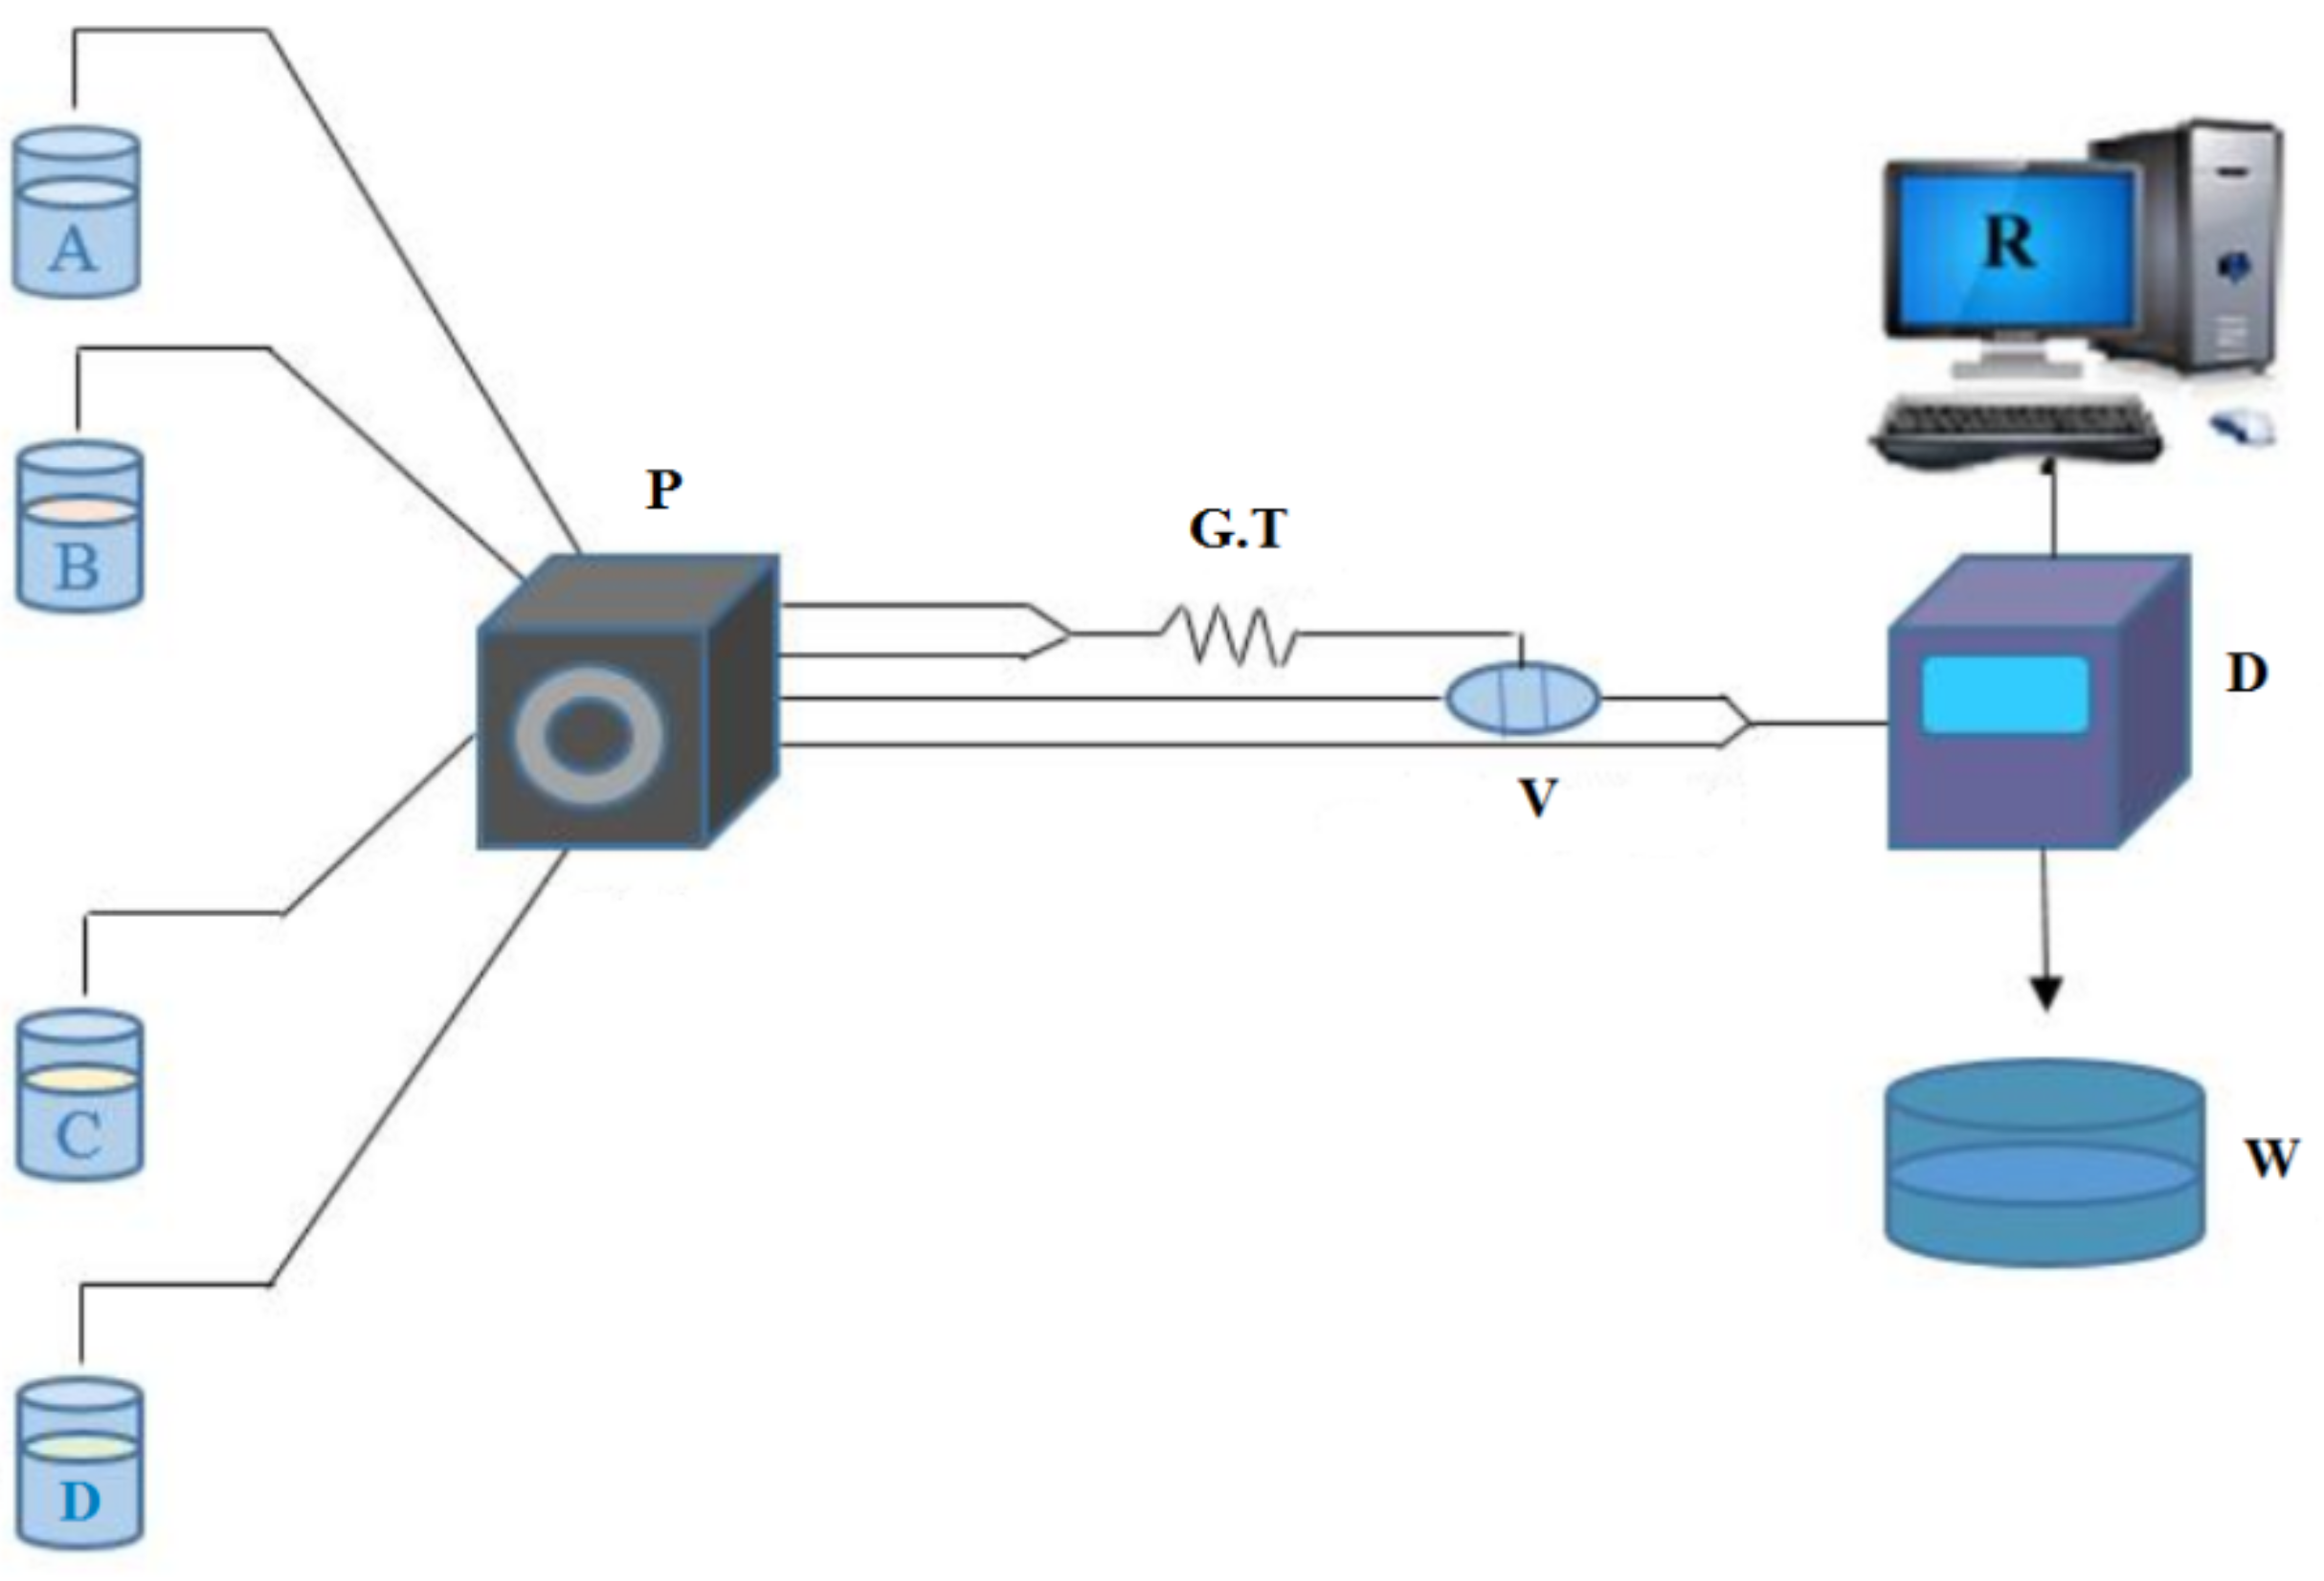
3.4. Measuring Glucose and H2O2 by CL

Glucose measurement: Fifty microliters of standard glucose solution (or prepared real samples) and 50 μL of GOx solution (10 U·mL−1) plus 0.2 mL of acetate buffer (5 mmol·L−1, pH 4.4) were added to a 3-mL Eppendorf tube. In order to complete the enzymatic oxidation of glucose by O2 and produce H2O2, the solution was stored at 37 °C for 5 min. The resulted solution was diluted with distilled water and then used to measure H2O2 via luminescence methods as described below.
H2O2 detection: The H2O2–RB reaction, catalyzed by WS2 QDs and SDS, involved a flow-mode CL system, used to measure H2O2 (Figure 7). The establishment of the CL system was convened by three polytetrafluoroethylene (PTFE) channels (inner diameter of 1.0 mm) to guide the reagents to the CL cell. A 0.01 mol·L−1 NaOH solution (in route A) and RB solution (10−5 mol·L−1), alone or with WS2 QDs (1 mmol·L−1), and SDS (4 × 10⁻³ mol·L−1) was traversed along the B path and mixed in a glassy Y-shaped junction and, eventually, kept in a loop with a volume of 150 μL. Distilled water, as a carrier, was transferred via route C through a six-port valve-containing loop and H2O2 solution (as an analyte or oxidizing agent) was guided through the D pathway into the CL cell in front of the detector. The carrier current directed the RB solution, which contained WS2 QDs and SDS, along with NaOH, in the emission region by changing the valve state to the injection mode. After observing the minimum primary CL emission, the reactant flow was immediately stopped by the pump and the amount of emission released over time was recorded. The CL emission resulted from the injection of H2O2 solution into the flow cell and the consequent combination of RB in the presence of a catalyst with H2O2.

3.5. Stability

The stability of the mixed-reagent CL solution (containing RB and peroxidase-like WS2 QD catalyst) was studied in certain time intervals. The solution was preserved in 4 °C for different times and then was applied for the determination of certain concentrations of glucose. The results confirmed that the mixed reagents can be maintained at 4 °C for at least one month, without any considerable change in CL response (Figure S6). Thus, the offered bioassay can be useful in public laboratories for medical applications.

3.6. Determination of Glucose in Human Blood

For measuring glucose in real samples, collected from healthy volunteers, the samples were centrifuged for 30 min (10,000 rpm). The serums were diluted with phosphate buffer (5 mmol·L−1, pH = 7). Finally, a suitable amount of diluted samples was used to measure glucose as mentioned above.

4. Conclusions

In summary, the mimetic activity of WS2 QDs was studied via CL, electrochemical, and colorimetry methods. It was found that WS2 QDs have catalytic activity on the reaction of H2O2 reduction. In comparison to HRP, the disadvantages of natural enzymes were rectified. Based on this probe, a sensitive and rapid assay was designed for the determination of H2O2 and biomolecules such as blood glucose, using an efficient H2O2–RB–WS2 QD–SDS flow-stopped CL detection system.

Supplementary Materials

The following are available online: Figure S1: XRD pattern of WS2 QDs; Figure S2: Steady-state kinetic assay and catalytic mechanism of HRP, WS2 QDs, and the corresponding double-reciprocal plots for catalytic activity of WS2 QDs and HRP; Figure S3: Effect of (a) RB concentration, (b) NaOH concentration, (c) SDS concentration, and (d) WS2 QDs concentration on the CL emission intensity of the RB–H2O2–NaOH–SDS–WS2 QD system; Figure S4: (a) CL time profiles of RB–H2O2–WS2 QD–SDS–NaOH system in the presence of different concentrations of H2O2 obtained with the stop-flow method, (b) corresponding calibration graph; Figure S5: (a) CL time profiles of the RB–H2O2–WS2 QD–SDS–NaOH system applied for the determination of different concentrations of glucose after its oxidation with GOx (10 U·mL−1) in acetate buffer (pH: 4.4, 5 mmol·L−1); (b) corresponding calibration graph; Figure S6: Catalytic activity of synthesized WS2 QDs within a specified time after synthesis; Figure S7: Interference of different species on the determination of 5 µmol·L−1 glucose; Table S1: Maximum reaction rate (Vm) and Michaelis–Menten constant (Km) for applied peroxidase-like catalysts compared with HRP; Table S2: Effects of WS2 QDs and SDS and their procurers on the CL emission of the H2O2–RB system; Table S3: A comparison of different analytical techniques for the determination of glucose; Table S4: Interference of different species on the determination of 5 µmol·L−1 glucose; Table S5: Glucose detection in human serum samples by designed CL system; Table S6: Glucose detection in standard sample by designed CL system.

Author Contributions

M.H.I. performed the experiments and wrote the paper; A.K. acted as a supervisor; J.H. gave scientific suggestions on this work and edited the paper; M.H. and J.H. analyzed the data; Y.O. edited the paper.

Acknowledgments

We thank the University of Tabriz for the provided support.

Conflicts of Interest

The authors declare no conflicts of interest.

References

  1. Salimi, A.; Hallaj, R.; Soltanian, S.; Mamkhezri, H. Nanomolar detection of hydrogen peroxide on glassy carbon electrode modified with electrodeposited cobalt oxide nanoparticles. Anal. Chim. Acta. 2007, 594, 24–31. [Google Scholar] [CrossRef] [PubMed]
  2. Zhang, L.-S.; Wong, G.T. Optimal conditions and sample storage for the determination of H2O2 in marine waters by the scopoletin–horseradish peroxidase fluorometric method. Talanta 1999, 48, 1031–1038. [Google Scholar] [CrossRef]
  3. Sang, Y.; Zhang, L.; Li, Y.F.; Chen, L.Q.; Xu, J.L.; Huang, C.Z. A visual detection of hydrogen peroxide on the basis of Fenton reaction with gold nanoparticles. Anal. Chim. Acta. 2010, 659, 224–228. [Google Scholar] [CrossRef] [PubMed]
  4. Shang, L.; Chen, H.; Deng, L.; Dong, S. Enhanced resonance light scattering based on biocatalytic growth of gold nanoparticles for biosensors design. Biosens. Bioelectron. 2008, 23, 1180–1184. [Google Scholar] [CrossRef] [PubMed]
  5. Huang, T.; Garceau, M.E.; Gao, P. Liquid chromatographic determination of residual hydrogen peroxide in pharmaceutical excipients using platinum and wired enzyme electrodes. J. Pharmaceut. Biomed. 2003, 31, 1203–1210. [Google Scholar] [CrossRef]
  6. Zhu, M.; Han, S.; Yuan, Z. β-Cyclodextrin polymer as the immobilization matrix for peroxidase and mediator in the fabrication of a sensor for hydrogen peroxide. J. Electroanal. Chem. 2000, 480, 255–261. [Google Scholar] [CrossRef]
  7. Xu, Y.; Pehrsson, P.E.; Chen, L.; Zhang, R.; Zhao, W. Double-stranded DNA single-walled carbon nanotube hybrids for optical hydrogen peroxide and glucose sensing. J. Phys. Chem. C. 2007, 111, 8638–8643. [Google Scholar] [CrossRef]
  8. Dodeigne, C.; Thunus, L.; Lejeune, R. Chemiluminescence as diagnostic tool. A review. Talanta 2000, 51, 415–439. [Google Scholar] [CrossRef]
  9. Khataee, A.; Lotfi, R.; Hasanzadeh, A.; Iranifam, M.; Joo, S.W. Flow-injection chemiluminescence analysis for sensitive determination of atenolol using cadmium sulfide quantum dots. Spectrochim. Acta. A. 2016, 157, 88–95. [Google Scholar] [CrossRef]
  10. Trojanowicz, M.; Kołacińska, K. Recent advances in flow injection analysis. Analyst 2016, 141, 2085–2139. [Google Scholar] [CrossRef]
  11. Su, Y.; Deng, D.; Zhang, L.; Song, H.; Lv, Y. Strategies in liquid-phase chemiluminescence and their applications in bioassay. TrAC-Trends Anal. Chem. 2016, 82, 394–411. [Google Scholar] [CrossRef]
  12. Pokropivny, V.; Ivanovskii, A.L. New nanoforms of carbon and boron nitride. Russ. Chem. Rev. 2008, 77, 837. [Google Scholar] [CrossRef]
  13. Kim, Y.T.; Han, J.H.; Hong, B.H.; Kwon, Y.U. Electrochemical synthesis of CdSe quantum-dot arrays on a graphene basal plane using mesoporous silica thin-film templates. Adv. Mater. 2010, 22, 515–518. [Google Scholar] [CrossRef] [PubMed]
  14. Zhang, G.; Wang, D. Colloidal lithography-the art of nanochemical patterning. Chem. Asian J. 2009, 4, 236–245. [Google Scholar] [CrossRef] [PubMed]
  15. Gautam, U.K.; Vivekchand, S.; Govindaraj, A.; Rao, C. GaS and GaSe nanowalls and their transformation to Ga2O3 and GaN nanowalls. Chem. Commun. 2005, 3995–3997. [Google Scholar] [CrossRef]
  16. Lee, J.Y.; Hong, B.H.; Kim, W.Y.; Min, S.K.; Kim, Y.; Jouravlev, M.V.; Bose, R.; Kim, K.S.; Hwang, I.-C.; Kaufman, L.J. Near-field focusing and magnification through self-assembled nanoscale spherical lenses. Nature 2009, 460, 498. [Google Scholar] [CrossRef]
  17. Stouwdam, J.W.; Janssen, R.A. Red, green, and blue quantum dot LEDs with solution processable ZnO nanocrystal electron injection layers. J. Mater. Chem. 2008, 18, 1889–1894. [Google Scholar] [CrossRef]
  18. Lee, W.; Kang, S.H.; Kim, J.-Y.; Kolekar, G.B.; Sung, Y.-E.; Han, S.-H. TiO2 nanotubes with a ZnO thin energy barrier for improved current efficiency of CdSe quantum-dot-sensitized solar cells. Nanotechnology 2009, 20, 335706. [Google Scholar] [CrossRef]
  19. Mokerov, V.; Fedorov, Y.V.; Velikovski, L.; Scherbakova, M.Y. New quantum dot transistor. Nanotechnology 2001, 12, 552. [Google Scholar] [CrossRef]
  20. Ustinov, V.; Zhukov, A.; Kovsh, A.; Mikhrin, S.; Maleev, N.; Volovik, B.; Musikhin, Y.G.; Shernyakov, Y.M.; Kondat’eva, E.Y.; Maximov, M. Long-wavelength quantum dot lasers on GaAs substrates. Nanotechnology 2000, 11, 397. [Google Scholar] [CrossRef]
  21. Bagher, A.M. Quantum dots applications. Sens. Transducers 2016, 198, 37. [Google Scholar]
  22. Kim, H.; Beack, S.; Han, S.; Shin, M.; Lee, T.; Park, Y.; Kim, K.S.; Yetisen, A.K.; Yun, S.H.; Kwon, W. Multifunctional photonic nanomaterials for diagnostic, therapeutic, and theranostic applications. Adv. Mater. 2018, 30, 1701460. [Google Scholar] [CrossRef]
  23. Kvaratskhelia, M.; Winkel, C.; Thorneley, R.N. Purification and characterization of a novel class III peroxidase isoenzyme from tea leaves. Plant. Physiol. 1997, 114, 1237–1245. [Google Scholar] [CrossRef]
  24. Wei, H.; Wang, E. Nanomaterials with enzyme-like characteristics (nanozymes): Next-generation artificial enzymes. Chem. Soc. Rev. 2013, 42, 6060–6093. [Google Scholar] [CrossRef]
  25. Wiester, M.J.; Ulmann, P.A.; Mirkin, C.A. Enzyme mimics based upon supramolecular coordination chemistry. Angew. Chem. Int. Edit. 2011, 50, 114–137. [Google Scholar] [CrossRef] [PubMed]
  26. Gao, L.; Wu, J.; Lyle, S.; Zehr, K.; Cao, L.; Gao, D. Magnetite nanoparticle-linked immunosorbent assay. J. Phys. Chem. C. 2008, 112, 17357–17361. [Google Scholar] [CrossRef]
  27. Lin, T.; Zhong, L.; Guo, L.; Fu, F.; Chen, G. Seeing diabetes: Visual detection of glucose based on the intrinsic peroxidase-like activity of MoS2 nanosheets. Nanoscale 2014, 6, 11856–11862. [Google Scholar] [CrossRef] [PubMed]
  28. Mu, J.; Wang, Y.; Zhao, M.; Zhang, L. Intrinsic peroxidase-like activity and catalase-like activity of Co3O4 nanoparticles. Chem. Commun. 2012, 48, 2540–2542. [Google Scholar] [CrossRef] [PubMed]
  29. André, R.; Natálio, F.; Humanes, M.; Leppin, J.; Heinze, K.; Wever, R.; Schröder, H.C.; Müller, W.E.; Tremel, W. V2O5 nanowires with an intrinsic peroxidase-like activity. Adv. Funct. Mater. 2011, 21, 501–509. [Google Scholar] [CrossRef]
  30. Song, Y.; Wang, X.; Zhao, C.; Qu, K.; Ren, J.; Qu, X. Label-free colorimetric detection of single nucleotide polymorphism by using single-walled carbon nanotube intrinsic peroxidase-like activity. Chem. Eur. J. 2010, 16, 3617–3621. [Google Scholar] [CrossRef] [PubMed]
  31. Song, Y.; Qu, K.; Zhao, C.; Ren, J.; Qu, X. Graphene oxide: Intrinsic peroxidase catalytic activity and its application to glucose detection. Adv. Mater. 2010, 22, 2206–2210. [Google Scholar] [CrossRef] [PubMed]
  32. Shi, W.; Wang, Q.; Long, Y.; Cheng, Z.; Chen, S.; Zheng, H.; Huang, Y. Carbon nanodots as peroxidase mimetics and their applications to glucose detection. Chem. Commun. 2011, 47, 6695–6697. [Google Scholar] [CrossRef]
  33. Tenne, R. Inorganic nanotubes and fullerene-like nanoparticles. J. Mater. Res. 2006, 21, 2726–2743. [Google Scholar] [CrossRef]
  34. Xu, G.; Zeng, S.; Zhang, B.; Swihart, M.T.; Yong, K.-T.; Prasad, P.N. New generation cadmium-free quantum dots for biophotonics and nanomedicine. Chem. Rev. 2016, 116, 12234–12327. [Google Scholar] [CrossRef] [PubMed]
  35. Tenne, R.; Margulis, L.; Genut, M.; Hodes, G. Polyhedral and cylindrical structures of tungsten disulphide. Nature 1992, 360, 444–446. [Google Scholar] [CrossRef]
  36. Khataee, A.; Eghbali, P.; Irani-nezhad, M.H.; Hassani, A. Sonochemical synthesis of WS2 nanosheets and its application in sonocatalytic removal of organic dyes from water solution. Ultrason. Sonochem. 2018, 48, 329–339. [Google Scholar] [CrossRef] [PubMed]
  37. Xu, S.; Li, D.; Wu, P. One-pot, facile, and versatile synthesis of monolayer MoS2/WS2 quantum dots as bioimaging probes and efficient electrocatalysts for hydrogen evolution reaction. Adv. Funct. Mater. 2015, 25, 1127–1136. [Google Scholar] [CrossRef]
  38. Zhang, X.; Lai, Z.; Liu, Z.; Tan, C.; Huang, Y.; Li, B.; Zhao, M.; Xie, L.; Huang, W.; Zhang, H. A facile and universal top-down method for preparation of monodisperse transition-metal dichalcogenide nanodots. Angew. Chem. Int. Edit. 2015, 54, 5425–5428. [Google Scholar] [CrossRef]
  39. Kim, M.-J.; Jeon, S.-J.; Kang, T.W.; Ju, J.-M.; Yim, D.; Kim, H.-I.; Park, J.H.; Kim, J.-H. 2H-WS2 quantum dots produced by modulating the dimension and phase of 1T-nanosheets for antibody-free optical sensing of neurotransmitters. ACS Appl. Mater. Interfaces 2017, 9, 12316–12323. [Google Scholar] [CrossRef]
  40. Das, S.; Kim, M.; Lee, J.-W.; Choi, W. Synthesis, properties, and applications of 2-D materials: A comprehensive review. Crit. Rev. Solid State 2014, 39, 231–252. [Google Scholar] [CrossRef]
  41. Štengl, V.; Henych, J.; Slušná, M.; Ecorchard, P. Ultrasound exfoliation of inorganic analogues of graphene. Nanoscale Res. Lett. 2014, 9, 167. [Google Scholar] [CrossRef] [PubMed]
  42. Gopalakrishnan, D.; Damien, D.; Shaijumon, M.M. MoS2 quantum dot-interspersed exfoliated MoS2 nanosheets. ACS Nano 2014, 8, 5297–5303. [Google Scholar] [CrossRef] [PubMed]
  43. Yang, Z.-C.; Wang, M.; Yong, A.M.; Wong, S.Y.; Zhang, X.-H.; Tan, H.; Chang, A.Y.; Li, X.; Wang, J. Intrinsically fluorescent carbon dots with tunable emission derived from hydrothermal treatment of glucose in the presence of monopotassium phosphate. Chem. Commun. 2011, 47, 11615–11617. [Google Scholar] [CrossRef] [PubMed]
  44. Yang, Y.; Cui, J.; Zheng, M.; Hu, C.; Tan, S.; Xiao, Y.; Yang, Q.; Liu, Y. One-step synthesis of amino-functionalized fluorescent carbon nanoparticles by hydrothermal carbonization of chitosan. Chem. Commun. 2012, 48, 380–382. [Google Scholar] [CrossRef]
  45. Ren, X.; Pang, L.; Zhang, Y.; Ren, X.; Fan, H.; Liu, S.F. One-step hydrothermal synthesis of monolayer MoS2 quantum dots for highly efficient electrocatalytic hydrogen evolution. J. Mater. Chem. A 2015, 3, 10693–10697. [Google Scholar] [CrossRef]
  46. Lin, L.; Xu, Y.; Zhang, S.; Ross, I.M.; Ong, A.C.; Allwood, D.A. Fabrication of luminescent monolayered tungsten dichalcogenides quantum dots with giant spin-valley coupling. ACS Nano 2013, 7, 8214–8223. [Google Scholar] [CrossRef]
  47. Yan, Y.; Zhang, C.; Gu, W.; Ding, C.; Li, X.; Xian, Y. Facile synthesis of water-soluble WS2 quantum dots for turn-on fluorescent measurement of lipoic acid. J. Phys. Chem. C 2016, 120, 12170–12177. [Google Scholar] [CrossRef]
  48. Han, S.; Liu, E.; Li, H. Flow injection chemiluminescence determination of hemin using the rhodamine B–H2O2–NaOH system. Microchim. Acta 2005, 149, 281–286. [Google Scholar] [CrossRef]
  49. Ma, Y.; Zhou, M.; Jin, X.; Zhang, B.; Chen, H.; Guo, N. Flow–injection chemiluminescence determination of ascorbic acid by use of the cerium (IV)–Rhodamine B system. Anal. Chim. Acta 2002, 464, 289–293. [Google Scholar] [CrossRef]
  50. Ma, Y.; Jin, X.; Zhou, M.; Zhang, Z.; Teng, X.; Chen, H. Chemiluminescence behavior based on oxidation reaction of rhodamine B with cerium (IV) in sulfuric acid medium. Anal. Chim. Acta 2003, 489, 173–181. [Google Scholar] [CrossRef]
  51. Hassanzadeh, J.; Khataee, A.; Oskoei, Y.M.; Fattahi, H.; Bagheri, N. Selective chemiluminescence method for the determination of trinitrotoluene based on molecularly imprinted polymer-capped ZnO quantum dots. New J. Chem. 2017, 41, 10659–10667. [Google Scholar] [CrossRef]
  52. Vahid, B.; Hassanzadeh, J.; Abolhasani, J.; Khodakarami, B. Inhibition of rhodamine B–ferricyanide chemiluminescence by Au nanoparticles toward the sensitive determination of mercury (II) ions. Microchim. Acta 2016, 126, 326–331. [Google Scholar] [CrossRef]
  53. Hassanzadeh, J.; Khataee, A. Ultrasensitive chemiluminescent biosensor for the detection of cholesterol based on synergetic peroxidase-like activity of MoS2 and graphene quantum dots. Talanta 2018, 178, 992–1000. [Google Scholar] [CrossRef] [PubMed]
  54. Chen, Q.; Chen, J.; Gao, C.; Zhang, M.; Chen, J.; Qiu, H. Hemin-functionalized WS2 nanosheets as highly active peroxidase mimetics for label-free colorimetric detection of H2O2 and glucose. Analyst 2015, 140, 2857–2863. [Google Scholar] [CrossRef]
  55. Topoglidis, E.; Astuti, Y.; Duriaux, F.; Grätzel, M.; Durrant, J.R. Direct electrochemistry and nitric oxide interaction of heme proteins adsorbed on nanocrystalline tin oxide electrodes. Langmuir 2003, 19, 6894–6900. [Google Scholar] [CrossRef]
  56. Khataee, A.; Irani-Nezhad, M.H.; Hassanzadeh, J. Improved peroxidase mimetic activity of a mixture of WS2 nanosheets and silver nanoclusters for chemiluminescent quantification of H2O2 and glucose. Microchim. Acta 2018, 185, 190. [Google Scholar] [CrossRef] [PubMed]
  57. Khataee, A.; Irani-nezhad, M.H.; Hassanzadeh, J.; Joo, S.W. Superior peroxidase mimetic activity of tungsten disulfide nanosheets/silver nanoclusters composite: Colorimetric, fluorometric and electrochemical studies. J. Colloid Interface Sci. 2018, 515, 39–49. [Google Scholar] [CrossRef]
  58. Liu, Q.; Yang, Y.; Li, H.; Zhu, R.; Shao, Q.; Yang, S.; Xu, J. NiO nanoparticles modified with 5, 10, 15, 20-tetrakis (4-carboxyl pheyl)-porphyrin: Promising peroxidase mimetics for H2O2 and glucose detection. Biosens. Bioelectron. 2015, 64, 147–153. [Google Scholar] [CrossRef] [PubMed]
Sample Availability: Samples of the compounds are available from the authors
Scheme 1. Schematic design for the chemiluminescence (CL) determination of glucose based on the peroxidase-like activity of WS2 quantum dots (QDs).
Molecules 24 00689 sch001
Figure 1. (a) TEM; (b,c) high-resolution TEM (HRTEM); and (d) selected area electron diffraction pattern (SAED) images for WS2 quantum dots (QDs).
Molecules 24 00689 g001
Figure 2. (a) Ultraviolet–visible (UV–Vis) absorption spectra of WS2 QDs; (b) photoluminescence (PL) spectra of WS2 QDs for different excitation wavelengths.
Molecules 24 00689 g002
Figure 3. UV–Vis spectra of 3,3′,5,5′-tetramethylbenzidine (TMB; 4 × 10⁻¹ mmol·L−1)–H2O2 solution in the (a) absence and (b) presence of HRP; and (c) WS2 QDs (1 mmol·L−1).
Molecules 24 00689 g003
Figure 4. Cyclic voltammograms of (a) bare and (b) modified glassy carbon electrode (GCE) with WS2 QDs for 1 mmol·L−1 H2O2; the inset shows the amperometric response of (a) bare GCE and (b) modified GCE with WS2 QDs for successive additions of 10 µmol·L−1 H2O2.
Molecules 24 00689 g004
Figure 5. Kinetic profiles of the H2O2–RB chemiluminescence (CL) system in the following conditions: (a) WS2 QDs (1 mmol·L−1); (b) rhodamine B (RB; 10−5 mol·L−1); (c) WS2 QDs (1 mmol·L−1) + SDS (4 × 10⁻³ mol·L−1); (d) RB (10−5 mol·L−1) + SDS (4 × 10⁻³ mol·L−1); and (e) RB (10−5 mol·L−1) + WS2 QDs (1 mmol·L−1) + SDS (4 × 10⁻³ mol·L−1).
Molecules 24 00689 g005
Figure 6. Fluorescence spectra for RB solution (10−5 mol·L−1) in the absence (a) and presence of 1 mmol·L−1 (b) or 1.6 mmol·L−1 (c) WS2 QDs.
Molecules 24 00689 g006
Figure 7. Chemiluminescence flow system applied in this investigation; A: NaOH solution; B: RB solution with or without catalyst; C: carrier; D: H2O2 solution; P: peristaltic pump; G.T: glassy triple; V: six-port valve; D: luminometer detector; W: waste; R: personal computer (PC) for processing the obtained data.
Molecules 24 00689 g007
Table 1. An overview on some methods based on nanomaterials for the determination of H2O2. L—chemiluminescence; LOD—limit of detection.
Materials UsedMethod AppliedLOD (nmol·L−1)Linear Range (µmol·L−1)StabilityReference
Hemin-functionalized WS2 nanostructures (NS)Colorimetric 15005–200-[54]
Mb nanoporous ZnO filmsElectrochemical 200010–18002 weeks[55]
WS2 NS and AgNC mixtureStopped-flow CL0.60.0025–1.51 month[56]
WS2 NS/AgNC nanocompositeFluorescence210.05–4001 month[57]
NiO nanoparticle (NP) modified with 5,10,15,20-tetrakis(4-carboxyl phenyl)-porphyrinColorimetric 800020–1002 h[58]
WS2 quantum dots (QDs)Stopped-flow CL2.40.004–11 monthThis work

