A New Method for Recognizing Cytokines Based on Feature Combination and a Support Vector Machine Classifier


School of Computer Science, Inner Mongolia University, Hohhot, Inner Mongolia 010021, China
*
Author to whom correspondence should be addressed.
Molecules 2018, 23(8), 2008; https://doi.org/10.3390/molecules23082008
Submission received: 19 June 2018
/
Revised: 31 July 2018
/
Accepted: 7 August 2018
/
Published: 11 August 2018
(This article belongs to the Special Issue Computational Analysis for Protein Structure and Interaction)
Abstract
:Research on cytokine recognition is of great significance in the medical field due to the fact cytokines benefit the diagnosis and treatment of diseases, but the current methods for cytokine recognition have many shortcomings, such as low sensitivity and low F-score. Therefore, this paper proposes a new method on the basis of feature combination. The features are extracted from compositions of amino acids, physicochemical properties, secondary structures, and evolutionary information. The classifier used in this paper is SVM. Experiments show that our method is better than other methods in terms of accuracy, sensitivity, specificity, F-score and Matthew’s correlation coefficient.
1. Introduction
Cytokines are mainly proteins or peptides generally associated with inflammation and cell differentiation, including interleukins (IL), interferons (IFNs), etc. They can contribute to the diagnosis and treatment of diseases [1,2], for example, they are conducive to the treatment of hematopoietic dysfunction [3], tumor [4], infection [5,6] and inflammation [7,8]. With the post-genomic era coming, the quantity of new proteins has increased dramatically. Some complex experiments based on biology and immunology are required to identify cytokines from these new proteins, which means high time consumption and expensive cost, but the primary structures of these proteins are easier to obtain. In this case, we propose a method which can recognize cytokines quickly and accurately. It is helpful for medical scientists, for instance, the method can reduce the experimental range and workload. They can selectively test the functions for the proteins which are identified as cytokines by this method. In other words, there is no need to test the functions which cannot be related to cytokines. Generally speaking, the method we proposed has two important steps, i.e., the extraction of features and the classifier selection.
There are many algorithms for extracting features from protein sequences. The following will introduce several algorithms for feature extraction. Nakashima et al. [9] first proposed an algorithm which can obtain 20-dimensional features from a protein sequence based on amino acid composition (AAC for short). After that, Luo et al. [10] further extended it to 400 dimensions in terms of the composition information of polypeptide. Based on the physicochemical properties of proteins, Shen et al. proposed the PseAAC algorithm [11]. Besides, several algorithms have been proposed in terms of position-specific score matrices (PSSM) which can be computed by PSI-BLAST software [12]. Additionally, several features [13,14] can be obtained based on structure probability matrices (SPM) and secondary structure sequences (SSS), which can be extracted by PSI-PRED software [15]. The method based on local discriminant bases is used in the latest classification of protein [16] and an algorithm combining PSSM and PseAAC is currently proposed for protein prediction [17].
There are many classifiers for recognizing protein function, such as Rough Set [18], Naive Bayes [19] and SVM [20], of which SVM is very effective. As a supervised learning model, SVM has been widely used in many domains due to its simplicity and efficiency, such as protein subcellular prediction [21], HIV-1 and HIV-2 proteins prediction [22], gene selection [23], protein subcellular localization [24], pre-microRNA prediction [25] and membrane protein function prediction. But the used Data have a serious effect on the efficiency of SVM.
So far, a considerable amount of literature has been published on the prediction of cytokines. Huang et al. used SVM and 7-fold cross-validation to predict and classify the cytokine superfamily [26]. Zeng et al. improved the ability of cytokine prediction by n-gram algorithm and genetic algorithm [27]. Jiang et al. enhanced the performance of cytokine identification by using proper features and classifiers [28]. The advantages of these methods are high accuracy and specificity. However these methods also have some shortcomings, such as low sensitivity and low F-score. For example, the best accuracy in the experiments of Jiang et al. is 93% but the corresponding sensitivity only is 51%.
In this paper, we aimed to improve the performance of cytokines recognition and the efficiency of the SVM classifier when the number of positive and negative sequences is not balanced. Compared with the feature extraction methods in the papers of Huang et al. and Zeng et al., we comprehensively considered four aspects of protein sequences for building a stable model. Meanwhile, compared with the current method, we improved a new method of feature extraction and adopt it in our model. A lot of experiments were done by us to find the optimal feature combination and the hyper-parameter of SVM. Besides, we gave the suggestion for further improvement. We initially obtained 450 features on the basis of composition information and physicochemical properties. Then we extracted structure probability matrices, position-specific score matrices, second structure sequences and selected 418 features from them as a vector. Finally, we selected 448 features from 868 features (450 plus 418) as optimal features and SVM was used as our classifier. The experiments show that our method is superior to other researches by using 10-fold cross-validation methods and an independent test set.
2. Classifier and Verification Methods
SVM is a suitable classifier for protein prediction and classification, such as the prediction of protein secondary structure [29], the prediction of protein interaction [30], protein structure classification [31] and the prediction of protein families [32]. SVM is more applicable to a binary classification problem, which is consistent with our problem. Therefore, we chose SVM to classify protein sequences. It can construct a linear separating hyperplane in high-dimensional feature space to distinguish positive sequences and negative sequences. However, it will be of high computational complexity to compute a hyperplane in high-dimensional space, but SVM can reduce the cost of computation by means of kernel functions. We used the linear kernel function and Gaussian kernel function in our experiments and the LIBSVM [33] software.
10-Fold cross-validation was used to evaluate the generalization ability of our method. In the process of the 10-fold cross-validation, all sequences are randomly divided into ten groups. One of them is used as the test set, and the rest is used as the training set. It should be ensured that each one of ten groups has been tested separately, therefore the evaluated method will be tested ten times in one experiment and there will be ten results. The average of ten results is taken as the final evaluation result. Besides, we also prepared an unbiased independent test set which is randomly selected from the total sample and accounts for the 20% of it. In the test set, the ratio of the positives to the negatives is 1:9, which is the same as that in training set. It can be ensured that the similarity of each sequence between training set and test set is less than 0.6 by the CD-HIT software. We have uploaded the independent test set to GitHub (https://github.com/DeveloperMrYang/FCSVM).
3. Measurements
Acc, Sens, Spec, F-score and Mcc were used to measure the performance of our method, and they can be calculated by the following formulas. Here TP is the number of true positives, i.e., the number of the positives which are predicted as positives. FP is the number of false positives, i.e., the number of the negatives which are predicted as positives. TN is the number of true negatives, i.e., the number of the negatives which are predicted as negatives. FN is the number of false negatives, i.e., the number of the positives which are predicted as negatives. Acc measures the accuracy of the method, which is the ratio of correctly predicted data in all tested data. Sens measures the sensitivity of the method, which is the ratio of correctly predicted positives in all tested positives. Spec measures the specificity of the method, which is the ratio of correctly predicted negatives in all tested negatives. Pre is the ratio of correctly predicted positives in all predicted positives. F-socre measures the quality of the method by considering Sens and Pre. Mcc is Matthew’s correlation coefficient [34]. It should be noted that Mcc is −1 when both TP and FP are 0 and the model has the poorest predictive ability:
4. Feature Combinations and Results
4.1. Performance of Feature Methods
We separately tested the performance of four feature extraction methods mentioned above. The classifier used by us was SVM and we used the linear kernel function and the Gaussian kernel function.
Table 1 shows the results of each feature extraction method with different kernel functions. In the experiments, both TP and FP are 0 when using the n-gram feature method and Gaussian kernel function, therefore the prediction is invalid, which is not listed in Table 1. The results show that the FPseAAC with Gaussian kernel function performs best in Acc, F-score, and Mcc. Besides, in the recognition of negative sequences, the Fpssm-380 with Gaussian kernel function is the best because the Spec value reaches 93.250%. Correspondingly, in the identification of positive sequences, the Fn-gram with linear kernel function performs best and the Sens is 85.576%.
4.2. Feature Combinations
We combined the Fpssm-20 with Fpssm-380 to obtain a total of a 400-D feature vector (Fpssm for short), and combined Fsss with FPseAAC to obtain a 48-D feature vector (Fsp for short). Fpssm was combined with Fsp to obtain a 448-D feature vector (Fpsp for short), and finally Fn-gram was combined with Fpsp to get a 868-D feature vector (Fpspn for short). Table 2 shows the results of feature combination methods with different kernel functions.
From Table 2, we found that the Fpspn with 868 dimensions and linear kernel function performs better in almost all aspects than other vectors. Nevertheless, it should be noted that the dimensions of Fpspn are 420 more than the dimensions of Fpsp, but the predictive ability of Fpsp with liner kernel function only decreases by 0.2% or so. Thus, considering time cost and the quality of feature combinations comprehensively, we selected Fpsp with 448 dimensions as our final feature vector.
A grid search algorithm and 3-flod cross-validation were used to choose the best parameters (C and γ) for Fpsp with Gaussian kernel. C and γ range from 2−5 to 25 with a step size of 21. The accuracy of different C and γ is shown in Table 3. When C is 22 and γ is 2−5, we get the optimal accuracy.
After parameters optimization, the new result shows that Fpsp with Gaussian kernel is better than it with linear kernel and we conducted 10 times 10-fold cross-validation on it. The mean ± standard deviation for each measurement is shown in Table 4. In the final result, the accuracy is 90.84%, the sensitivity is 89.23%, the specificity is 92.42%, the F-score is 90.63% and the Mcc is 81.71%.
4.3. Comparison with Other Methods
Jiang et al. [28] downloaded cytokines sequences from the Uniprot database website and used CD-HIT software to process data. Our methods of data acquisition and processing are the same, but the number and proportion of positive and negative sequences we used are different, which will have an effect on the comparison results. In order to eliminate the factor, we randomly divided the 9146 positive sequences into nine groups, then combined positive sequences in each group and all negative sequences into a new dataset. In the new dataset, the number and proportion of positive and negative sequences are consistent with those of Jiang et al., and we did new experiments on the nine datasets to find the optimal feature combination. It follows that Fpsp with liner function is better than other feature combinations in almost all metrics except Spec from Table 5. From all results, we finally took Fpsp with 448 dimensions as our optimal feature vector.
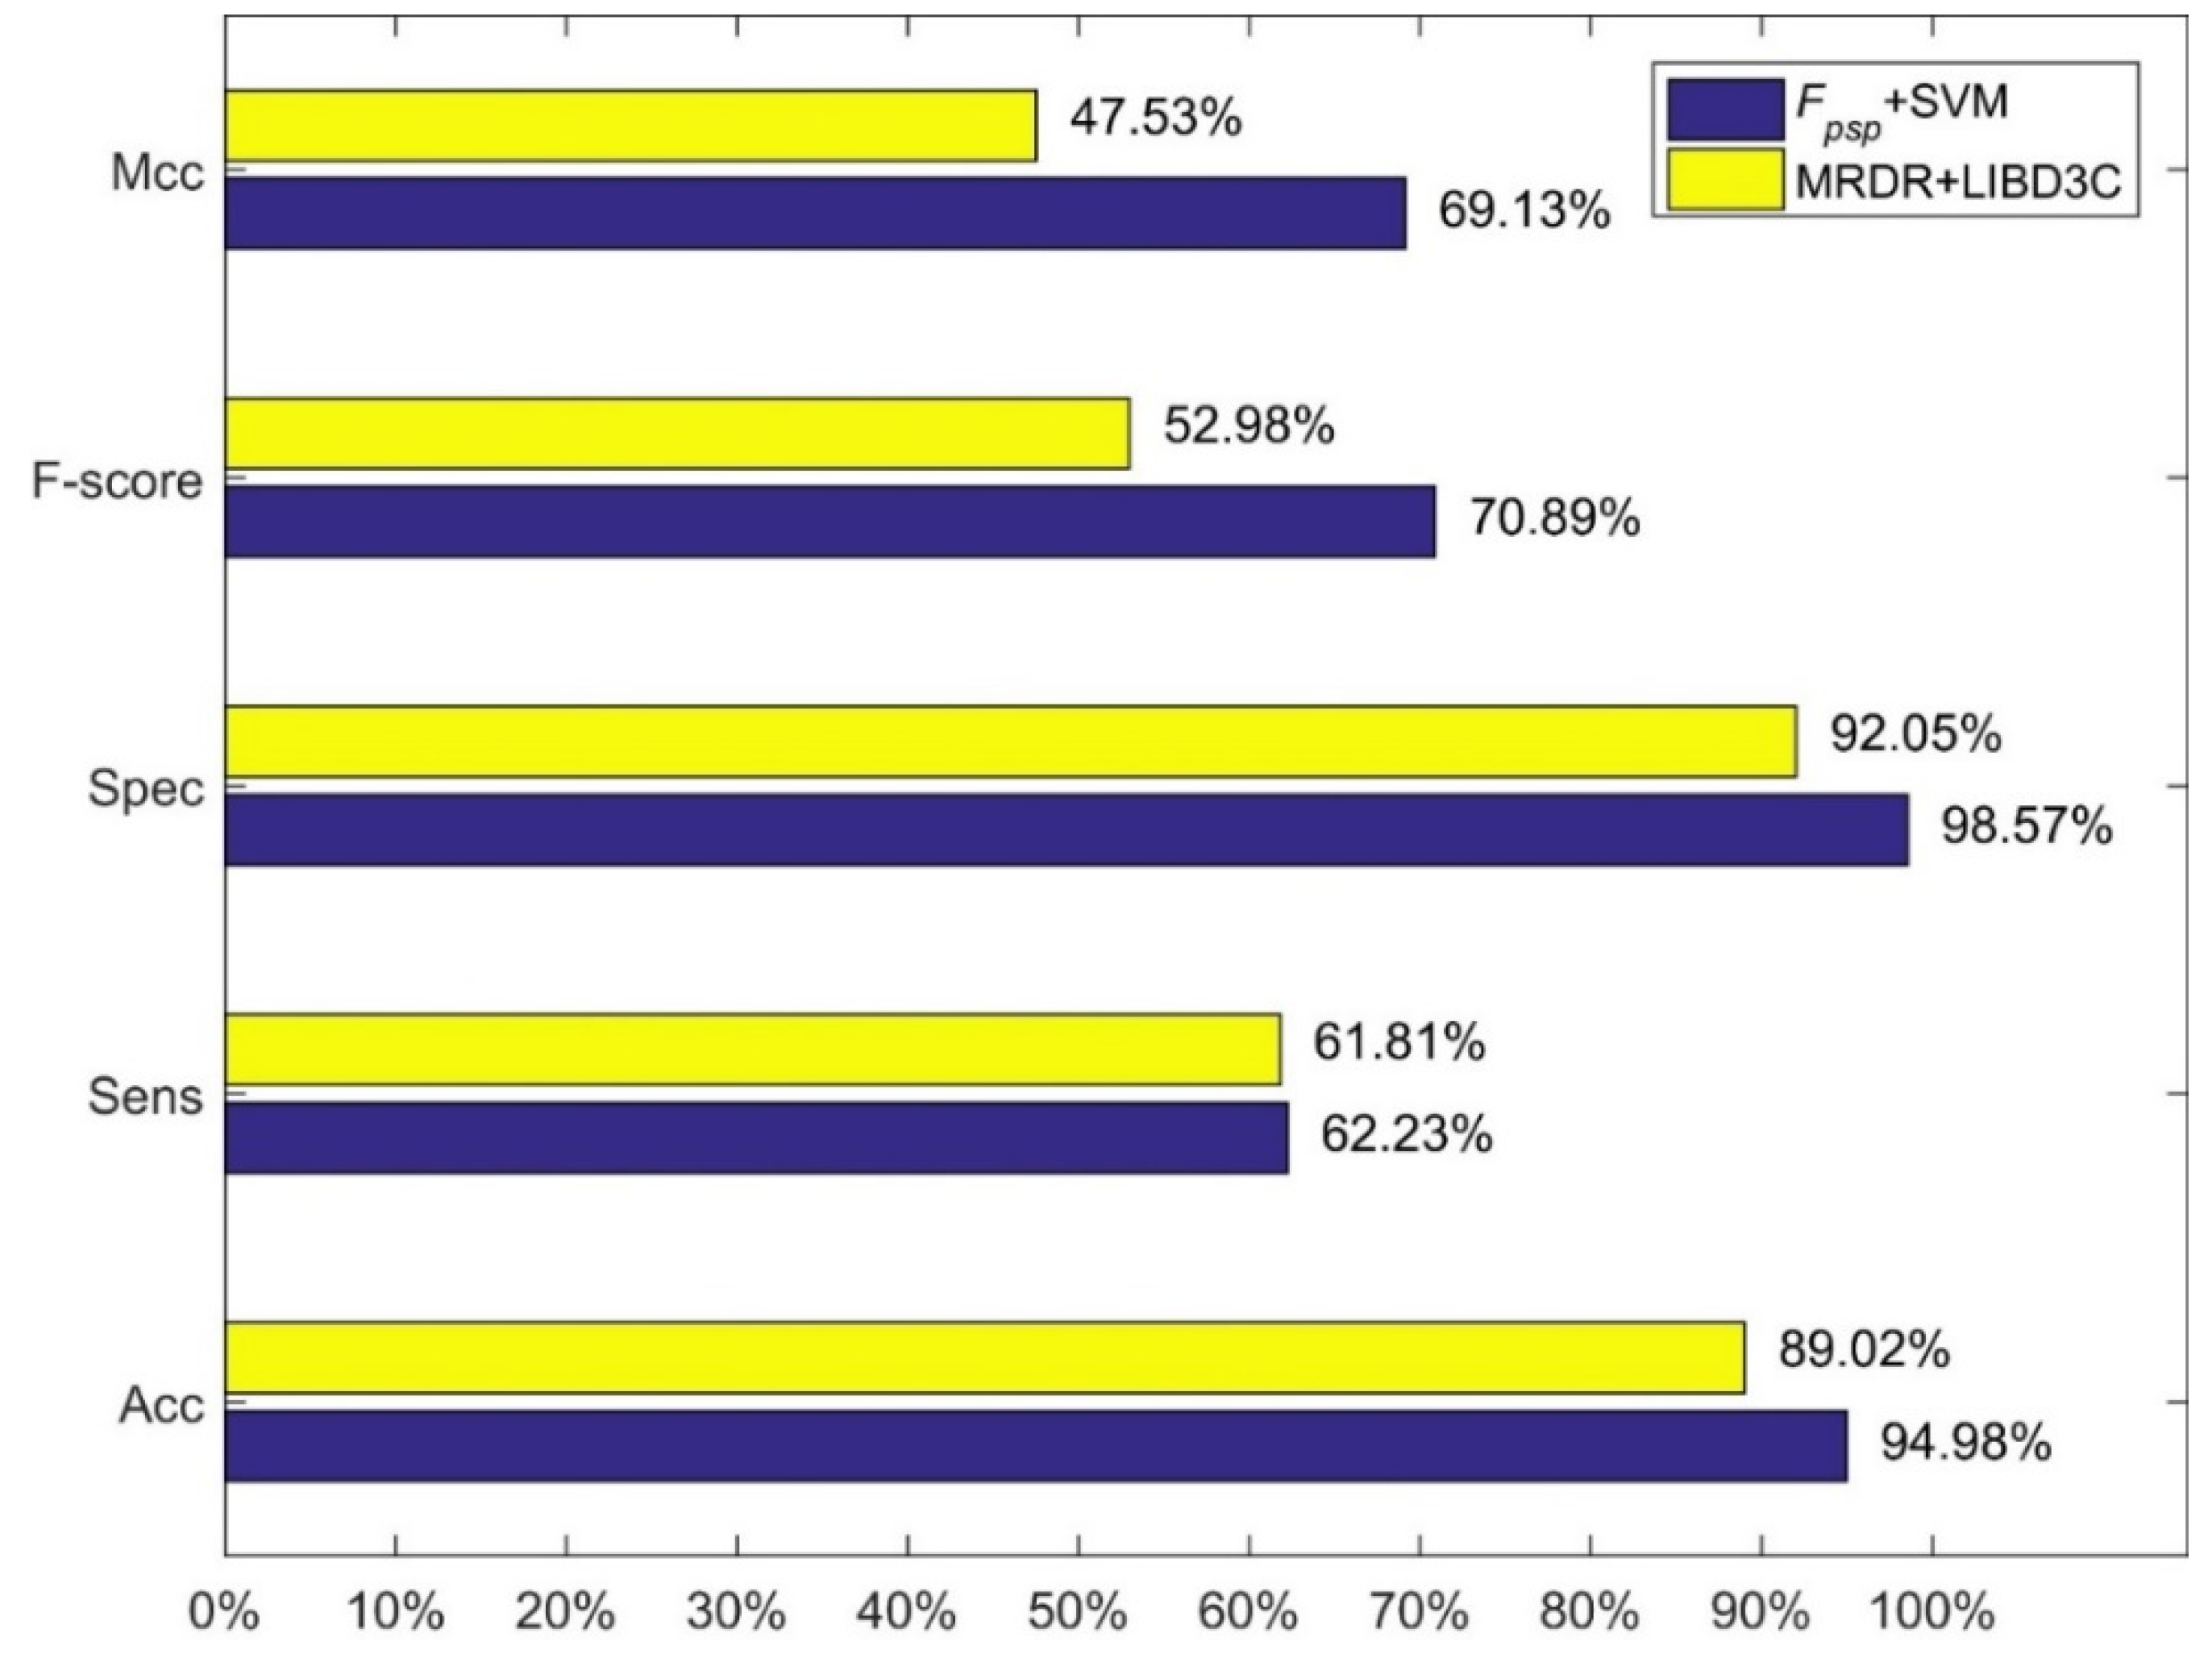
We compared our method, i.e., feature combination Fpsp with SVM and linear kernel function, with three methods of Jiang et al. The results are shown in Figure 1, Figure 2 and Figure 3. Figure 1 shows the comparison between our method and the method using 473-D feature vector and SVM. Figure 3 shows the comparison between our method and the method using MRDR dimensionality reduction method and the LIBD3C classifier. Figure 3 shows the comparison between our method and the method using PCA dimensionality reduction method and the BP-NN classifier. It is obviously that our method is better than their methods from those figures. In the independent test set we prepared, we also obtain high performance. The accuracy is 93.25% which is also higher than their methods.
5. Discussion
Useful information can be extracted from large amount of sequences by appropriate feature extraction methods. Meanwhile, the choice of classifier has an impact on the results of cytokines recognition. In order to obtain higher performance, we focused on the optimal feature combination and adjusted the hyper-parameter appropriately in our experiment, which can promote the characterization of cytokines and build a more appropriate classifier.
Although we achieved higher accuracy, we have some suggestions for further improvement. Firstly, feature selection using sparse regressions [35] like LASSO or elastic net can help further improve the performance and better understand. Secondly, SVM has been widely used in many fields. Thus, we suggest that some deep learning methods should be used in the next experiments, such as deep neural networks with large dataset or the cascade random forests with small dataset. Finally, another sequence-based feature split amino acid composition can also be used in new experiments [36,37].
6. Conclusions
We extracted the Fn-gram features based on amino acid composition, the FPseAAC features based on physicochemical properties, the Fpssm features based on evolutionary information and the Fsss features based on secondary structure. Then we used the combinations of the above features, SVM and 10-flod cross-validation method to find the best performing vector for cytokines recognition. Finally we chose Fpsp with 448 dimensions as our feature vector and SVM with linear kernel function as our classifier. The experiments show that our method is superior to others. The results show that we get at least a 2.07% and at most a 5.96% increase in accuracy, at least a 0.42% and at most a 14.51% increase in sensitivity, at least a 0.43% and at most a 6.52% increase in specificity, at least a 9.57% and at most a 20.81% increase in F-score, at least a 9.99% and at most a 24.21% increase in Mcc.
7. Materials and Methods
7.1. Data
A total of 63,811 cytokine sequences were found and downloaded from the Uniprot database website (http://www.uniprot.org/) and used as positive sequences. We got all families of them, and selected the longest sequence from each family of the rest families, i.e., the families after removing the families of positives from all protein families, as a negative sequence. Here we totally obtained 10,118 negative sequences. Then we used the CD-HIT software to process positive sequences and negative sequences respectively in order to remove the highly similar sequences. To make balance of positive sequences and negative sequences in quantity, we set the positive threshold to 0.6 and set the negative threshold to 0.5, then we achieved 9163 positive sequences and 9327 negative sequences. We deleted the sequences which are so long that we can’t obtain their secondary structures, and the sequences less than 20 in length. Because the extraction of some features requires the length of these sequences to be greater than or equal to 20. Finally, we obtained 9146 positive sequences and 9272 negative sequences.
7.2. Feature Extraction
In order to identify cytokines efficiently and build a stable model, we comprehensively considered four aspects of protein sequences, which are the composition of amino acids, physicochemical properties, evolutionary information of amino acids and the structure of protein sequences.
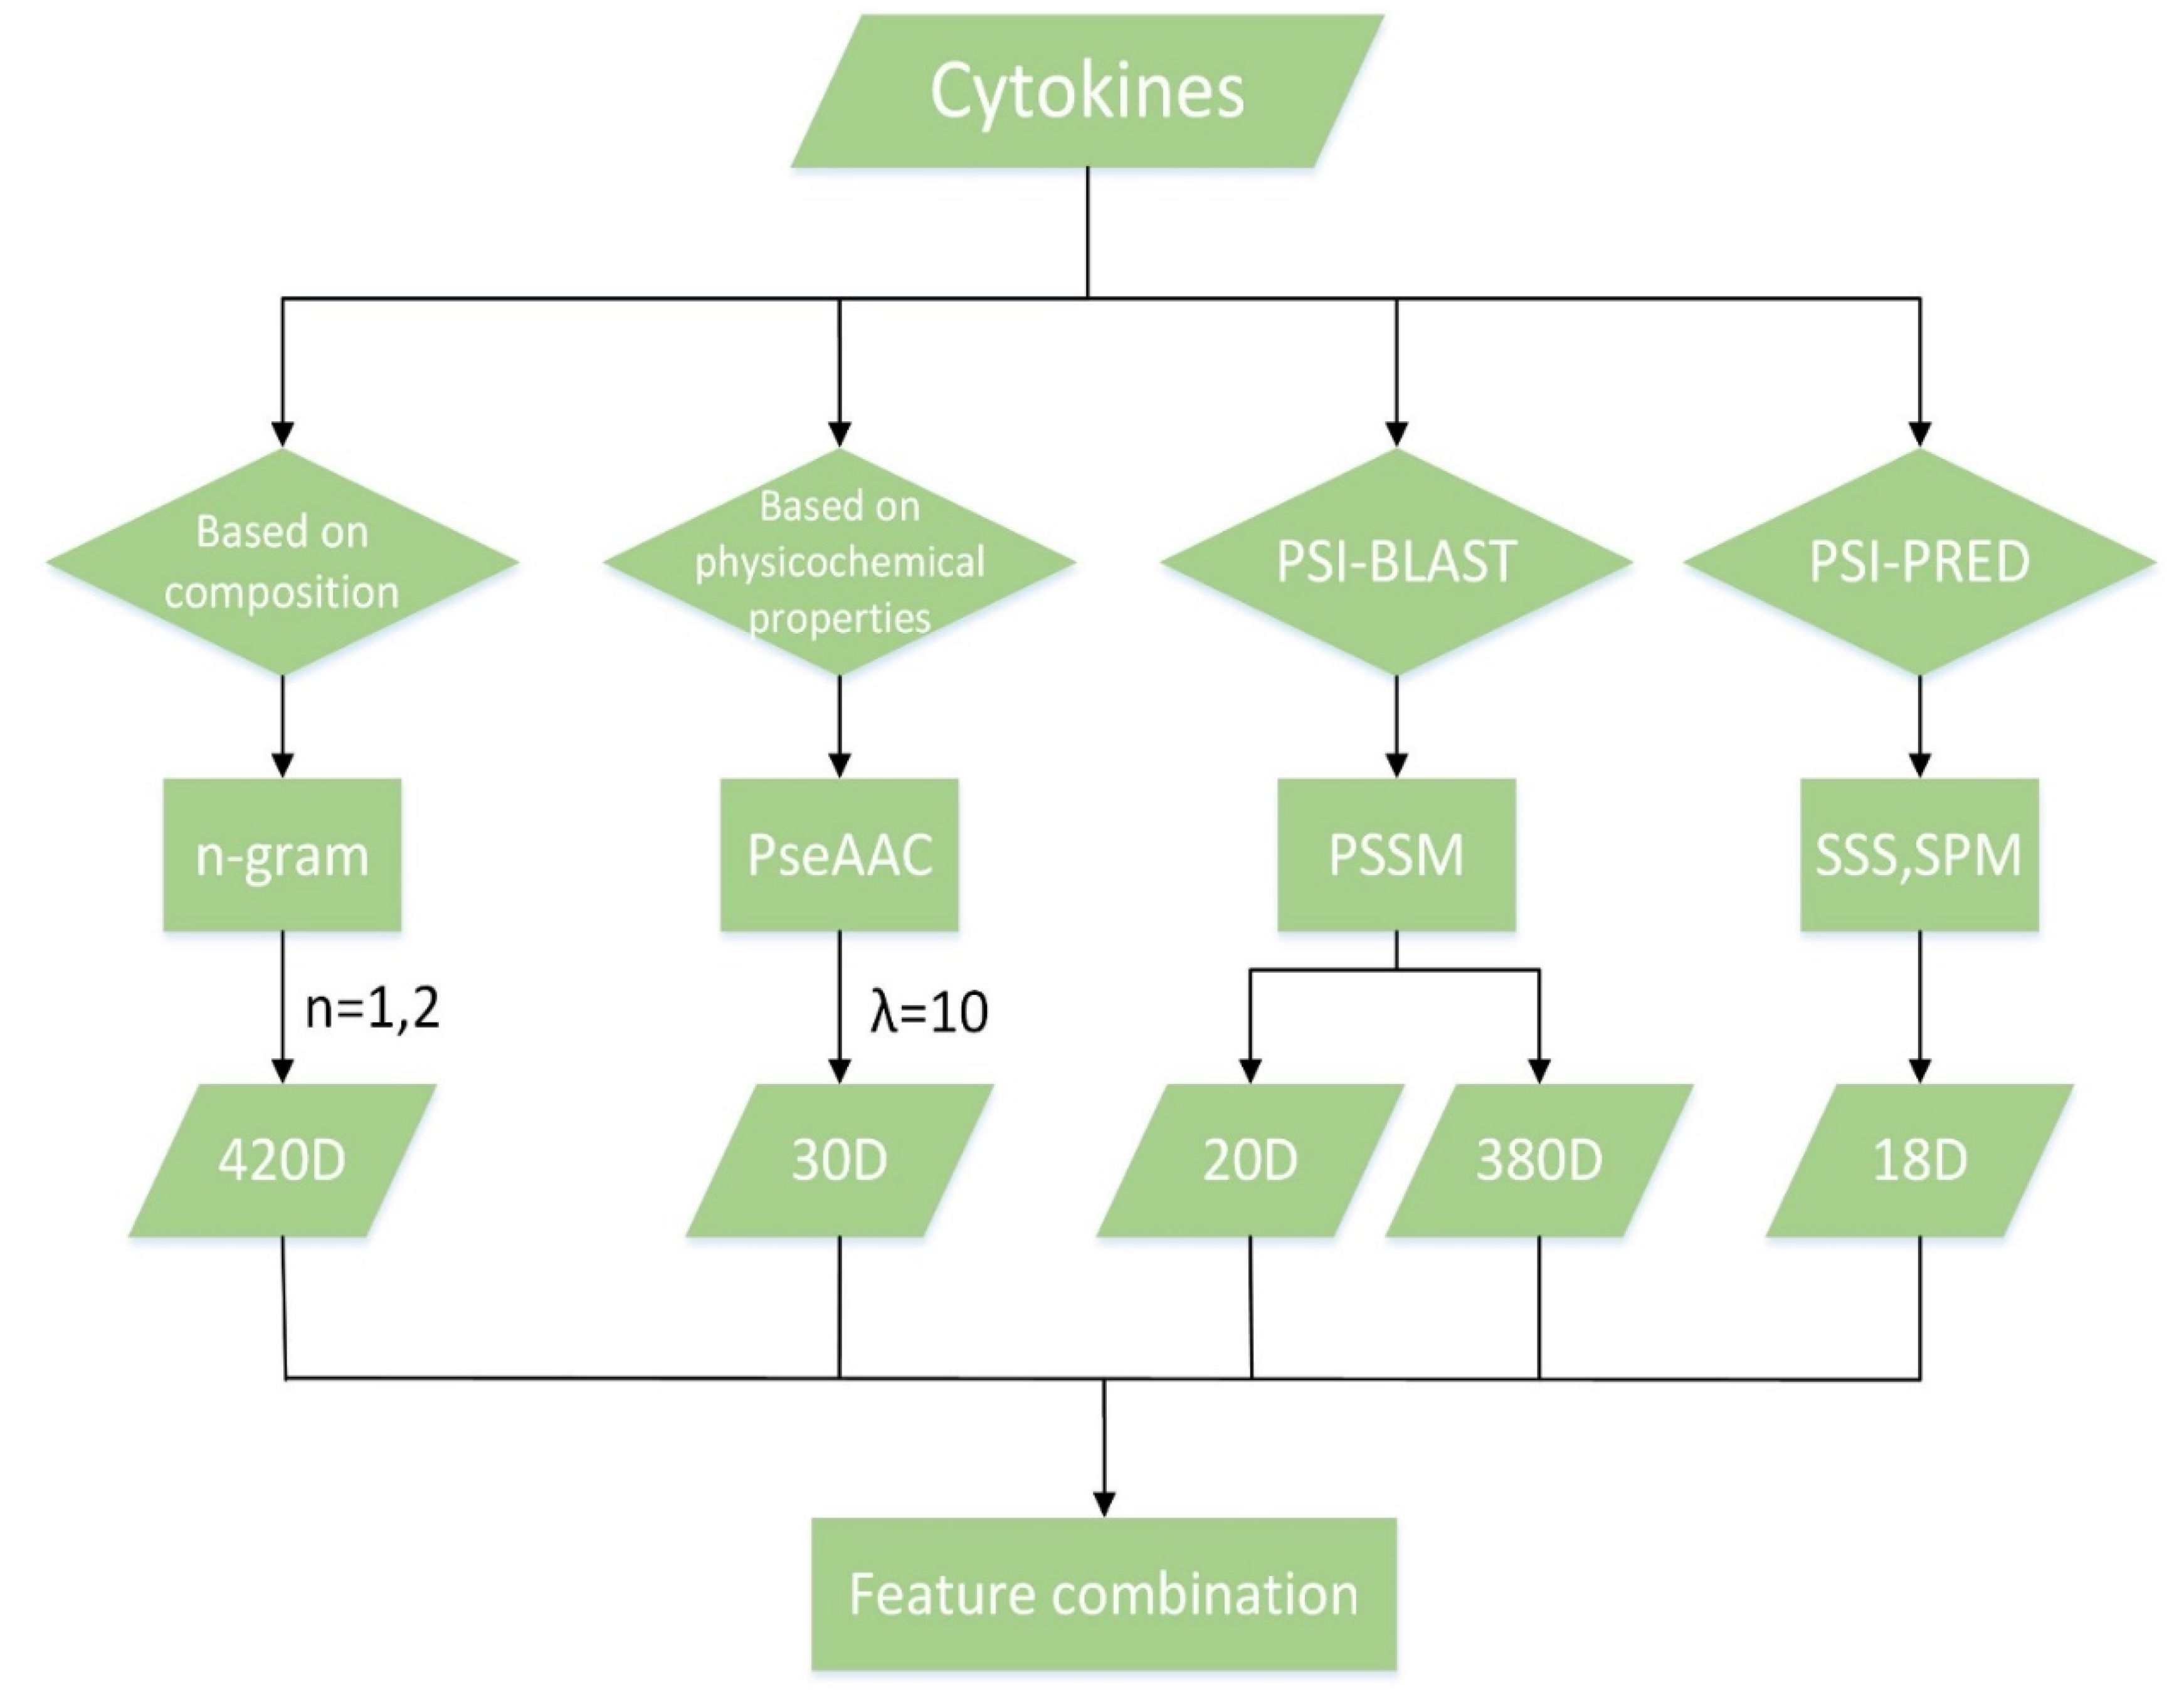
We first got 420 features from composition of amino acids by using the n-gram algorithm for n = 1 and n = 2, and obtained 30 features from physicochemical properties by PseAAC algorithm. Moreover, we computed PSSM by PSI-BLAST software and obtained 400 features about evolutionary information of protein sequences and amino acids. Finally, we extracted secondary structure sequences (SSS for short) and structure probability matrices (SPM for short) by PSI-PRED software to get 18 features about the structure of protein sequences. The process of feature extraction is shown in Figure 4.
7.2.1. n-Gram
The n-gram algorithm with a low complexity has been widely used in many fields [38,39]. We obtained features by counting the number of n consecutive amino acids in the sequence, where we set n = 1 and n = 2. Given a protein sequence P, L is the length of P and stands for the spatially adjacent n amino acids. For every possible segment in P, its feature value is computed in detail as follows:
N is the maximum value of n, where N = 2, and represents the number that appears in P. Therefore, there are 20 features for 1-gram and 400 (i.e., 202) features for 2-gram. Finally, we obtained 420 features by the n-gram algorithm.
7.2.2. PseAAC
However, it is not enough only to take composition information into consideration for cytokines recognition. For example, the amino acid sequences HIDHIHI and HIHIDHI have the same feature vector in the n-gram algorithm, but they are two different sequences because of the different orders of amino acids in the sequences. Then PseAAC algorithm was proposed to solve this problem which is based on composition information, correlation of sequence order and physicochemical properties.
For a protein sequence, a total of 20 + λ features can be extracted by PseAAC algorithm and recorded by Formula 2, where is the ith feature value. The first 20 features are computed based on the composition of the sequence, and other λ features describing the correlation of sequence order which are computed in terms of the hydrophilicity, hydrophobicity, and side-chain mass of amino acids. The calculation method is shown in Equation (9) and Equation (10):
Here λ expresses the rank of correlation among amino acids of a protein sequence, w is the weight factor for the sequence order effect [40], and represents the ith amino acid in the 20 standard amino acids with the fixed order. , , are the values of hydrophilicity, hydrophobicity and side-chain mass of , which are calculated by Z-score transformation. The method is shown in Formula 5. μ and σ represent mean and standard deviation. is the frequency of which is normalized by using Z-score method. PseAAC algorithm has been implemented by PseAAC-Builder software [41,42] and we used the software to obtain a 30-dimensional feature vector when λ = 10 and w = 0.052.2.3 PSSM.
For a protein sequence P, PSSM of P can be computed by PSI-BLAST software, which contains the evolutionary information of P. The matrix is as follows. Additionally, PSSM can be used in another way [43], which calculates pairwise similarity based on both PSSM and PSFM.
where indicates the score of the ith amino acid in P evolving to the jth amino acid in the 20 standard amino acids. Next, we used the following formula to convert it into a value between 0 and 1:
We calculated the average of each column of PSSM by Equation (14) and obtained 20 features. The feature vector is short for Fpssm-20:
The above 20 features are extracted from the evolutionary information of a sequence, but there is no correlation between amino acids in the sequence. In order to overcome the shortcoming, Zhang et al. [17] proposed an algorithm based on PSSM and the correlation factor () computed by PseAAC algorithm. The features are calculated by the following formulas:
Fs and Ft, respectively, are the average of the s-th column and the t-th column of PSSM. There are two points that need to be noted in the algorithm. First, the sequence length should be greater than or equal to 20, otherwise L-g will be 0 (the denominator in Equation (15) will be 0). Secondly, the value of Equation (15) is 1 when s and t are equal, therefore the features are invalid for s = t and should be abandoned. That is to say, Equation (15) will be computed for s ≠ t. Then 20 features (i.e., when s = t) will be deleted from all 400 features. Finally, a total of 380 features are obtained. The feature vector is short for Fpssm-380.
7.2.3. Secondary Structure
The secondary structure of protein has always been used to predict protein structural classes. Here we used it to recognize the function of proteins. The secondary structure of protein sequences are divided into helix, sheet, and coil, which can be abbreviated as H, E, and C.
PSI-PRED software can be used to extract the secondary structure sequence of a protein sequence, which is a sequence consisting of H, E, and C. We obtained three features by calculating the frequency of H, E and C by Equation (11) [44]. Here L is the length of the secondary structure sequence and T(H), T(E), T(C) are the number of H, E, C:
We attained another three features with positional information computed by Equation (18) [44]. Here , and are the position index (starts at 1) of the i-th H, E, C in the secondary structure sequence:
Another three features can be computed by Equation (19) [44], where MAX(LH), MAX(LE), MAX(LC) are the maximal length of all contiguous segments H, E, and C. For example, for the secondary structure sequence EEEEHHEEHHHCC, MAX(LH) = 3, MAX(LE) = 4 and MAX(LC) = 2:
For a secondary structure sequence S, there will be the sequence S0 with H and E after removing C from S. S0 will be a sequence consisting of α and β when the consecutive H denoted by α and the consecutive E denoted by β [45]. Then a transition probability matrix (TPM) can be computed by Equation (20) [46,47,48,49,50]. Here T(αα), T(αβ), T(βα) and T(ββ) are the number of αα, αβ, βα and ββ in the sequence:
Six features can be extracted in terms of TPM, and the corresponding formula is as follows:
For a secondary structure sequence S, the SPM for S is shown by Equation (22), where is the possibility of the ith element of S predicted to the j-th element of C, H and E ():
Then three features can be obtained by Equation (23). Finally, we obtain a total of 18 features based on the secondary structure of protein sequences:
Author Contributions
Z.Y. proposed the method and designed the experiments; all authors analyzed the data; Z.Y. and J.W. wrote the paper.
Funding
This research was funded by National Natural Science Foundation of China grant number 61661040.
Conflicts of Interest
The authors declare no conflict of interest.
References
- Sutovsky, J.; Kocmalova, M.; Benco, M.; Kazimierova, I.; Pappova, L.; Frano, A.; Sutovska, M. The role of cytokines in degenerative spine disorders. Eur. Pharm. J. 2017, 64, 26–29. [Google Scholar] [CrossRef] [Green Version]
- Vandergeeten, C.; Fromentin, R.; Chomont, N. The role of cytokines in the establishment, persistence and eradication of the hiv reservoir. Cytokine Growth Factor Rev. 2012, 23, 143–149. [Google Scholar] [CrossRef] [PubMed]
- Si, M.; Jiao, X.; Li, Y.; Chen, H.; He, P.; Jiang, F. The role of cytokines and chemokines in the microenvironment of the blood–brain barrier in leukemia central nervous system metastasis. Cancer Manag. Res. 2018, 10, 305–313. [Google Scholar] [CrossRef] [PubMed]
- Musolino, C.; Allegra, A.; Innao, V.; Allegra, A.G.; Pioggia, G.; Gangemi, S. Inflammatory and anti-inflammatory equilibrium, proliferative and antiproliferative balance: The role of cytokines in multiple myeloma. Mediat. Inflamm. 2017, 2017, 1852517. [Google Scholar] [CrossRef] [PubMed]
- Champsi, J.H.; Bermudez, L.E.; Young, L.S. The role of cytokines in mycobacterial infection. Biotherapy 1994, 7, 187–193. [Google Scholar] [CrossRef] [PubMed]
- Huang, Y.; Gnanadurai, C.W.; Zhen Fang, F.U. Critical roles of chemokines and cytokines in antiviral innate immune responses during rabies virus infection. Front. Agric. Sci. Eng. 2017, 4, 260–267. [Google Scholar] [CrossRef]
- Nakajima, H.; Takatsu, K. Role of cytokines in allergic airway inflammation. Int. Arch. Allergy Immunol. 2007, 142, 265–273. [Google Scholar] [CrossRef] [PubMed]
- Tang, W.J.; Tao, L.; Lu, L.M.; Tang, D.; Shi, X.L. Role of t helper 17 cytokines in the tumour immune inflammation response of patients with laryngeal squamous cell carcinoma. Oncol. Lett. 2017, 14, 561–568. [Google Scholar] [CrossRef] [PubMed]
- Nakashima, H.; Nishikawa, K. Discrimination of intracellular and extracellular proteins using amino acid composition and residue-pair frequencies. J. Mol. Boil. 1994, 238, 54. [Google Scholar] [CrossRef] [PubMed]
- Luo, R.Y.; Feng, Z.P.; Liu, J.K. Prediction of protein structural class by amino acid and polypeptide composition. Eur. J. Biochem. 2010, 269, 4219–4225. [Google Scholar] [CrossRef]
- Shen, H.; Chou, K. Ensemble classifier for protein fold pattern recognition. Bioinformatics 2006, 22, 1717–1722. [Google Scholar] [CrossRef] [PubMed] [Green Version]
- Altschul, S.F.; Madden, T.L.; Schäffer, A.A.; Zhang, J.; Zhang, Z.; Miller, W.; Lipman, D.J. Gapped blast and psi-blast: A new generation of protein database search programs. Nucleic Acids Res. 1997, 25, 3389–4002. [Google Scholar] [CrossRef] [PubMed]
- Kong, L.; Zhang, L.; Lv, J. Accurate prediction of protein structural classes by incorporating predicted secondary structure information into the general form of chou’s pseudo amino acid composition. J. Theor. Boil. 2014, 344, 12–18. [Google Scholar] [CrossRef] [PubMed]
- Zhang, L.; Kong, L.; Han, X.; Lv, J. Structural class prediction of protein using novel feature extraction method from chaos game representation of predicted secondary structure. J. Theor. Boil. 2016, 400, 1–10. [Google Scholar] [CrossRef] [PubMed]
- Jones, D.T. Protein secondary structure prediction based on position-specific scoring matrices 1. J. Mol. Biol. 1999, 292, 195–202. [Google Scholar] [CrossRef] [PubMed]
- Kamal, N.A.M.; Bakar, A.A.; Zainudin, S. Classification of human membrane protein types using optimal local discriminant bases feature extraction method. J. Theor. Appl. Inf. Technol. 2018, 96, 767–771. [Google Scholar]
- Zhang, S.; Duan, X. Prediction of protein subcellular localization with oversampling approach and chou’s general pseaac. J. Theor. Boil. 2018, 437, 239–250. [Google Scholar] [CrossRef] [PubMed]
- Sinha, A.K.; Namdev, N.; Kumar, A. Rough set method accurately predicts unknown protein class/family of leishmania donovani membrane proteome. Math. Biosci. 2018, 301, 37. [Google Scholar] [CrossRef] [PubMed]
- Huo, H.; Yang, L. Prediction of conotoxin superfamilies by the naive bayes classifier. In Proceedings of the 2017 10th International Congress on Image and Signal Processing, BioMedical Engineering and Informatics (CISP-BMEI), Shanghai, China, 14–16 October 2017. [Google Scholar]
- Vapnik, V.N. The nature of statistical learning theory. IEEE Trans. Neural Netw. 1997, 38, 409. [Google Scholar]
- Rahman, J.; Mondal, M.N.; Islam, M.K.; Hasan, M.A. Feature fusion based svm classifier for protein subcellular localization prediction. J. Integr. Bioinform. 2016, 13, 23–33. [Google Scholar] [CrossRef]
- Mei, J.; Ji, Z. Prediction of hiv-1 and hiv-2 proteins by using chou’s pseudo amino acid compositions and different classifiers. Sci. Rep. 2018, 8, 2359. [Google Scholar] [CrossRef] [PubMed]
- Zhou, X.; Tuck, D.P. Msvm-rfe: Extensions of svm-rfe for multiclass gene selection on DNA microarray data. Bioinformatics 2007, 23, 1106. [Google Scholar] [CrossRef] [PubMed]
- Zhang, Y.; Yang, Y.; Zhang, H.; Jiang, X.; Xu, B.; Xue, Y.; Cao, Y.; Zhai, Q.; Zhai, Y.; Xu, M. Prediction of novel pre-micrornas with high accuracy through boosting and svm. Bioinformatics 2011, 27, 1436–1437. [Google Scholar] [CrossRef] [PubMed]
- Ahmad, S.; Sarai, A. Pssm-based prediction of DNA binding sites in proteins. BMC Bioinform. 2005, 6, 1–6. [Google Scholar] [CrossRef] [PubMed] [Green Version]
- Huang, N.; Chen, H.; Sun, Z. Ctkpred: An svm-based method for the prediction and classification of the cytokine superfamily. Protein Eng. Des. Sel. PEDS 2005, 18, 365–368. [Google Scholar] [CrossRef] [PubMed]
- Zeng, X.; Yuan, S.; Huang, X.; Zou, Q. Identification of cytokine via an improved genetic algorithm. Front. Comput. Sci. 2015, 9, 643–651. [Google Scholar] [CrossRef]
- Jiang, L.; Liao, Z.; Su, R.; Wei, L. Improved identification of cytokines using feature selection techniques. Lett. Org. Chem. 2017, 14, 632–641. [Google Scholar] [CrossRef]
- Yang, B.; Wu, Q.; Ying, Z.; Sui, H. Predicting protein secondary structure using a mixed-modal svm method in a compound pyramid model. Knowl.-Based Syst. 2011, 24, 304–313. [Google Scholar] [CrossRef]
- Wei, Z.S.; Han, K.; Yang, J.Y.; Shen, H.B.; Yu, D.J. Protein-protein interaction sites prediction by ensembling svm and sample-weighted random forests. Neurocomputing 2016, 193, 201–212. [Google Scholar] [CrossRef]
- Krajewski, Z.; Tkacz, E. Feature selection of protein structural classification using svm classifier. Biocybern. Biomed. Eng. 2013, 33, 47–61. [Google Scholar] [CrossRef]
- Bhasin, M.; Raghava, G.P. Gpcrpred: An svm-based method for prediction of families and subfamilies of g-protein coupled receptors. Nucleic Acids Res. 2004, 32, 383–389. [Google Scholar] [CrossRef] [PubMed]
- Chang, C.C.; Lin, C.J. Libsvm: A Library for Support Vector Machines; ACM: New York, NY, USA, 2011; pp. 1–27. [Google Scholar]
- BW, M. Comparison of the predicted and observed secondary structure of t4 phage lysozyme. BBA—Protein Struct. 1975, 405, 442–451. [Google Scholar]
- Wan, S.; Mak, M.W.; Kung, S.Y. Sparse regressions for predicting and interpreting subcellular localization of multi-label proteins. BMC Bioinform. 2016, 17, 97. [Google Scholar] [CrossRef] [PubMed]
- Wan, S.; Mak, M.W.; Kung, S.Y. Ensemble linear neighborhood propagation for predicting subchloroplast localization of multi-location proteins. J. Proteome Res. 2016, 15, 4755–4762. [Google Scholar] [CrossRef] [PubMed]
- Wang, J.; Guo, M. A review of metrics measuring dissimilarity for rooted phylogenetic networks. Brief. Bioinform. 2018. [Google Scholar] [CrossRef]
- Kabli, F.; Hamou, R.M.; Amine, A. Protein classification using n-gram technique and association rules. Int. J. Softw. Innov. 2018, 6, 77. [Google Scholar] [CrossRef]
- Vries, J.K.; Liu, X. Subfamily specific conservation profiles for proteins based on n-gram patterns. BMC Bioinform. 2008, 9, 72. [Google Scholar] [CrossRef] [PubMed]
- Jin, Q.; Grama, I.; Kervrann, C.; Liu, Q. Nonlocal means and optimal weights for noise removal. SIAM J. Imaging Sci. 2017, 10, 1878–1920. [Google Scholar] [CrossRef]
- Du, P.; Gu, S.; Jiao, Y. Pseaac-general: Fast building various modes of general form of chou’s pseudo-amino acid composition for large-scale protein datasets. Int. J. Mol. Sci. 2014, 15, 3495–3506. [Google Scholar] [CrossRef] [PubMed]
- Du, P.; Wang, X.; Xu, C.; Gao, Y. Pseaac-builder: A cross-platform stand-alone program for generating various special chou’s pseudo-amino acid compositions. Anal. Biochem. 2012, 425, 117–119. [Google Scholar] [CrossRef] [PubMed]
- Wan, S.; Mak, M.W.; Kung, S.Y. Transductive learning for multi-label protein subchloroplast localization prediction. IEEE/ACM Trans. Comput. Boil. Bioinform. 2016, 14, 212–224. [Google Scholar] [CrossRef] [PubMed]
- Kurgan, L.; Cios, K.; Chen, K. Scpred: Accurate prediction of protein structural class for sequences of twilight-zone similarity with predicting sequences. BMC Bioinform. 2008, 9, 1–15. [Google Scholar] [CrossRef] [PubMed]
- Liu, T.; Jia, C. A high-accuracy protein structural class prediction algorithm using predicted secondary structural information. J. Theor. Biol. 2010, 267, 272–275. [Google Scholar] [CrossRef] [PubMed]
- Zhang, S.; Ding, S.; Wang, T. High-accuracy prediction of protein structural class for low-similarity sequences based on predicted secondary structure. Biochimie 2011, 93, 710–714. [Google Scholar] [CrossRef] [PubMed]
- Chen, L.; Ying, Z.; Ji, Q.; Liu, X.; Yi, J.; Ke, C.; Quan, Z. Hierarchical classification of protein folds using a novel ensemble classifier. PLoS ONE 2013, 8, e56499. [Google Scholar]
- Song, L.; Li, D.; Zeng, X.; Wu, Y.; Guo, L.; Zou, Q. Ndna-prot: Identification of DNA-binding proteins based on unbalanced classification. BMC Bioinformatics 2014, 15, 298. [Google Scholar] [CrossRef] [PubMed]
- Wei, L.; Liao, M.; Gao, X.; Zou, Q. Enhanced protein fold prediction method through a novel feature extraction technique. IEEE T. Nanobiosci. 2015, 14, 649. [Google Scholar] [CrossRef] [PubMed]
- Wei, L.; Tang, J.; Zou, Q. Local-dpp: An improved DNA-binding protein prediction method by exploring local evolutionary information. Inform. Sciences 2016, 384. [Google Scholar] [CrossRef]
Sample Availability: Samples of the test dataset are available from the authors. |
Figure 1.
Comparison between our method and the 473+SVM.
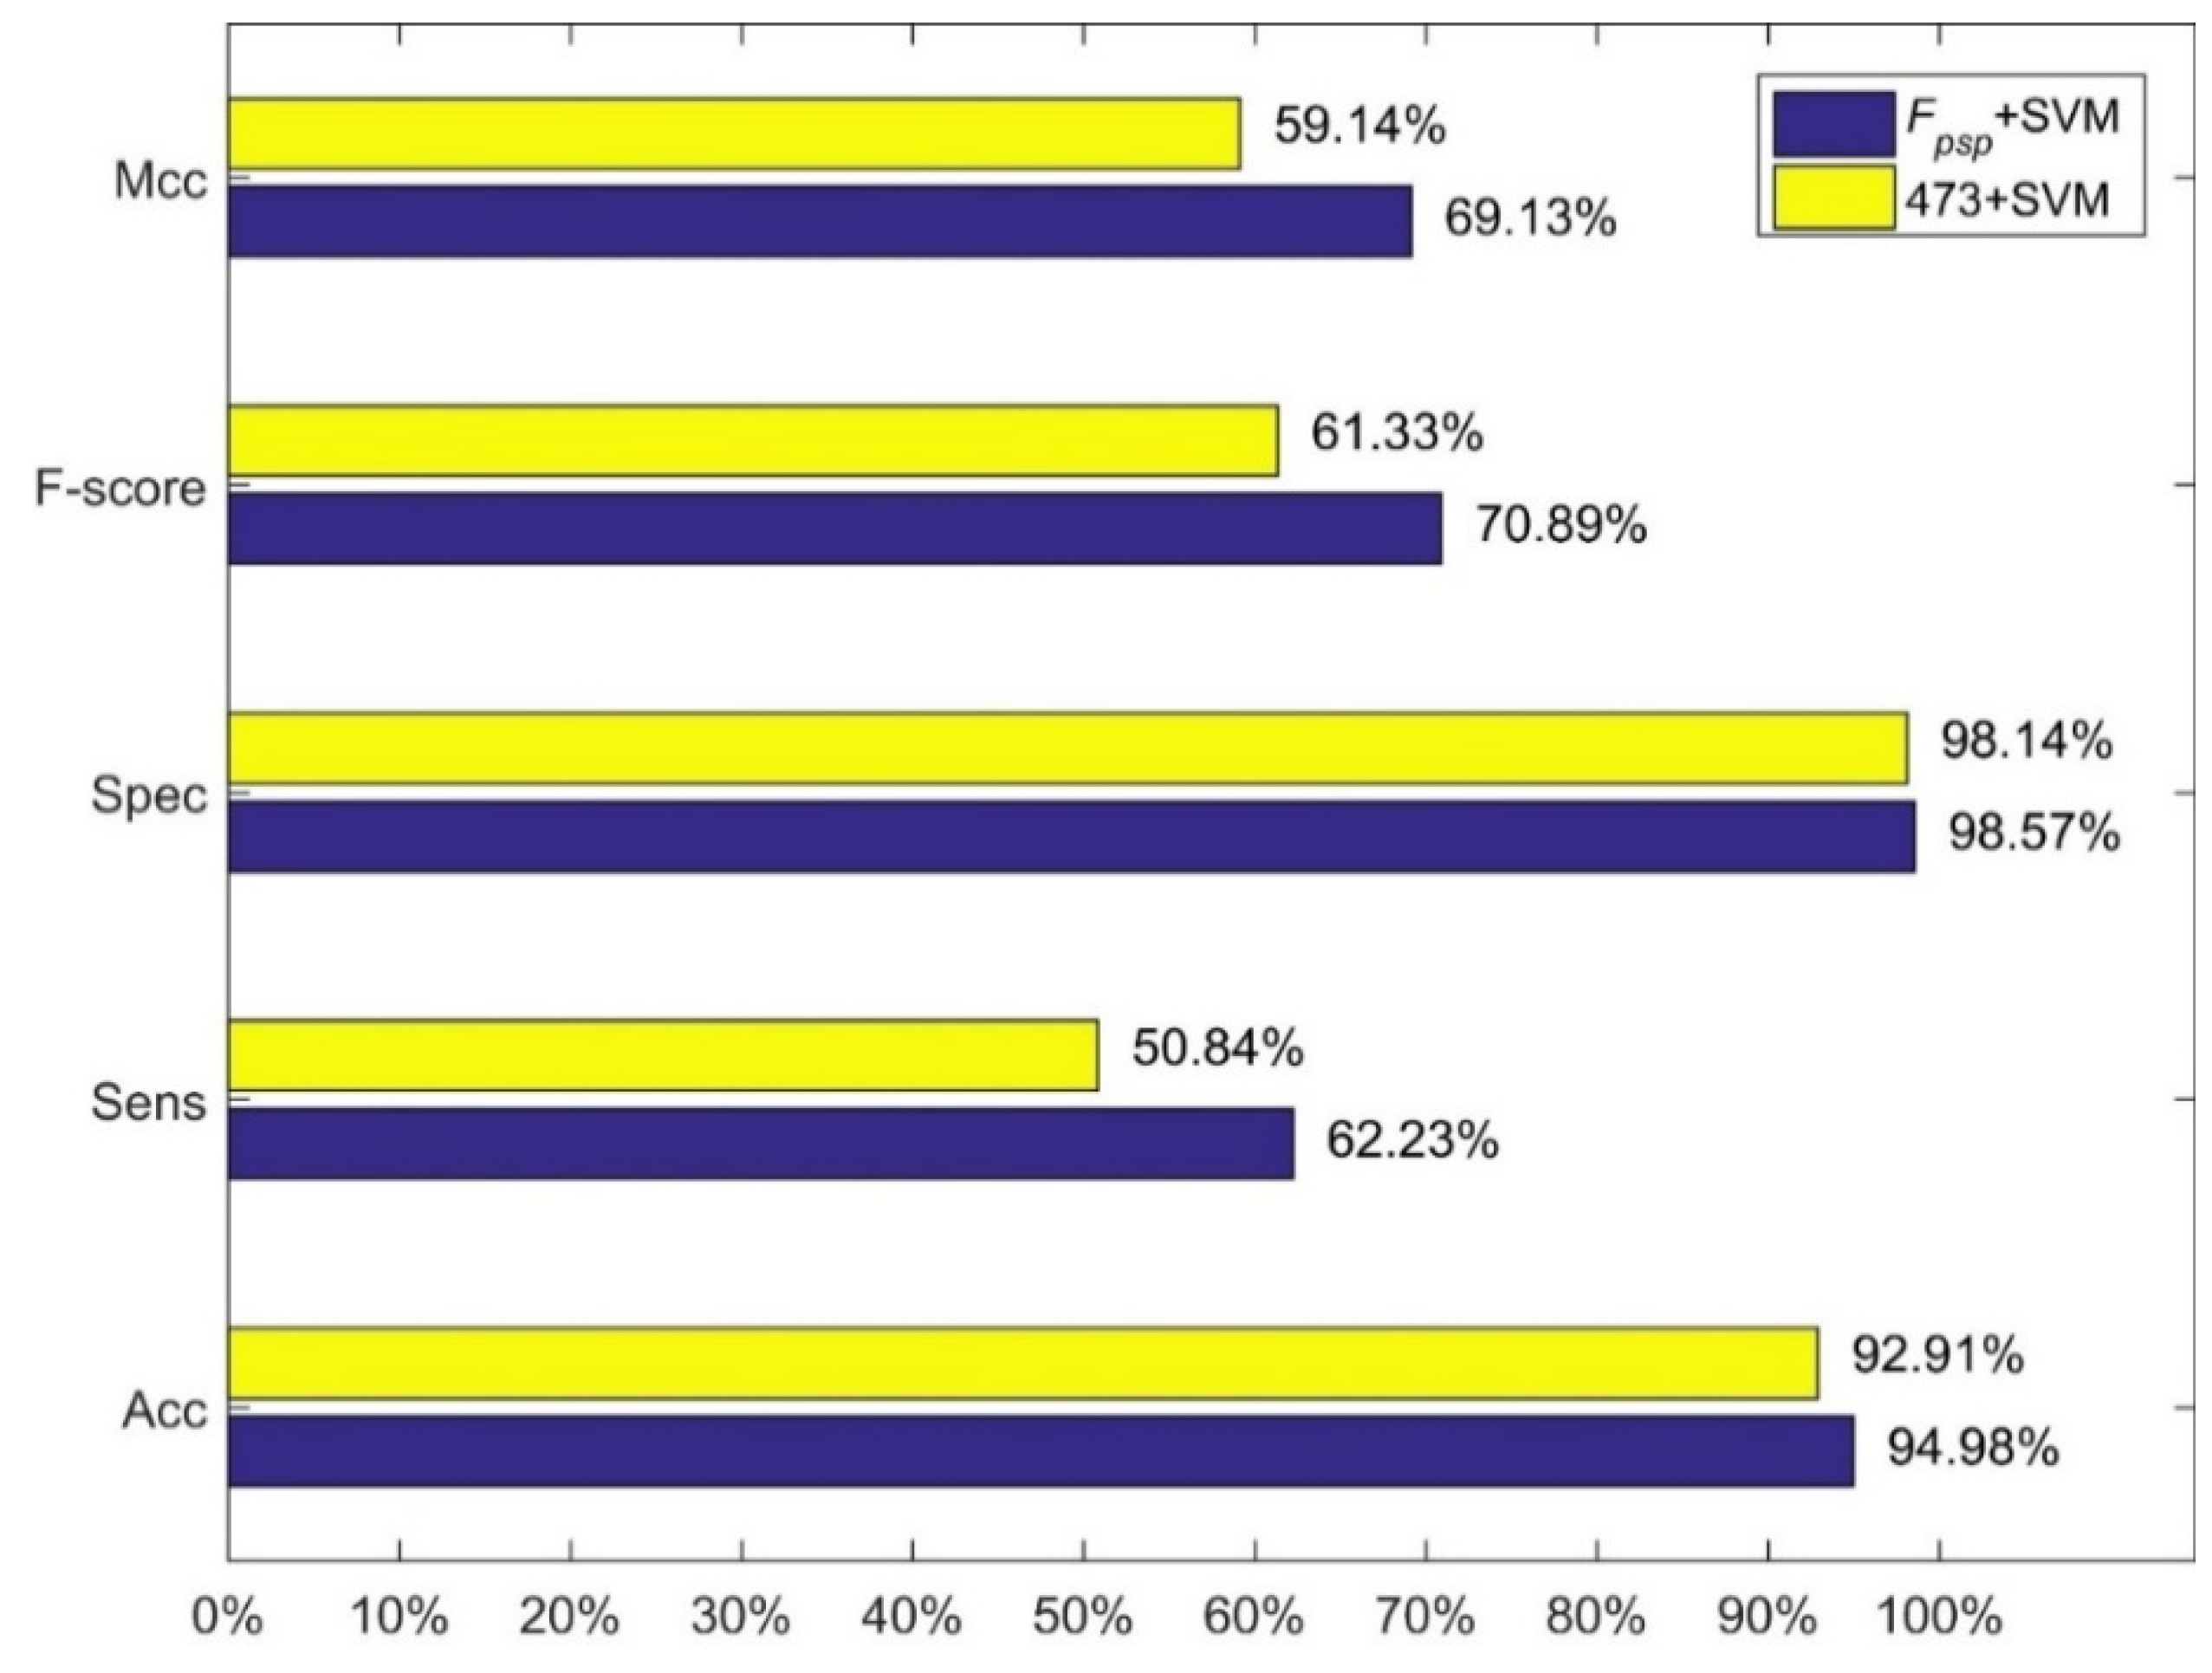
Figure 2.
Comparison between our method and the MRDR+LIBD3C.

Figure 3.
Comparison between our method and the PCA+BP-NN.

Figure 4.
Overview of feature extraction.

Table 1.
Results of each feature extraction method with different kernel functions.
| Feature Vector | Kernel Function | Acc | Sens | Spec | F-score | Mcc |
|---|---|---|---|---|---|---|
| Fn-gram | linear | 80.836% | 85.576% | 76.174% | 81.579% | 61.996% |
| FPseAAC | linear | 81.259% | 81.677% | 80.836% | 81.210% | 62.532% |
| Gaussian | 84.882% | 84.192% | 85.560% | 84.665% | 69.766% | |
| Fpssm-20 | linear | 80.402% | 76.262% | 85.760% | 79.863% | 62.378% |
| Gaussian | 76.823% | 62.769% | 88.829% | 72.222% | 53.404% | |
| Fpssm-380 | linear | 82.832% | 75.378% | 88.886% | 80.836% | 64.865% |
| Gaussian | 77.588% | 63.533% | 93.250% | 74.470% | 59.732% | |
| Fsss | linear | 74.242% | 77.585% | 70.954% | 74.939% | 48.636% |
| Gaussian | 72.950% | 72.616% | 73.296% | 72.716% | 45.912% |
Table 2.
Results of feature combination methods with different kernel functions.
| Feature Vector | Kernel Function | Acc | Sens | Spec | F-Score | Mcc |
|---|---|---|---|---|---|---|
| Fsp | linear | 84.081% | 84.373% | 83.797% | 84.025% | 68.167% |
| Gaussian | 86.149% | 85.412% | 86.885% | 85.957% | 72.299% | |
| Fpssm | linear | 85.700% | 81.505% | 89.836% | 84.970% | 71.621% |
| Gaussian | 78.526% | 62.766% | 94.050% | 74.346% | 59.913% | |
| Fpsp | linear | 89.722% | 88.284% | 91.132% | 89.506% | 79.473% |
| Gaussian | 86.969% | 86.046% | 87.882% | 86.765% | 73.951% | |
| Fpspn | linear | 89.923% | 88.492% | 91.325% | 89.706% | 79.870% |
| Gaussian | 85.531% | 84.951% | 86.110% | 85.358% | 71.062% |
Table 3.
The accuracy of different C and γ for Fpsp with Gaussian kernel.
| C = 2−5 | C = 2−4 | C = 2−3 | C = 2−2 | C = 2−1 | C = 20 | C = 21 | C = 22 | C = 23 | C = 24 | C = 25 | |
| γ = 2−5 | 83.936 | 84.726 | 85.769 | 86.934 | 88.285 | 89.244 | 89.974 | 90.451 | 90.252 | 89.878 | 89.558 |
| γ = 2−4 | 83.604 | 84.316 | 85.148 | 86.451 | 87.754 | 88.912 | 89.558 | 89.606 | 89.491 | 89.371 | 89.286 |
| γ = 2−3 | 76.624 | 79.972 | 82.856 | 85.962 | 86.626 | 87.917 | 88.388 | 88.484 | 88.466 | 88.472 | 88.472 |
| γ = 2−2 | 56.476 | 61.983 | 64.523 | 68.565 | 73.578 | 80.817 | 81.402 | 81.378 | 81.378 | 81.378 | 81.378 |
| γ = 2−1 | 50.407 | 50.407 | 50.407 | 50.570 | 56.995 | 67.696 | 69.259 | 69.259 | 69.259 | 69.259 | 69.259 |
| γ = 20 | 50.407 | 50.407 | 50.407 | 50.407 | 50.407 | 51.433 | 52.404 | 52.404 | 52.404 | 52.404 | 52.404 |
| γ = 21 | 50.407 | 50.407 | 50.407 | 50.407 | 50.407 | 50.419 | 50.413 | 50.413 | 50.413 | 50.413 | 50.413 |
| γ = 22 | 50.407 | 50.407 | 50.407 | 50.407 | 50.407 | 50.407 | 50.407 | 50.407 | 50.407 | 50.407 | 50.407 |
| γ = 23 | 50.407 | 50.407 | 50.407 | 50.407 | 50.407 | 50.407 | 50.407 | 50.407 | 50.407 | 50.407 | 50.407 |
| γ = 24 | 50.407 | 50.407 | 50.407 | 50.407 | 50.407 | 50.407 | 50.407 | 50.407 | 50.407 | 50.407 | 50.407 |
| γ = 25 | 50.407 | 50.407 | 50.407 | 50.407 | 50.407 | 50.407 | 50.407 | 50.407 | 50.407 | 50.407 | 50.407 |
Table 4.
Results of 10 times 10-fold cross-validation.
| Times | Acc | Sens | Spec | F-score | Mcc |
|---|---|---|---|---|---|
| 1 | 90.748% ± 0.567% | 89.181% ± 1.003% | 92.287% ± 0.880% | 90.538% ± 0.617% | 81.533% ± 1.133% |
| 2 | 90.965% ± 0.348% | 89.297% ± 1.090% | 92.632% ± 0.650% | 90.750% ± 0.375% | 81.980% ± 0.657% |
| 3 | 90.851% ± 0.620% | 89.238% ± 0.706% | 92.450% ± 0.836% | 90.644% ± 0.558% | 81.737% ± 1.235% |
| 4 | 90.954% ± 0.695% | 89.343% ± 0.890% | 92.539% ± 0.727% | 90.743% ± 0.772% | 81.942% ± 1.395% |
| 5 | 90.775% ± 0.646% | 89.264% ± 1.327% | 92.267% ± 0.804% | 90.571% ± 0.689% | 81.591% ± 1.269% |
| 6 | 90.819% ± 0.546% | 89.232% ± 0.776% | 92.382% ± 1.097% | 90.612% ± 0.501% | 81.673% ± 1.101% |
| 7 | 90.813% ± 0.682% | 89.120% ± 1.024% | 92.462% ± 0.960% | 90.592% ± 0.725% | 81.660% ± 1.367% |
| 8 | 90.868% ± 0.619% | 89.232% ± 0.964% | 92.473% ± 0.580% | 90.649% ± 0.727% | 81.766% ± 1.238% |
| 9 | 90.895% ± 0.580% | 89.302% ± 0.752% | 92.460% ± 0.863% | 90.692% ± 0.458% | 81.816% ± 1.151% |
| 10 | 90.688% ± 0.532% | 89.134% ± 0.985% | 92.224% ± 0.567% | 90.478% ± 0.572% | 81.407% ± 1.048% |
Table 5.
Results of feature combinations with the ratio of the positives to the negatives 1:9.
| Feature Vector | Kernel Function | Acc | Sens | Spec | F-Score | Mcc |
|---|---|---|---|---|---|---|
| FPseAAC | Gaussian | 92.315% | 31.948% | 98.946% | 44.943% | 46.357% |
| Fsp | Gaussian | 92.875% | 37.385% | 98.963% | 50.743% | 51.529% |
| Fpssm-380 | linear | 93.520% | 43.640% | 98.826% | 57.745% | 57.433% |
| Fpssm | linear | 93.943% | 48.157% | 98.781% | 60.930% | 60.319% |
| Fpsp | linear | 94.980% | 62.231% | 98.572% | 70.899% | 69.132% |
| Fpspn | linear | 94.966% | 62.039% | 98.574% | 70.782% | 68.989% |
© 2018 by the authors. Licensee MDPI, Basel, Switzerland. This article is an open access article distributed under the terms and conditions of the Creative Commons Attribution (CC BY) license (http://creativecommons.org/licenses/by/4.0/).
Share and Cite
MDPI and ACS Style
Yang, Z.; Wang, J.; Zheng, Z.; Bai, X. A New Method for Recognizing Cytokines Based on Feature Combination and a Support Vector Machine Classifier. Molecules 2018, 23, 2008. https://doi.org/10.3390/molecules23082008
AMA Style
Yang Z, Wang J, Zheng Z, Bai X. A New Method for Recognizing Cytokines Based on Feature Combination and a Support Vector Machine Classifier. Molecules. 2018; 23(8):2008. https://doi.org/10.3390/molecules23082008
Chicago/Turabian StyleYang, Zhe, Juan Wang, Zhida Zheng, and Xin Bai. 2018. "A New Method for Recognizing Cytokines Based on Feature Combination and a Support Vector Machine Classifier" Molecules 23, no. 8: 2008. https://doi.org/10.3390/molecules23082008