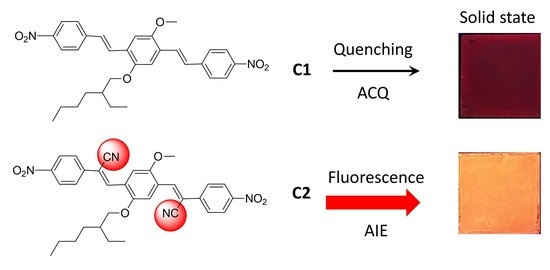
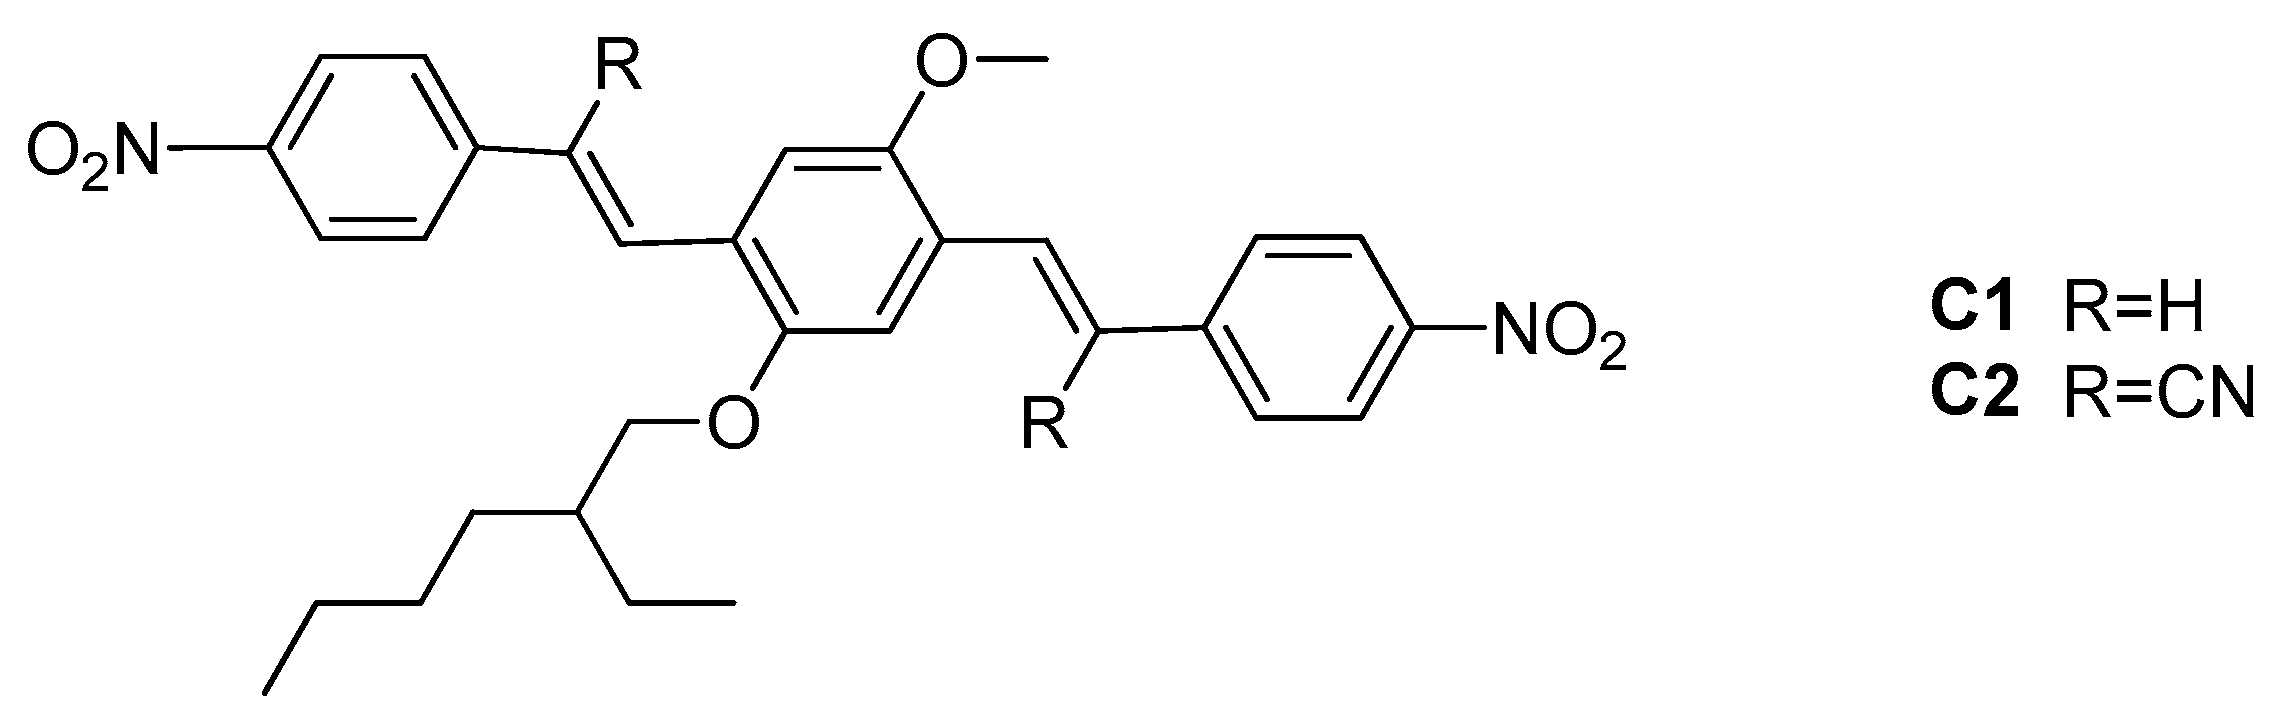
AIE/ACQ Effects in Two DR/NIR Emitters: A Structural and DFT Comparative Analysis

 ,
,  ,
,  ,
,
Abstract
:
1. Introduction
2. Results and Discussion
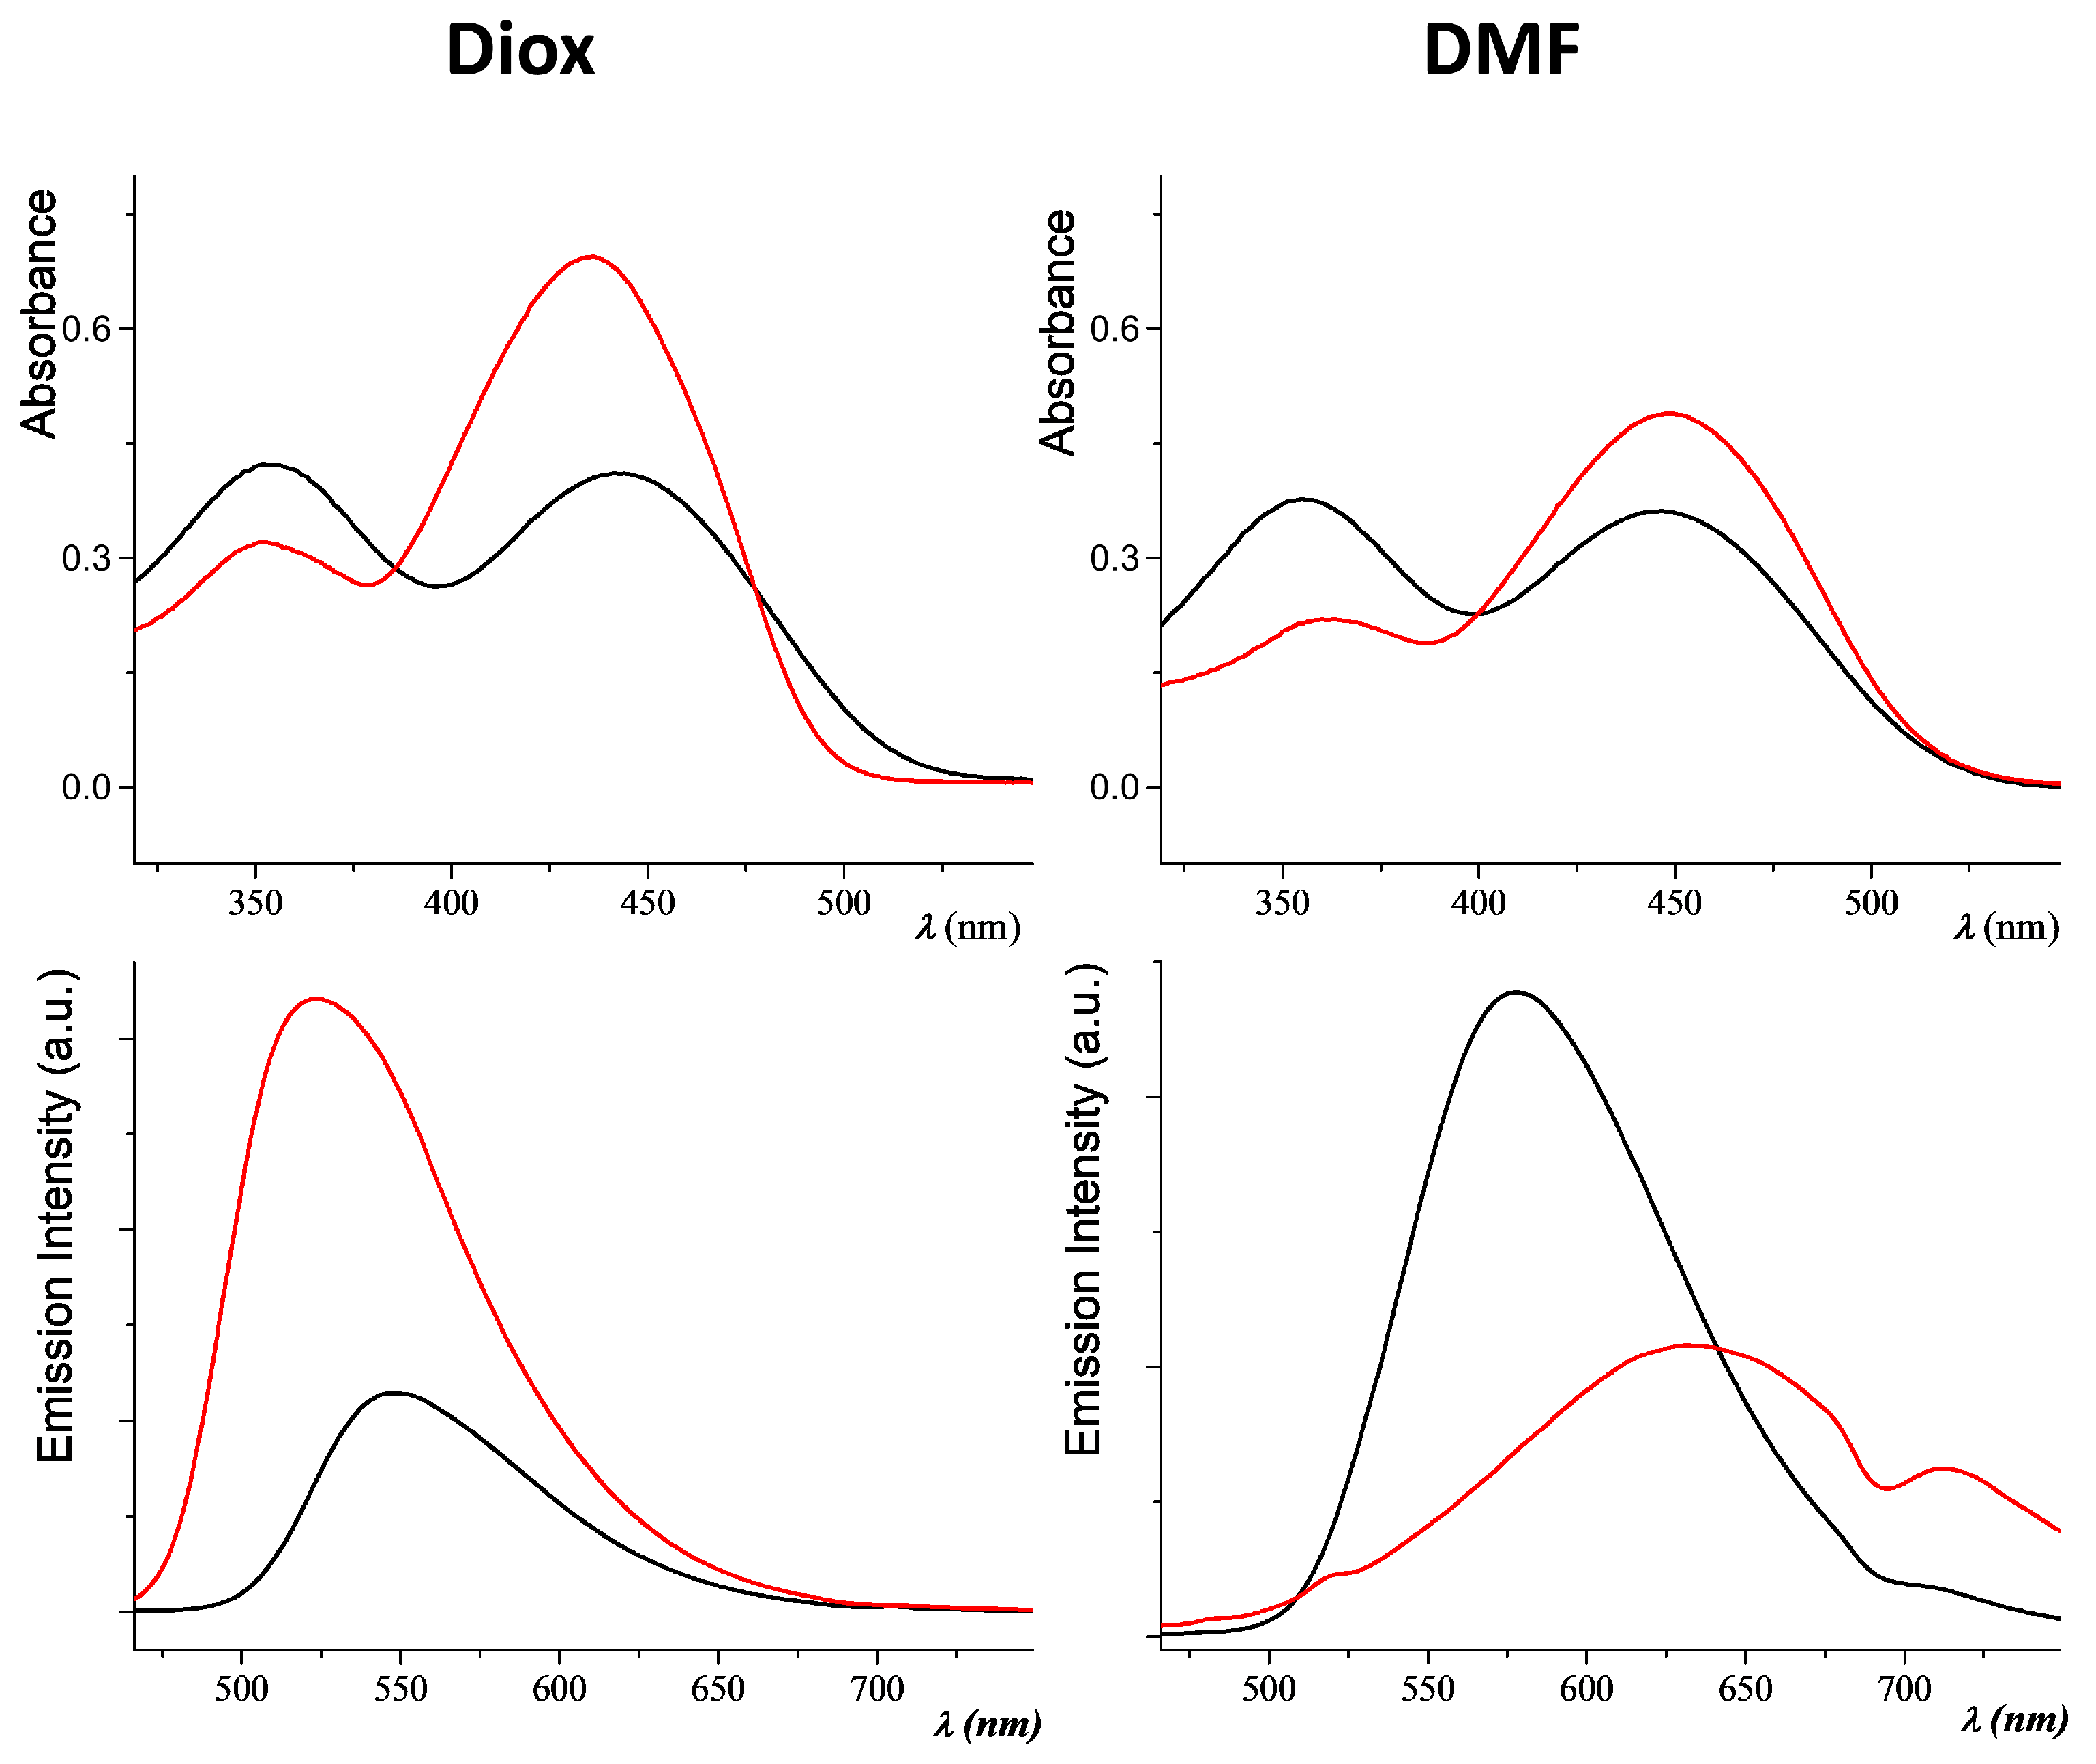
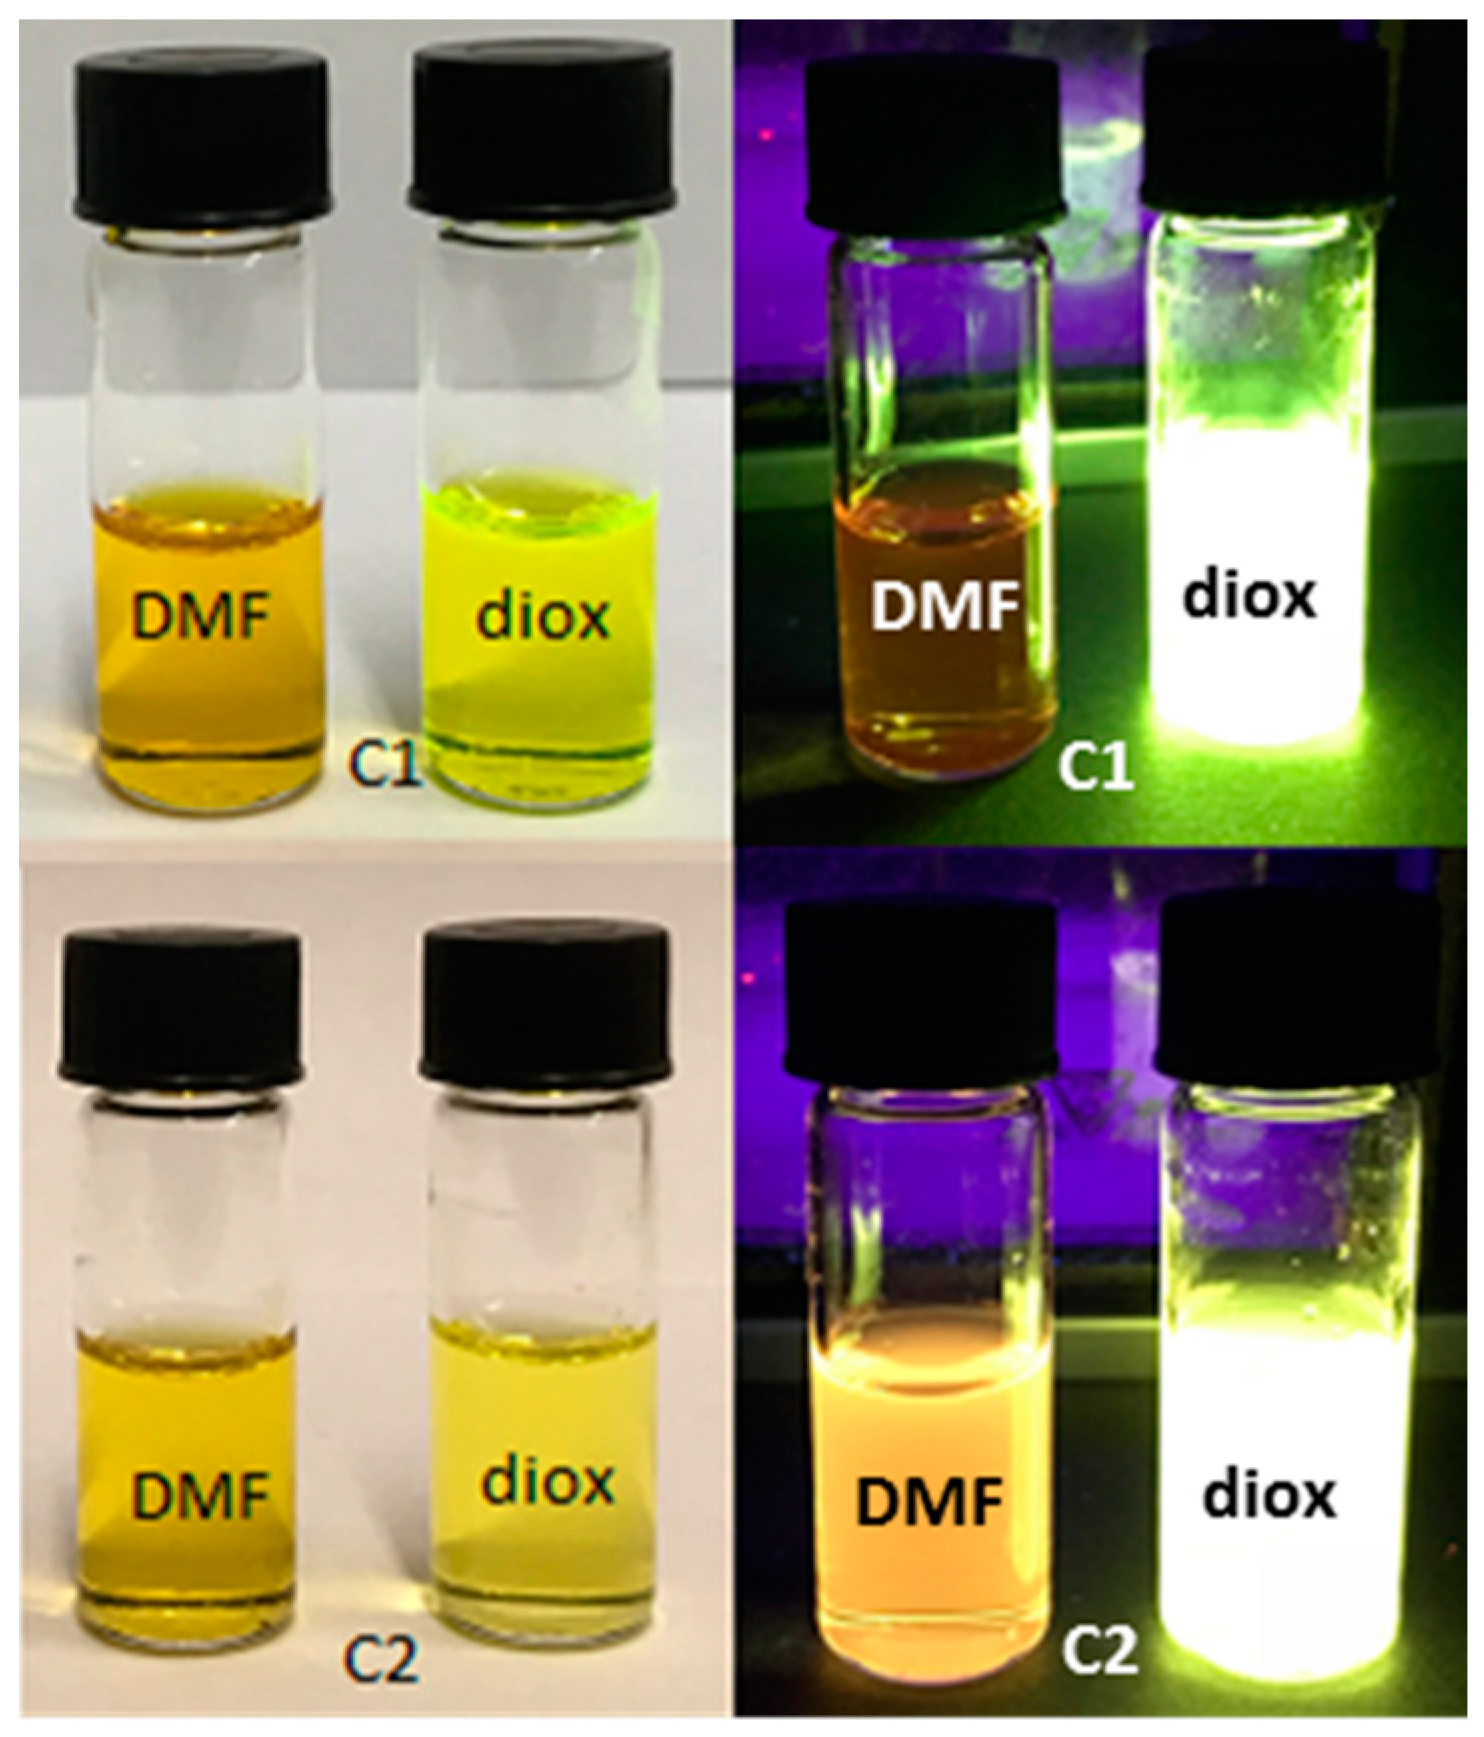
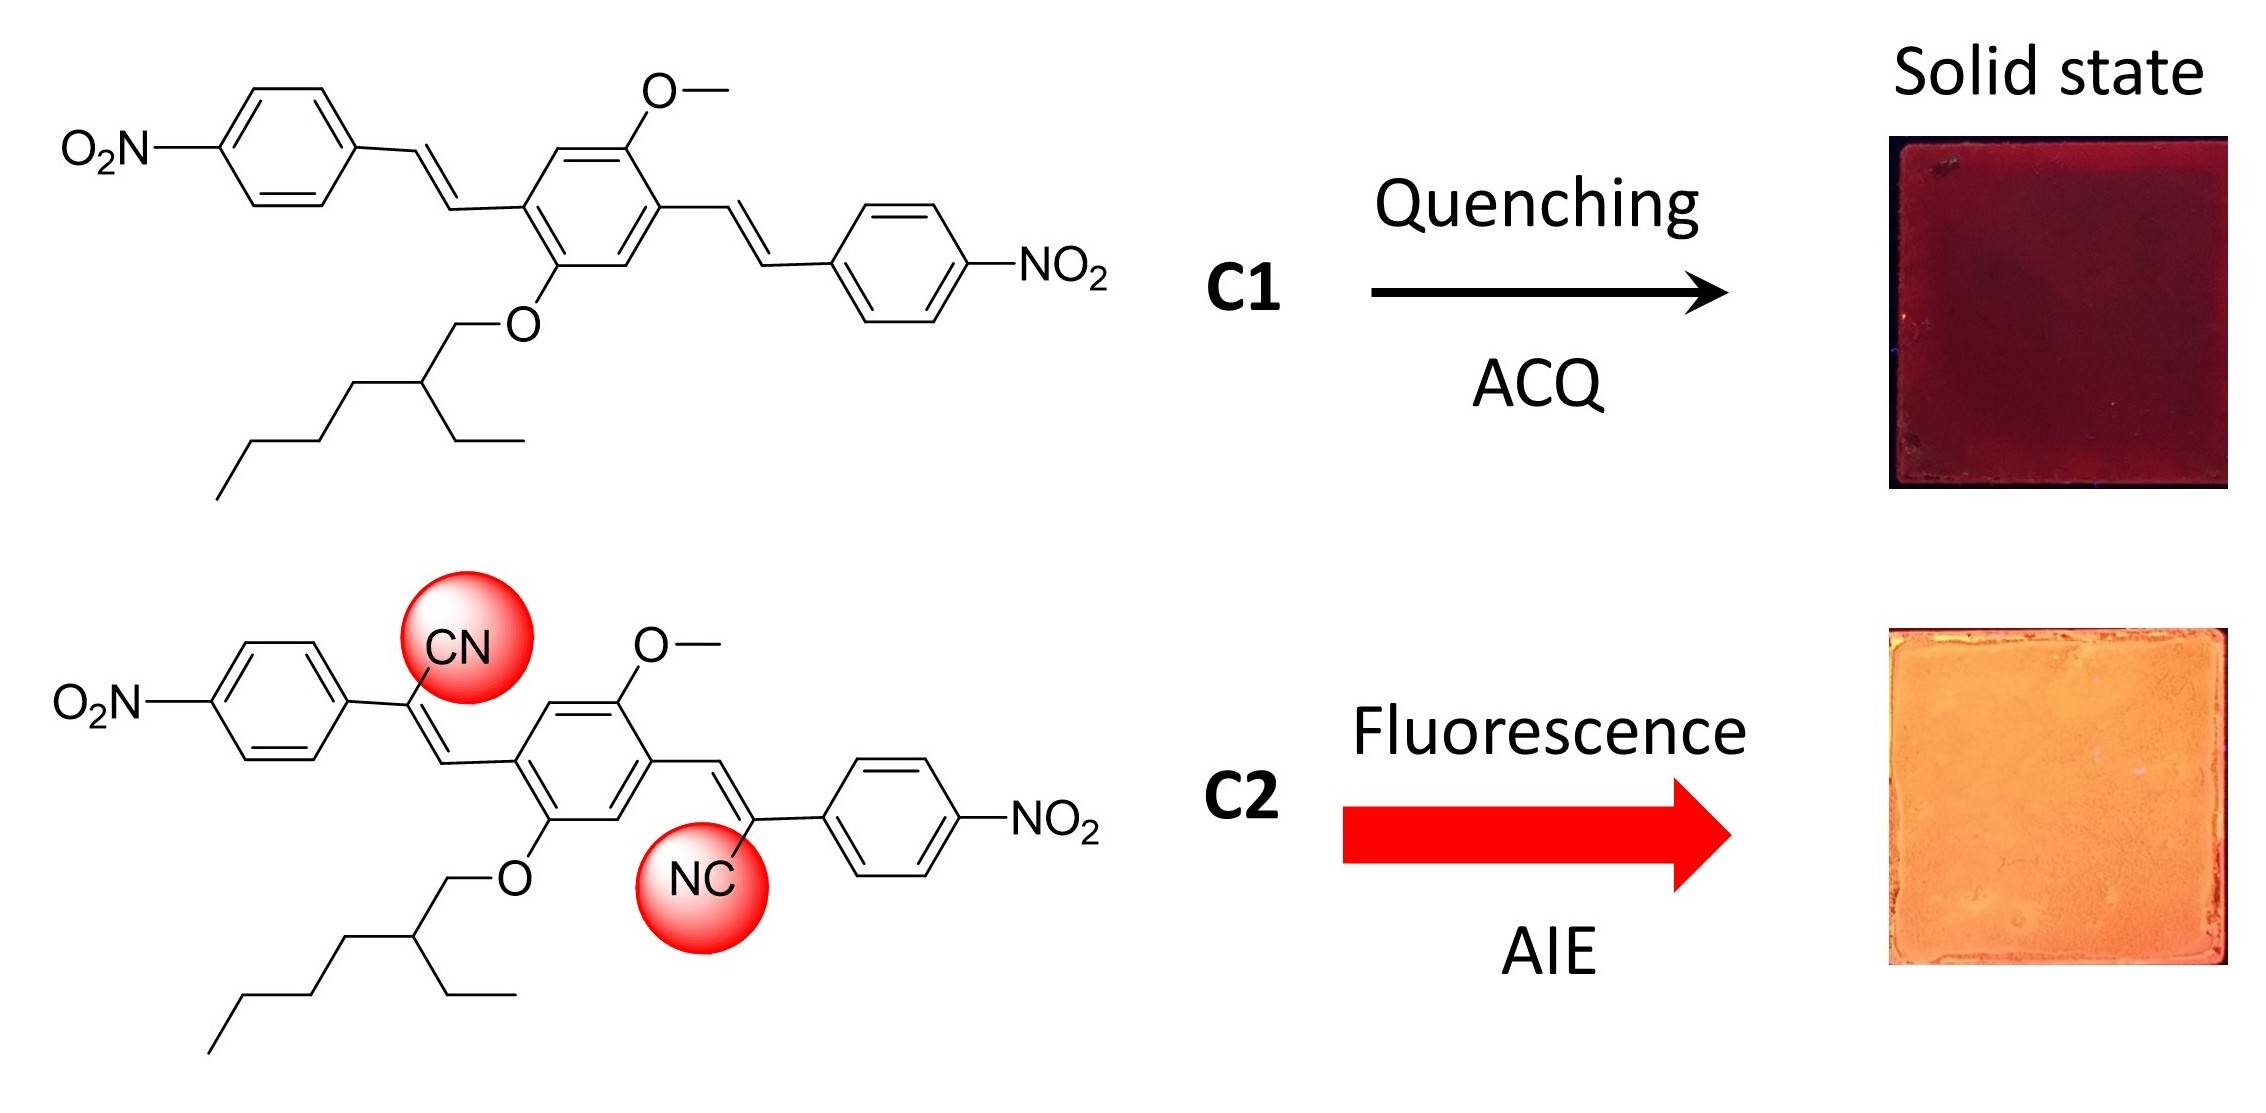
2.1. Photophysical Properties of the Fluorophores
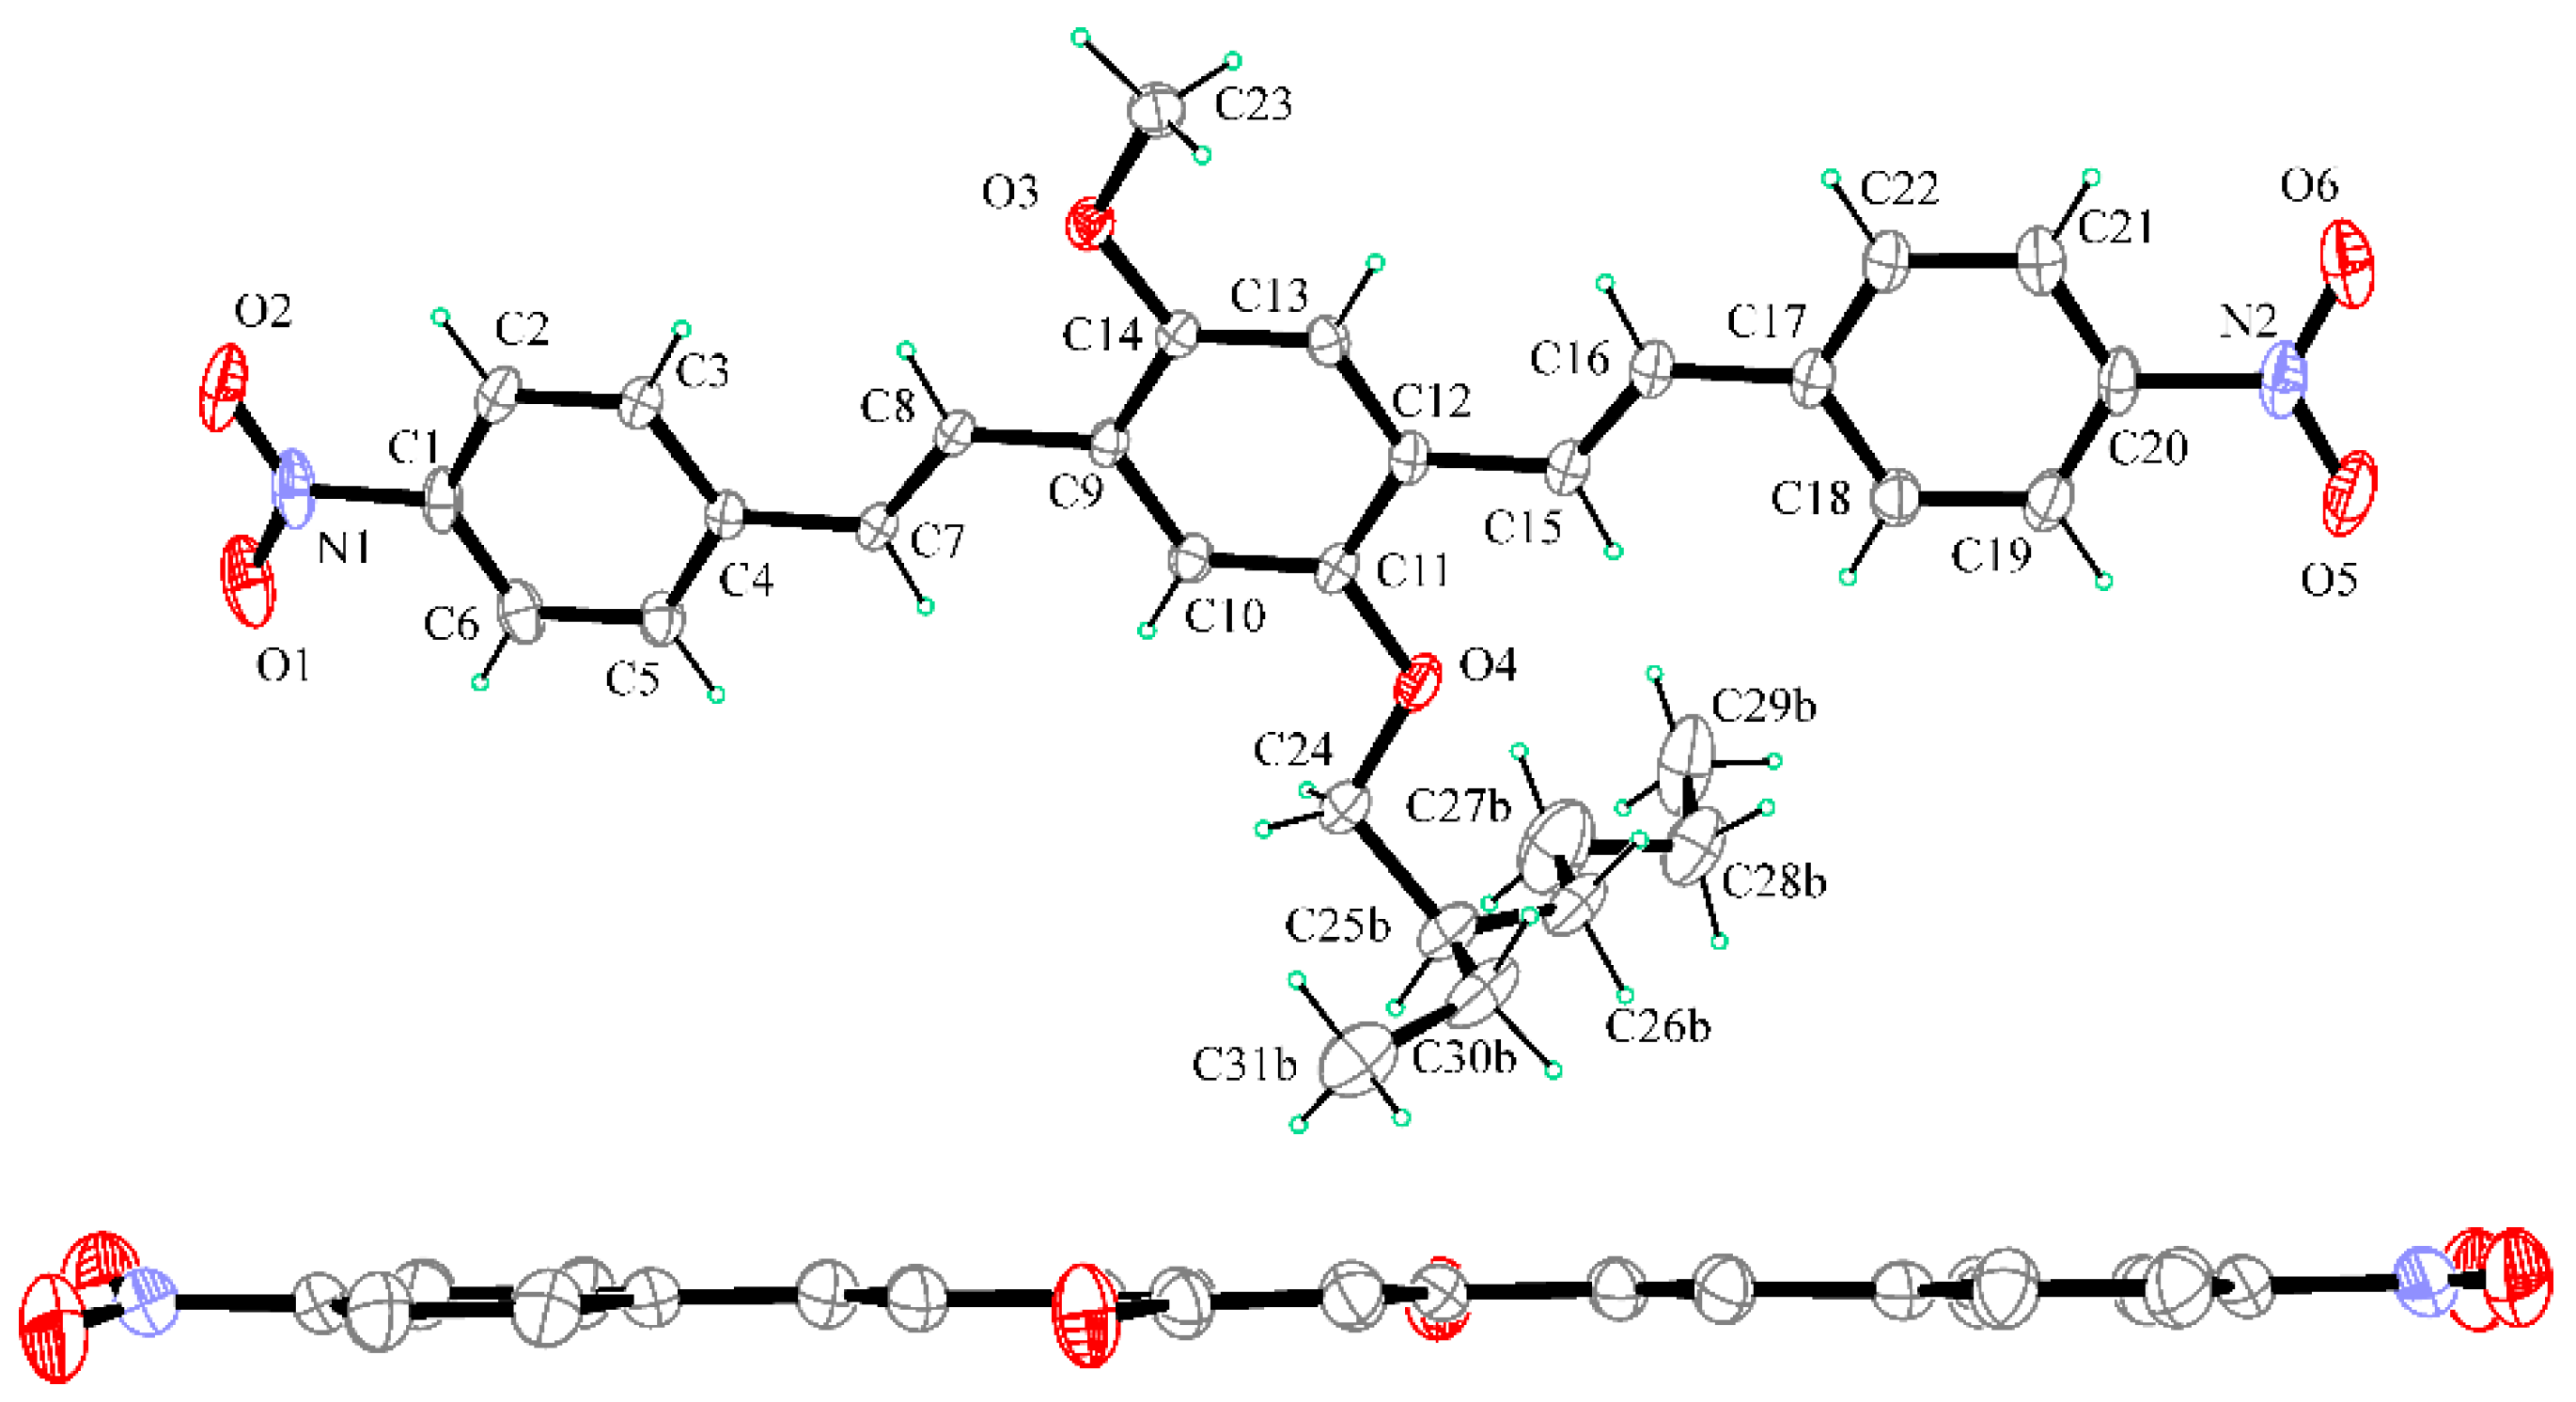
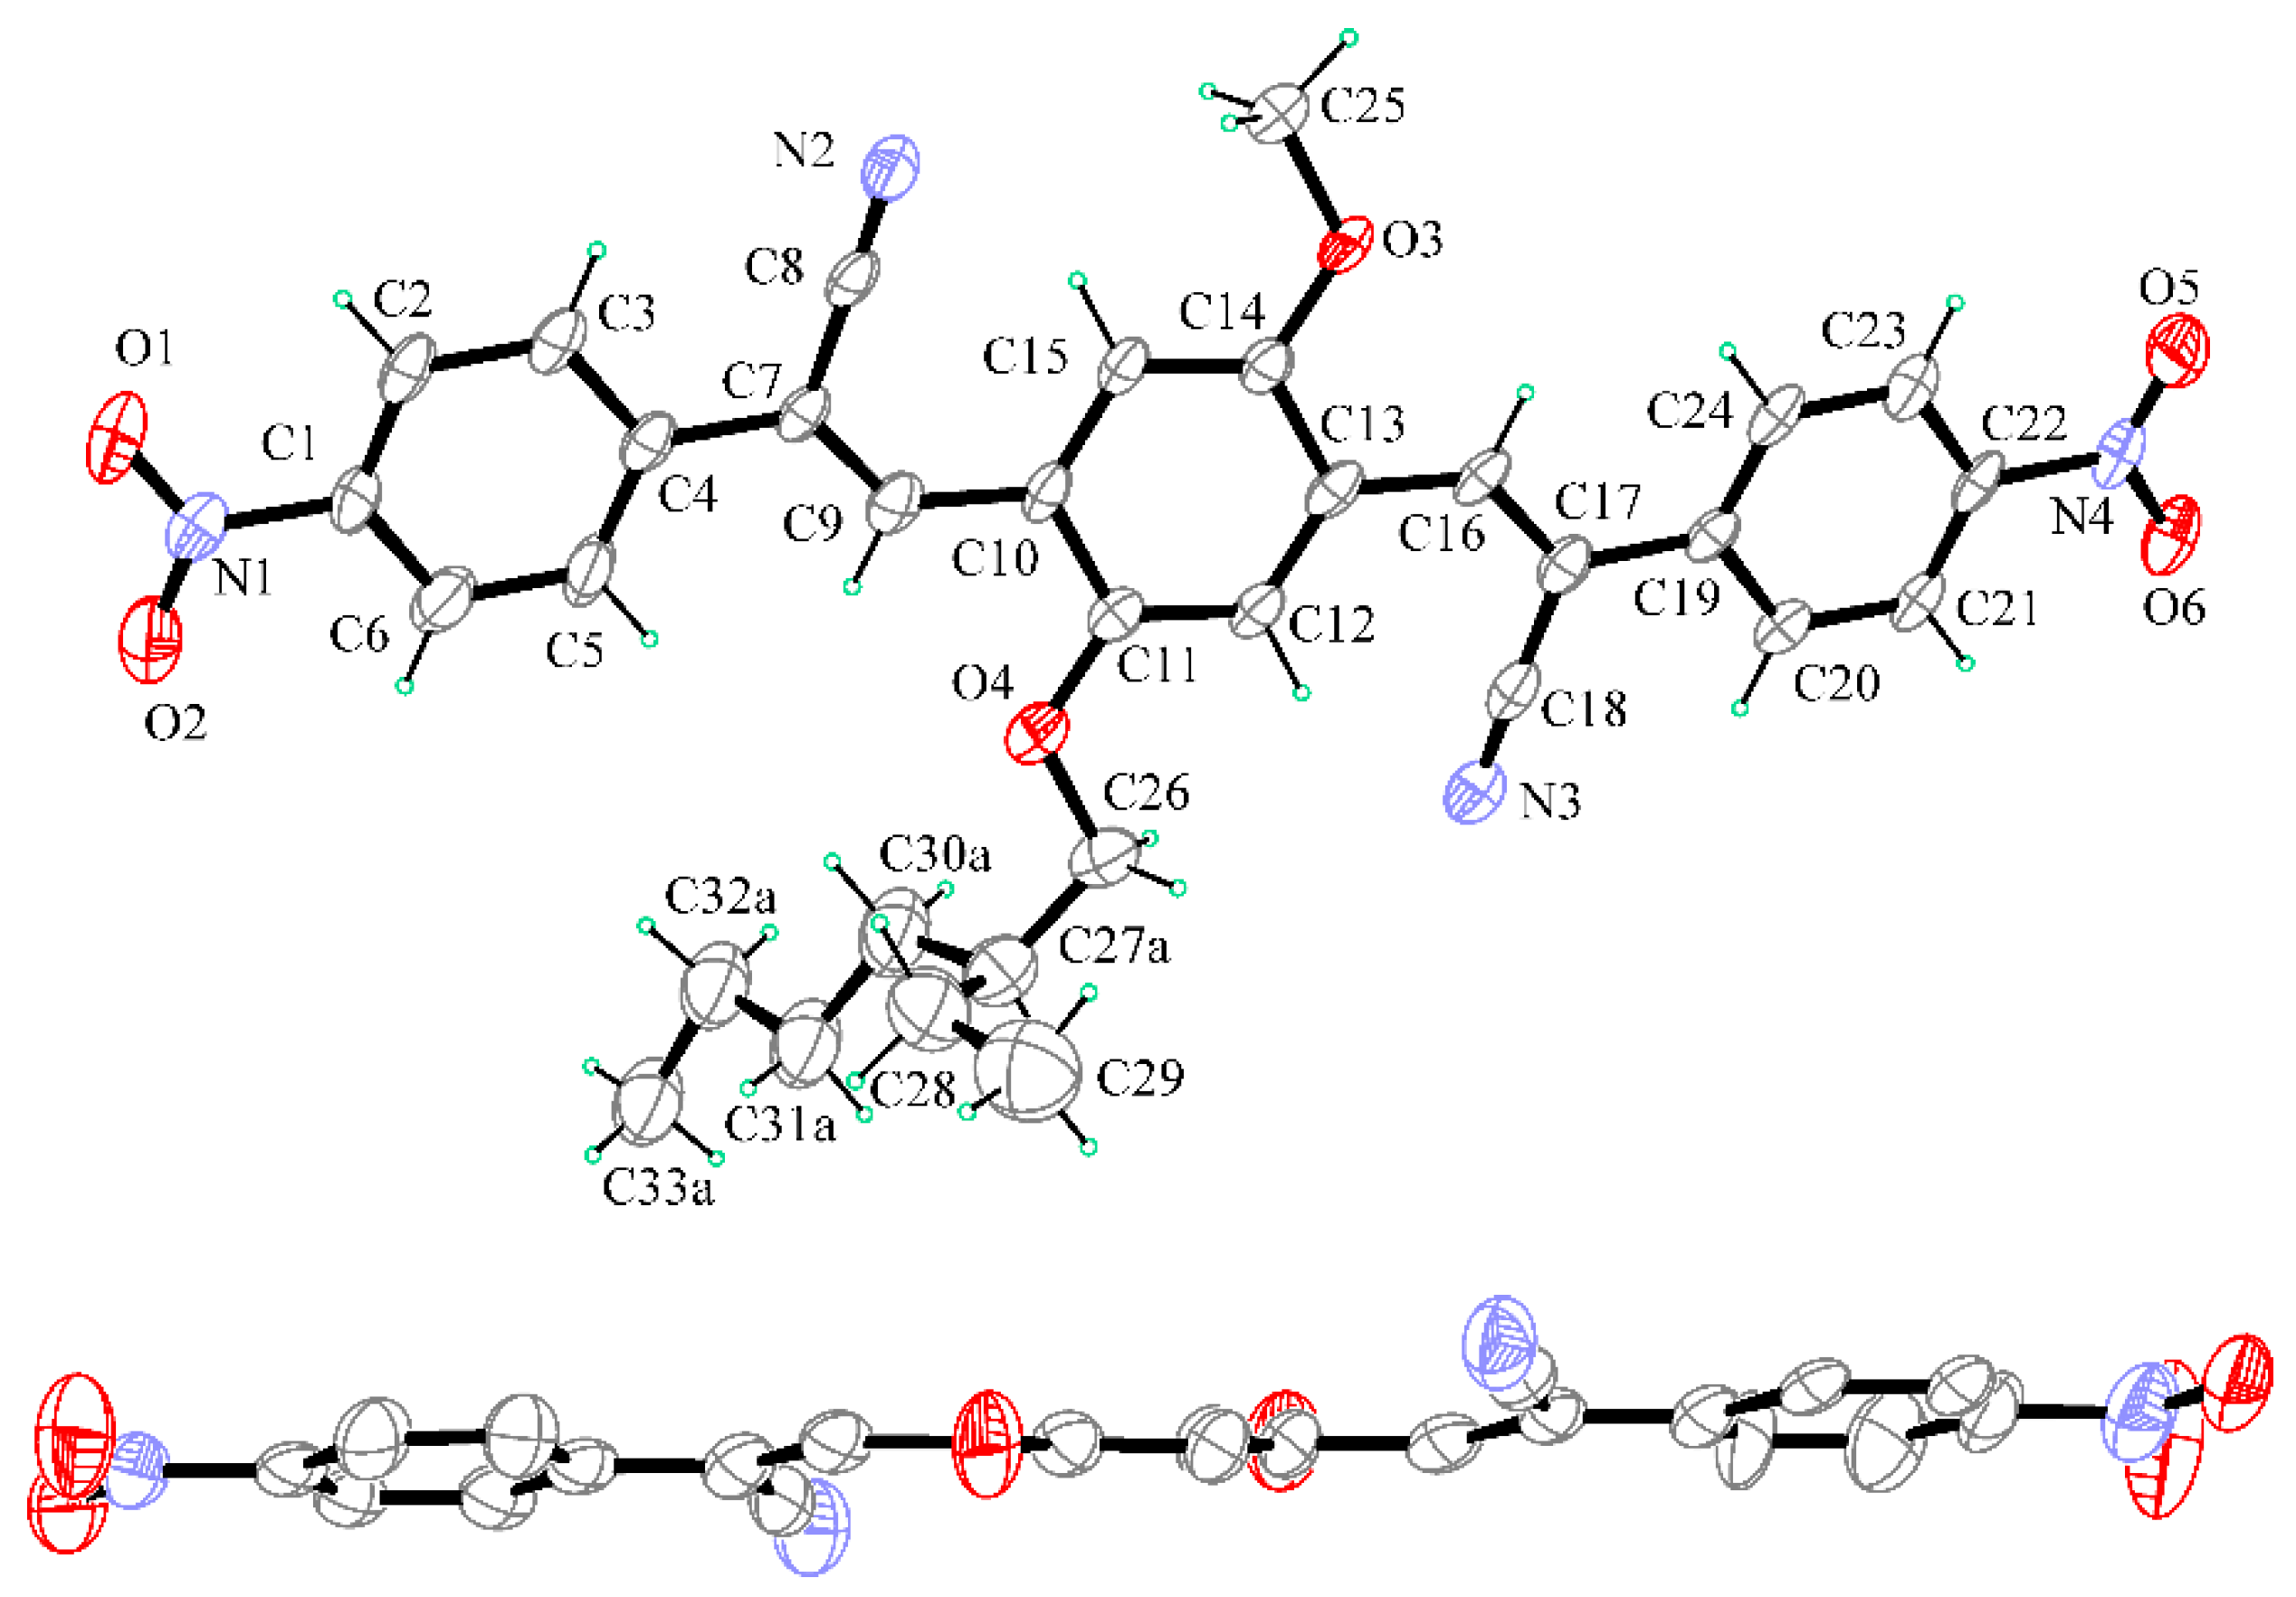
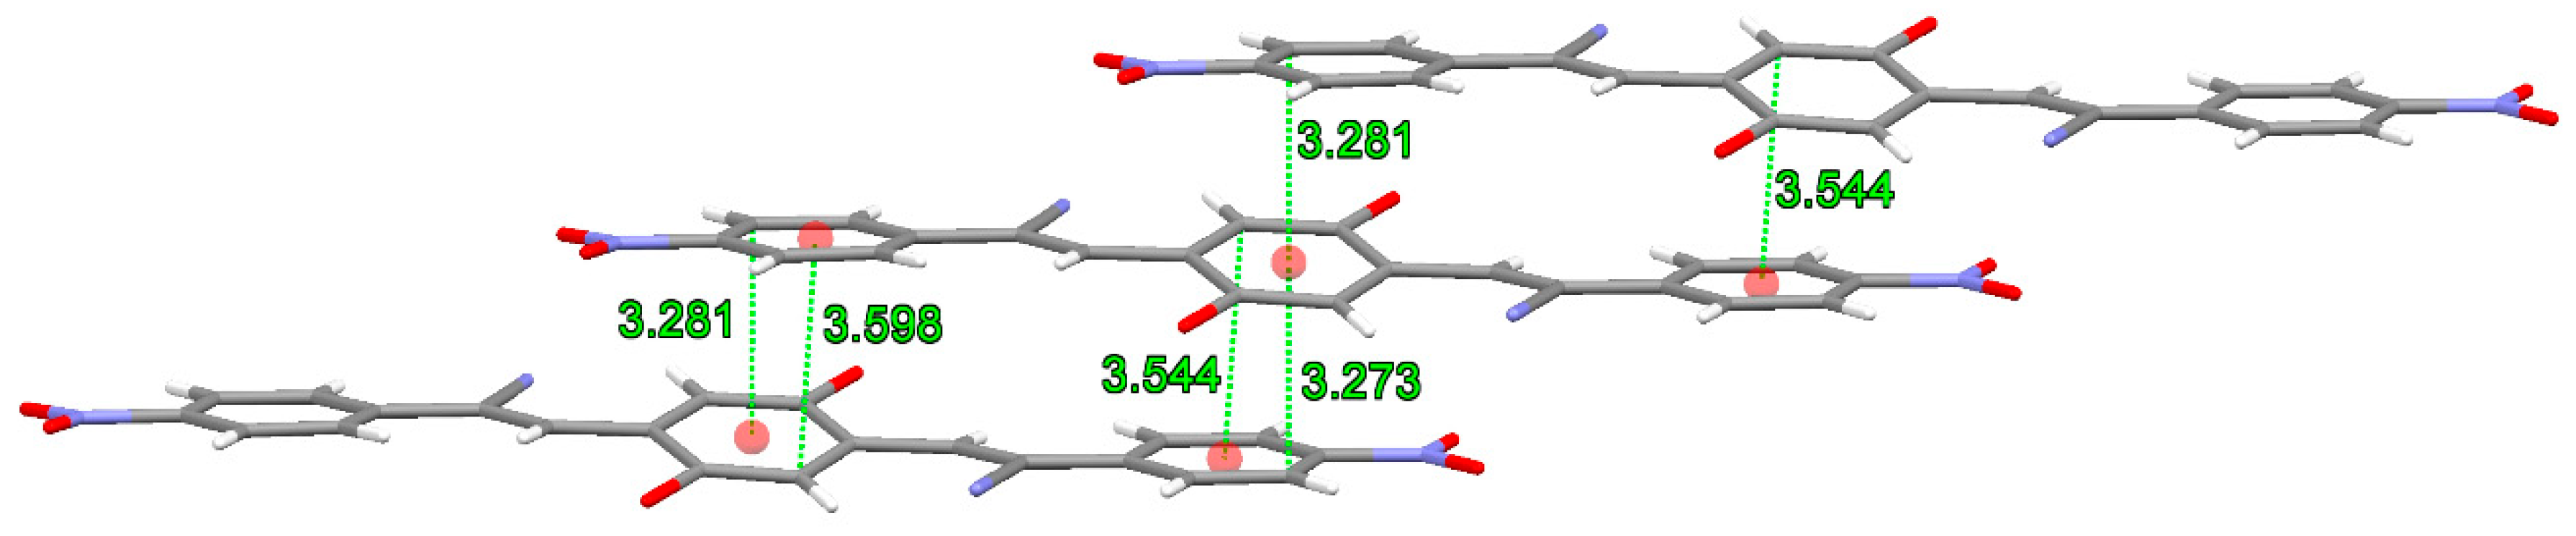
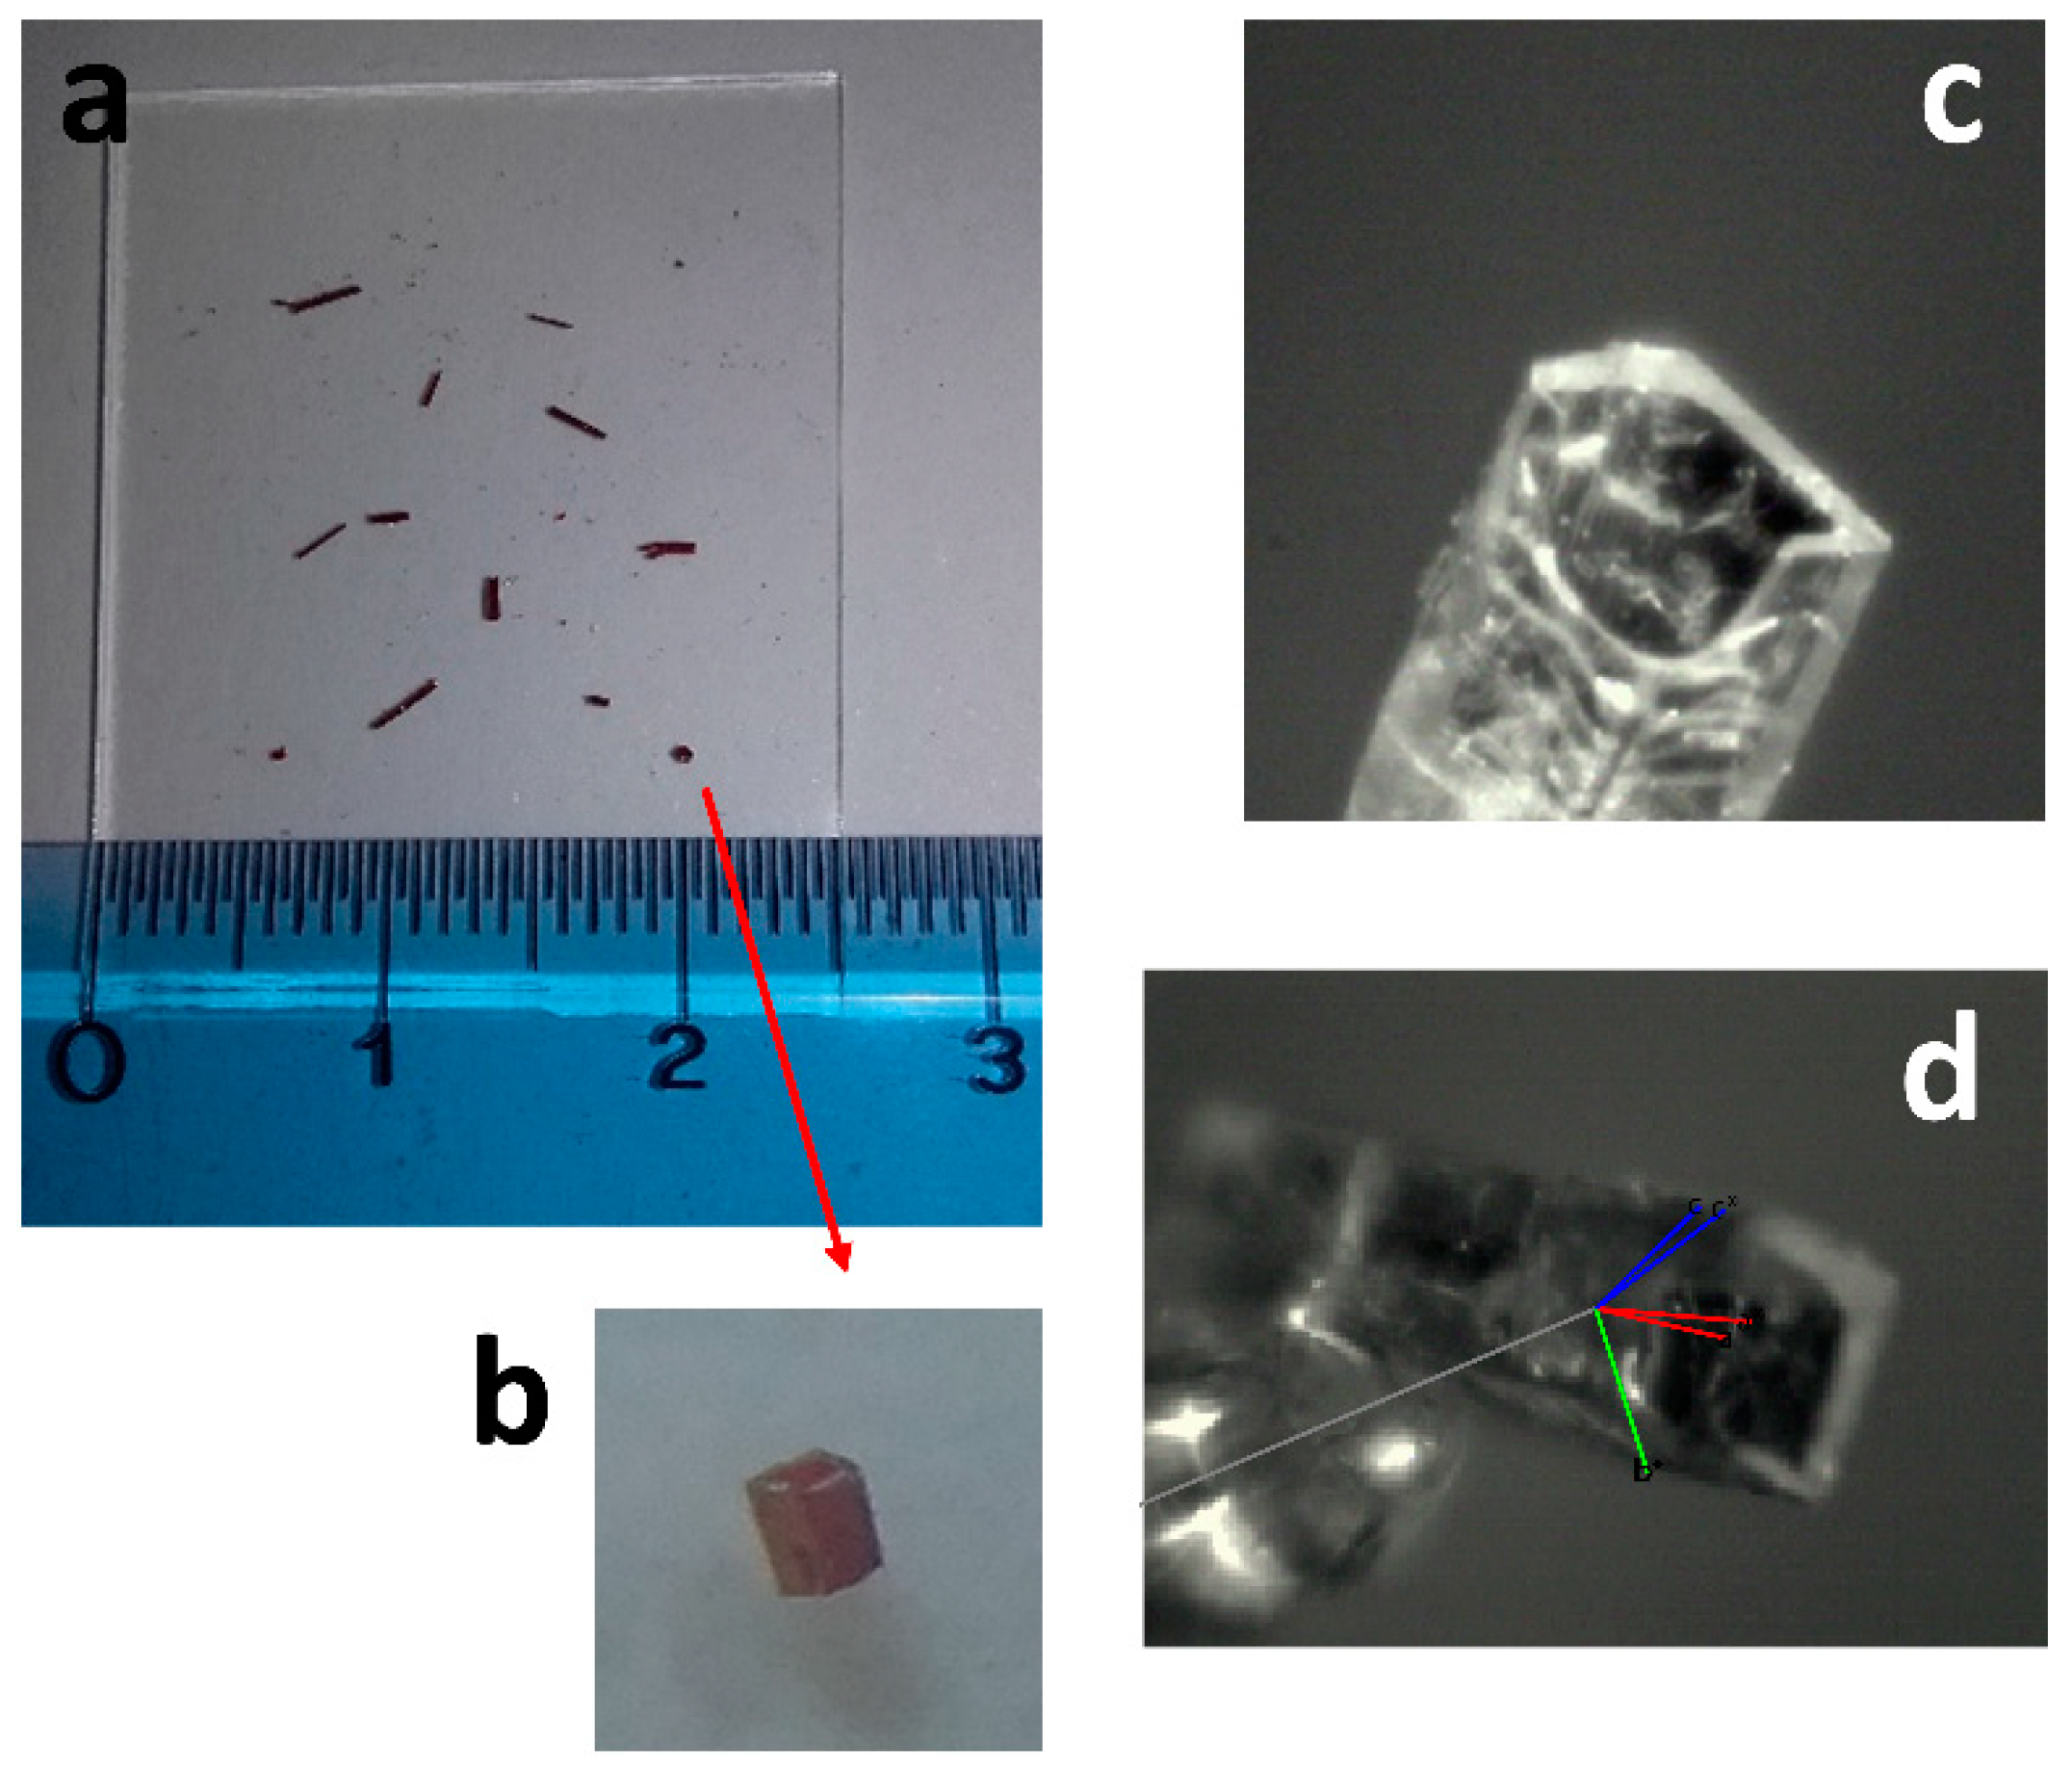
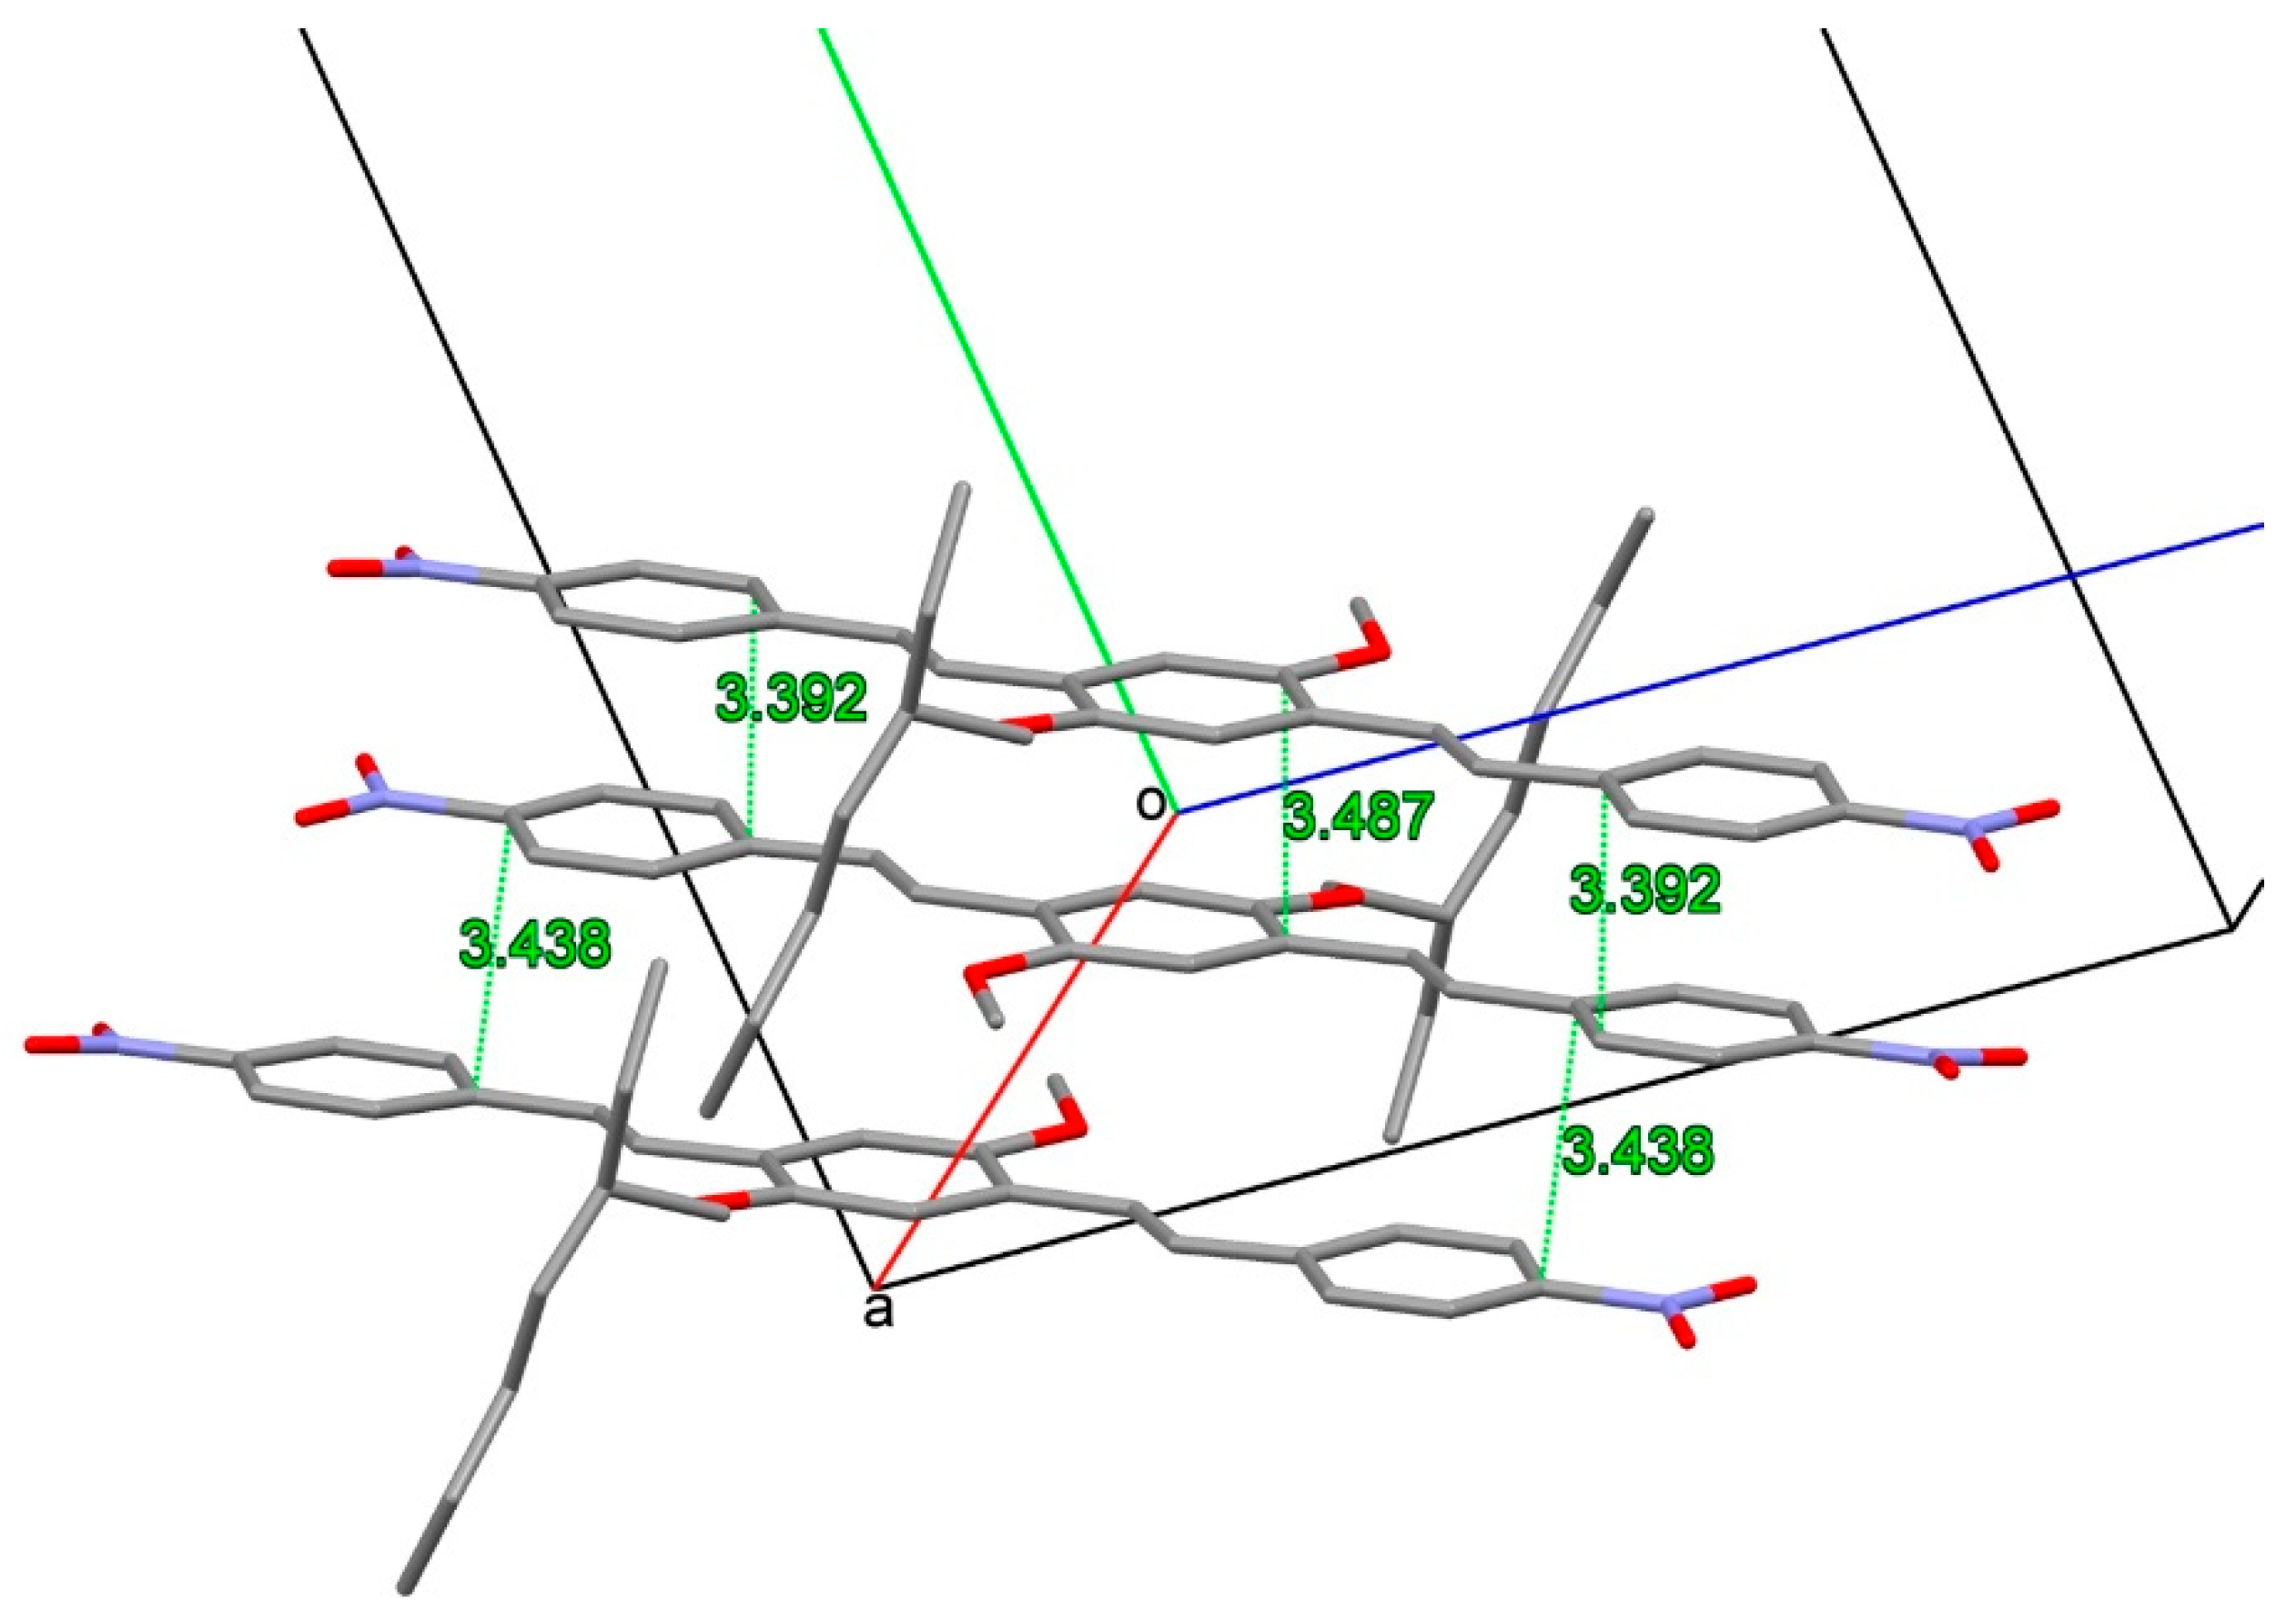
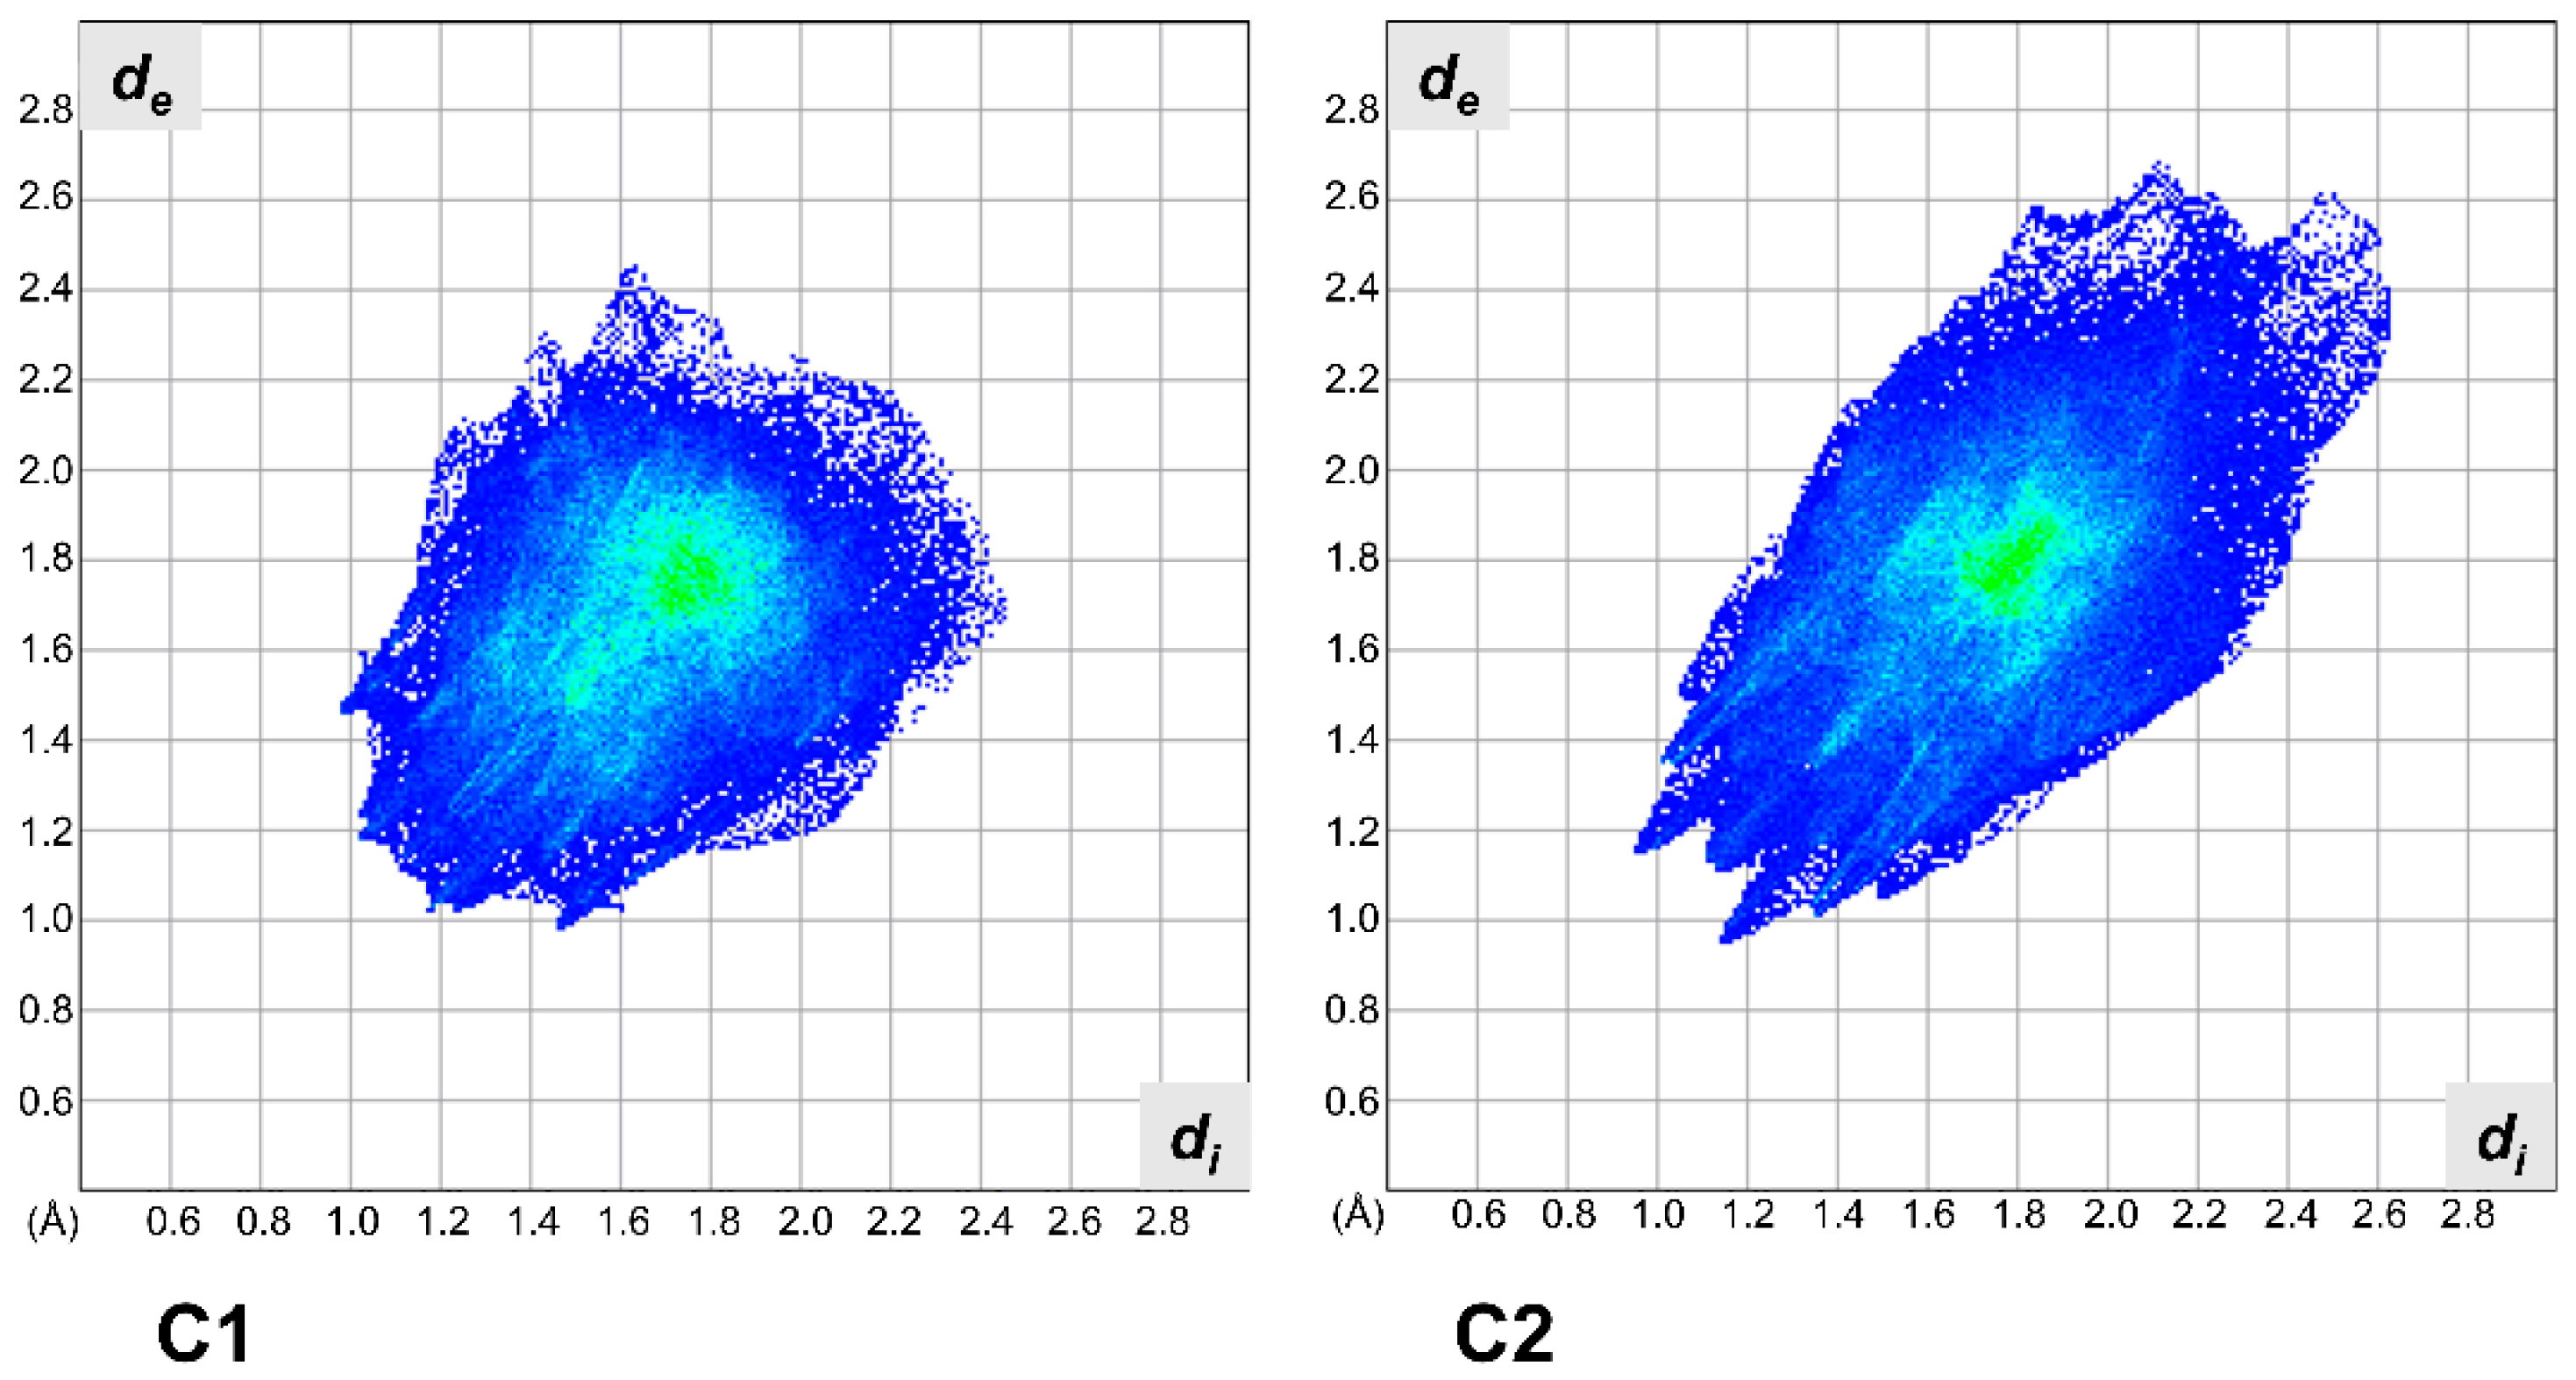
2.2. X-ray Crystallography
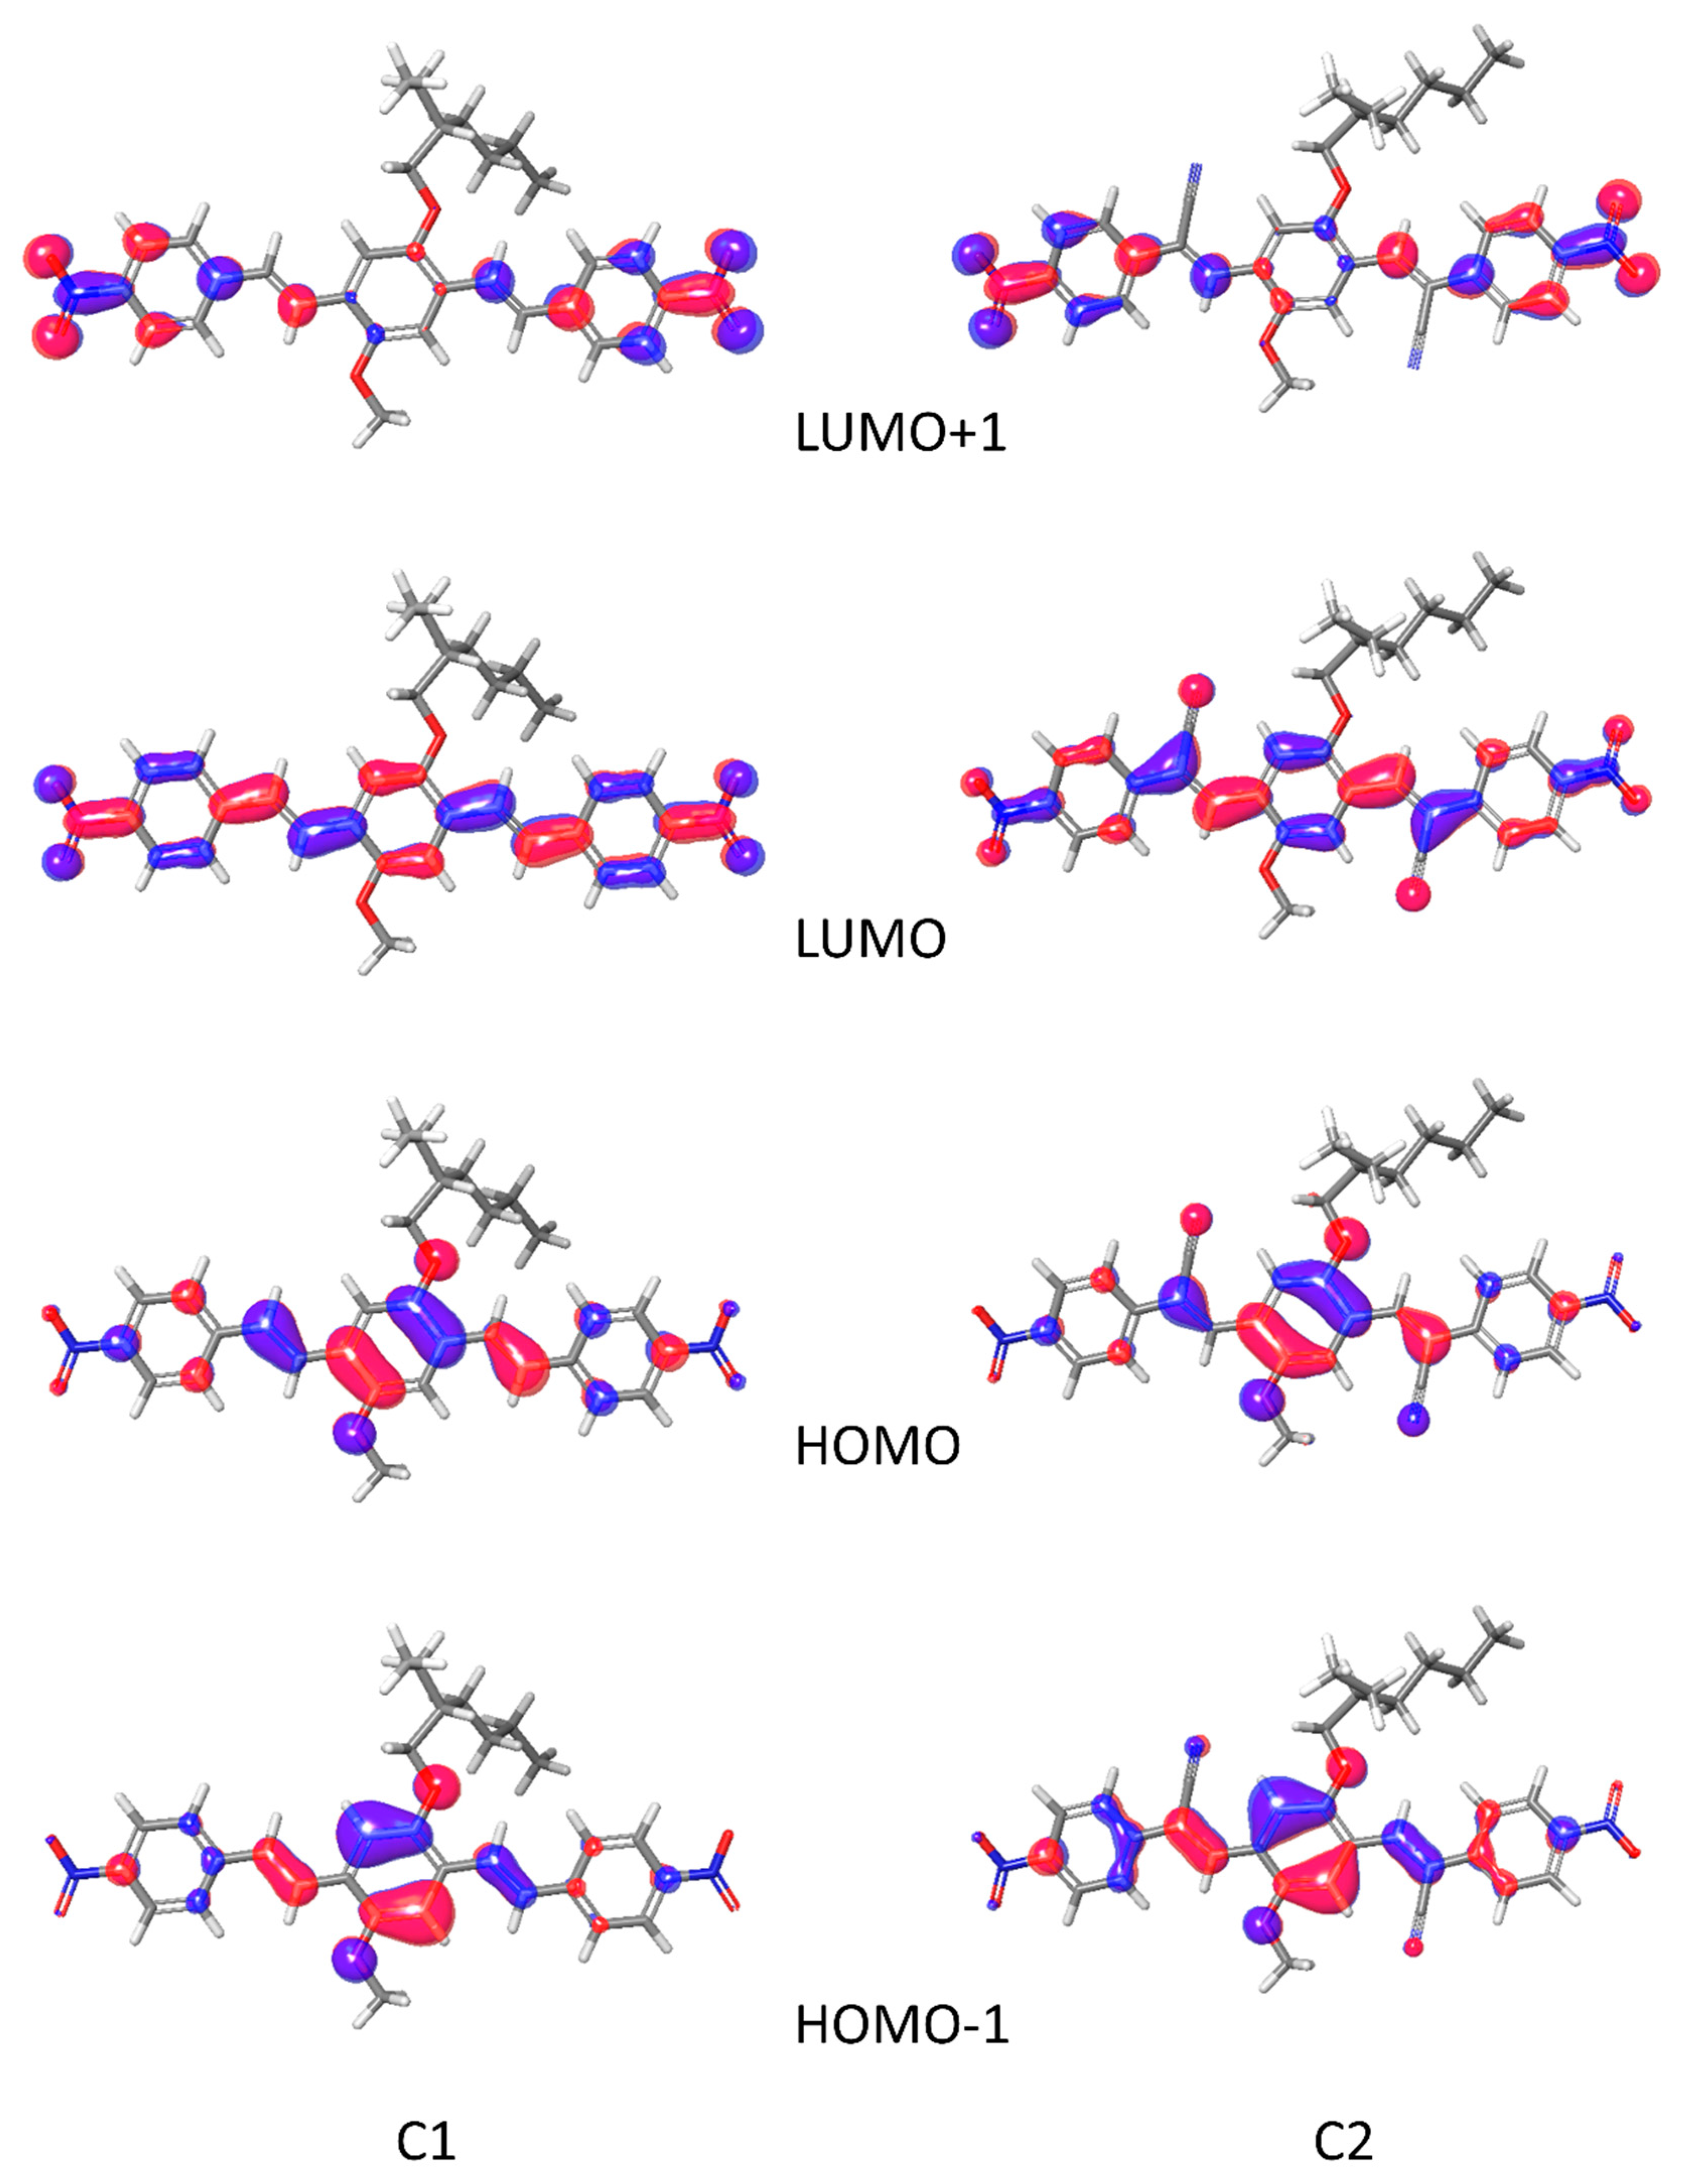
2.3. Computational Studies
3. Materials and Methods
3.1. PLQY Measurements
3.2. X-ray Crystallography
3.3. Computational Studies
4. Conclusions
Supplementary Materials
Author Contributions
Funding
Conflicts of Interest
References
- Bruno, A.; Villani, F.; Grimaldi, I.; Loffredo, F.; Morvillo, P.; Diana, R.; Haque, S.; Minarini, C. Morphological and spectroscopic characterizations of inkjet-printed poly(3-hexylthiophene-2,5-diyl): Phenyl-C61-butyric acid methyl ester blends for organic solar cell applications. Thin Solid Films 2014, 560, 14–19. [Google Scholar] [CrossRef]
- Ghaemy, M.; Alizadeh, R. Synthesis, characterization and photophysical properties of organosoluble and thermally stable polyamides containing pendent N-carbazole group. React. Funct. Polym. 2011, 71, 425–432. [Google Scholar] [CrossRef]
- Morvillo, P.; Ricciardi, R.; Nenna, G.; Bobeico, E.; Diana, R.; Minarini, C. Elucidating the origin of the improved current output in inverted polymer solar cells. Sol. Energy Mater. Sol. Cells 2016, 152, 51–58. [Google Scholar] [CrossRef]
- Rahman, D.M.; Hameed, M.F.O.; Obayya, S. Light harvesting improvement of polymer solar cell through nanohole photoactive layer. Opt. Quantum Electron. 2015, 47, 1443–1449. [Google Scholar] [CrossRef]
- Bruno, A.; Borriello, C.; Di Luccio, T.; Nenna, G.; Sessa, L.; Concilio, S.; Haque, S.A.; Minarini, C. White light-emitting nanocomposites based on an oxadiazole–carbazole copolymer (POC) and Inp/Zns quantum dots. J. Nanopart. Res. 2013, 15. [Google Scholar] [CrossRef]
- Diana, R.; Caruso, U.; Concilio, S.; Piotto, S.; Tuzi, A.; Panunzi, B. A real-time tripodal colorimetric/fluorescence sensor for multiple target metal ions. Dyes Pigm. 2018, 155, 249–257. [Google Scholar] [CrossRef]
- Hwang, S.M.; Kim, C. Fluorescent detection of Zn2+ and Cu2+ by a phenanthrene-based multifunctional chemosensor that acts as a basic pH indicator. Inorg. Chim. Acta 2018, 482, 375–383. [Google Scholar] [CrossRef]
- Zhao, M.; Xiong, L.; Li, S.; Chang, J.; Ning, H.; Qi, C. One-dimensional channels encapsulated in supramolecular networks constructed of Zinc (II), Manganese (II), or Nickel (II) atoms with 3-(carboxymethyl)-2,7-dimethyl-3H-benzo [d] imidazole-5-carboxylic acid. Zeitschrift für Anorganische und Allgemeine Chemie 2014, 640, 159–167. [Google Scholar] [CrossRef]
- Argeri, M.; Borbone, F.; Caruso, U.; Causà, M.; Fusco, S.; Panunzi, B.; Roviello, A.; Shikler, R.; Tuzi, A. Color tuning and noteworthy photoluminescence quantum yields in crystalline mono-/dinuclear ZnII complexes. Eur. J. Inorg. Chem. 2014, 2014, 5916–5924. [Google Scholar] [CrossRef]
- Borbone, F.; Caruso, U.; Concilio, S.; Nabha, S.; Panunzi, B.; Piotto, S.; Shikler, R.; Tuzi, A. Mono-, di-, and polymeric pyridinoylhydrazone ZnII complexes: Structure and photoluminescent properties. Eur. J. Inorg. Chem. 2016, 2016, 818–825. [Google Scholar] [CrossRef]
- Borbone, F.; Caruso, U.; Palma, S.D.; Fusco, S.; Nabha, S.; Panunzi, B.; Shikler, R. High solid state photoluminescence quantum yields and effective color tuning in polyvinylpyridine based Zinc(II) metallopolymers. Macromol. Chem. Phys. 2015, 216, 1516–1522. [Google Scholar] [CrossRef]
- Kido, J.; Kimura, M.; Nagai, K. Multilayer white light-emitting organic electroluminescent device. Science 1995, 267, 1332–1334. [Google Scholar] [CrossRef] [PubMed]
- Lin, X.; Chen, B.; Zhang, X.; Lee, C.; Kwong, H.; Lee, S. A novel yellow fluorescent dopant for high-performance organic electroluminescent devices. Chem. Mater. 2001, 13, 456–458. [Google Scholar] [CrossRef]
- Ràfols-Ribé, J.; Will, P.-A.; Hänisch, C.; Gonzalez-Silveira, M.; Lenk, S.; Rodríguez-Viejo, J.; Reineke, S. High-performance organic light-emitting diodes comprising ultrastable glass layers. Sci. Adv. 2018, 4, eaar8332. [Google Scholar] [CrossRef] [PubMed] [Green Version]
- Borbone, F.; Caruso, U.; Concilio, S.; Nabha, S.; Piotto, S.; Shikler, R.; Tuzi, A.; Panunzi, B. From cadmium (II)-aroylhydrazone complexes to metallopolymers with enhanced photoluminescence. A structural and DFT study. Inorg. Chim. Acta 2017, 458, 129–137. [Google Scholar] [CrossRef]
- Wang, Y.J.; Shi, Y.; Wang, Z.; Zhu, Z.; Zhao, X.; Nie, H.; Qian, J.; Qin, A.; Sun, J.Z.; Tang, B.Z. A red to near-IR fluorogen: Aggregation-induced emission, large stokes shift, high solid efficiency and application in cell-imaging. Chem. Eur. J. 2016, 22, 9784–9791. [Google Scholar] [CrossRef] [PubMed]
- Luo, J.; Xie, Z.; Lam, J.W.; Cheng, L.; Chen, H.; Qiu, C.; Kwok, H.S.; Zhan, X.; Liu, Y.; Zhu, D.; et al. Aggregation-induced emission of 1-methyl-1,2,3,4,5-pentaphenylsilole. Chem. Com. 2001, 18, 1740–1741. [Google Scholar] [CrossRef]
- Virgili, T.; Forni, A.; Cariati, E.; Pasini, D.; Botta, C. Direct evidence of torsional motion in an aggregation-induced emissive chromophore. J. Phys. Chem. 2013, 117, 27161–27166. [Google Scholar] [CrossRef]
- Wen, W.; Shi, Z.-F.; Cao, X.-P.; Xu, N.-S. Triphenylethylene-based fluorophores: Facile preparation and full-color emission in both solution and solid states. Dyes Pigm. 2016, 132, 282–290. [Google Scholar] [CrossRef]
- Kachwal, V.; Alam, P.; Yadav, H.R.; Pasha, S.S.; Choudhury, A.R.; Laskar, I.R. Simple ratiometric push–pull with an ‘aggregation induced enhanced emission’ active pyrene derivative: A multifunctional and highly sensitive fluorescent sensor. New J. Chem. 2018, 42, 1133–1140. [Google Scholar] [CrossRef]
- Yang, W.; Liu, C.; Gao, Q.; Du, J.; Shen, P.; Liu, Y.; Yang, C. A morphology and size-dependent ON-OFF switchable NIR-emitting naphthothiazolium cyanine dye: AIE-active CIEE effect. Opt. Mater. 2017, 66, 623–629. [Google Scholar] [CrossRef]
- Panunzi, B.; Diana, R.; Concilio, S.; Sessa, L.; Shikler, R.; Nabha, S.; Tuzi, A.; Caruso, U.; Piotto, S. Solid-state highly efficient DR mono and poly-dicyano-phenylenevinylene fluorophores. Molecules 2018, 23, 1505. [Google Scholar] [CrossRef] [PubMed]
- Kim, M.; Whang, D.R.; Gierschner, J.; Park, S.Y. A distyrylbenzene based highly efficient deep red/near-infrared emitting organic solid. J. Mater. Chem. C 2015, 3, 231–234. [Google Scholar] [CrossRef]
- Yan, H.; Meng, X.; Li, B.; Ge, S.; Lu, Y. Design, synthesis, photophysical properties and pH-sensing application of pyrimidine-phthalimide derivatives. J. Mater. Chem. C 2017, 5, 10589–10599. [Google Scholar] [CrossRef]
- Roviello, A.; Borbone, F.; Carella, A.; Diana, R.; Roviello, G.; Panunzi, B.; Ambrosio, A.; Maddalena, P. High quantum yield photoluminescence of new polyamides containing oligo-PPV amino derivatives and related oligomers. J. Polym. Sci. Part A Polym. Chem. 2009, 47, 2677–2689. [Google Scholar] [CrossRef]
- Lippert, E.; Lüder, W.; Boos, H. Advances in Molecular Spectroscopy; Mangini, A., Ed.; Pergamon Press: Oxford, UK, 1962; p. 443. [Google Scholar]
- Vincett, P.; Voigt, E.; Rieckhoff, K. Phosphorescence and fluorescence of phthalocyanines. J. Chem. Phys. 1971, 55, 4131–4140. [Google Scholar] [CrossRef]
- Concilio, S.; Ferrentino, I.; Sessa, L.; Massa, A.; Iannelli, P.; Diana, R.; Panunzi, B.; Rella, A.; Piotto, S. A novel fluorescent solvatochromic probe for lipid bilayers. Supramol. Chem. 2017, 29, 887–895. [Google Scholar] [CrossRef]
- Sonawane, S.L.; Asha, S.K. Fluorescent cross-linked polystyrene perylenebisimide/oligo(P-phenylenevinylene) microbeads with controlled particle size, tunable colors, and high solid state emission. ACS Appl. Mater. Interfaces 2013, 5, 12205–12214. [Google Scholar] [CrossRef] [PubMed]
- Li, C.; Duan, R.; Liang, B.; Han, G.; Wang, S.; Ye, K.; Liu, Y.; Yi, Y.; Wang, Y. Deep-red to near-infrared thermally activated delayed fluorescence in organic solid films and electroluminescent devices. Angew. Chem. Int. Ed. 2017, 56, 11525–11529. [Google Scholar] [CrossRef] [PubMed]
- Xu, F.; Yuan, M.-S.; Wang, W.; Du, X.; Wang, H.; Li, N.; Yu, R.; Du, Z.; Wang, J. Symmetric and unsymmetric thienyl-substituted fluorenone dyes: Static excimer-induced emission enhancement. RSC Adv. 2016, 6, 76401–76408. [Google Scholar] [CrossRef]
- Ma, X.; Sun, R.; Cheng, J.; Liu, J.; Gou, F.; Xiang, H.; Zhou, X. Fluorescence aggregation-caused quenching versus aggregation-induced emission: A visual teaching technology for undergraduate chemistry students. J. Chem. Educ. 2016, 93, 345–350. [Google Scholar] [CrossRef]
- Xu, Y.; Zhang, H.; Li, F.; Shen, F.; Wang, H.; Li, X.; Yu, Y.; Ma, Y. Supramolecular interaction-induced self-assembly of organic molecules into ultra-long tubular crystals with wave guiding and amplified spontaneous emission. J. Mater. Chem. 2012, 22, 1592–1597. [Google Scholar] [CrossRef]
- Borbone, F.; Carella, A.; Caruso, U.; Roviello, G.; Tuzi, A.; Dardano, P.; Lettieri, S.; Maddalena, P.; Barsella, A. Large second-order NLO activity in poly (4-vinylpyridine) grafted with PdII and CuII chromophoric complexes with tridentate bent ligands containing heterocycles. Eur. J. Inorg. Chem. 2008, 2008, 1846–1853. [Google Scholar] [CrossRef]
- Panunzi, B.; Borbone, F.; Capobianco, A.; Concilio, S.; Diana, R.; Peluso, A.; Piotto, S.; Tuzi, A.; Velardo, A.; Caruso, U. Synthesis, spectroscopic properties and DFT calculations of a novel multipolar azo dye and its Zinc (II) complex. Inorg. Chem. Commun. 2017, 84, 103–108. [Google Scholar] [CrossRef]
- Spackman, M.A.; Jayatilaka, D. Hirshfeld surface analysis. Cryst. Eng. Comm. 2009, 11, 19–32. [Google Scholar] [CrossRef]
- De Mello, J.C.; Wittmann, H.F.; Friend, R.H. An improved experimental determination of external photoluminescence quantum efficiency. Adv. Mater. 1997, 9, 230–232. [Google Scholar] [CrossRef]
- SADABS, version 2.03; Bruker AXS Inc.: Madison, WI, USA, 2001.
- Altomare, A.; Burla, M.C.; Camalli, M.; Cascarano, G.L.; Giacovazzo, C.; Guagliardi, A.; Moliterni, A.G.; Polidori, G.; Spagna, R. SIR97: A new tool for crystal structure determination and refinement. J. Appl. Crystallogr. 1999, 32, 115–119. [Google Scholar] [CrossRef]
- Sheldrick, G.M. Crystal structure refinement with SHELXL. Acta Crystallogr. Sect. C Cryst. Struct. Chem. 2015, 71, 3–8. [Google Scholar] [CrossRef] [PubMed]
- Farrugia, L.J. Wingx and ORTEP for windows: An update. J. Appl. Crystallogr. 2012, 45, 849–854. [Google Scholar] [CrossRef]
- Farrugia, L.J. ORTEP-3 for windows-a version of ORTEP-III with a graphical user interface (GUI). J. Appl. Crystallogr. 1997, 30, 565. [Google Scholar] [CrossRef]
- Macrae, C.F.; Bruno, I.J.; Chisholm, J.A.; Edgington, P.R.; McCabe, P.; Pidcock, E.; Rodriguez-Monge, L.; Taylor, R.; Streek, J.V.; Wood, P.A. Mercury CSD 2.0–new features for the visualization and investigation of crystal structures. J. Appl. Crystallogr. 2008, 41, 466–470. [Google Scholar] [CrossRef]
- Bochevarov, A.D.; Harder, E.; Hughes, T.F.; Greenwood, J.R.; Braden, D.A.; Philipp, D.M.; Rinaldo, D.; Halls, M.D.; Zhang, J.; Friesner, R.A. Jaguar: A high-performance quantum chemistry software program with strengths in life and materials sciences. Int. J. Quantum Chem. 2013, 113, 2110–2142. [Google Scholar] [CrossRef] [Green Version]
- Materials Science Suite, version 2018-1; Schrödinger, LLC: New York, NY, USA, 2018.
Sample Availability: Samples of the compounds C1 and C2 are available from the authors. |


| Compound | λabs-sol (nm) a | λem-sol (nm) b | PLQY% c |
|---|---|---|---|
| C1 | 352; 437 i 357; 439 ii 361; 448 iii | 521 i 618; 708 ii 633; 712 iii | 33 i 15 ii ≤10 iii |
| C2 | 354; 444 i 353; 440 ii 358; 446 iii | 550 i 565 ii 578 iii | 19 i 15 ii ≤10 iii |
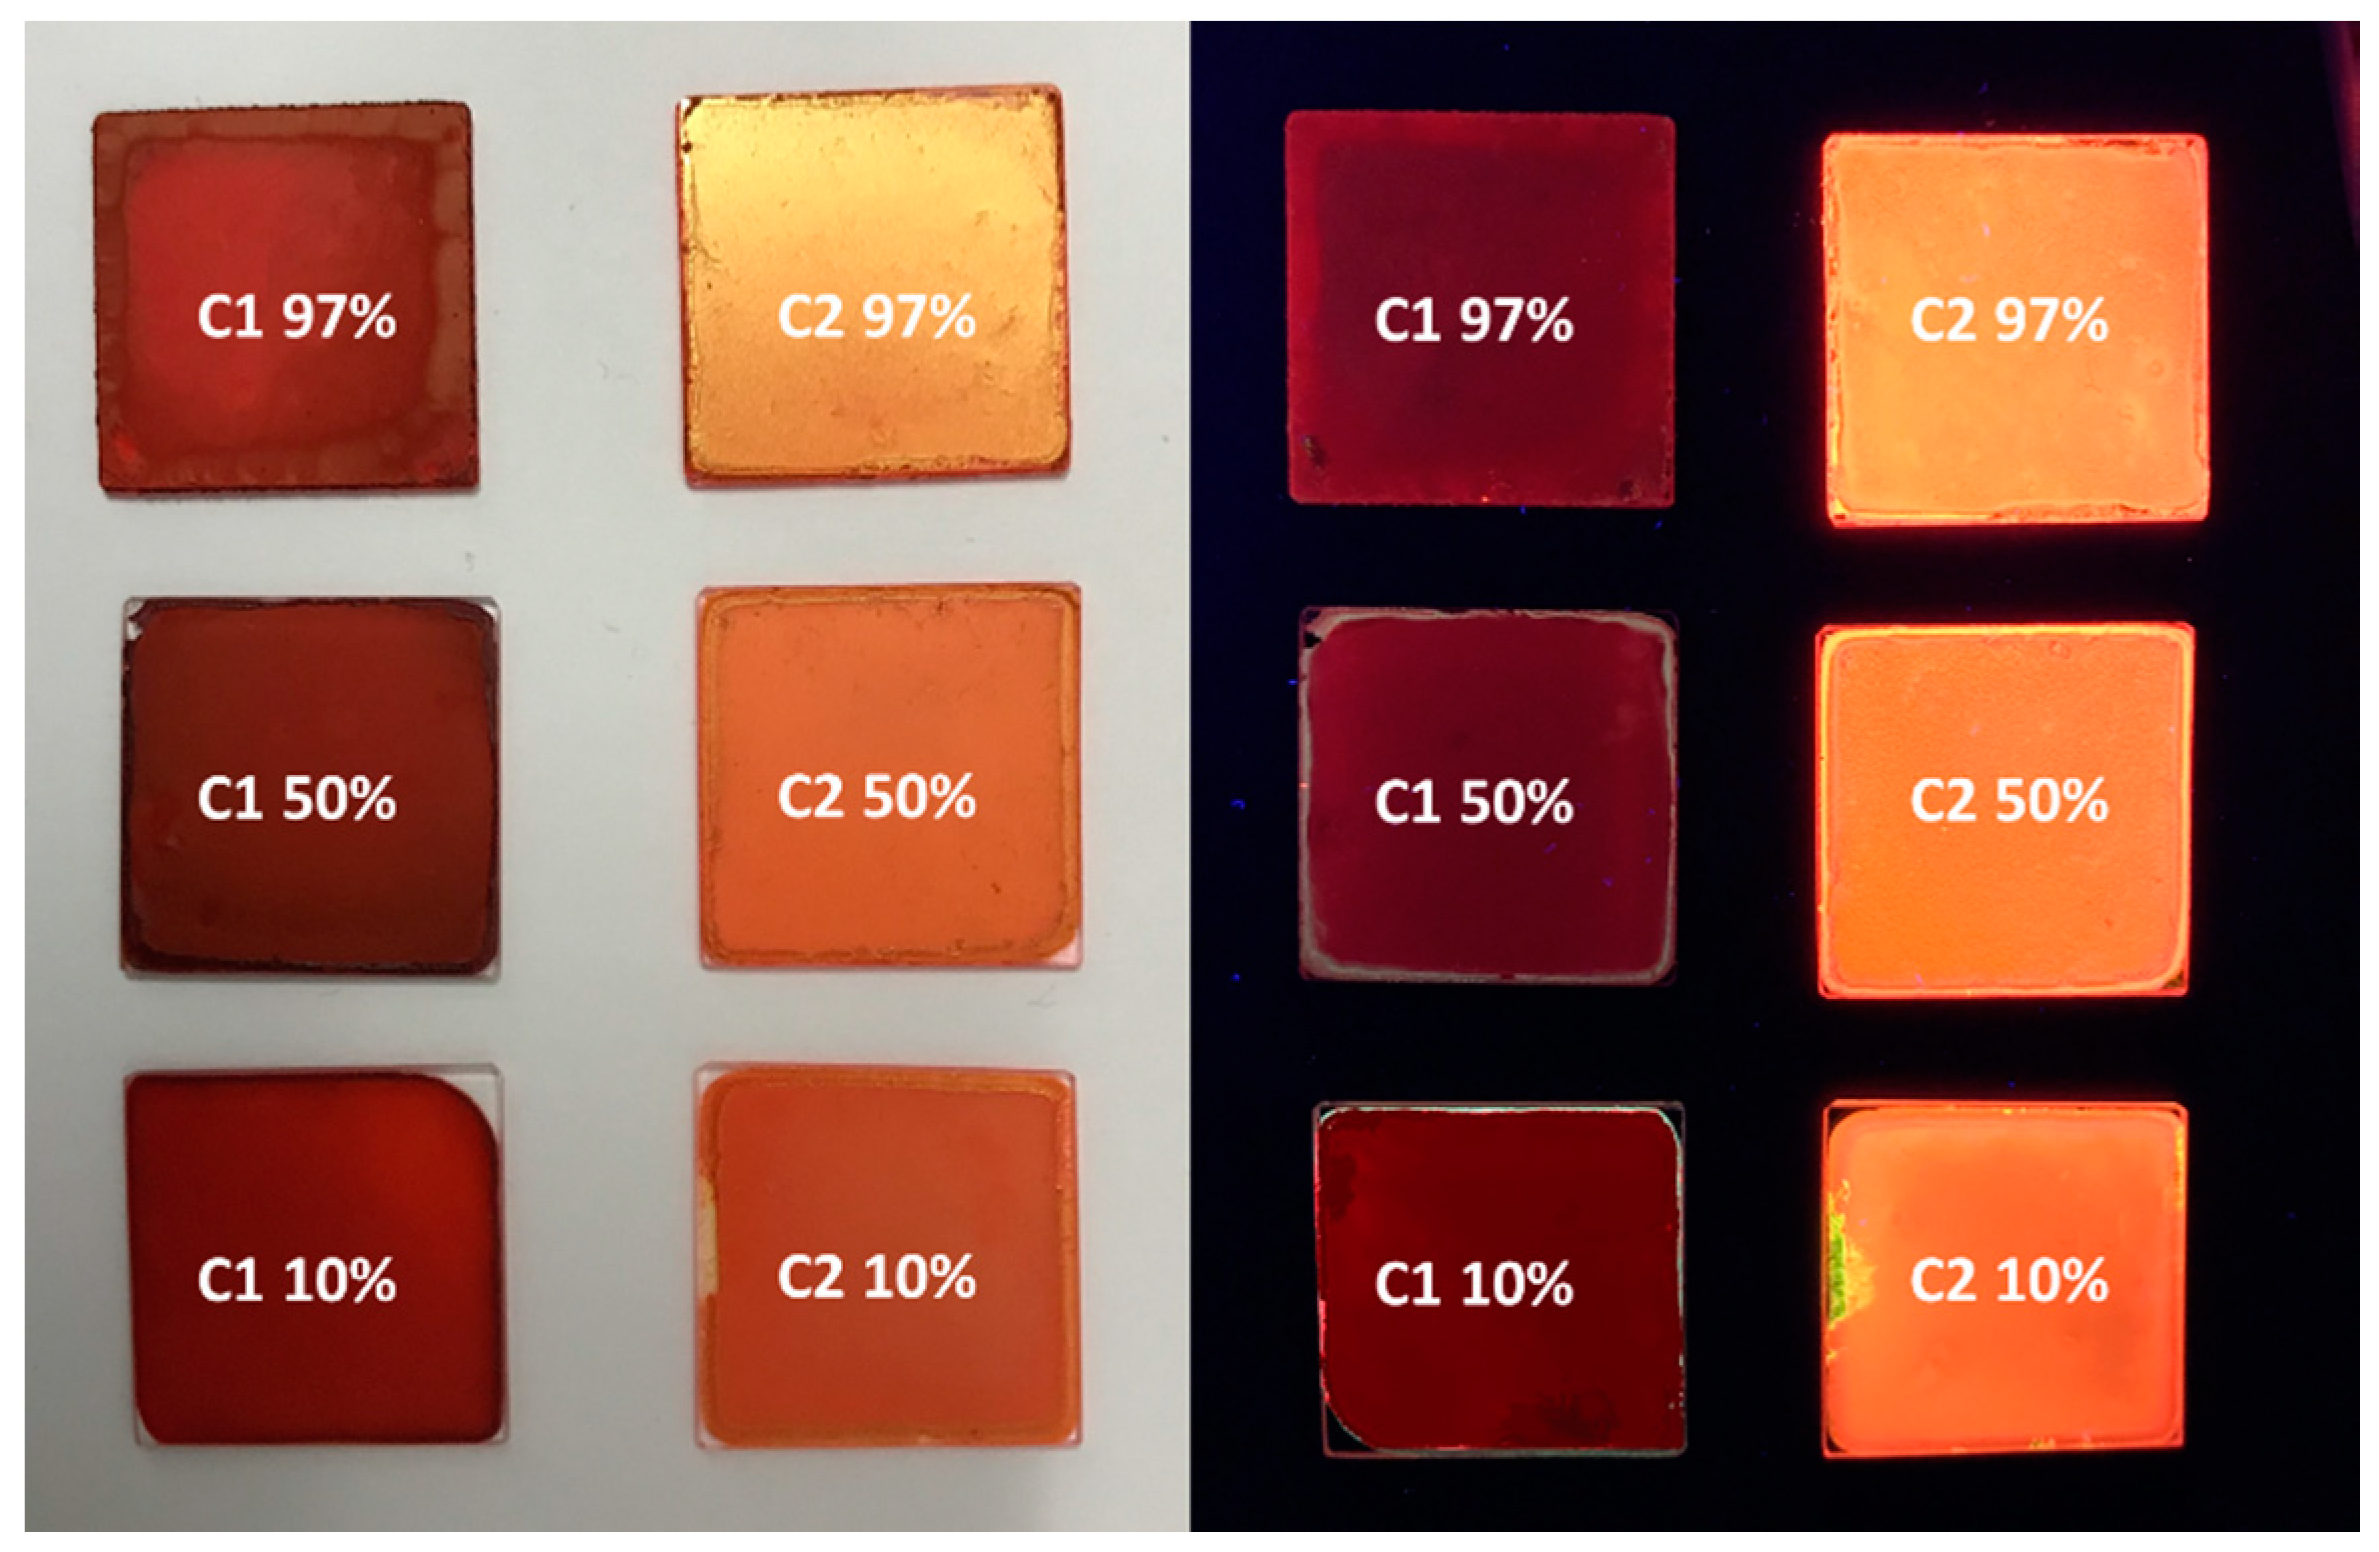
| Compound% a | λabs-film (nm) b | λem-film (nm) c | PLQY% d | Stokes shift (nm) e | |
|---|---|---|---|---|---|
| C1 | 97% | 353; 400; 505 | 652; 702 | 11 ± 0.1 | 252 |
| 50% | 350; 455; 500 | 651; 711 | 18 ± 0.1 | 196 | |
| 10% | 350; 456; 559 | 507; 618 | 12 ± 0.5 | 162 | |
| C2 | 97% | 352; 407; 567 | 621 | 66 ± 3 | 214 |
| 50% | 372; 475 | 616 | 75 ± 4 | 141 | |
| 10% | 372; 494 | 611 | 67 ± 2 | 117 | |
| Hole Reorganization Energy (eV) | Electron Reorganization Energy (eV) | λabs Solution (nm) | λem Solution (nm) | Hole Extraction Potential (eV) | Electron Extraction Potential (eV) | Scaled HOMO (eV) | Scaled LUMO (eV) | |
|---|---|---|---|---|---|---|---|---|
| C1 | 0.257 | 0.306 | 449 | 485 | 6.404 | 1.799 | −5.877 | −3.472 |
| C2 | 0.248 | 0.335 | 477 | 522 | 6.861 | 2.435 | −6.169 | −3.980 |
© 2018 by the authors. Licensee MDPI, Basel, Switzerland. This article is an open access article distributed under the terms and conditions of the Creative Commons Attribution (CC BY) license (http://creativecommons.org/licenses/by/4.0/).
Share and Cite
Caruso, U.; Panunzi, B.; Diana, R.; Concilio, S.; Sessa, L.; Shikler, R.; Nabha, S.; Tuzi, A.; Piotto, S. AIE/ACQ Effects in Two DR/NIR Emitters: A Structural and DFT Comparative Analysis. Molecules 2018, 23, 1947. https://doi.org/10.3390/molecules23081947
Caruso U, Panunzi B, Diana R, Concilio S, Sessa L, Shikler R, Nabha S, Tuzi A, Piotto S. AIE/ACQ Effects in Two DR/NIR Emitters: A Structural and DFT Comparative Analysis. Molecules. 2018; 23(8):1947. https://doi.org/10.3390/molecules23081947
Chicago/Turabian StyleCaruso, Ugo, Barbara Panunzi, Rosita Diana, Simona Concilio, Lucia Sessa, Rafi Shikler, Shiran Nabha, Angela Tuzi, and Stefano Piotto. 2018. "AIE/ACQ Effects in Two DR/NIR Emitters: A Structural and DFT Comparative Analysis" Molecules 23, no. 8: 1947. https://doi.org/10.3390/molecules23081947