Potential Mechanism of Action of Cyclosporin A in Human Dermal Fibroblasts—Transcriptomic Analysis of CYPs


 ,
,
Abstract
:1. Introduction
2. Results
3. Discussion
4. Materials and Methods
4.1. Cell Culture
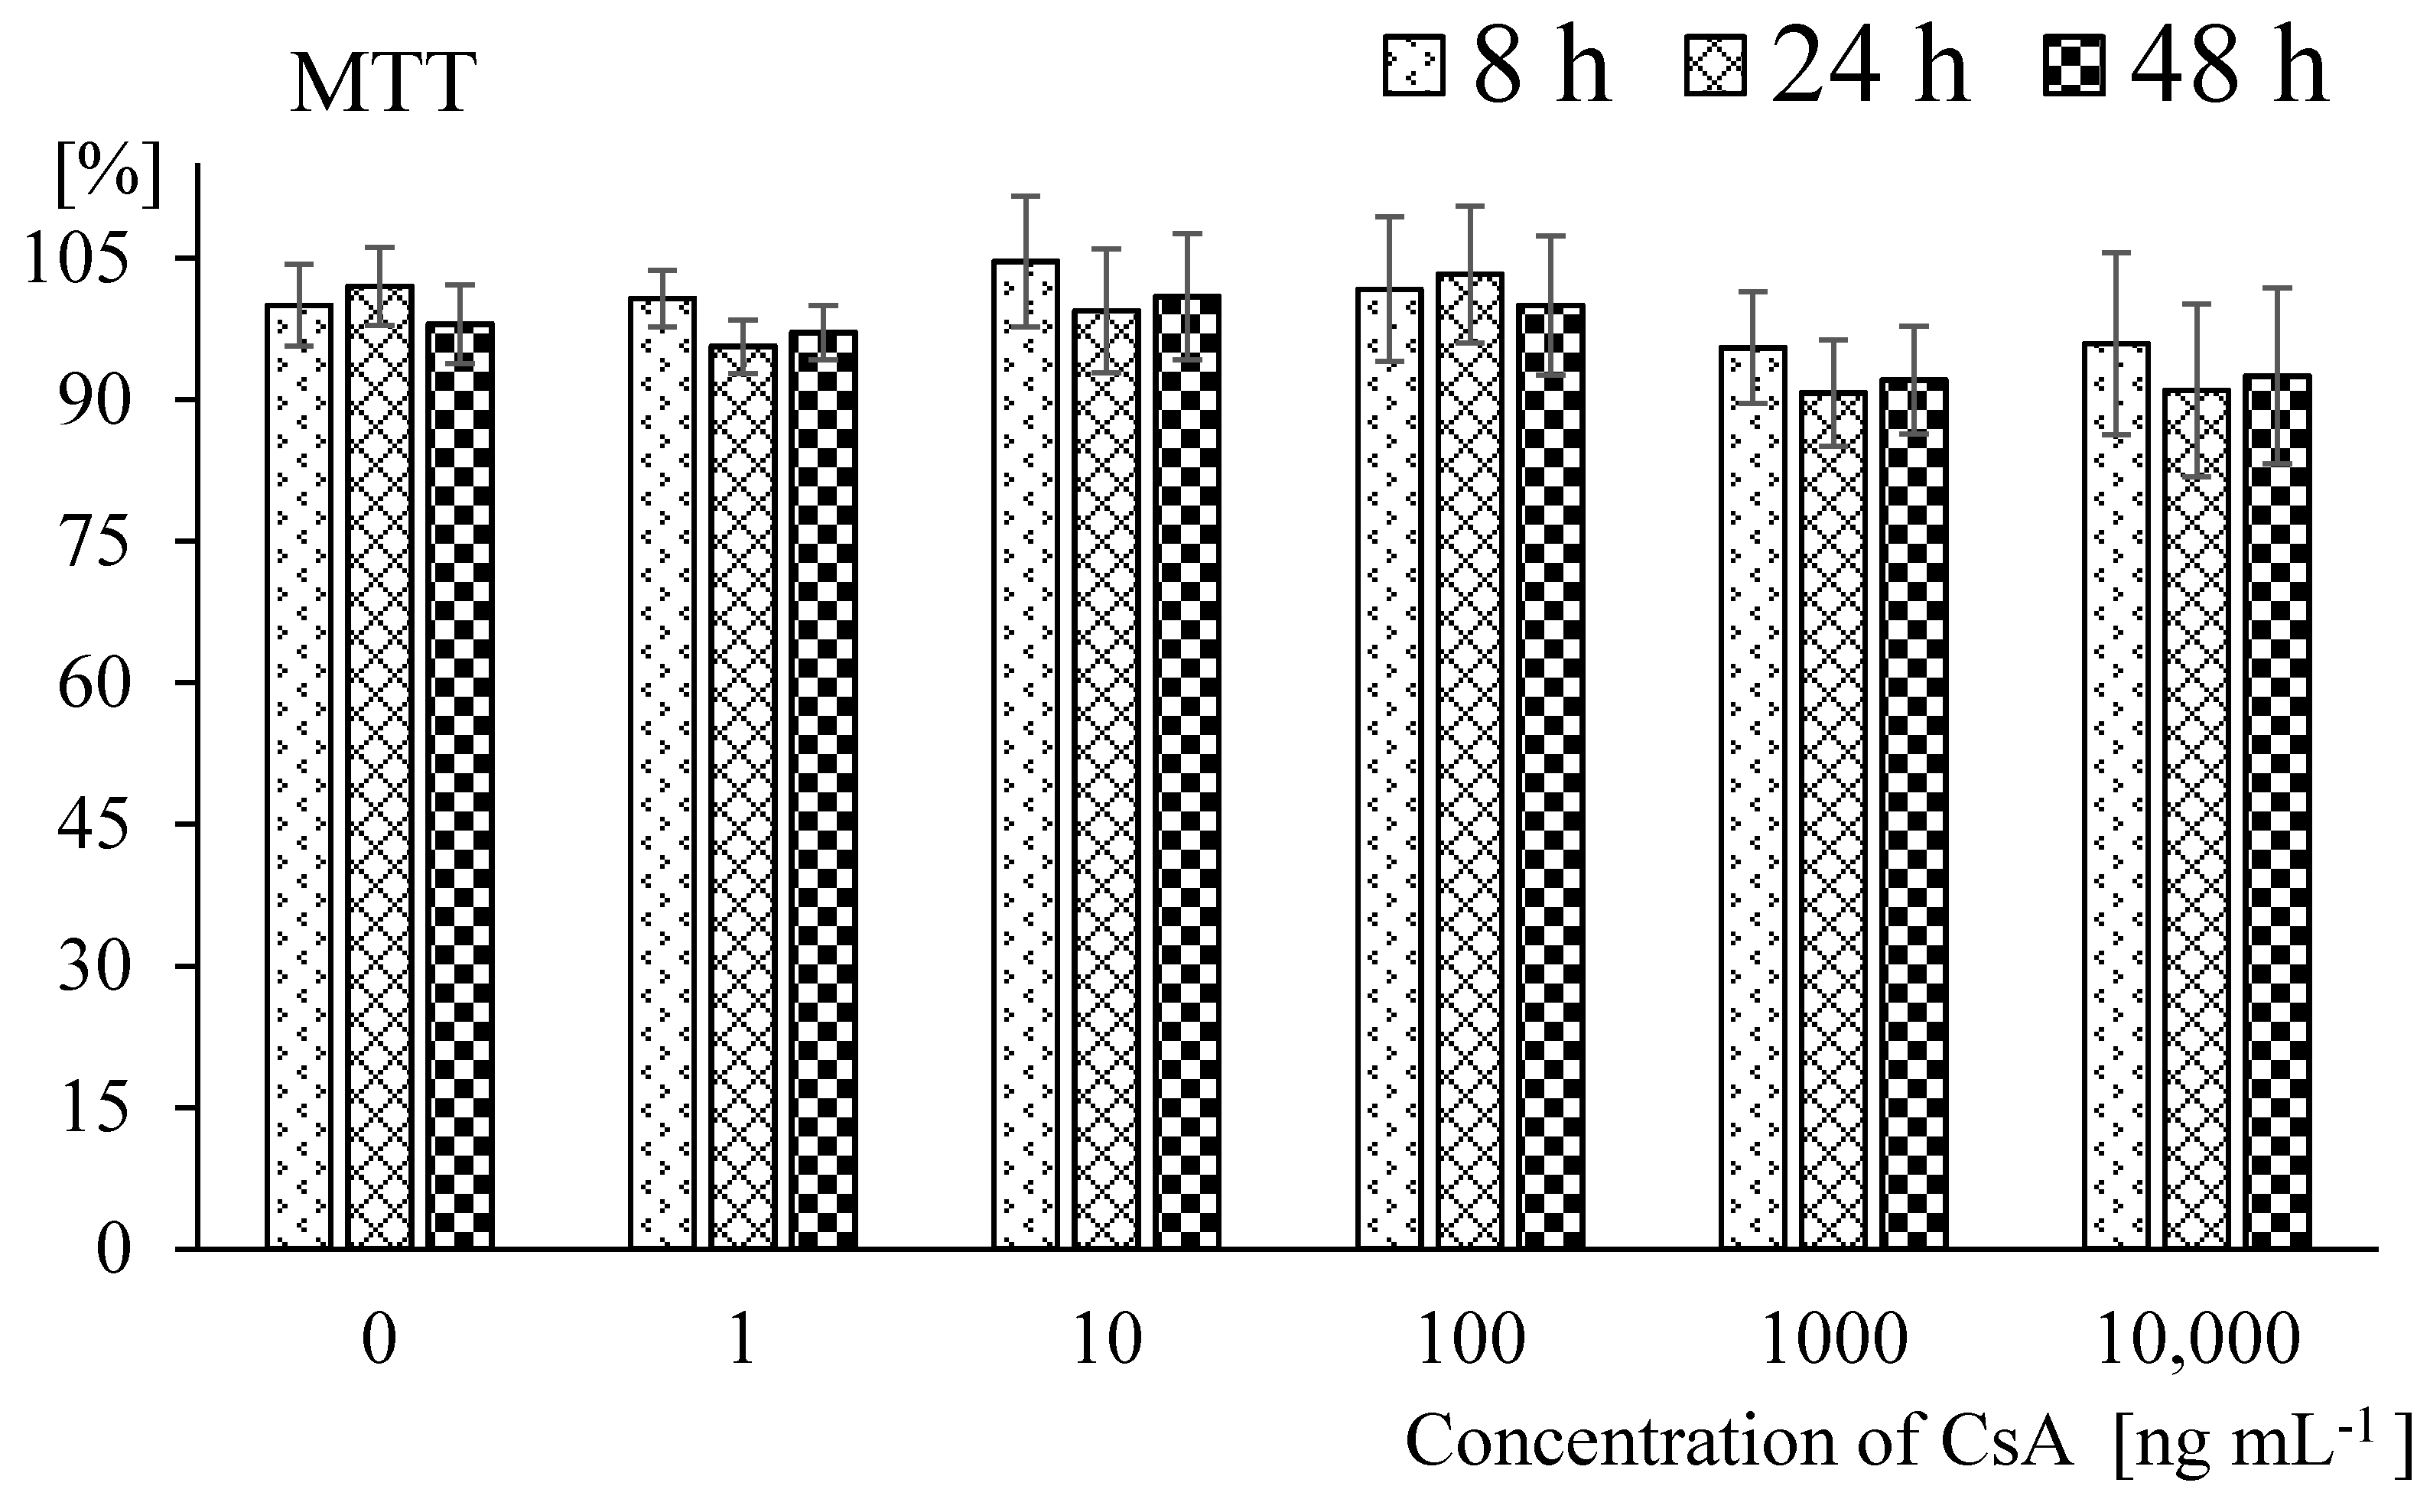
4.2. Cell Viability
4.3. Cell Culture with CsA
4.4. RNA Isolation
4.5. Microarray HGU-133A_2.0 Analysis
4.6. Statistical Analysis
5. Conclusions
Supplementary Materials
Author Contributions
Acknowledgments
Conflicts of Interest
References
- Colombo, D.; Ammirati, E. Cyclosporine in transplantation—A history of converging timelines. J. Biol. Regul. Homeost. Agents 2011, 25, 493–504. [Google Scholar] [PubMed]
- Dehesa, L.; Abuchar, A.; Nuno-Gonzalez, A.; Vitiello, M.; Kerdel, F.A. The use of cyclosporine in dermatology. J. Drugs Dermatol. 2012, 11, 979–987. [Google Scholar] [PubMed]
- Schultz, C. Safety and efficacy of cyclosporine in the treatment of chronic dry eye. Ophthalmol. Eye Dis. 2014, 6, 37–42. [Google Scholar] [CrossRef] [PubMed]
- Amor, K.T.; Ryan, C.; Menter, A. The use of cyclosporine in dermatology: Part I. J. Am. Acad. Dermatol. 2010, 63, 925–928. [Google Scholar] [CrossRef] [PubMed]
- Niwa, T.; Yamamoto, S.; Saito, M.; Shiraga, T.; Takagi, A. Effect of cyclosporine and tacrolimus on cytochrome p450 activities in human liver microsomes. Yakugaku Zasshi 2007, 127, 209–216. [Google Scholar] [CrossRef] [PubMed]
- Nelson, D.R. The cytochrome p450 homepage. Hum. Genom. 2009, 4, 59–65. [Google Scholar]
- Zanger, U.M.; Schwab, M.X. Cytochrome P450 enzymes in drug metabolism: Regulation of gene expression, enzyme activities, and impact of genetic variation. Pharmacol. Ther. 2009, 138, 103–141. [Google Scholar] [CrossRef] [PubMed]
- Omura, T. Recollection of the early years of the research on cytochrome P450. Proc. Jpn. Acad. Ser. B Phys. 2011, 87, 617–640. [Google Scholar] [CrossRef] [PubMed] [Green Version]
- Saeki, M.; Saito, Y.; Nagano, M.; Teshima, R.; Ozawa, S.; Sawada, J. mRNA expression of multiple cytochrome p450 isozymes in four types of cultured skin cells. Int. Arch. Allergy Immunol. 2002, 127, 333–336. [Google Scholar] [CrossRef] [PubMed]
- Pelkonen, O.; Turpeinen, M.; Hakkola, J.; Honkakoski, P.; Hukkanen, J.; Raunio, H. Inhibition and induction of human cytochrome P450 enzymes: Current status. Arch. Toxicol. 2008, 82, 667–715. [Google Scholar] [CrossRef] [PubMed]
- Oesch, F.; Fabian, E.; Guth, K.; Landsiedel, R. Xenobiotic-metabolizing enzymes in the skin of rat, mouse, pig, guinea pig, man, and in human skin models. Arch. Toxicol. 2014, 88, 2135–2190. [Google Scholar] [CrossRef] [PubMed] [Green Version]
- Vickers, A.E.; Biggi, W.A.; Dannecker, R.; Fischer, V. Uptake and metabolism of cyclosporin A and SDZ IMM 125 in the human in vitro skin2 dermal and barrier function models. Life Sci. 1995, 57, 3215–3224. [Google Scholar] [CrossRef]
- Tepeoğlu, M.; Ayva, Ş.; Ok Atılgan, A.; Tunca, M.Z.; Özdemir, B.H.; Moray, G.; Yıldırım, S.; Arslan, G.; Haberal, M. Nonmelanoma skin cancer after kidney transplant. Exp. Clin. Transplant. 2014, 12, 233–237. [Google Scholar] [PubMed]
- Slominski, A.; Zbytek, B.; Nikolakis, G.; Manna, P.R.; Skobowiat, C.; Zmijewski, M.; Li, W.; Janjetovic, Z.; Postlethwaite, A.; Zouboulis, C.C.; et al. Steroidogenesis in the skin: Implications for local immune functions. J. Steroid Biochem. Mol. Biol. 2013, 137, 107–123. [Google Scholar] [CrossRef] [PubMed] [Green Version]
- Slominski, A.T.; Zmijewski, M.A.; Semak, I.; Zbytek, B.; Pisarchik, A.; Li, W.; Zjawiony, J.; Tuckey, R.C. Cytochromes P450 and skin cancer: Role of local endocrine pathways. Anticancer Agents Med. Chem. 2014, 14, 77–96. [Google Scholar] [CrossRef] [PubMed]
- Kohonen, T. Essentials of the self-organizing map. Neural Netw. 2013, 37, 52–65. [Google Scholar] [CrossRef] [PubMed]
- Davies, D.L.; Bouldin, D.W. A cluster separation measure. IEEE Trans. Pattern Anal. Mach. Intell. 1979, 1, 224–227. [Google Scholar] [CrossRef] [PubMed]
- Furlanut, M.; Baraldo, M.; Pea, F.; Marzocchi, V.; Croattino, L.; Galla, F. Blood concentrations and clinical effect of cyclosporin in psoriasis. Ther. Drug Monit. 1996, 18, 544–548. [Google Scholar] [CrossRef] [PubMed]
- Heydendael, V.M.R.; Spuls, P.I.; Ten Berge, I.J.M.; Opmeer, B.C.; Bos, J.D.; de Rie, M.A. Cyclosporin trough levels: Is monitoring necessary during short-term treatment in psoriasis? A systematic review and clinical data on trough levels. Br. J. Dermatol. 2002, 147, 122–129. [Google Scholar] [CrossRef] [PubMed]
- Umezawa, Y.; Ozawa, A. Optimal time for therapeutic drug monitoring of cyclosporine microemulsion in patients with psoriasis. Int. J. Dermatol. 2007, 46, 763–766. [Google Scholar] [CrossRef] [PubMed]
- Cilião, H.L.; Ribeiro, D.L.; Camargo-Godoy, R.B.; Specian, A.F.; Serpeloni, J.M.; Cólus, I.M. Cytotoxic and genotoxic effects of high concentrations of the immunosuppressive drugs cyclosporine and tacrolimus in MRC-5 cells. Exp. Toxicol. Pathol. 2015, 67, 179–187. [Google Scholar] [CrossRef] [PubMed]
- Frušić-Zlotkin, M.; Soroka, Y.; Tivony, R.; Larush, L.; Verkhovsky, L.; Brégégère, F.M.; Neuman, R.; Magdassi, S.; Milner, Y. Penetration and biological effects of topically applied cyclosporin A nanoparticles in a human skin organ culture inflammatory model. Exp. Dermatol. 2012, 21, 938–943. [Google Scholar] [CrossRef] [PubMed]
- Pereira, M.J.; Palming, J.; Rizell, M.; Aureliano, M.; Carvalho, E.; Svensson, M.K.; Eriksson, J.W. Cyclosporine A and tacrolimus reduce the amount of GLUT4 at the cell surface in human adipocytes: Increased endocytosis as a potential mechanism for the diabetogenic effects of immunosuppressive agents. J. Clin. Endocrinol. Metab. 2014, 99, E1885–E1894. [Google Scholar] [CrossRef] [PubMed]
- Zheng, J.P.; Cheng, Z.; Jiang, J.; Ke, Y.; Liu, Z. Cyclosporin A upregulates ETB receptor in vascular smooth muscle via activation of mitogen-activating protein kinases and NF-κB pathways. Toxicol. Lett. 2015, 235, 1–7. [Google Scholar] [CrossRef] [PubMed]
- Daheb, K.; Lipman, M.L.; Hildgen, P.; Roy, J.J. Artificial neural network modeling for drug dialyzability prediction. J. Pharm. Pharm. Sci. 2013, 16, 665–675. [Google Scholar] [CrossRef] [PubMed]
- Chavez-Alvarez, R.; Chavoya, A.; Mendez-Vazquez, A. Discovery of possible gene relationships through the application of self-organizing maps to DNA microarray databases. PLoS ONE 2014, 9, e93233. [Google Scholar] [CrossRef] [PubMed]
- Gajjar, K.; Martin-Hirsch, P.L.; Martin, F.L. CYP1B1 and hormone-induced cancer. Cancer Lett. 2012, 324, 13–30. [Google Scholar] [CrossRef] [PubMed]
- Sugino, N. Molecular mechanisms of luteinization. Obstet. Gynecol. Sci. 2014, 57, 93–101. [Google Scholar] [CrossRef] [PubMed]
- Chiang, T.S.; Yang, K.C.; Zheng, S.K.; Chiou, L.L.; Hsu, W.M.; Lin, F.H.; Huang, G.T.; Lee, H.S. The prediction of drug metabolism using scaffold-mediated enhancement of the induced cytochrome P450 activities in fibroblasts by hepatic transcriptional regulators. Biomaterials 2012, 33, 5187–5197. [Google Scholar] [CrossRef] [PubMed]
- Inoue, T.; Miki, Y.; Abe, K.; Hatori, M.; Hosaka, M.; Kariya, Y.; Kakuo, S.; Fujimura, T.; Hachiya, A.; Honma, S.; et al. Sex steroid synthesis in human skin in situ: The roles of aromatase and steroidogenic acute regulatory protein in the homeostasis of human skin. Mol. Cell. Endocrinol. 2012, 362, 19–28. [Google Scholar] [CrossRef] [PubMed]
- Shen, J.; Arnett, D.K.; Parnell, L.D.; Lai, C.-Q.; Straka, R.J.; Hopkins, P.N.; An, P.; Feitosa, M.F.; Ordovás, J.M. The effect of CYP7A1 polymorphisms on lipid responses to fenofibrate. J. Cardiovasc. Pharmacol. 2012, 59, 254–259. [Google Scholar] [CrossRef] [PubMed]
- Yengi, L.G.; Xiang, Q.; Pan, J.; Scatina, J.; Kao, J.; Ball, S.E.; Fruncillo, R.; Ferron, G.; Roland Wolf, C. Quantitation of cytochrome P450 mRNA levels in human skin. Anal. Biochem. 2003, 316, 103–110. [Google Scholar] [CrossRef]
- Smith, G.; Ibbotson, S.H.; Comrie, M.M.; Dawe, R.S.; Bryden, A.; Ferguson, J.; Wolf, C.R. Regulation of cutaneous drug-metabolizing enzymes and cytoprotective gene expression by topical drugs in human skin in vivo. Br. J. Dermatol. 2006, 155, 275–281. [Google Scholar] [CrossRef] [PubMed]
- Korosec, T.; Acimovic, J.; Seliskar, M.; Kocjan, D.; Tacer, K.F.; Rozman, D.; Urleb, U. Novel cholesterol biosynthesis inhibitors targeting human lanosterol 14alpha-demethylase (CYP51). Bioorg. Med. Chem. 2008, 16, 209–221. [Google Scholar] [CrossRef] [PubMed]
- Hu, T.; Khambatta, Z.S.; Hayden, P.J.; Bolmarcich, J.; Binder, R.L.; Robinson, M.K.; Carr, G.J.; Tiesman, J.P.; Jarrold, B.B.; Osborne, R.; et al. Xenobiotic metabolism gene expression in the EpiDermin vitro 3D human epidermis model compared to human skin. Toxicol. In Vitro 2010, 24, 1450–1463. [Google Scholar] [CrossRef] [PubMed]
- Du, L.; Hoffman, S.M.G.; Keeney, D.S. Epidermal CYP2 family cytochromes P450. Toxicol. Appl. Pharmacol. 2004, 195, 278–287. [Google Scholar] [CrossRef] [PubMed]
- Du, L.; Neis, M.M.; Ladd, P.A.; Keeney, D.S. Differentiation-specific factors modulate epidermal CYP1-4 gene expression in human skin in response to retinoic acid and classic aryl hydrocarbon receptor ligands. J. Pharmacol. Exp. Ther. 2006, 319, 1162–1171. [Google Scholar] [CrossRef] [PubMed]
- Mosmann, T. Rapid colorimetric assay for cellular growth and survival: Application to proliferation and cytotoxicity assays. J. Immunol. Methods 1983, 65, 55–63. [Google Scholar] [CrossRef]
Sample Availability: Not available. |

| Gene Symbol | Fold Change | p Value | SOFM Neuron | Biological Process | ||
|---|---|---|---|---|---|---|
| 8 h vs. 0 | 24 h vs. 0 | 48 h vs. 0 | ||||
| CYP19A1 | 1.72 | 1.07 | 1.24 | 0.0006 | 2 | steroids biosynthesis and metabolism |
| CYP1B1 | 1.52 | 1.39 | 1.05 | 0.0030 | 2, 3 | steroids metabolism |
| CYP2F1 | 1.26 | 1.18 | 1.09 | 0.0050 | 2 | metabolism and synthesis of lipids, cholesterol, steroids |
| CYP7A1 | 1.22 | 1.16 | 1.16 | 0.0330 | 2 | steroids biosynthesis |
| CYP17A1 | 1.20 | 1.11 | −1.04 | 0.0500 | 2 | biosynthesis of cholesterol, lipids, steroids |
| No. | Probe ID | Transcript | NHDFs Control (0) Mean [log2FS] | NHDFs with CsA (8 h) Mean [log2FS] | t Test | SOFM Neuron |
|---|---|---|---|---|---|---|
| 1 | 202436_s_at | 1B1 | 12.24 | 12.64 | ↑ | 2 |
| 2 | 208131_s_at | 8A1 | 12.15 | 12.27 | NS | |
| 3 | 202435_s_at | 1B1 | 11.32 | 11.77 | ↑ | 2 |
| 4 | 202437_s_at | 1B1 | 10.78 | 11.38 | ↑ | 3 |
| 5 | 216661_x_at | 2C19/9 | 8.62 | 8.62 | NS | |
| 6 | 209975_at | 2.E1 | 8.46 | 8.46 | NS | |
| 7 | 202314_at | 51A1 | 8.39 | 8.85 | ↑ | 3 |
| 8 | 210726_at | 3A4 | 7.96 | 8.03 | NS | |
| 9 | 219825_at | 26B1 | 7.83 | 7.71 | NS | |
| 10 | 214234_s_at | 3A5 | 7.81 | 7.90 | NS | |
| 11 | 216025_x_at | 2C19/9 | 7.75 | 7.60 | NS | |
| 12 | 209148_at | 2C8 | 7.58 | 7.71 | NS | |
| 13 | 203979_at | 27A1 | 7.49 | 7.62 | NS | |
| 14 | 219565_at | 20A1 | 7.47 | 7.49 | NS | |
| 15 | 205998_x_at | 3A4 | 6.42 | 6.59 | NS | |
| 16 | 207244_x_at | 2A6 | 6.32 | 6.32 | NS | |
| 17 | 203475_at | 19A1 | 6.25 | 7.04 | ↑ | 2 |
| 18 | 220432_s_at | 39A1 | 5.47 | 5.52 | NS | |
| 19 | 215103_at | 2C18 | 5.47 | 5.34 | NS | |
| 20 | 214630_at | 11B2 | 5.25 | 5.34 | NS | |
| 21 | 215982_s_at | 21A2 | 5.23 | 5.33 | NS | |
| 22 | 214419_s_at | 2C9 | 5.16 | 5.10 | NS | |
| 23 | 202434_s_at | 1B1 | 5.16 | 5.50 | ↑ | 2 |
| 24 | 209976_s_at | 2.E1 | 4.94 | 4.75 | NS | |
| 25 | 207498_s_at | 2D6 | 4.69 | 4.45 | ↓ | 1 |
| 26 | 216607_s_at | 51A1 | 4.63 | 4.56 | NS | |
| 27 | 1494_f_at | 2A6 | 4.63 | 4.69 | NS | |
| 28 | 220562_at | 2W1 | 4.62 | 4.54 | NS | |
| 29 | 211231_x_at | 4A11 | 4.55 | 4.74 | NS | |
| 30 | 207386_at | 7B1 | 4.51 | 4.69 | NS | |
| 31 | 205765_at | 3A5 | 4.49 | 4.34 | NS | |
| 32 | 208327_at | 2A13 | 4.49 | 4.61 | NS | |
| 33 | 211440_x_at | 3A43 | 4.46 | 4.65 | NS | |
| 34 | 210576_at | 4F8 | 4.35 | 4.29 | NS | |
| 35 | 211295_x_at | 2A6 | 4.33 | 4.49 | NS | |
| 36 | 220331_at | 46A1 | 4.32 | 4.44 | NS | |
| 37 | 210452_x_at | 4F2 | 4.24 | 4.17 | NS | |
| 38 | 207609_s_at | 1A2 | 4.20 | 4.10 | NS | |
| 39 | 206539_s_at | 4F12 | 4.18 | 4.21 | NS | |
| 40 | 214320_x_at | 2A6 | 4.17 | 3.88 | NS | |
| 41 | 204309_at | 11A1 | 4.16 | 4.39 | NS | |
| 42 | 207608_x_at | 1A2 | 4.14 | 4.44 | ↑ | 3 |
| 43 | 205502_at | 17A1 | 4.06 | 4.33 | ↑ | 2 |
| 44 | 1431_at | 2.E1 | 4.01 | 3.67 | NS | |
| 45 | 216058_s_at | 2C19 | 3.17 | 3.40 | ↑ | 3 |
| 46 | 207406_at | 7A1 | 2.49 | 2.79 | ↑ | 2 |
| 47 | 207913_at | 2F1 | 2.51 | 2.86 | ↑ | 2 |
© 2018 by the authors. Licensee MDPI, Basel, Switzerland. This article is an open access article distributed under the terms and conditions of the Creative Commons Attribution (CC BY) license (http://creativecommons.org/licenses/by/4.0/).
Share and Cite
Janikowska, G.; Pyka-Pająk, A.; Janikowski, T.; Adamska, J.; Mazurek, U.; Jędrusik, P. Potential Mechanism of Action of Cyclosporin A in Human Dermal Fibroblasts—Transcriptomic Analysis of CYPs. Molecules 2018, 23, 1642. https://doi.org/10.3390/molecules23071642
Janikowska G, Pyka-Pająk A, Janikowski T, Adamska J, Mazurek U, Jędrusik P. Potential Mechanism of Action of Cyclosporin A in Human Dermal Fibroblasts—Transcriptomic Analysis of CYPs. Molecules. 2018; 23(7):1642. https://doi.org/10.3390/molecules23071642
Chicago/Turabian StyleJanikowska, Grażyna, Alina Pyka-Pająk, Tomasz Janikowski, Jolanta Adamska, Urszula Mazurek, and Przemysław Jędrusik. 2018. "Potential Mechanism of Action of Cyclosporin A in Human Dermal Fibroblasts—Transcriptomic Analysis of CYPs" Molecules 23, no. 7: 1642. https://doi.org/10.3390/molecules23071642
APA StyleJanikowska, G., Pyka-Pająk, A., Janikowski, T., Adamska, J., Mazurek, U., & Jędrusik, P. (2018). Potential Mechanism of Action of Cyclosporin A in Human Dermal Fibroblasts—Transcriptomic Analysis of CYPs. Molecules, 23(7), 1642. https://doi.org/10.3390/molecules23071642