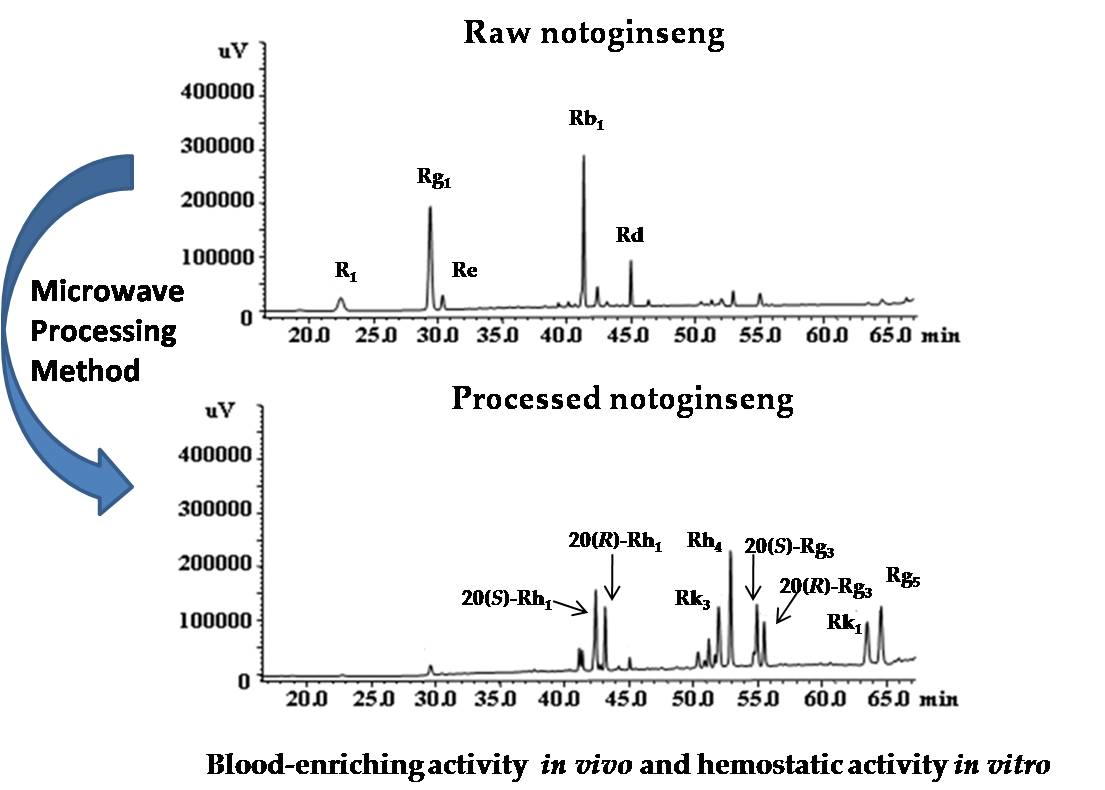
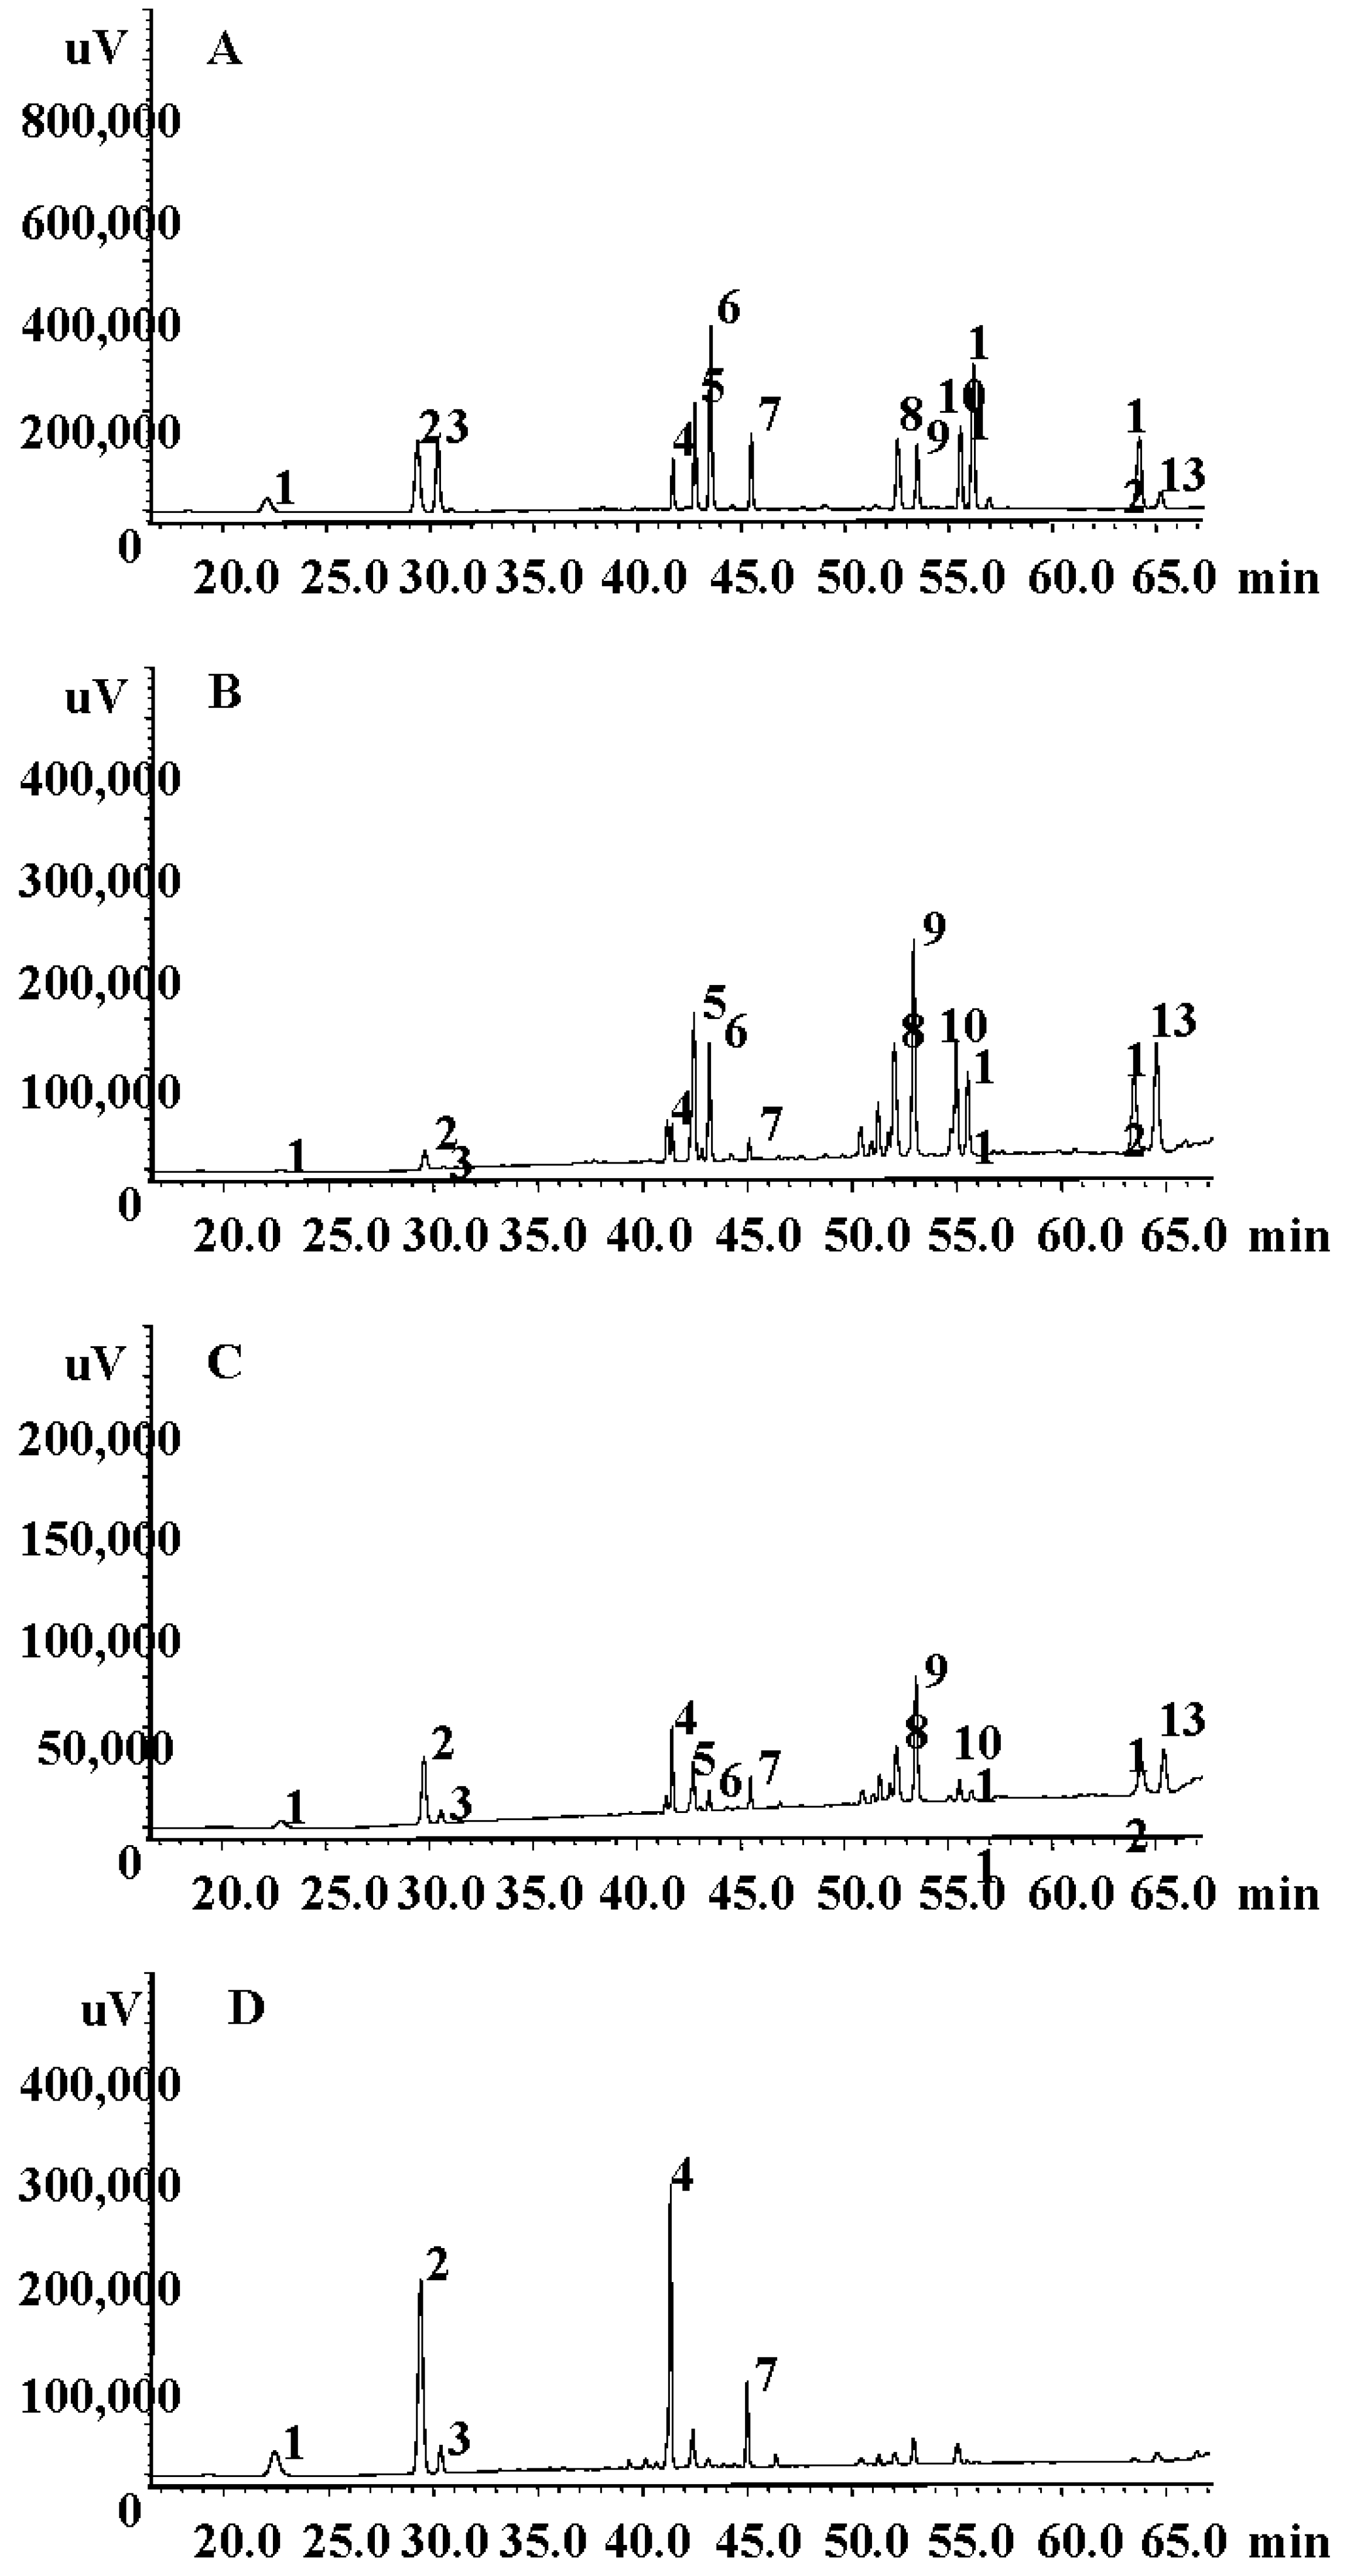
Figure 1.
HPLC chromatograms of mixed standards (A); notoginseng processed by the microwave processing method at 500 W and 150 °C for 20 min (B); notoginseng steamed at 120 °C for 4 h (C) and raw notoginseng (D). Peaks: 1, notoginsenoside R1; 2, ginsenoside Rg1; 3, ginsenoside Re; 4, ginsenoside Rb1; 5, 20(S)-ginsenoside Rh1; 6, 20(R)-ginsenoside Rh1; 7, ginsenoside Rd; 8, ginsenoside Rk3; 9, ginsenoside Rh4; 10, 20(S)-ginsenoside Rg3; 11, 20(R)-ginsenoside Rg3; 12, ginsenoside Rk1; 13, ginsenoside Rg5.
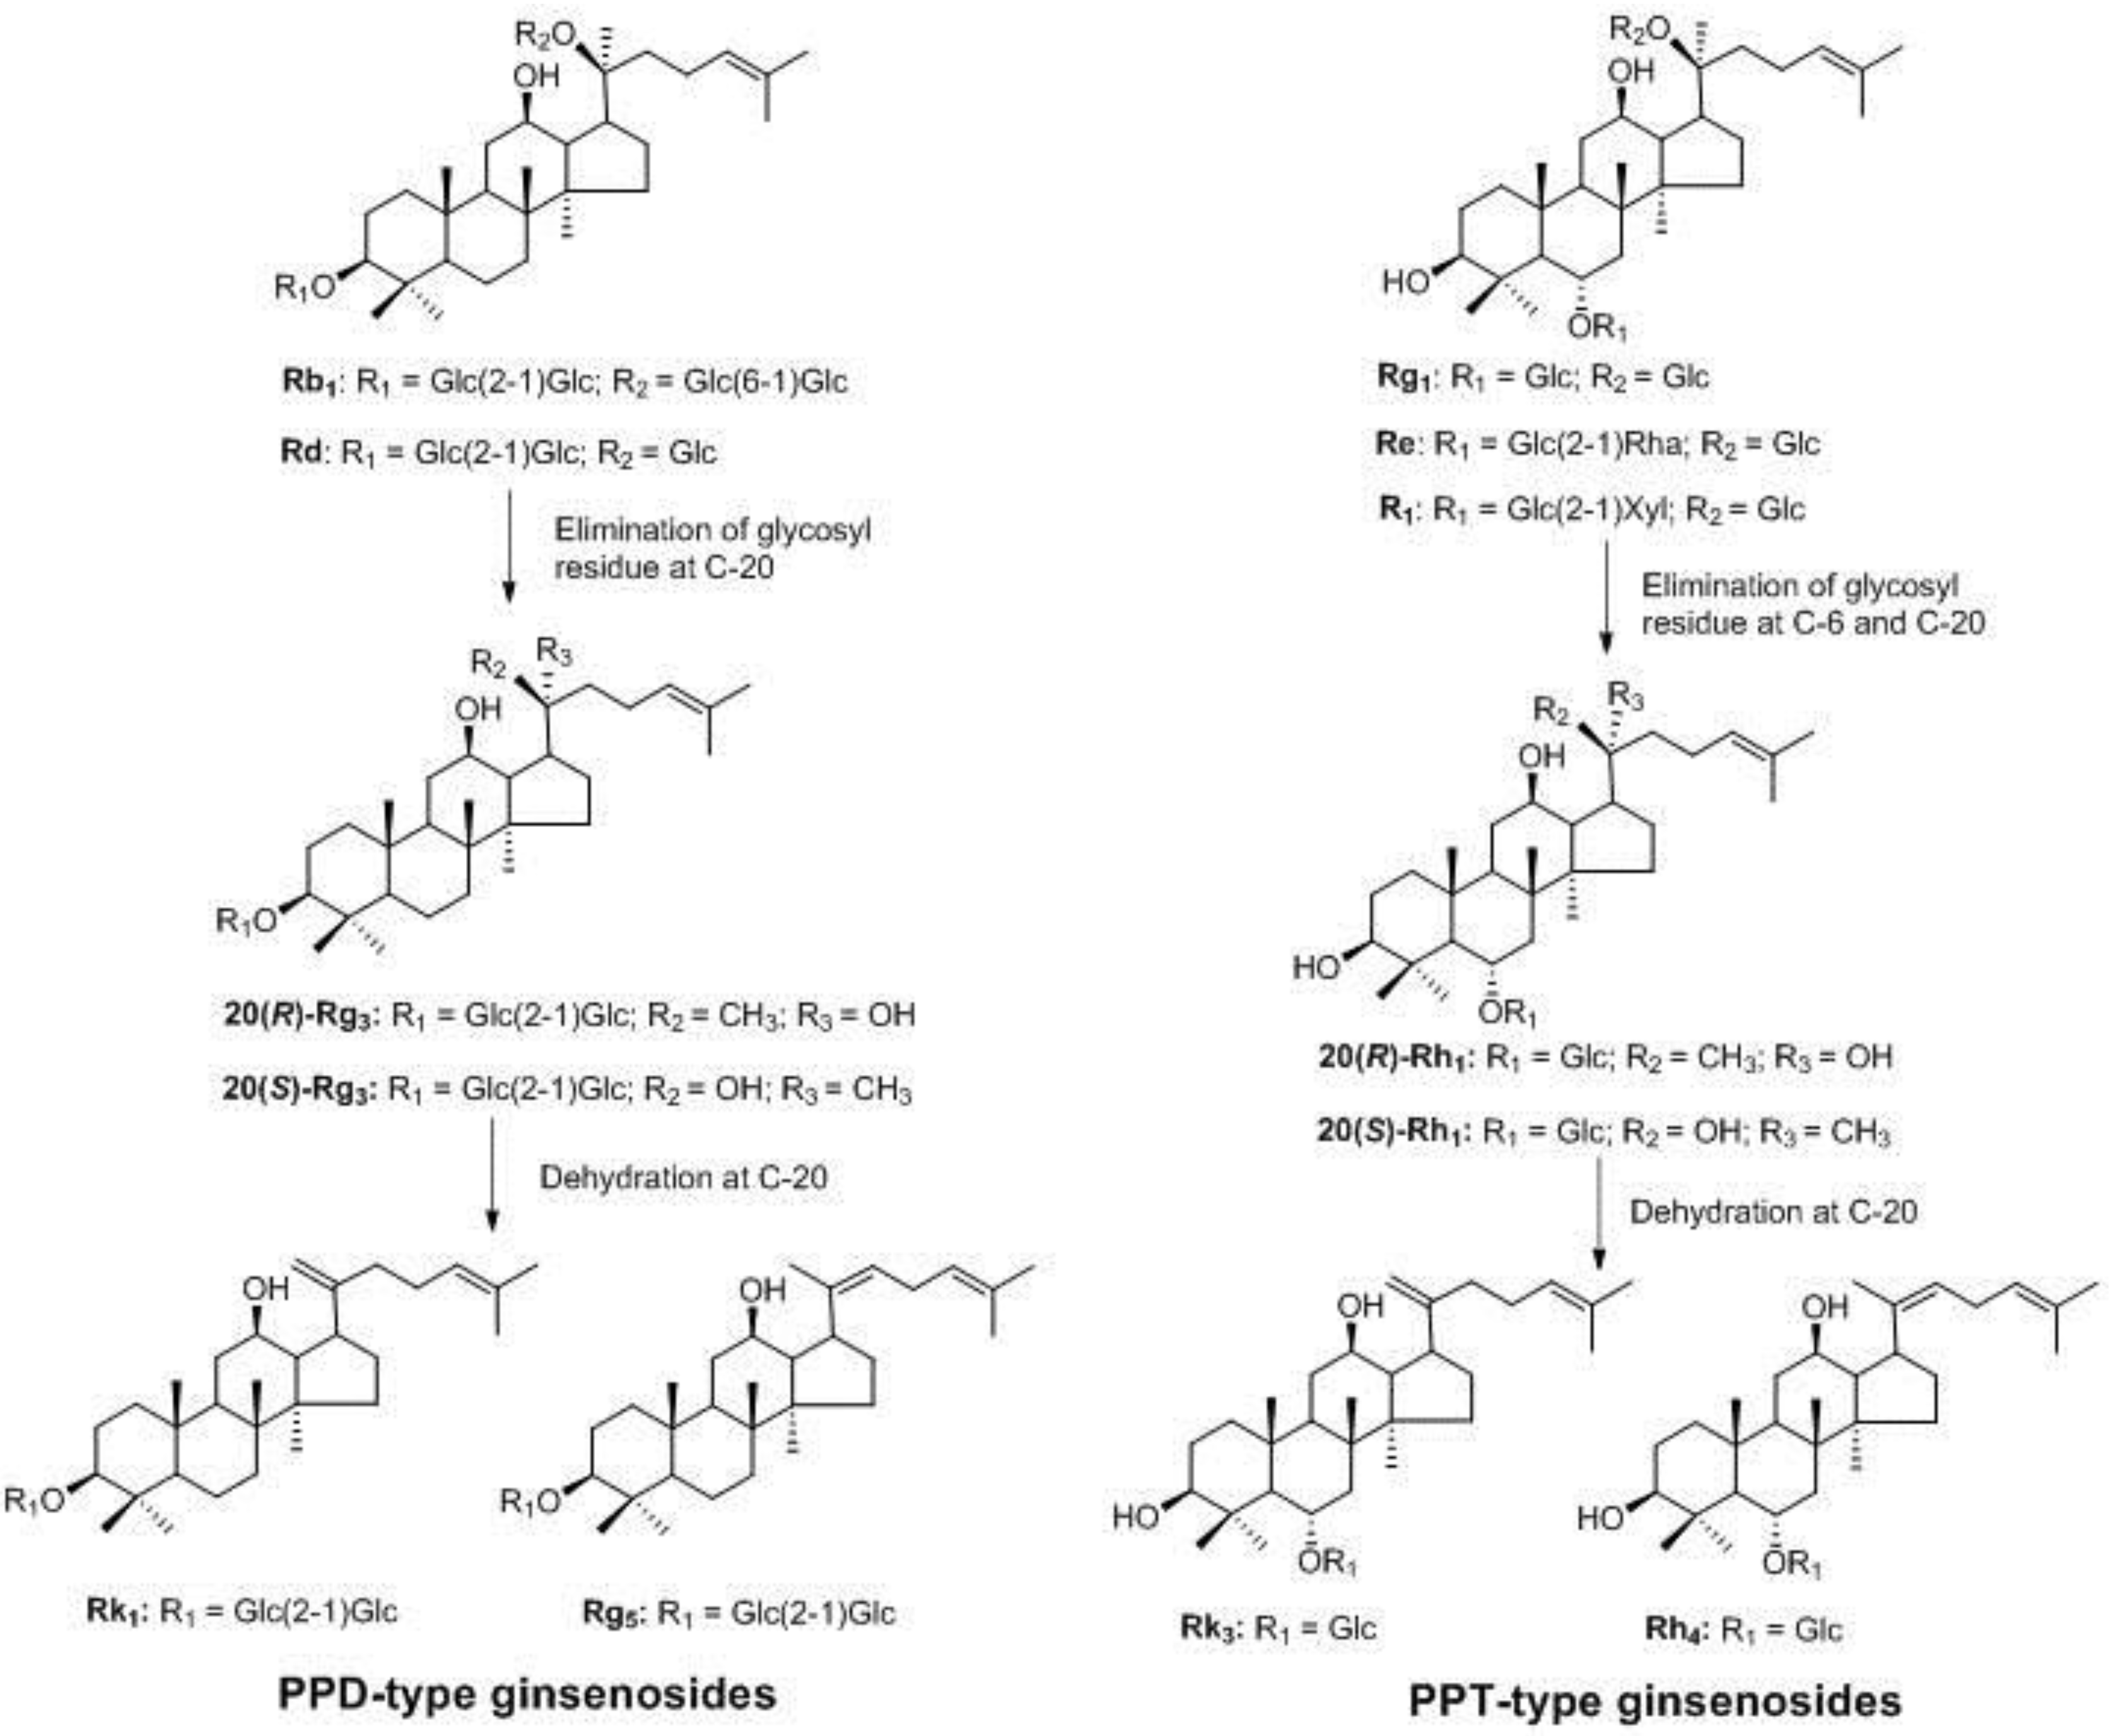
Scheme 1.
Proposed structural changes of saponins during the microwave processing of P. notoginseng. -Glc, d-glucopyranosyl; -Rha, l-rhamnopyranosyl; -Xyl, d-xylopyranosyl.
Scheme 1.
Proposed structural changes of saponins during the microwave processing of P. notoginseng. -Glc, d-glucopyranosyl; -Rha, l-rhamnopyranosyl; -Xyl, d-xylopyranosyl.
Figure 2.
Effect of solvent, microwave power, temperature, time and solid-to-liquid ratio on production of the total minor ginsenosides. (A) Ethanol concentration; (B) Methanol concentration; (C) Microwave power; (D) Microwave temperature; (E) Microwave time; (F) Solid-to-liquid ratio.
Figure 2.
Effect of solvent, microwave power, temperature, time and solid-to-liquid ratio on production of the total minor ginsenosides. (A) Ethanol concentration; (B) Methanol concentration; (C) Microwave power; (D) Microwave temperature; (E) Microwave time; (F) Solid-to-liquid ratio.
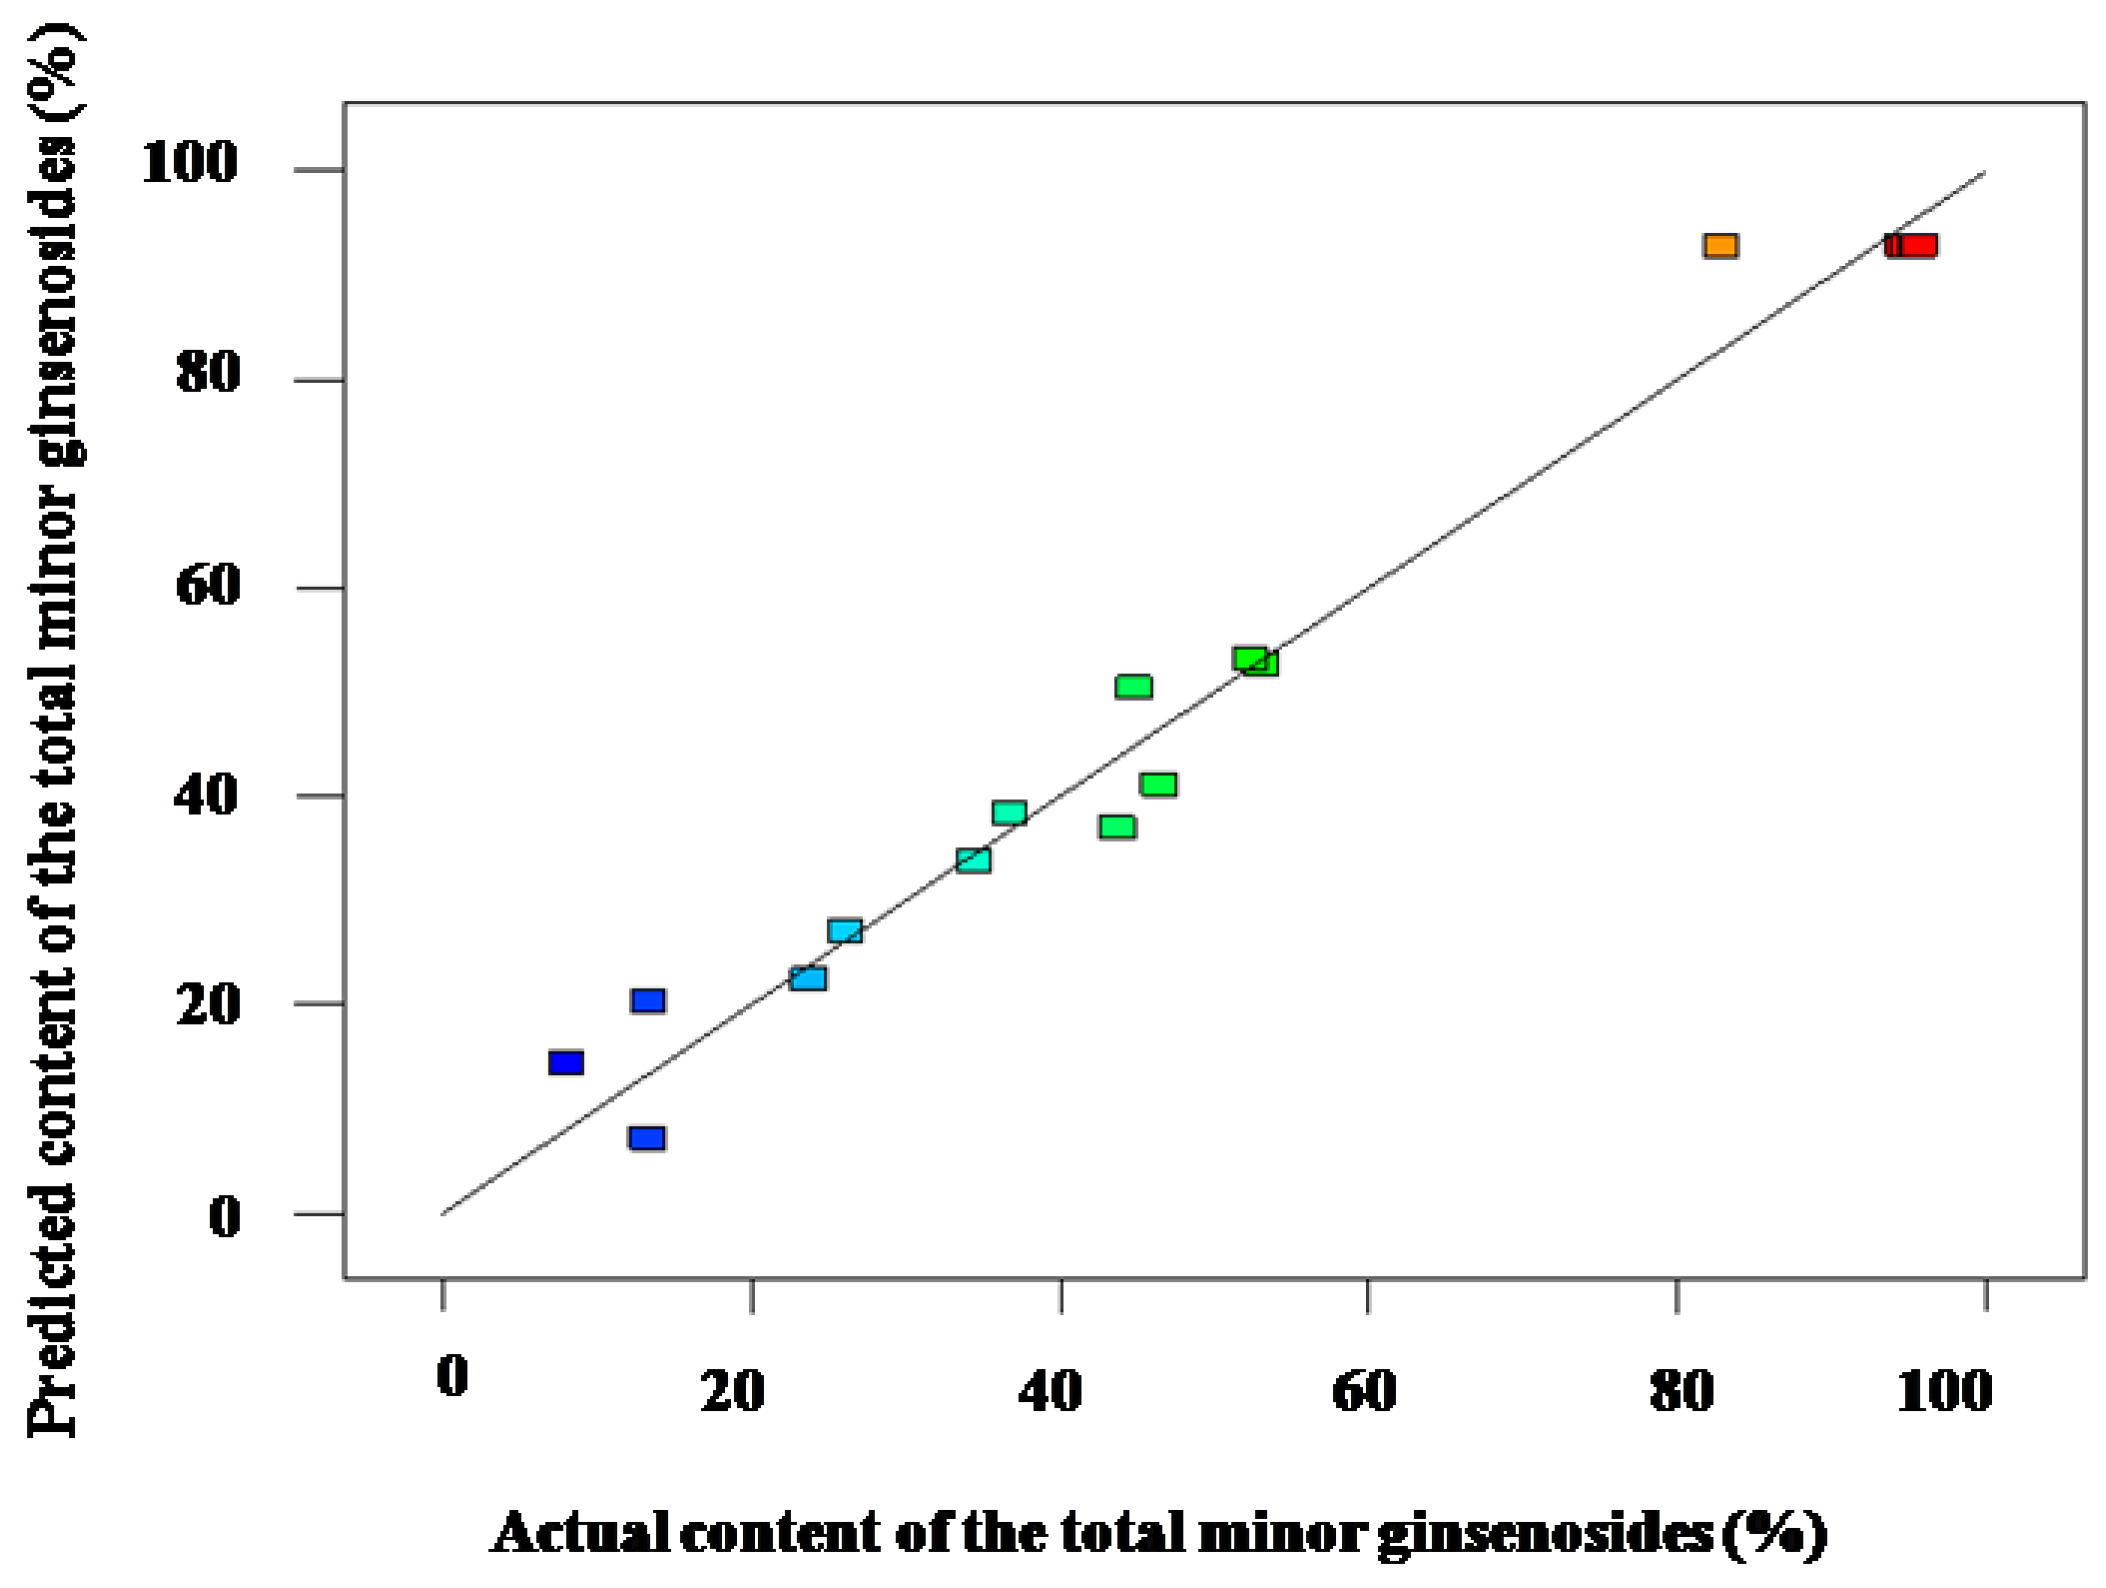
Figure 3.
Correlation between actual and predicted values of response (Y9).
Figure 3.
Correlation between actual and predicted values of response (Y9).
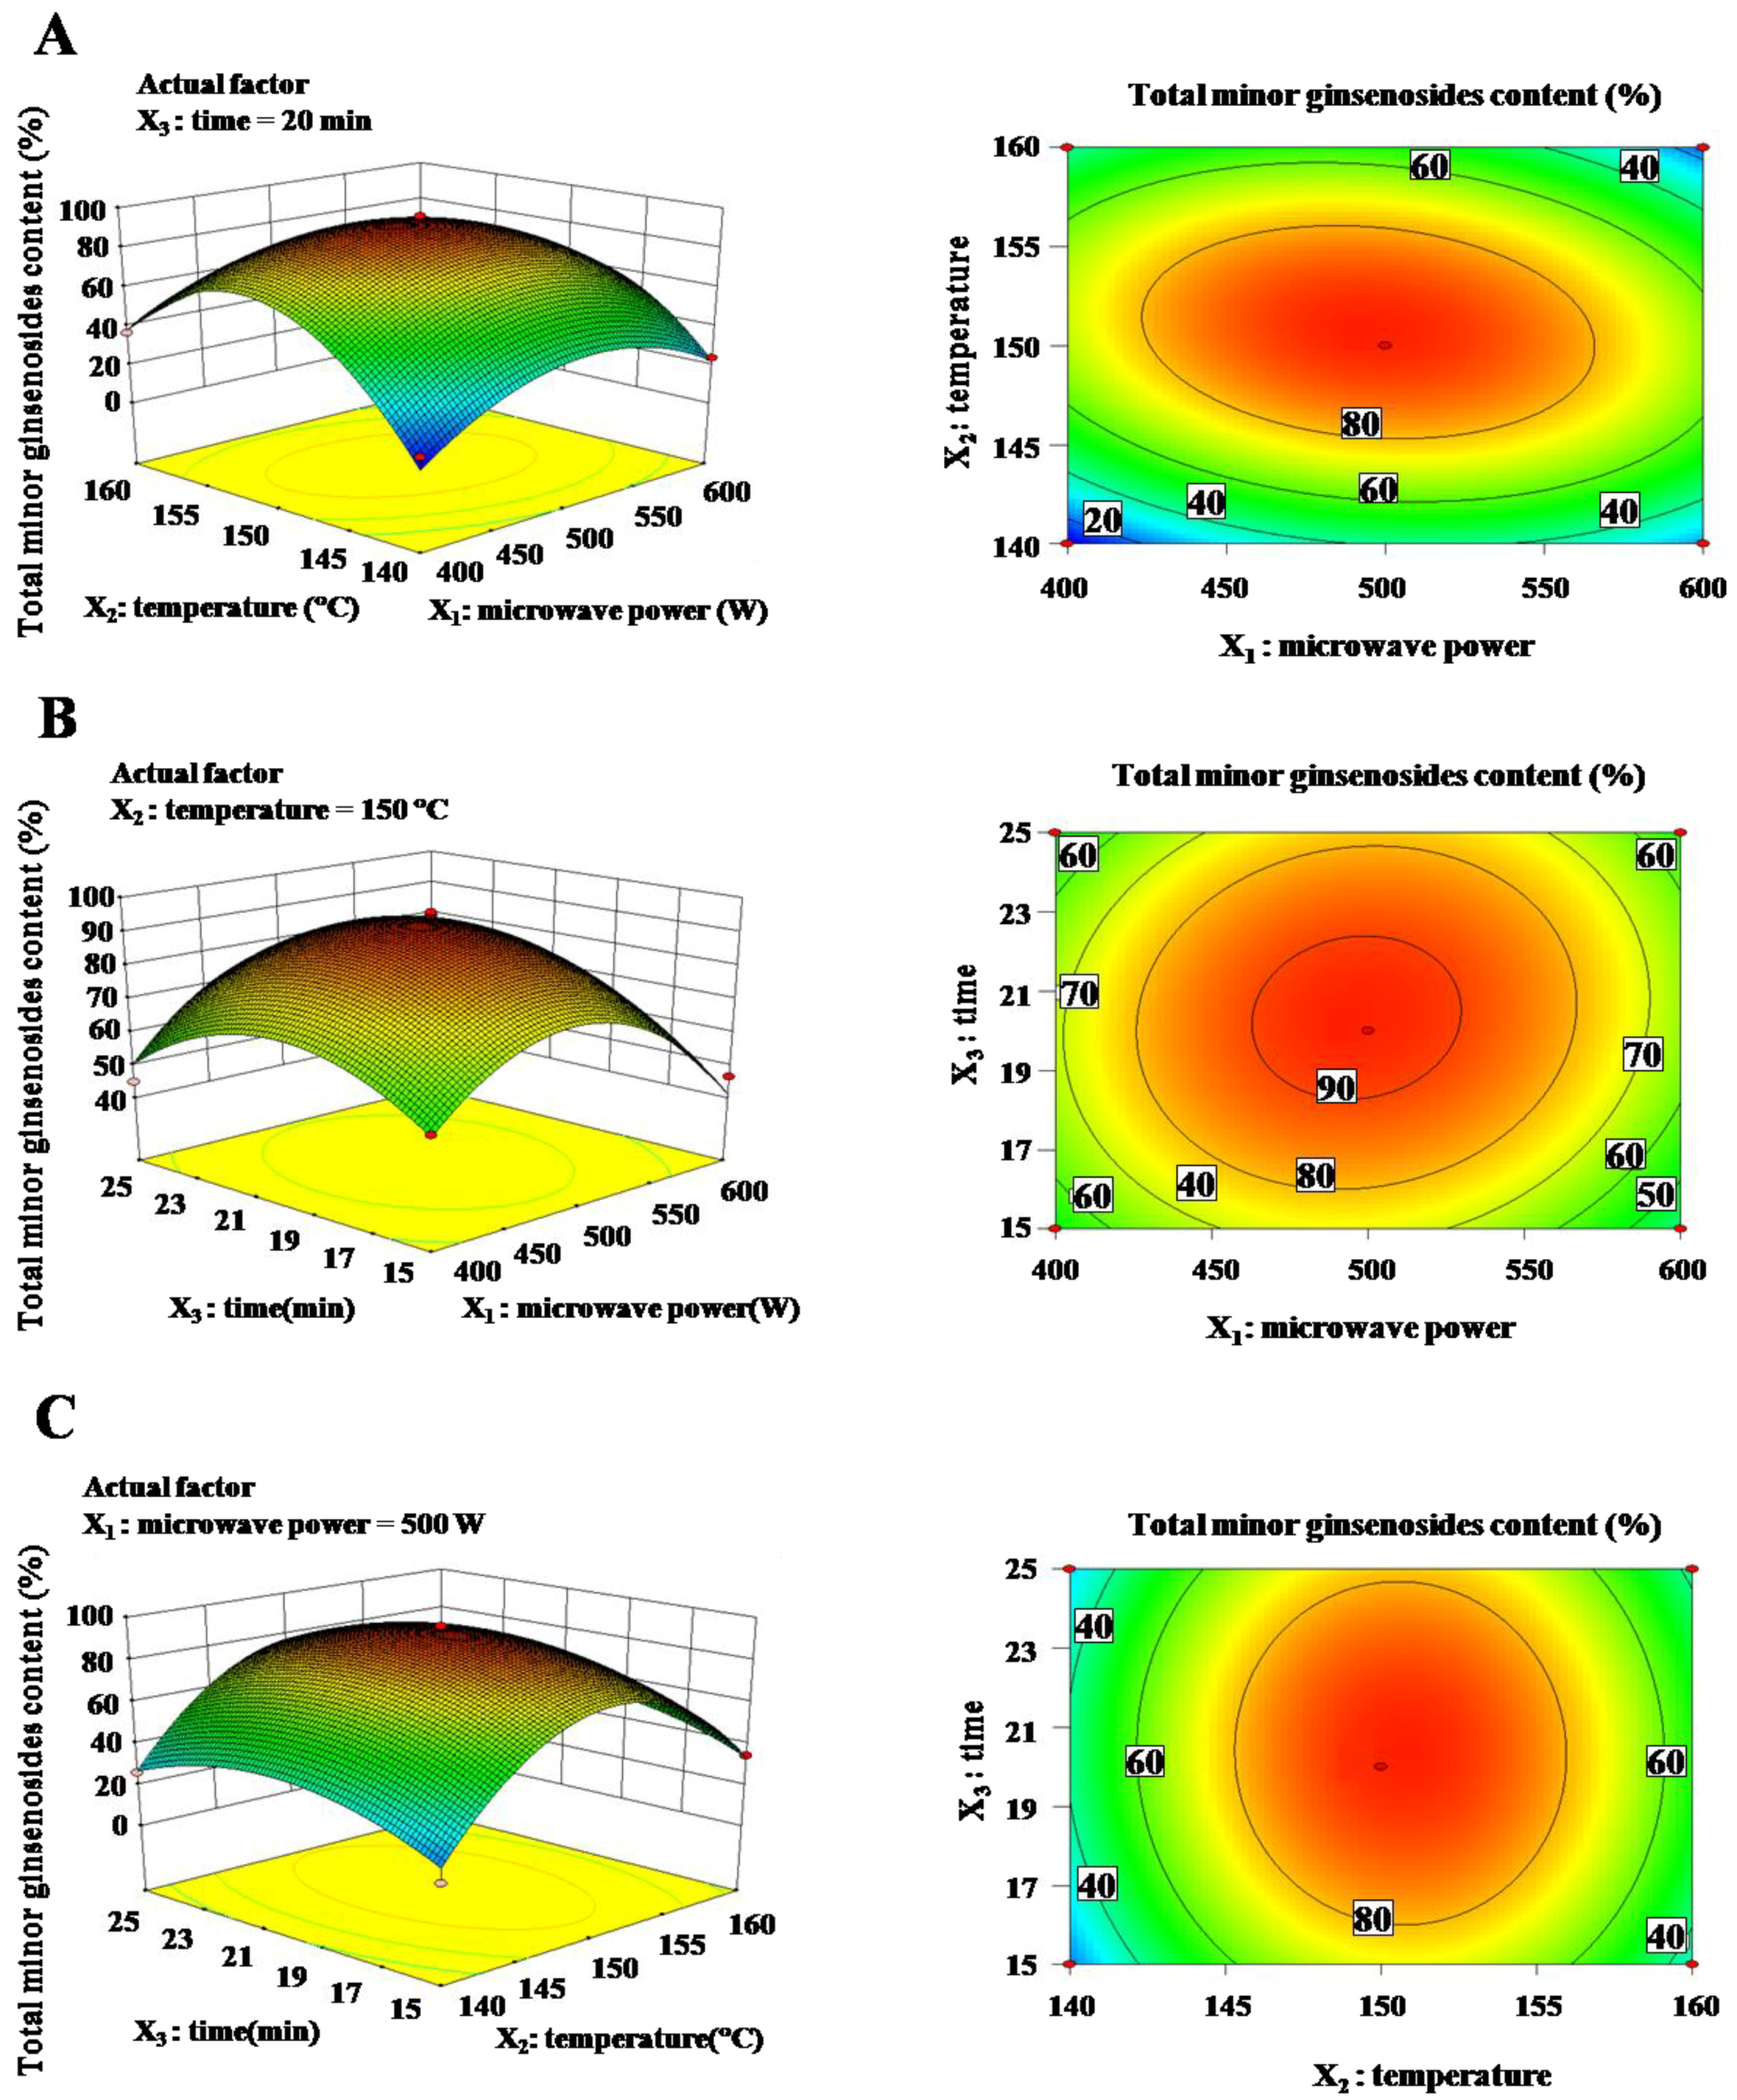
Figure 4.
Response surface plots and contour plots for production of the total minor ginsenosides using interaction of variables. (A) Effect of microwave power (X1) and temperature (X2) on total minor ginsenosides content (Y9) at time 20 min; (B) Effect of microwave power (X1) and time (X3) on total minor ginsenosides content (Y9) at temperature 150 °C; (C) Effect of temperature (X2) and time (X3) on total minor ginsenosides content (Y9) at microwave power 500 W.
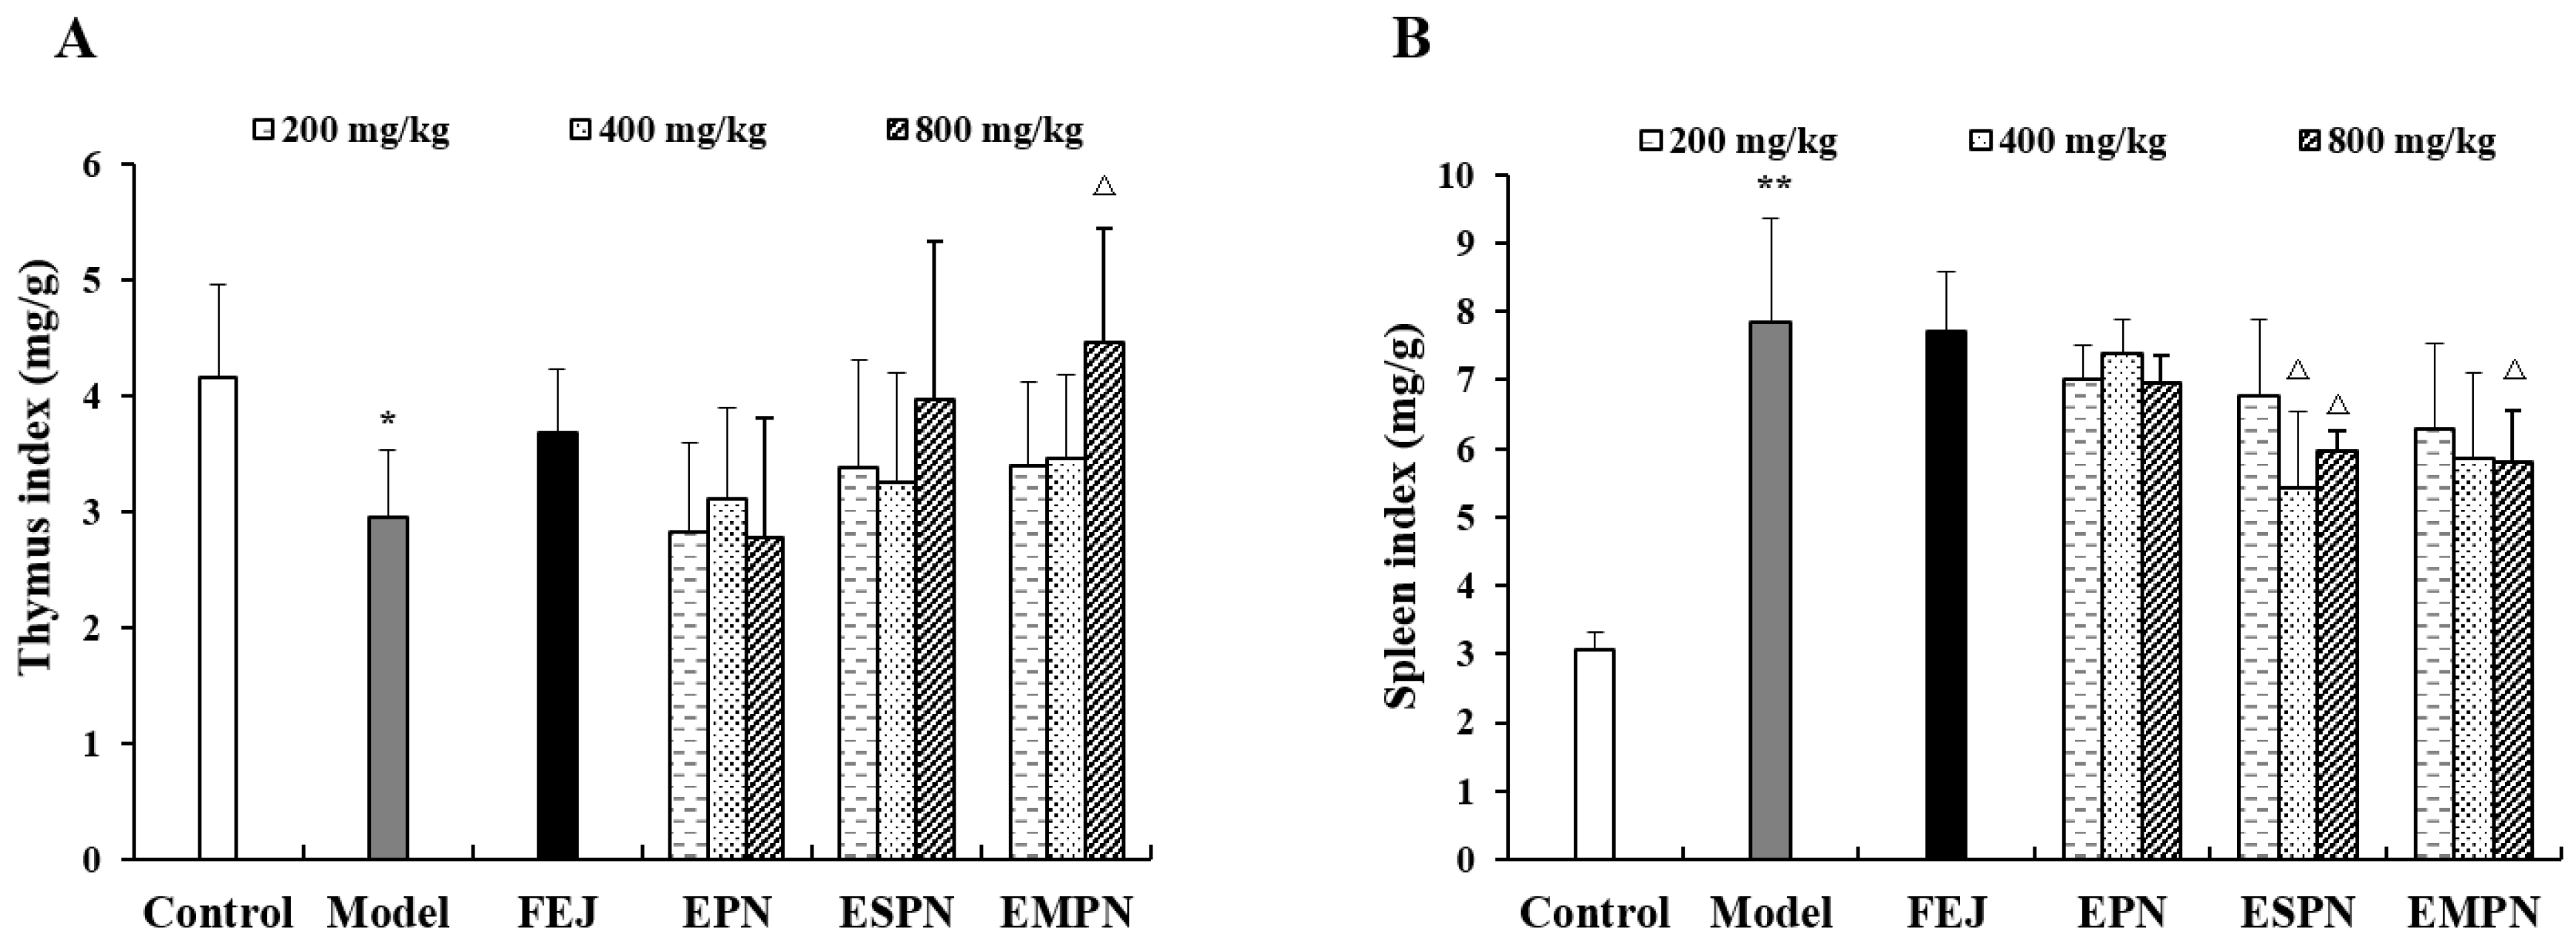
Figure 5.
Effect of raw notoginseng and processed notoginseng on thymus index (A) and spleen index (B) of blood deficiency model mice. FEJ, Fufang E’jiao Jiang; EPN, the extract of P. notoginseng; ESPN, the extract of steamed P. notoginseng; EMPN, the extract of microwave processed P. notoginseng. Data are expressed as mean ± s (n = 10 in group). Compared with the negative control group: * p < 0.05, ** p < 0.01; compared with the model group: Δ p < 0.05.
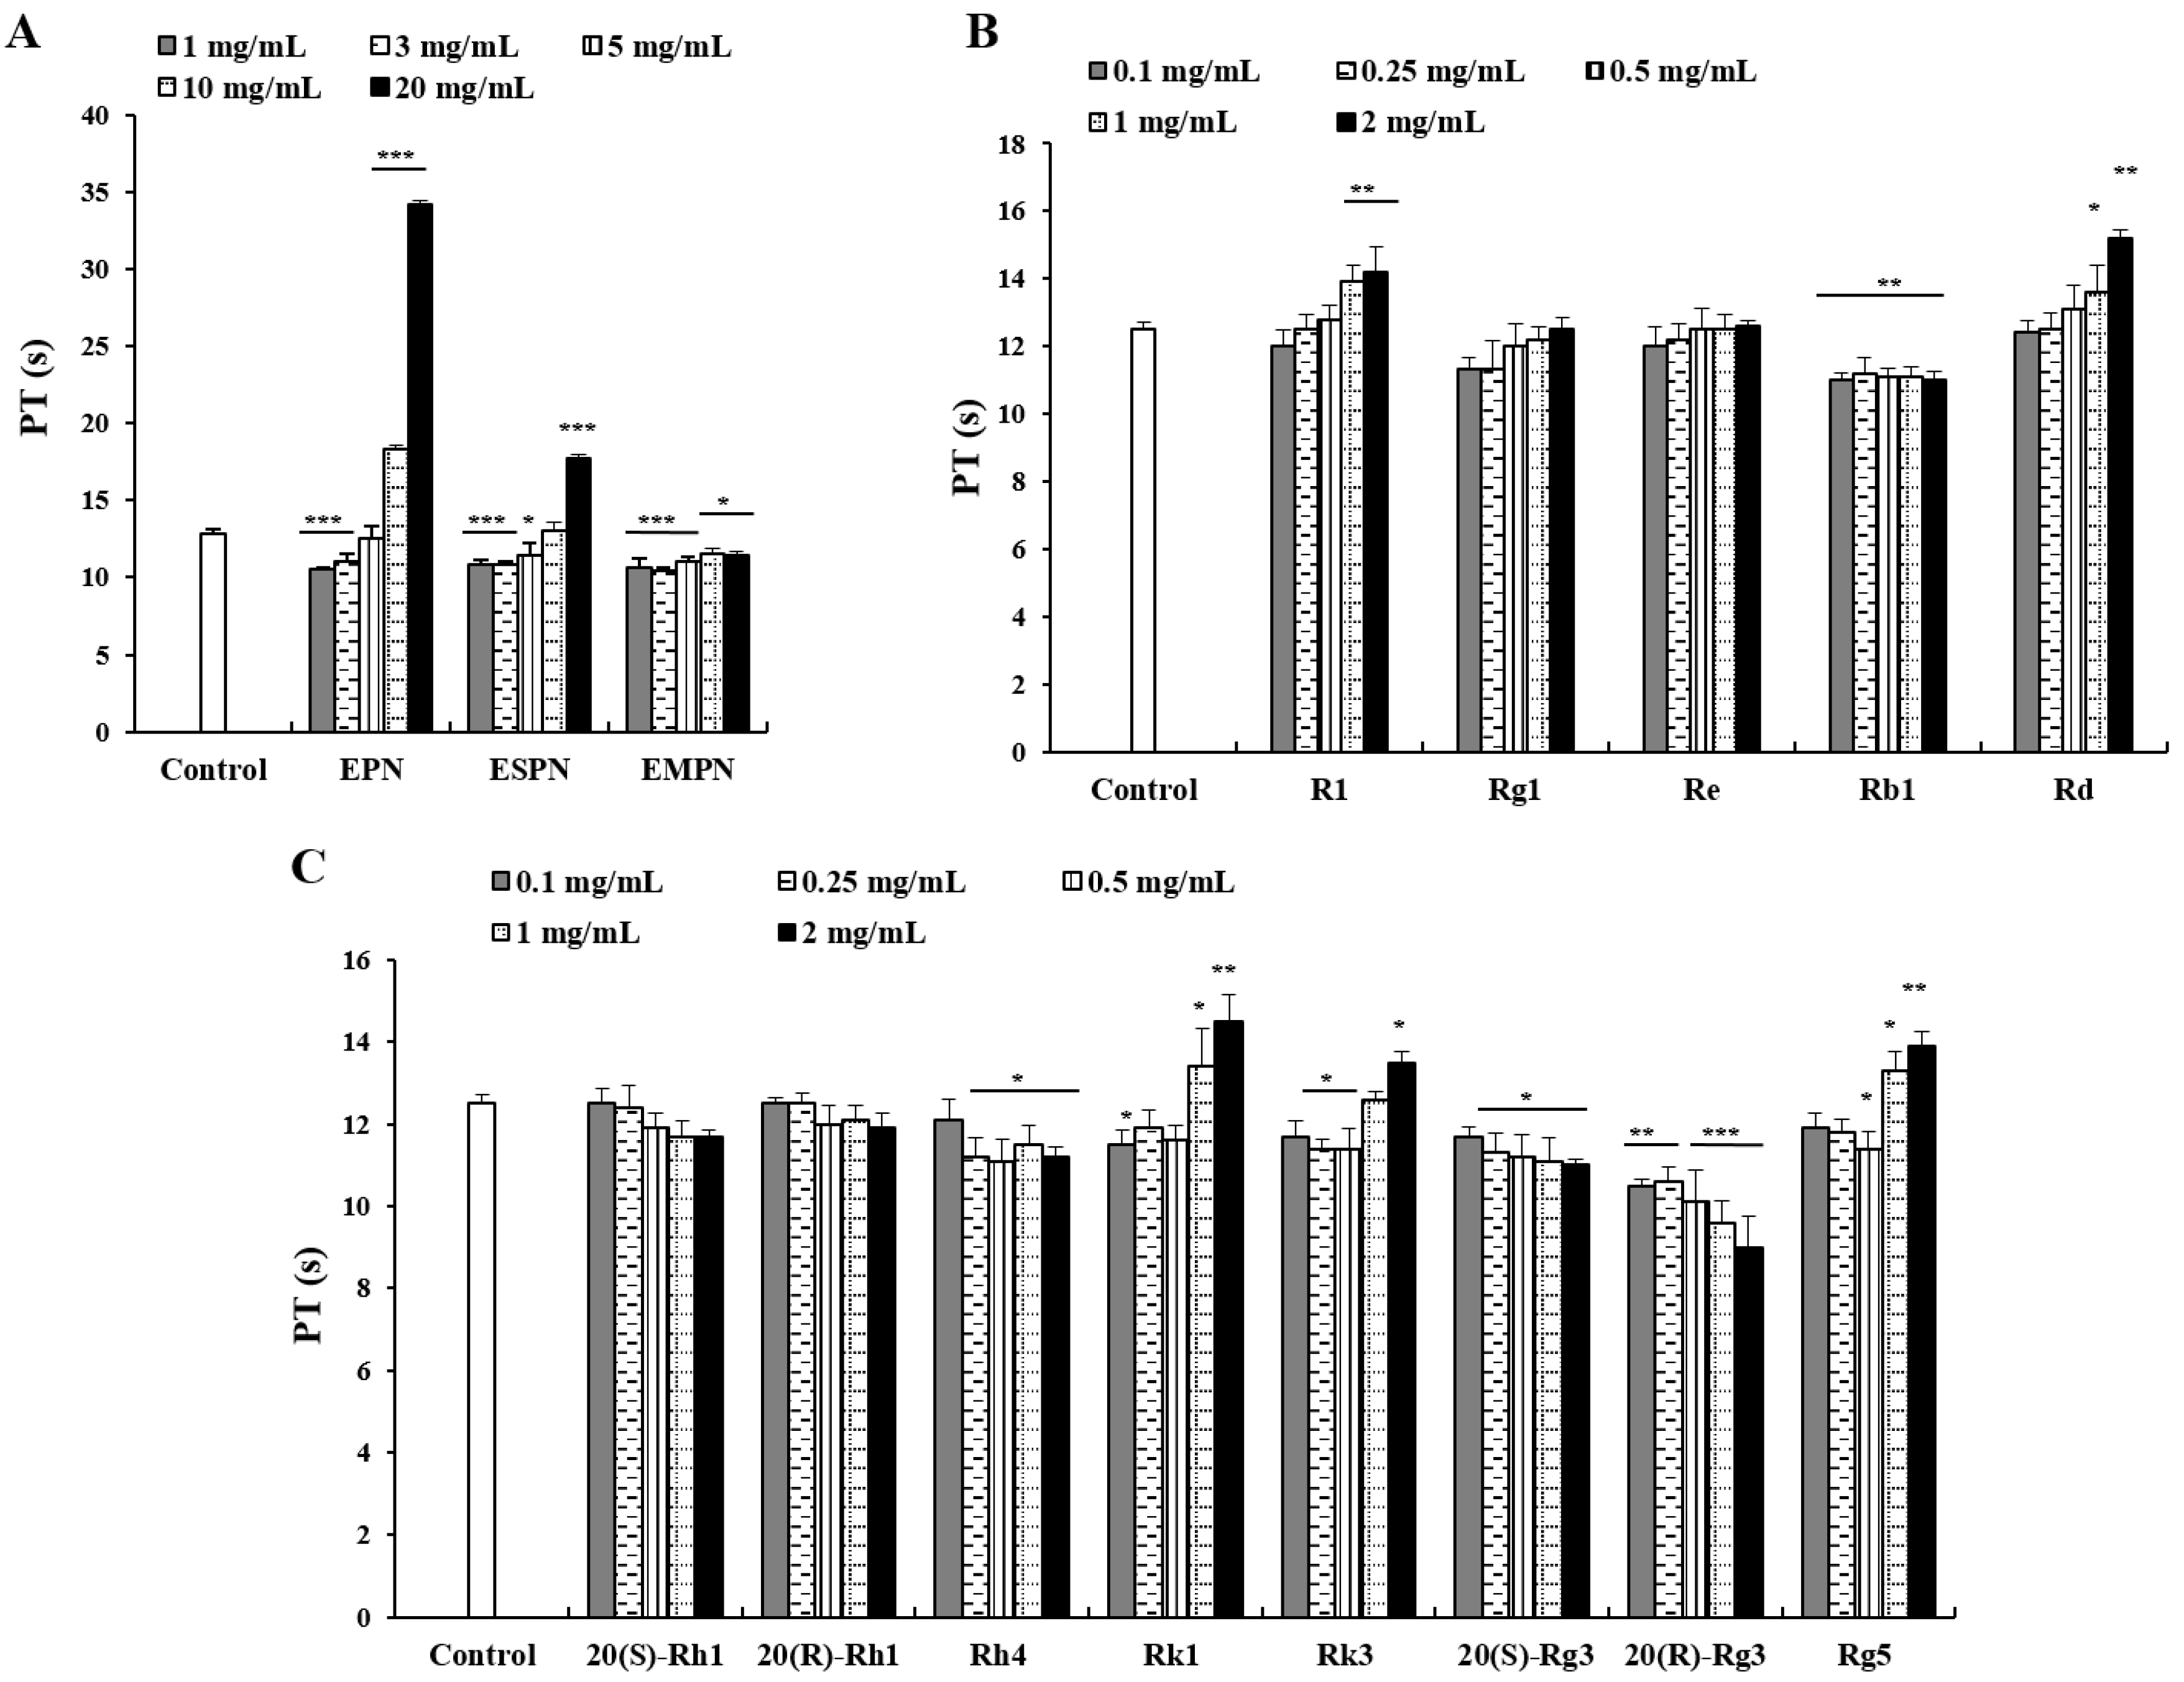
Figure 6.
Hemostatic activities of raw notoginseng and processed notoginseng. (A) PT assays of the extract of P. notoginseng (EPN), the extract of steamed P. notoginseng (ESPN) and the extract of microwave processed P. notoginseng (EMPN); (B) PT assays of ginsenosides Rg1, Re, Rb1, Rd and notoginsenoside R1; (C) PT assays of ginsenosides 20(S)-Rh1, 20(R)-Rh1, Rh4, Rk1, Rk3, 20(S)-Rg3, 20(R)-Rg3 and Rg5. Data are expressed as mean ± s (n = 3). Compared with the negative control group: * p < 0.05, ** p < 0.01, *** p < 0.001.
Table 1.
Experimental design factors and response values in Box-Behnken Design.
Table 1.
Experimental design factors and response values in Box-Behnken Design.
| No. | Independent Variables | Response Variables |
|---|
| Microwave Power (X1, W) | Temperature (X2, °C) | Time (X3, min) | 20(S)-Rh1 (Y1, %) | 20(R)-Rh1 (Y2, %) | Rk3 (Y3, %) | Rh4 (Y4, %) | 20(S)-Rg3 (Y5, %) | 20(R)-Rg3 (Y6, %) | Rk1 (Y7, %) | Rg5 (Y8, %) | Total Minor Ginsenosides (Y9 a, %) |
|---|
| 1 | 600 (1) | 150 (0) | 25 (1) | 8.49 | 4.23 | 3.89 | 13.31 | 2.87 | 1.17 | 7.63 | 10.85 | 52.45 |
| 2 | 500 (0) | 160 (1) | 25 (1) | 7.63 | 2.04 | 2.74 | 12.59 | 1.92 | 0.90 | 6.29 | 9.66 | 43.76 |
| 3 | 600 (1) | 160 (1) | 20 (0) | 0.86 | 1.29 | 0.87 | 1.07 | 1.35 | 0.90 | 0.77 | 1.04 | 8.14 |
| 4 | 400 (−1) | 140 (−1) | 20 (0) | 1.51 | 2.27 | 1.03 | 3.13 | 2.45 | 0.79 | 0.90 | 1.26 | 13.34 |
| 5 | 400 (−1) | 160 (1) | 20 (0) | 4.24 | 1.72 | 6.03 | 11.86 | 1.75 | 0.79 | 3.02 | 7.41 | 36.83 |
| 6 | 500 (0) | 160 (1) | 15 (−1) | 2.95 | 2.23 | 7.42 | 10.93 | 1.93 | 1.09 | 1.03 | 6.97 | 34.53 |
| 7 | 400 (−1) | 150 (0) | 25 (1) | 5.97 | 0.62 | 6.14 | 14.42 | 0.96 | 0.29 | 4.68 | 11.80 | 44.88 |
| 8 | 600 (1) | 140 (−1) | 20 (0) | 5.41 | 1.54 | 2.84 | 5.85 | 1.24 | 0.40 | 2.69 | 3.82 | 23.80 |
| 9 | 500 (0) | 150 (0) | 20 (0) | 14.25 | 7.00 | 14.76 | 24.22 | 6.51 | 3.65 | 12.20 | 13.01 | 95.61 |
| 10 | 500 (0) | 150 (0) | 20 (0) | 14.17 | 7.77 | 13.52 | 22.05 | 5.80 | 4.03 | 12.53 | 15.88 | 95.74 |
| 11 | 500 (0) | 150 (0) | 20 (0) | 15.76 | 7.17 | 15.80 | 20.73 | 6.12 | 4.28 | 9.85 | 14.97 | 94.67 |
| 12 | 500 (0) | 150 (0) | 20 (0) | 14.85 | 8.55 | 11.52 | 21.62 | 4.46 | 4.61 | 13.17 | 16.28 | 95.05 |
| 13 | 600 (1) | 150 (0) | 15 (−1) | 2.30 | 1.31 | 9.54 | 17.76 | 1.03 | 0.84 | 1.46 | 12.27 | 46.51 |
| 14 | 400 (−1) | 150 (0) | 15 (−1) | 7.69 | 3.75 | 7.26 | 12.55 | 2.81 | 3.79 | 6.44 | 8.82 | 53.12 |
| 15 | 500 (0) | 140 (−1) | 25 (1) | 1.63 | 0.83 | 6.07 | 8.91 | 1.05 | 1.24 | 0.73 | 5.69 | 26.15 |
| 16 | 500 (0) | 140 (−1) | 15 (−1) | 1.13 | 1.02 | 0.84 | 5.45 | 0.93 | 0.22 | 0.52 | 3.28 | 13.41 |
| 17 | 500 (0) | 150 (0) | 20 (0) | 13.06 | 5.21 | 10.17 | 17.74 | 4.92 | 4.92 | 11.48 | 15.44 | 82.93 |
Table 2.
Regression coefficients of second order polynomial for response variables.
Table 2.
Regression coefficients of second order polynomial for response variables.
| Variable | Coefficient (β) | p-Value a |
|---|
| Y1 | Y2 | Y3 | Y4 | Y5 | Y6 | Y7 | Y8 | Y9 | Y1 | Y2 | Y3 | Y4 | Y5 | Y6 | Y7 | Y8 | Y9 |
|---|
| Intercept | 14.42 | 7.14 | 13.15 | 21.27 | 5.56 | 4.29 | 11.85 | 15.12 | 92.8 | 0.0003 | 0.0027 | 0.004 | 0.0025 | 0.0023 | 0.0028 | 0.0002 | 0.0003 | <0.0001 |
| X1 | −0.29 | 0.0018 | −0.41 | −0.50 | −0.19 | −0.29 | −0.31 | −0.16 | −2.16 | 0.6100 | 0.9963 | 0.5849 | 0.6218 | 0.5094 | 0.2698 | 0.5068 | 0.7649 | 0.4236 |
| X2 | 0.75 | 0.20 | 0.78 | 1.64 | 0.16 | 0.13 | 0.78 | 1.38 | 5.82 | 0.2156 | 0.6135 | 0.3150 | 0.1316 | 0.5736 | 0.6211 | 0.1233 | 0.0338 | 0.0558 |
| X3 | 1.21 | −0.075 | −0.78 | 0.32 | 0.013 | −0.29 | 1.23 | 0.83 | 2.46 | 0.0645 | 0.8490 | 0.3187 | 0.7503 | 0.9628 | 0.2733 | 0.0283 | 0.1565 | 0.3654 |
| X12 | −1.82 | 0.075 | −1.74 | −3.38 | 0.20 | 0.12 | −1.01 | −2.23 | −9.79 | 0.0520 | 0.8924 | 0.1327 | 0.0417 | 0.6120 | 0.7345 | 0.1546 | 0.0194 | 0.0296 |
| X13 | 1.98 | 1.51 | −1.13 | −1.58 | 0.92 | 0.96 | 1.98 | −1.10 | 3.54 | 0.0386 | 0.0261 | 0.3052 | 0.2831 | 0.0457 | 0.0279 | 0.0166 | 0.1810 | 0.3567 |
| X23 | 1.04 | 0.0012 | −2.48 | −0.45 | −0.032 | −0.30 | 1.26 | 0.071 | −0.88 | 0.2223 | 0.9982 | 0.0463 | 0.7506 | 0.9362 | 0.4108 | 0.0860 | 0.9259 | 0.8141 |
| X11 | −4.32 | −2.24 | −4.01 | −5.38 | −1.70 | −1.46 | −3.55 | −3.60 | −26.25 | 0.0007 | 0.0037 | 0.0051 | 0.0048 | 0.0025 | 0.0036 | 0.0007 | 0.0016 | 0.0001 |
| X22 | −7.09 | −3.19 | −6.45 | −10.42 | −2.16 | −2.12 | −6.45 | −8.13 | −46.03 | <0.0001 | 0.0005 | 0.0003 | 0.0001 | 0.0006 | 0.0004 | <0.0001 | <0.0001 | <0.0001 |
| X33 | −3.99 | −2.42 | −2.44 | −1.38 | −1.94 | −1.31 | −3.25 | −0.58 | −17.31 | 0.0012 | 0.0024 | 0.0448 | 0.3303 | 0.0012 | 0.0060 | 0.0012 | 0.4467 | 0.0017 |
Table 3.
ANOVA for response surface quadratic model analysis.
Table 3.
ANOVA for response surface quadratic model analysis.
| Variable | Degree of Freedom | Sum of Squares |
|---|
| Y1 | Y2 | Y3 | Y4 | Y5 | Y6 | Y7 | Y8 | Y9 |
|---|
| Model a | 9 | 445.35 | 108.39 | 346.55 | 707.60 | 57.37 | 44.58 | 344.40 | 399.30 | 15,109.32 |
| Residual | 7 | 17.00 | 8.10 | 29.39 | 51.59 | 4.04 | 3.38 | 11.22 | 15.35 | 361.53 |
| Lack of fit b | 3 | 13.09 | 1.97 | 8.12 | 29.36 | 1.14 | 2.40 | 4.77 | 8.85 | 239.01 |
| Pure error | 4 | 3.91 | 6.13 | 21.27 | 22.23 | 2.90 | 0.97 | 6.45 | 6.49 | 122.52 |
| Correct total | 16 | 462.35 | 116.49 | 375.94 | 759.19 | 61.40 | 47.95 | 355.62 | 414.65 | 15,470.85 |
| R-Squared | | 0.9632 | 0.9305 | 0.9218 | 0.9320 | 0.9342 | 0.9296 | 0.9684 | 0.9630 | 0.9766 |
| Adj R-Squared | | 0.9160 | 0.8411 | 0.8213 | 0.8447 | 0.8497 | 0.8391 | 0.9279 | 0.9154 | 0.9466 |
Table 4.
Optimum conditions for maximum 20(S)-Rh1 content, 20(R)-Rh1 content, Rk3 content, Rh4 content, 20(S)-Rg3 content, 20(R)-Rg3 content, Rk1 content, Rg5 content and total minor ginsenosides content.
Table 4.
Optimum conditions for maximum 20(S)-Rh1 content, 20(R)-Rh1 content, Rk3 content, Rh4 content, 20(S)-Rg3 content, 20(R)-Rg3 content, Rk1 content, Rg5 content and total minor ginsenosides content.
| Response Variables (Yi) | Microwave Power (X1, W) | Temperature (X2, °C) | Time (X3, min) | Content (%) |
|---|
| 20(S)-Rh1 (Y1) | 498.80 | 150.66 | 20.79 | 14.54 |
| 20(R)-Rh1 (Y2) | 499.52 | 150.31 | 19.91 | 7.14 |
| Rk3 (Y3) | 495.36 | 151.07 | 18.98 | 13.28 |
| Rh4 (Y4) | 490.33 | 150.91 | 20.78 | 21.39 |
| 20(S)-Rg3 (Y5) | 494.40 | 150.34 | 19.95 | 5.57 |
| 20(R)-Rg3 (Y6) | 484.35 | 150.38 | 19.13 | 4.35 |
| Rk1 (Y7) | 500.13 | 150.81 | 21.03 | 12.00 |
| Rg5 (Y8) | 480.22 | 151.16 | 24.55 | 15.59 |
| Total minor ginsenosides (Y9) | 495.03 | 150.68 | 20.32 | 93.13 |
Table 5.
Method validation.
Table 5.
Method validation.
| Compounds | Calibration Curve | R2 | Linear Range (mg/mL) | Precision (RSD, %) | Stability (RSD, %) | Repeatability (RSD, %) | Recovery (mean ± s, %) |
|---|
| 20(S)-ginsenoside Rh1 | y = 1,000,000x + 52,373 | 0.9998 | 0.02–3.20 | 0.89 | 3.65 | 3.58 | 102.16 ± 2.46 |
| 20(R)-ginsenoside Rh1 | y = 2,000,000x + 154,738 | 0.9994 | 0.02–3.20 | 0.79 | 2.58 | 3.26 | 101.58 ± 3.11 |
| ginsenoside Rk3 | y = 1,000,000x + 22,910 | 0.9999 | 0.08–6.40 | 0.36 | 2.45 | 3.31 | 105.25 ± 3.24 |
| ginsenoside Rh4 | y = 826,150x − 23,734 | 0.9996 | 0.16–9.60 | 0.45 | 2.69 | 3.24 | 101.78 ± 2.58 |
| 20(S)-ginsenoside Rg3 | y = 1,000,000x + 9671.9 | 0.9999 | 0.01–3.20 | 0.48 | 2.16 | 3.83 | 108.48 ± 3.64 |
| 20(R)-ginsenoside Rg3 | y = 2,000,000x + 65,498 | 0.9996 | 0.005–1.60 | 0.46 | 2.28 | 3.34 | 104.15 ± 2.64 |
| ginsenoside Rk1 | y = 1,000,000x + 14881 | 0.9997 | 0.08–6.40 | 0.52 | 3.97 | 3.86 | 103.78 ± 2.89 |
| ginsenoside Rg5 | y = 301,295x − 8602.8 | 0.9997 | 0.08–6.40 | 0.85 | 3.41 | 4.46 | 105.89 ± 3.66 |
Table 6.
Effect of raw notoginseng and processed notoginseng on peripheral blood index of blood deficiency mice (x ± s, n = 10).
Table 6.
Effect of raw notoginseng and processed notoginseng on peripheral blood index of blood deficiency mice (x ± s, n = 10).
| Group | Dose (mg/kg) | WBC (109/L) | RBC (1012/L) | HGB (g/L) | HCT (%) |
|---|
| Control | | 7.62 ± 0.66 | 7.11 ± 0.68 | 146.8 ± 4.98 | 33.77 ± 2.36 |
| Model | | 4.38 ± 0.66 △△△ | 5.77 ± 0.58 △△ | 96.2 ± 4.11 △△△ | 30.4 ± 1.37 △ |
| FEJ | 10 | 5.45 ± 0.42 ** | 6.81 ± 0.63 * | 128.67 ± 8.35 *** | 31.07 ± 1.56 |
| EPN | 200 | 4.2 ± 0.18 | 4.54 ± 1.18 | 103.18 ± 8.18 | 30.33 ± 3.78 |
| 400 | 4.12 ± 0.08 | 4.76 ± 0.85 | 107.52 ± 6.96 | 30.92 ± 1.31 |
| 800 | 4.07 ± 0.42 | 5.03 ± 1.61 | 111.47 ± 14.87 | 31.63 ± 1.11 |
| ESPN | 200 | 4.35 ± 0.34 | 4.97 ± 0.69 | 102.47 ± 18.16 | 30.12 ± 2.12 |
| 400 | 5.38 ± 0.26 ** | 5.93 ± 0.66 | 124.08 ± 10.7 *** | 30.58 ± 2.62 |
| 800 | 7.10 ± 0.97 *** | 6.63 ± 0.83 | 128.86 ± 16.01 *** | 32.3 ± 3.14 |
| EMPN | 200 | 4.16 ± 0.09 | 4.65 ± 0.43 | 102.94 ± 6.66 | 30.74 ± 0.82 |
| 400 | 5.65 ± 0.23 ** | 5.24 ± 0.76 | 105.68 ± 14.11 | 30.27 ± 1.48 |
| 800 | 5.55 ± 0.39 ** | 5.59 ± 0.35 | 115.63 ± 6.52 *** | 32.22 ± 2.67 |


