Article

Salvia castanea Hairy Roots are More Tolerant to Phosphate Deficiency than Salvia miltiorrhiza Hairy Roots Based on the Secondary Metabolism and Antioxidant Defenses

1
College of Life Science, Northwest A&F University, Yangling 712100, China
2
School of Life Science, Zhejiang Sci-Tech University, Hangzhou 310018, China
3
Institute of Soil and Water Conservation, CAS & MWR, Yangling 712100, China
*
Author to whom correspondence should be addressed.
Molecules 2018, 23(5), 1132; https://doi.org/10.3390/molecules23051132
Submission received: 21 March 2018 / Revised: 6 May 2018 / Accepted: 6 May 2018 / Published: 10 May 2018
(This article belongs to the Section Metabolites)

Abstract

:
Salvia miltiorrhiza is a well-known traditional Chinese herb which is used to treat heart disease. Salvia castanea is a substitute product for S. miltiorrhiza in the medicinal field. Previous study has shown that phosphate (Pi) deficiency could promote the accumulation of secondary metabolism in herbs, and it has also developed a strategy for saving Pi resources and increasing the yield of active substances in herbs. In the present study, the hairy roots of S. miltiorrhiza and S. castanea were used to identify the Pi deficiency response mechanisms of these two Salvia species. The results showed that Pi deficiency increased the accumulation of specifically secondary metabolites, such as phenolic acids and tanshinones, which were caused by promoting the expression levels of key enzyme genes. In addition, Pi deficiency promoted the antioxidant activity in these two Salvia species. The data demonstrated that Pi deficiency increased the quality of the medicinal material in the plant. The hairy roots of S. castanea were more adaptive to Pi deficiency than those of S. miltiorrhiza in terms of biomass, secondary metabolism, and antioxidant activity. The results of this study provide insights into breeding herbs that are better adapted to Pi deficiency, which could increase the yield of active ingredients in herbs and save Pi resources.

1. Introduction

Phosphorus is an essential nutrient for the growth and development of plants. However, only 20–50% of total soil phosphorus is available as inorganic phosphate (Pi) and the rest is converted to organic compounds, which are insoluble and unavailable to plants, leading to Pi starvation around the world [1,2,3,4]. Plants have evolved a series of adaptive responses to cope with Pi limitations: the symbiotic association with arbuscular mycorrhiza to enhance the Pi utilization rate; the increase in lateral roots; and root hairs to augment the Pi uptake area for acquiring more Pi from the environment [5,6]. This adaptive strategy is beneficial when breeding herbs whose roots are used as medicine.
Metabolic changes are also critical for plants’ adaptation to Pi deficiency [7]. The primary metabolism remodeling is a well-studied metabolic adaptation to low-Pi stress in plants [8]. Genes and enzymes involved in primary sugar and lipid metabolism bypasses are strongly induced during prevailing Pi deficiency, and these metabolic adaptations serve to improve Pi acquisition from the soil and promote Pi use efficiency [9,10]. Secondary metabolism—which evolved from primary metabolism and plays a role in the interactions between plants and their environment—is also induced by a low-Pi condition [7]. The accumulation of anthocyanin in modern plants and active medicinal ingredients in herbs are promoted by Pi deficiency [11,12,13]. This adaptive strategy enables the breeding of Pi high-efficiency herbs, whose secondary metabolism has a huge medicinal value.
The dried roots of Salvia miltiorrhiza Bunge have been used for the treatment of myocardial infarction, heart disease, and cerebrovascular diseases [14,15]. The major active compounds in S. miltiorrhiza are phenolic acids (such as caffeic (CA), salvianolic B (LAB), and rosmarinic acids (RA)) and tanshinones (such as tanshinone I (TI), tanshinone IIA (IIA), dihydrotanshinone I (DT), and cryptotanshinone (CT)) [16]. Improving the production of these compounds and finding substitute products are critical due to the low amounts normally found in S. miltiorrhiza [16]. Salvia castanea Diels f. tomentosa Stib is a sibling species of S. miltiorrhiza. S. castanea has the same bioactive tanshinones and phenolic acids as S. miltiorrhiza and served as a substitute product of S. miltiorrhiza for the therapy of diseases. S. castanea can grow at an elevation of 2500–3750 m in a harsh environment, which indicates that S. castanea has more sophisticated mechanisms to adapt to various stresses [17].
In Salvia, phenolic acids are mainly synthesized by the phenylpropanoid and tyrosine-derived pathways. Phenylalanine ammonia lyase (PAL) and tyrosine aminotransferase (TAT) are the rate-limiting enzymes in these pathways, respectively. Rosmarinic acid synthase (RAS) and cytochrome P450-dependent monooxygenase (CYP98AH14) are the key enzymes in the downstream of phenolic acid biosynthesis [18]. Tanshinones are mainly synthesized by the mevalonate (MVA) and 2-C-methyl-d-erythritol-4-phosphate (MEP) pathways. DSX1 (1-deoxy-d-xylulose) and 3-hydroxy-3-methylglutary CoA reductase (HMGR) are the rate-limiting enzymes in these pathways, respectively. Kaurene synthase-like (KSL) and CYP76AH3 are the key enzymes in the downstream of tanshinones biosynthesis [19]. The expressions levels of the genes encoding these key enzymes may suggest changes in enzyme/protein abundance and activities, and then influence the rate of synthesis of phenolic acids and tanshinones to some extent [19,20]. A previous study showed that Pi deficiency could promote the accumulation of phenolic acids in S. miltiorrhiza [21]. However, the effect of Pi deficiency on tanshinones biosynthesis, the effect of Pi deficiency on the expression levels of key enzyme genes, and the differences between the adaptive mechanisms of S. miltiorrhiza and S. castanea remain to be determined.
Genes involved in secondary metabolism fall into the late transcriptional phosphate starvation-inducible (PSI) genes, and the genes encoding the SPX (Syg1-Pho81-Xpr1) domain-containing proteins are the early PSI genes [7]. SPX senses low-Pi stress and activates Pi deficiency responses by regulating some late transcriptional PSI genes [5,22,23]. The expression level of SPX reflects the response to Pi deficiency to a degree. To investigate the differences between the adaptive mechanisms of S. miltiorrhiza and S. castanea in response to Pi deficiency, the Pi concentration and expression level of SPX were measured.
Environmental changes contribute to the differences in antioxidant activity of medicinal plants, the rich antioxidant activity can significantly affect their effectiveness as medicines and functional food supplements [24,25]. Therefore, antioxidant activity should be regarded as an additional health-promoting property of phytonutrients [26]. Both phenolic acids and tanshinones provide important sources of antioxidants [26,27]. Few reports are available on the relationship between Pi deficiency and antioxidant activity in herbs.
Hairy root cultures provide a rapid and simplified system, and represent a traditional approach for the development and study of the secondary metabolism in medicinal plants [28]. In the present study, S. miltiorrhiza and S. castanea hairy roots were used as material. The present study aims to clarify the effect of Pi deficiency on the production of secondary metabolism and antioxidant activity in Salvia, and identify differences in the Pi-deficient response mechanisms of S. miltiorrhiza hairy roots and S. castanea hairy roots.

2. Results and Discussion

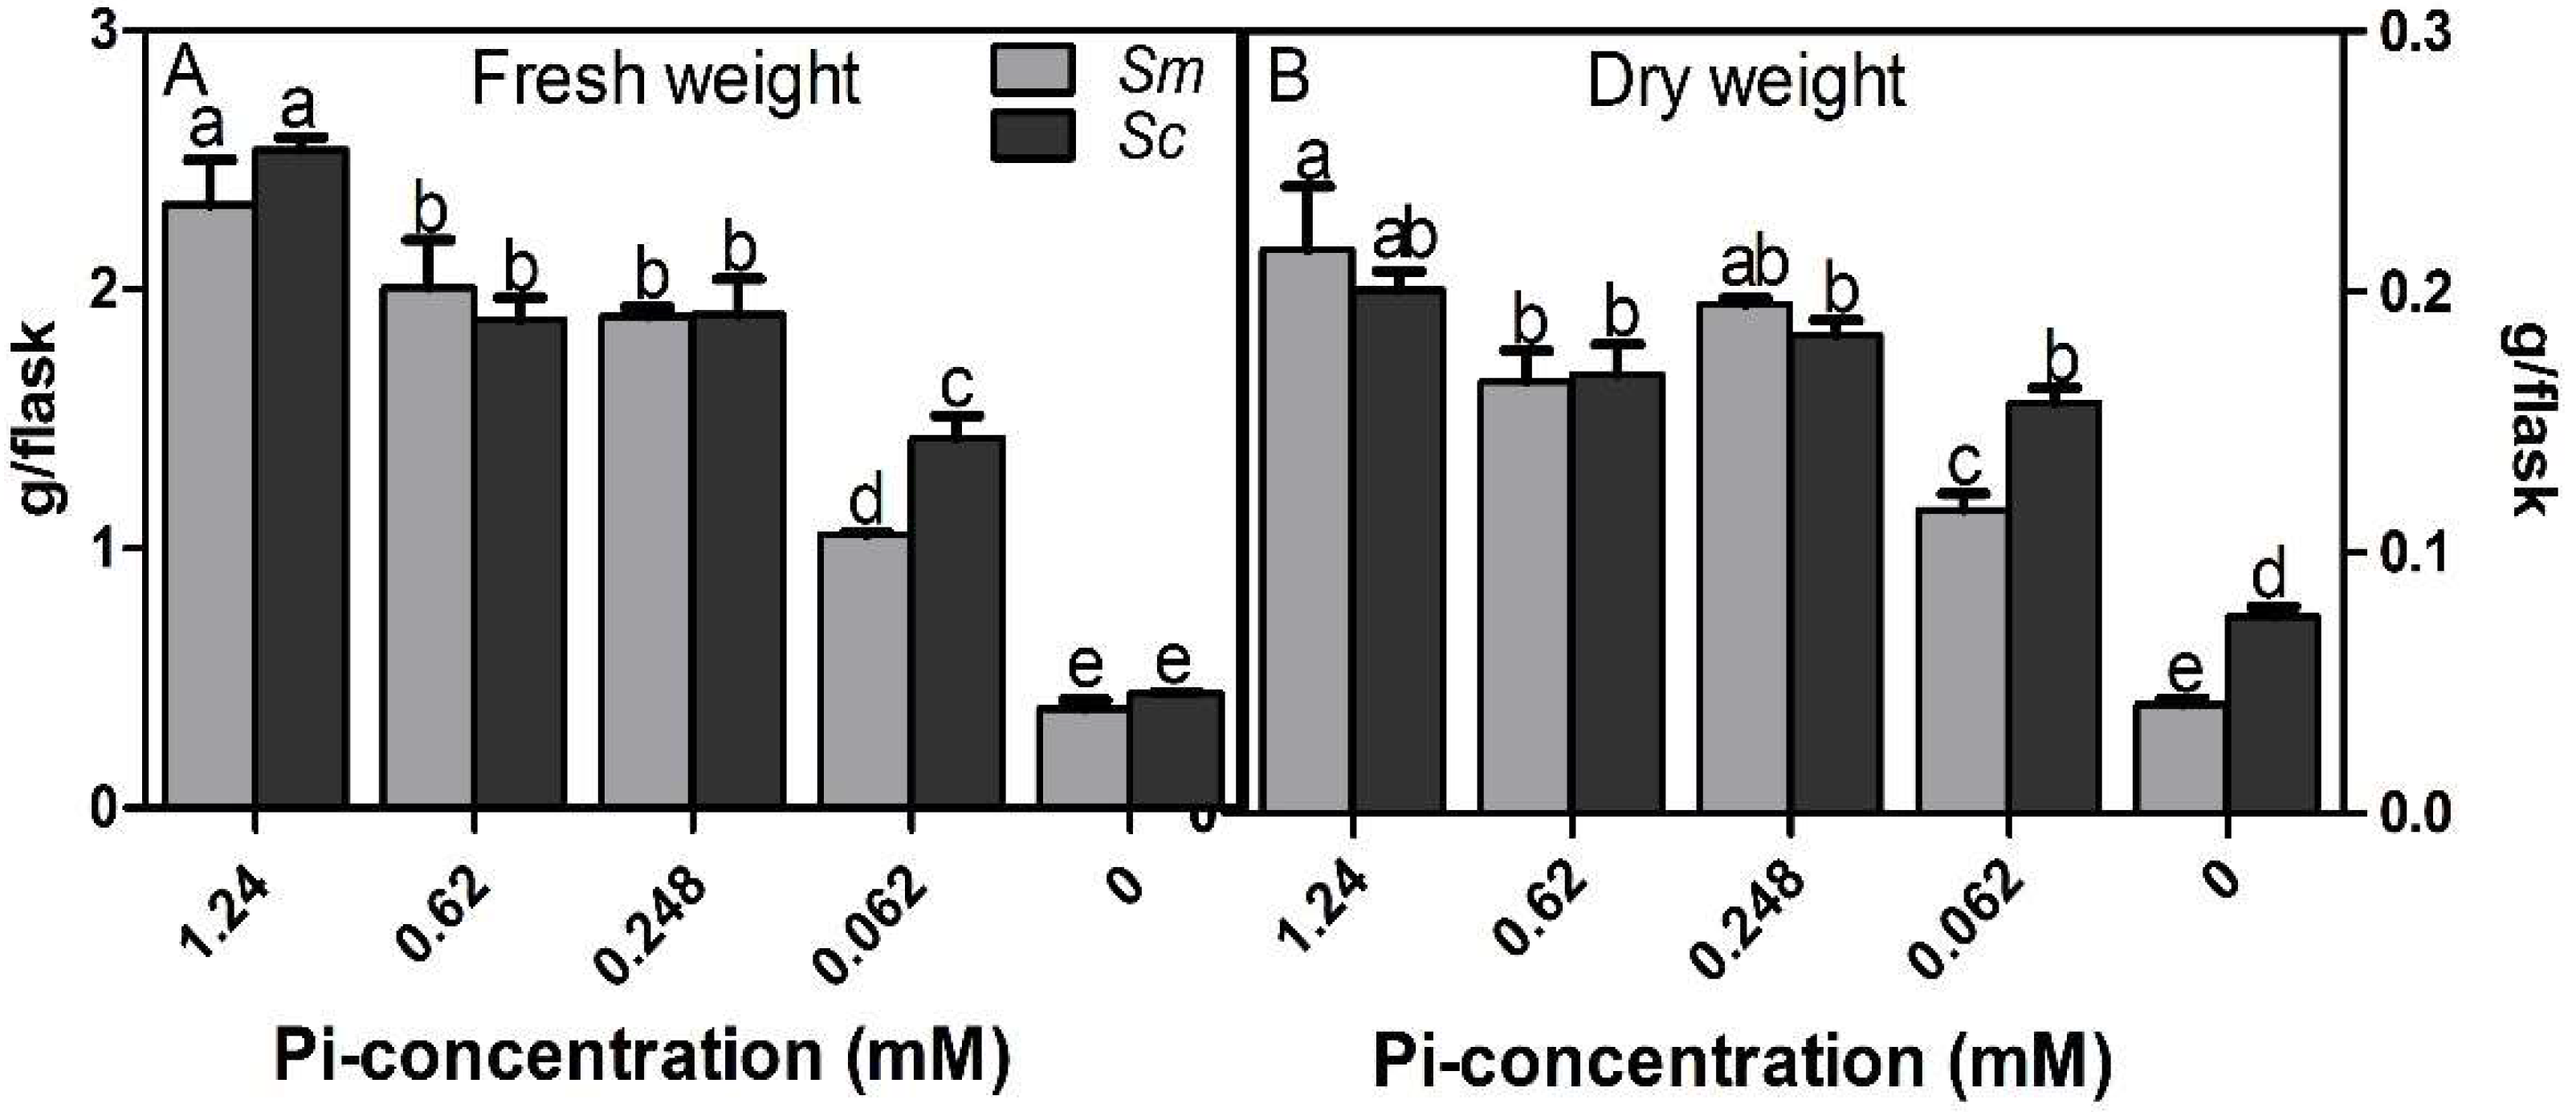
2.1. Biomass of Hairy Roots under Different Pi Concentrations

As shown in Figure 1, the biomass of S. miltiorrhiza hairy roots and S. castanea hairy roots were affected by the different Pi dosages (p < 0.05). The fresh weight decreased significantly as the Pi concentration decreased, especially in the 0 mM Pi condition (Figure 1A). The dry weight of S. castanea hairy roots was minimally influenced by Pi dosages, except for the 0 mM condition. However, the dry weight of S. miltiorrhiza hairy roots was decreased significantly in the 0.062 mM and 0 mM Pi conditions (Figure 1B).
Low Pi availability stimulates root hair elongation in many plants [6,29], which could present an opportunity for plants whose roots are used medicinally, such as the well-known herbs S. miltiorrhiza and S. castanea [30,31]. In this study, the dry weight of the hairy roots did not significantly decrease following the treatment of S. miltiorrhiza with 0.248–1.24 mM Pi or S. castanea with 0.062–1.24 mM Pi (Figure 1). The lack of change in dry weight could arise because Pi deficiency may diminish some physiological activity, such as the inhibition of primary root growth [32]. However, plants can enhance their lateral root and root hair production to increase Pi uptake as an adaptive response to the deficiency [7,33]. As a result, these two factors could have balanced each other out and prevented difference in dry weight at different Pi levels. The biomass of S. castanea hairy roots showed less change than that of S. miltiorrhiza hairy roots, especially for the dry weight.

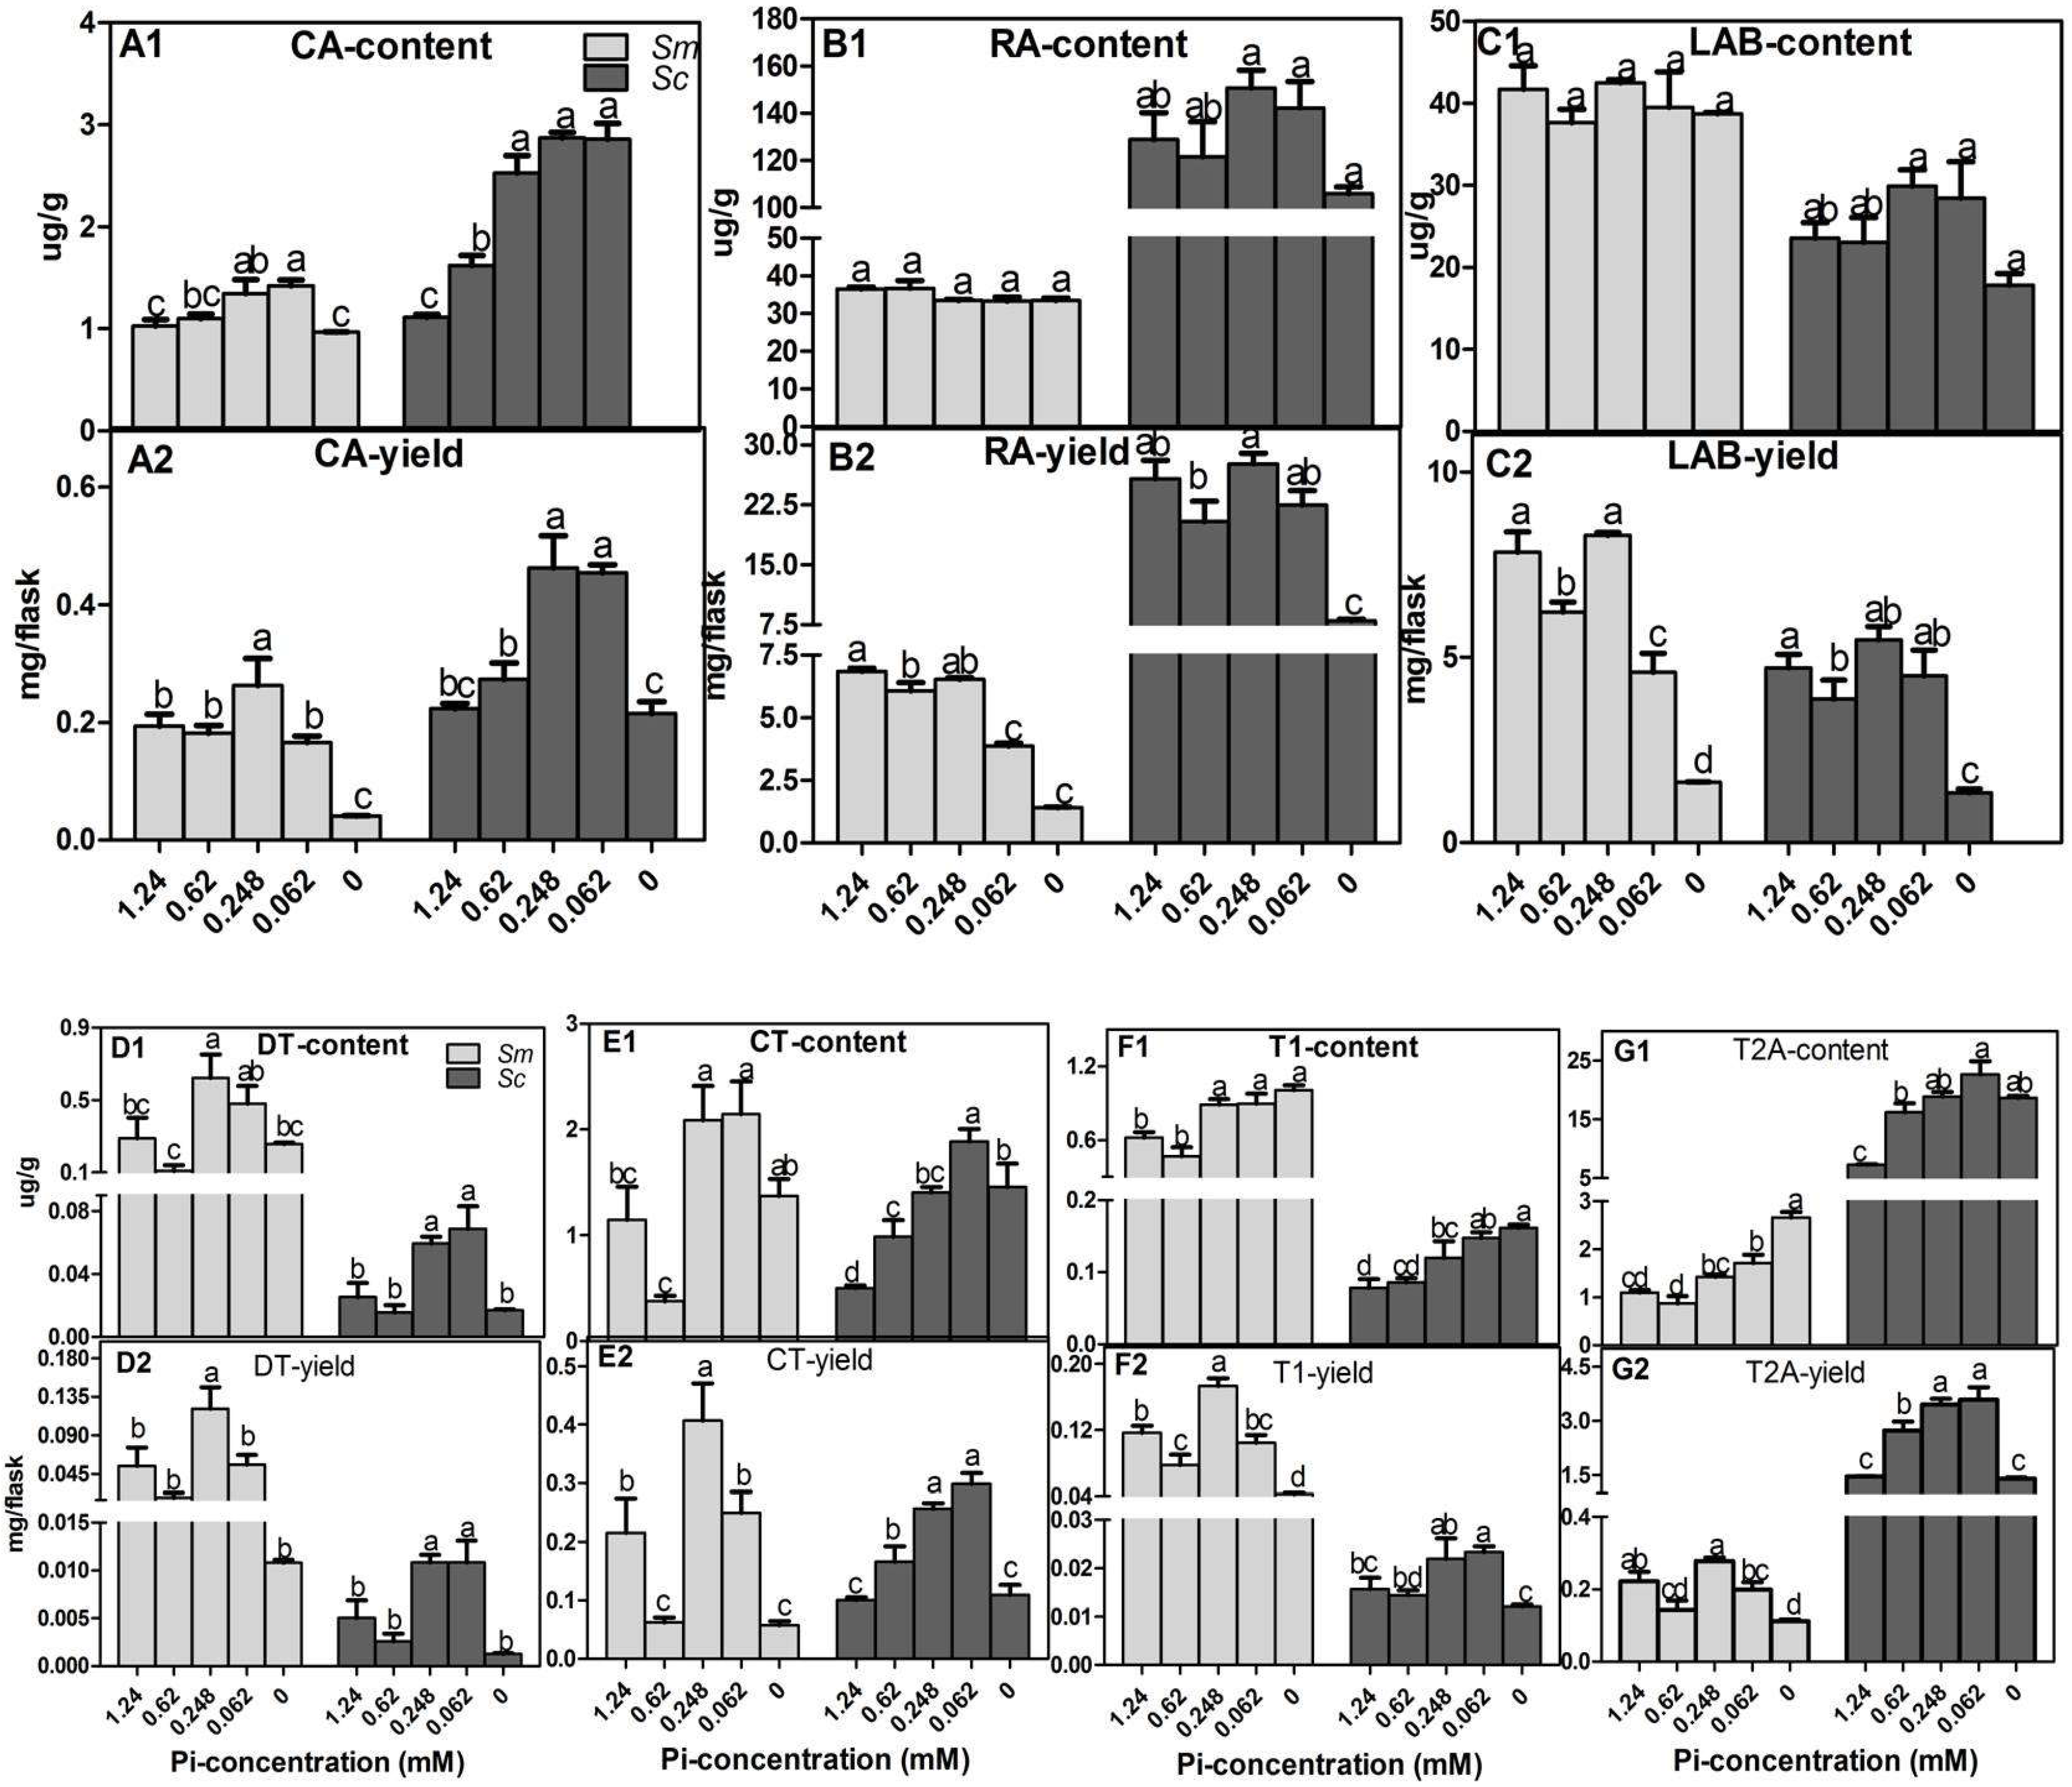
2.2. Effects of Pi Deficiency on the Content and Yields of Specialized Metabolites in Hairy Roots

The secondary metabolites, including three phenolic acids (CA, RA, LAB) and four tanshinones (DT, CT, TI, T2A), were measured. In the 1.24 mM Pi treatment (control group), S. miltiorrhiza accumulated higher levels of LAB (Figure 2C), DT (Figure 2D), and TI (Figure 2F) but had lower levels of CA (Figure 2A), RA (Figure 2B), and T2A (Figure 2G) than those of S. castanea, which agrees with our previous work [30,34].
Pi deficiency had minimal effects on the accumulation of RA and LAB in both Salvia species (Figure 2B,C). However, the accumulation of CA (Figure 2A) and four tanshinones (Figure 2D–G) were promoted under Pi deficiency. The contents of CA (Figure 2A1), DT (Figure 2D1), CT (Figure 2E1), TI (Figure 2F1), and T2A (Figure 2G1) in S. miltiorrhiza hairy roots in the 0.062 mM Pi treatment condition were 1.33, 1.66, 1.87, 1.45, and 3.12 times greater than the contents at the 1.24 mM Pi treatment condition. Furthermore, there were no significant differences across the yields (Figure 2D2–G2). The contents of CA, DT, CT, TI, and T2A in S. castanea hairy roots in the 0.062 mM Pi treatment condition were 2.58, 2.76, 3.76, 1.86, and 3.12 times greater than the 1.24 mM condition. The yields of CA, DT, CT, TI, and T2A were 2.04, 2.2, 2.98, 1.48, and 2.45 times greater than the 1.24 mM Pi treatment condition. The data suggested that Pi deficiency promoted the accumulation of specialized metabolites in Salvia, and the promotion amount in S. castanea hairy roots was larger than that in S. miltiorrhiza hairy roots.
The quality of traditional medicine is determined by the active substances produced by the medicinal plants. The accumulation of secondary metabolites is an adaptive strategy for plants in response to Pi deficiency. The accumulations of anthocyanin in Arabidopsis [35] and rice [36], the accumulations of ginsenosides in Panax ginseng [37], and the accumulations of saikosaponin in Bupleurum chinense DC [13] are promoted by Pi deficiency. Many secondary metabolites are likely to play defensive roles in protecting themselves from biotic and abiotic stress. Pi deficiency promoted the accumulation of secondary metabolites, which increased the adaptive capacity of Salvia to Pi deficiency. Indeed, the promotion degree of secondary metabolism in plants reflects the adaptive capacity to Pi deficiency. The promotion amount in S. castanea hairy roots was larger than that in S. miltiorrhiza hairy roots, which demonstrated that S. castanea hairy roots could remodel secondary metabolism more effectively to adapt to Pi deficiency than S. miltiorrhiza hairy roots.
Taking into account the biomass of hairy roots and the amounts of the seven secondary metabolites across the different Pi treatment concentrations, we found that the 0.062 mM Pi condition had small effect on the biomass, while having a beneficial effect on the yield of secondary metabolism. Therefore, 0.062 mM Pi treatment condition was selected for the further study.

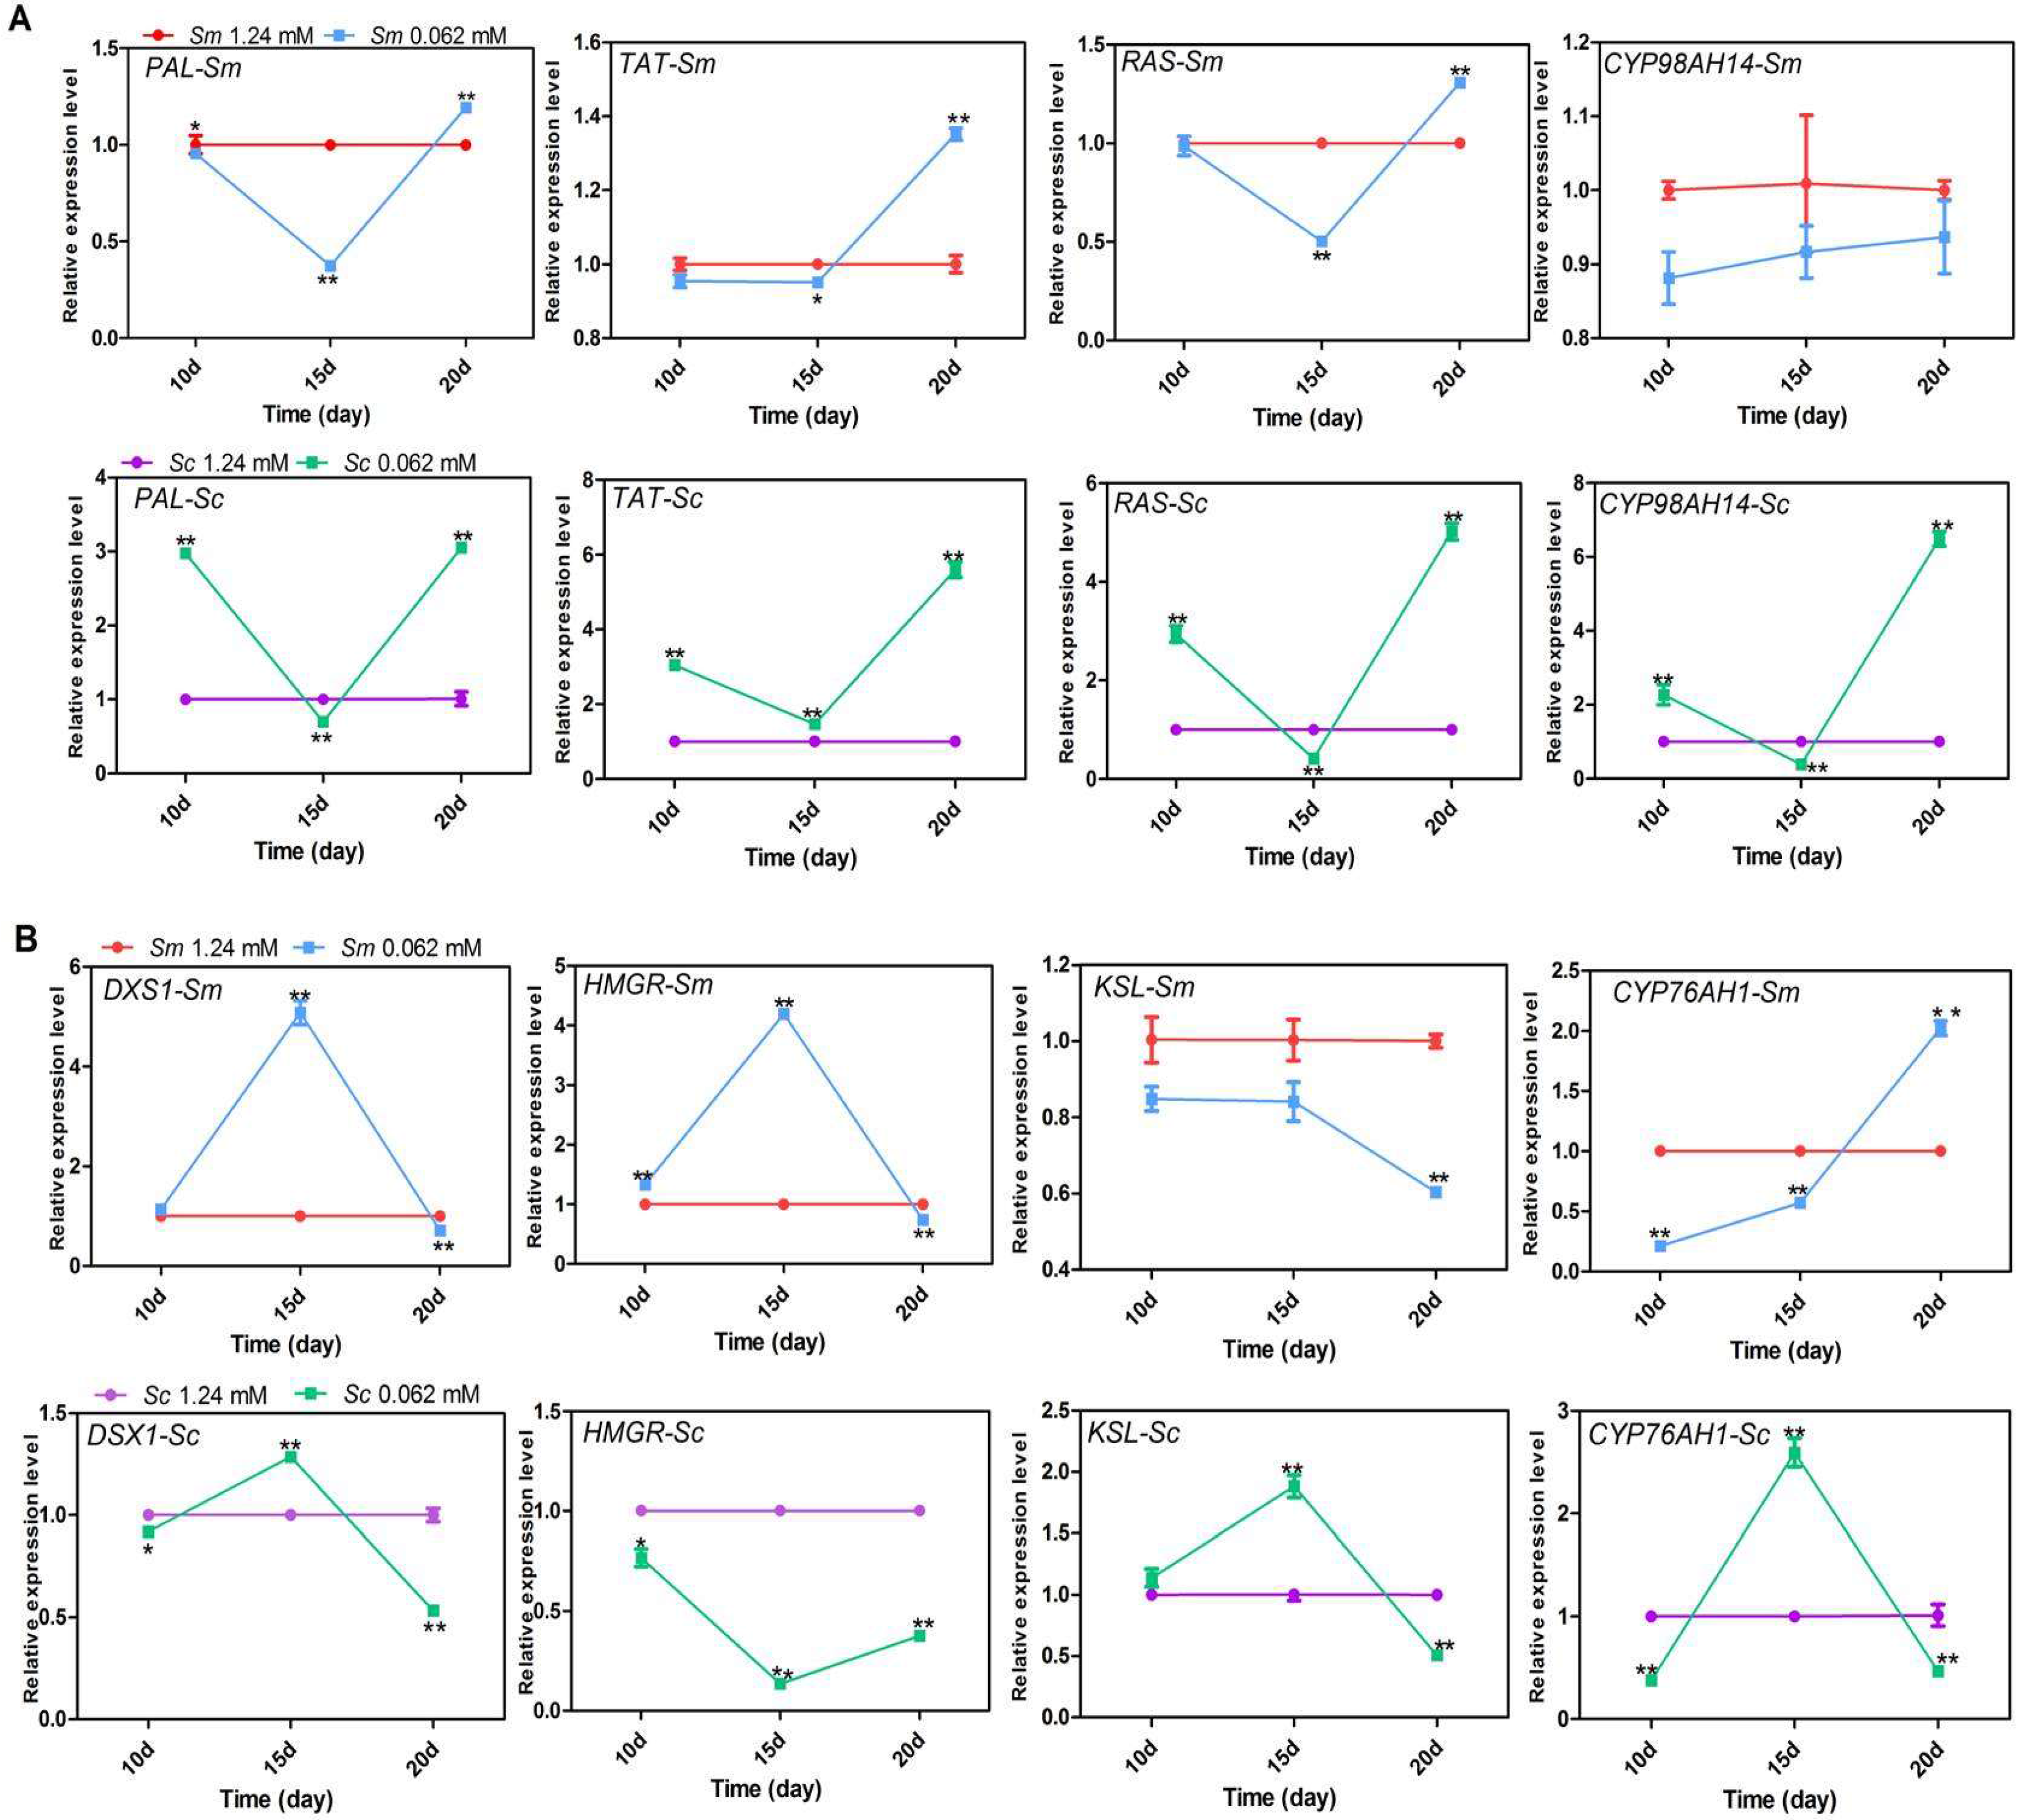
2.3. Effects of Pi Deficiency on the Quantification of the Transcript Levels of Key Enzyme Genes in Hairy Roots

To determine whether the enhanced accumulation of secondary metabolites and the differences in these two Salvia species were due to the transcript level of key enzyme genes in synthetic pathways or not, the expression level of key enzyme genes involved in phenolic acid and tanshinone biosynthesis were measured.
The results showed that in Pi-deficient conditions, except for CYP98AH14 in S. miltiorrhiza, the transcript level of genes in the phenolic acid pathway reached the highest on the 20th day in these two Salvia species (Figure 3A). In contrast, except for CYP76AH1, transcript levels of genes in the tanshinone pathways reached the highest on the 15th day in these two Salvia species under Pi deficiency (Figure 3B). These data indicated that the accumulation of phenolic acids and tanshinone may have occurred at different stages.
The expression levels of genes in the S. castanea phenolic acid biosynthetic pathways were more responsive to Pi deficiency than those in S. miltiorrhiza (Figure 3A). For example, after 20 days of Pi deficiency, the expression levels of PAL, TAT, RAS, and CYP98AH14 had negligible effects in S. miltiorrhiza, however, they were promoted by more than 3.0, 5.6, 5.02, and 6.48 times than that of control levels in S. castanea.
CYP98AH14 and KSL showed different change trends in these two Salvia species. In the Pi deficiency condition, expression levels of CYP98AH14 and KSL were increased in S. castanea most of the time, while they were inhibited in S. miltiorrhiza throughout the experiment. The different expression patterns of these two genes may contribute to the differences between the adaptive mechanisms of S. miltiorrhiza and S. castanea in response to Pi deficiency.
The accumulations of phenolic acids and tanshinones are the results of the function of enzymes in biosynthetic pathways [38]. In the present study, Pi deficiency upregulated the expressions of key enzyme genes in the biosynthetic pathways of tanshinones and phenolic acids at specific times, which likely resulted in their accumulation. This result is consistent with previous reports [9,10,21]. Genes in S. castanea were more responsive to the low-Pi stress than those in S. miltiorrhiza, which is consistent with the greater degree of content change of secondary metabolism in S. castanea compared to S. miltiorrhiza. The genes involved in secondary metabolism were late transcriptional PSI genes, and were regulated by early PSI genes [39,40].

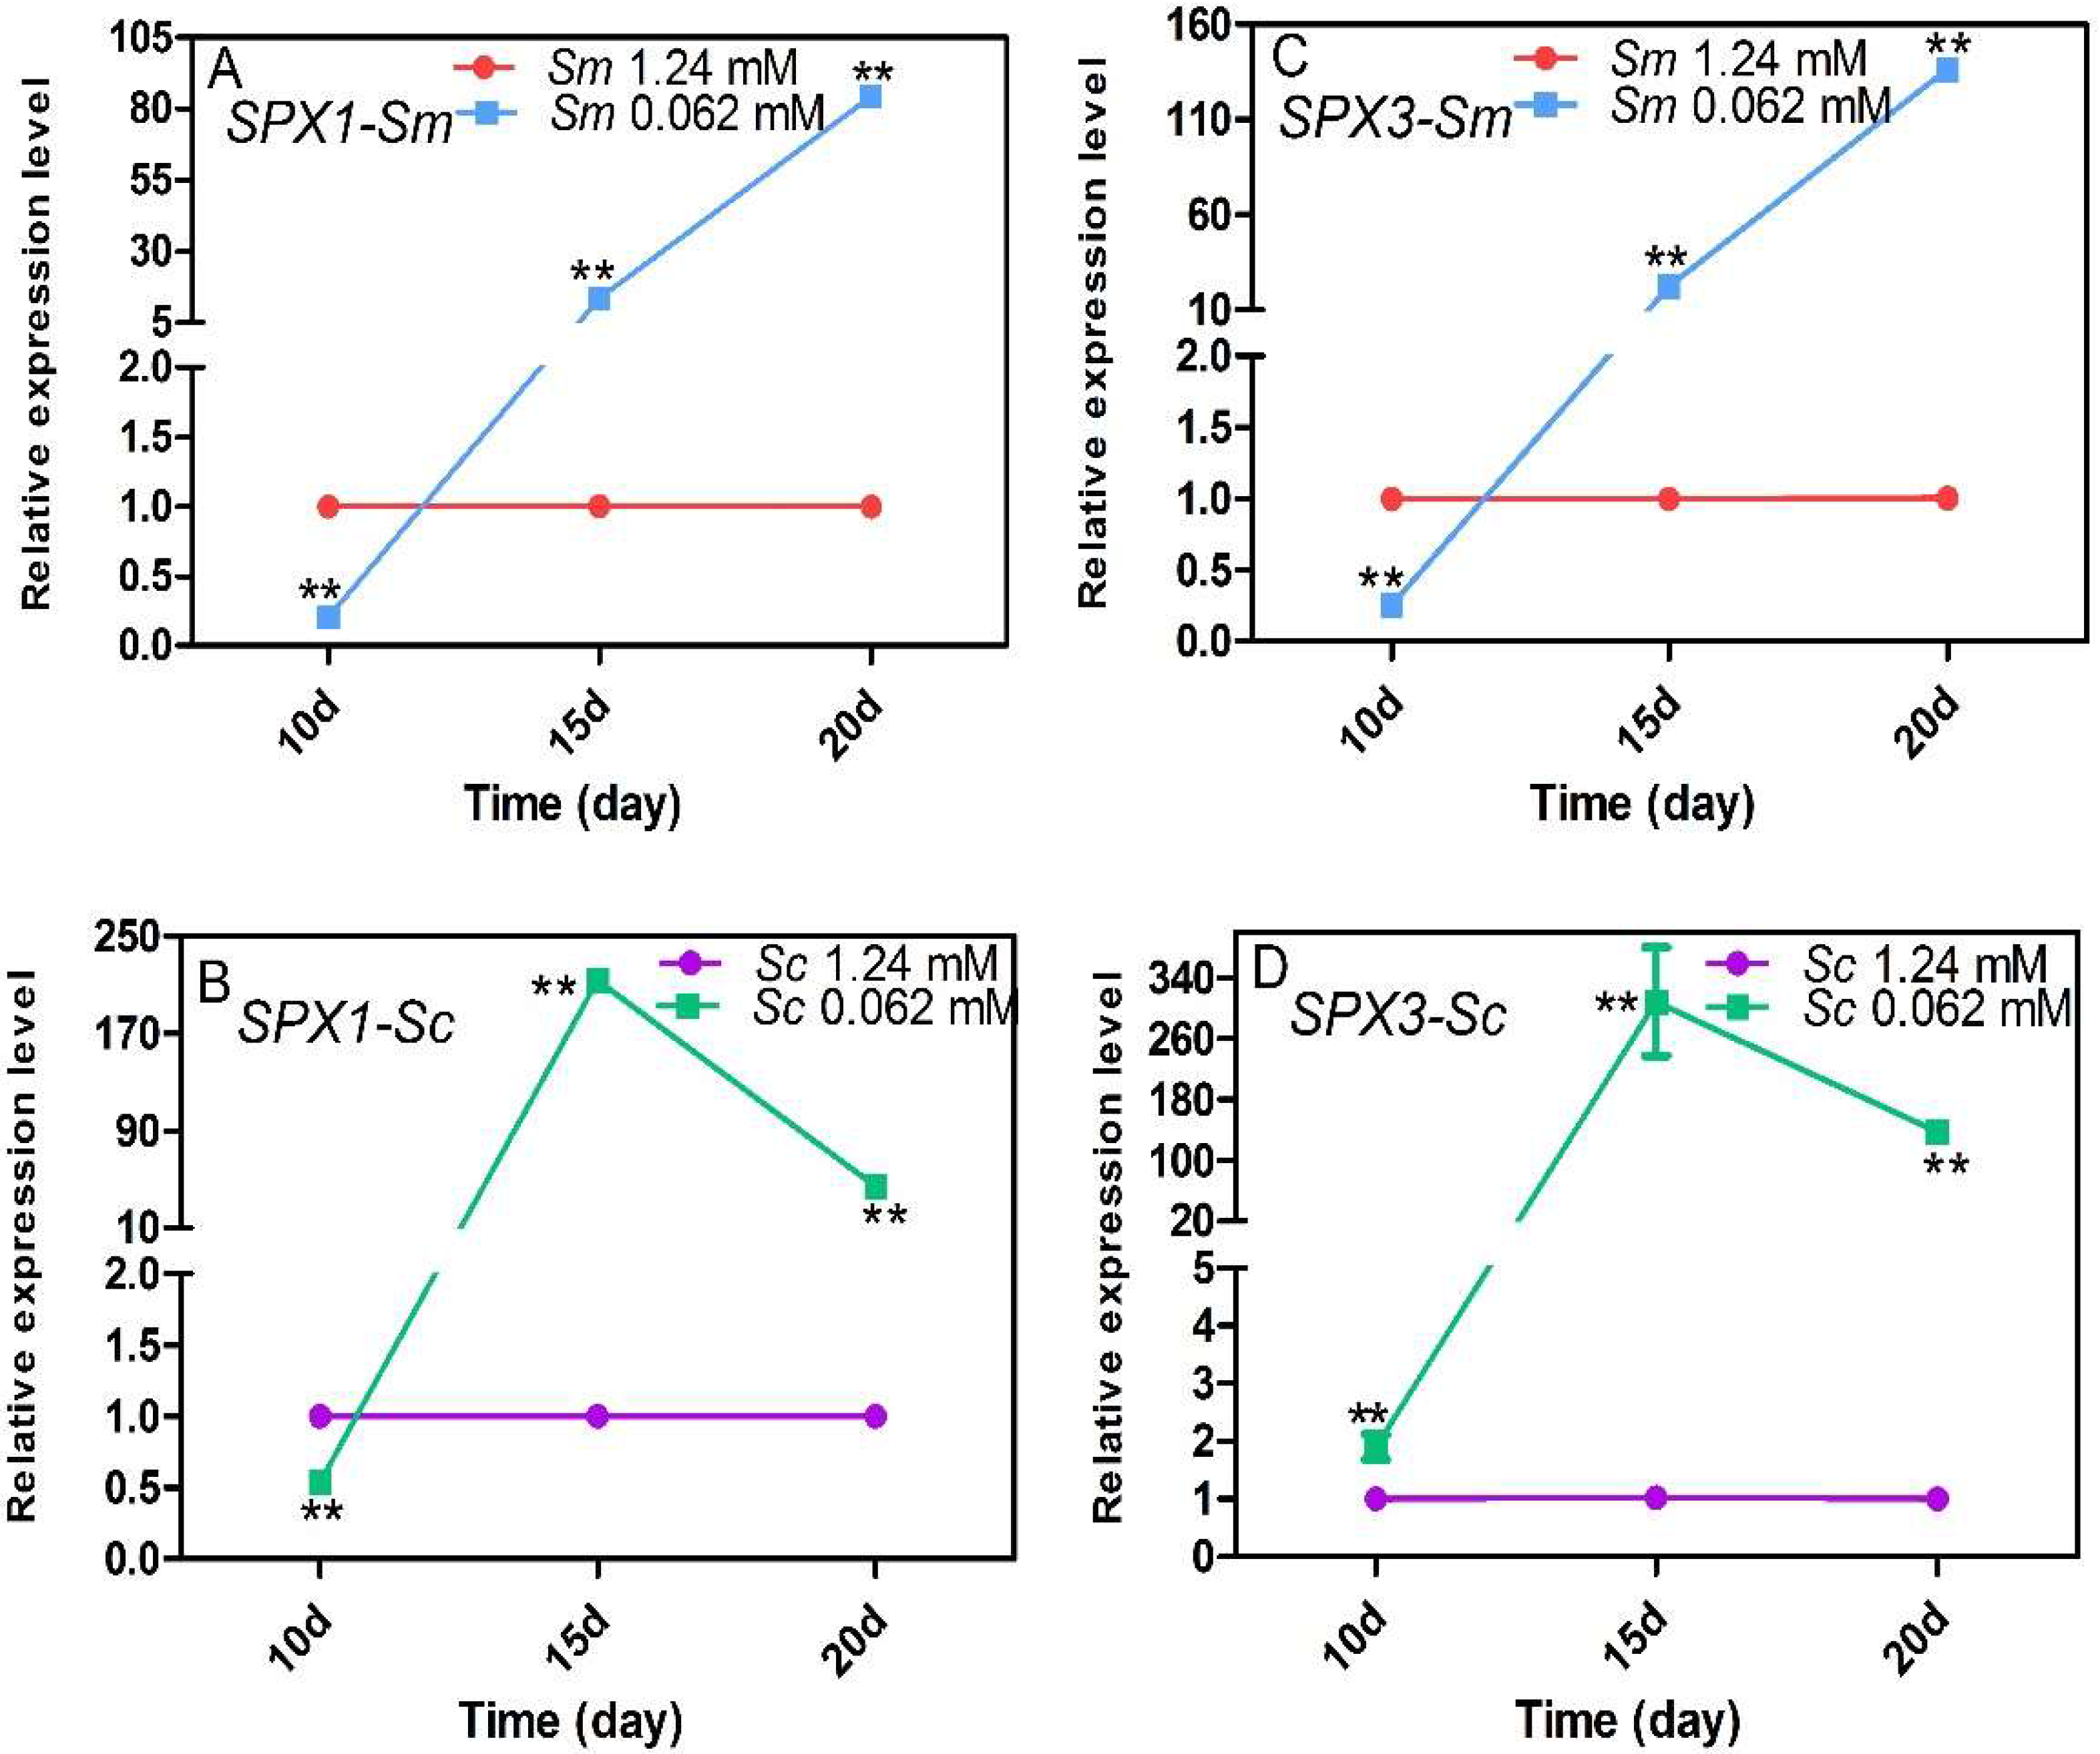
2.4. Expression Response of the SPX Genes to Pi Deficiency

We measured the expression levels of SPX genes to reveal the different responses to Pi deficiency in S. miltiorrhiza and S. castanea. The full sequences of SPX1 (Gene ID: MH155196) and SPX3 (Gene ID: MH155198) were obtained from the transcriptome and were detected by gene clone. In the Pi-deficient condition, SPX1 in S. miltiorrhiza (Figure 4A) and S. castanea (Figure 4B), as well as SPX3 in S. miltiorrhiza (Figure 4C), were inhibited on the 10th day but were promoted significantly on the 15th day 20th day. SPX3 in S. castanea (Figure 4D) showed sustained induction in the whole process. The highest expression levels of SPX1 and SPX3 in S. castanea hairy roots were measured at 15 days and were 213 and 308.5 times greater than control levels, respectively. The highest expression levels of SPX1 and SPX3 in S. miltiorrhiza were measured on the 20th day and were 84.1 and 136 times greater than control levels, respectively. That is to say, SPX1 and SPX3 in S. castanea had a more timely and sensitive response to Pi deficiency than those in S. miltiorrhiza.
SPXs are early response PSI genes that connect the Pi deficiency signal to the Pi deficiency response. SPXs promote the activity of phosphate transporters factor (PHT) to increase Pi transport [12,41,42], regulate secondary metabolism genes, among other activities [23,43,44,45]. The expression levels of SPXs reflected the degree of response to Pi deficiency to some extent. MEGA 6 software was used to perform multiple sequence alignment on Salvia SPX1 and SPX3 protein sequences, AtSPXs protein sequences [46,47], OsSPXs protein sequences [22,48], and GmSPXs protein sequences [49]. The result showed that SmSPX1 and AtSPX1 were clustered together and SmSPX3 and AtSPX3 were clustered together, respectively (Supplementary material Figure S1). AtSPX1 and AtSPX3 are strongly induced by Pi deficiency and play a positive role in plant adaptation by regulating the expression of the Pi-responsive genes in response to Pi starvation [45,46]. SmSPX1 and SmSPX3 were promoted to levels hundreds of times greater than control levels. These data demonstrated that SPX1 and SPX3 of Salvia might play a positive role in plant adaptation to Pi starvation.

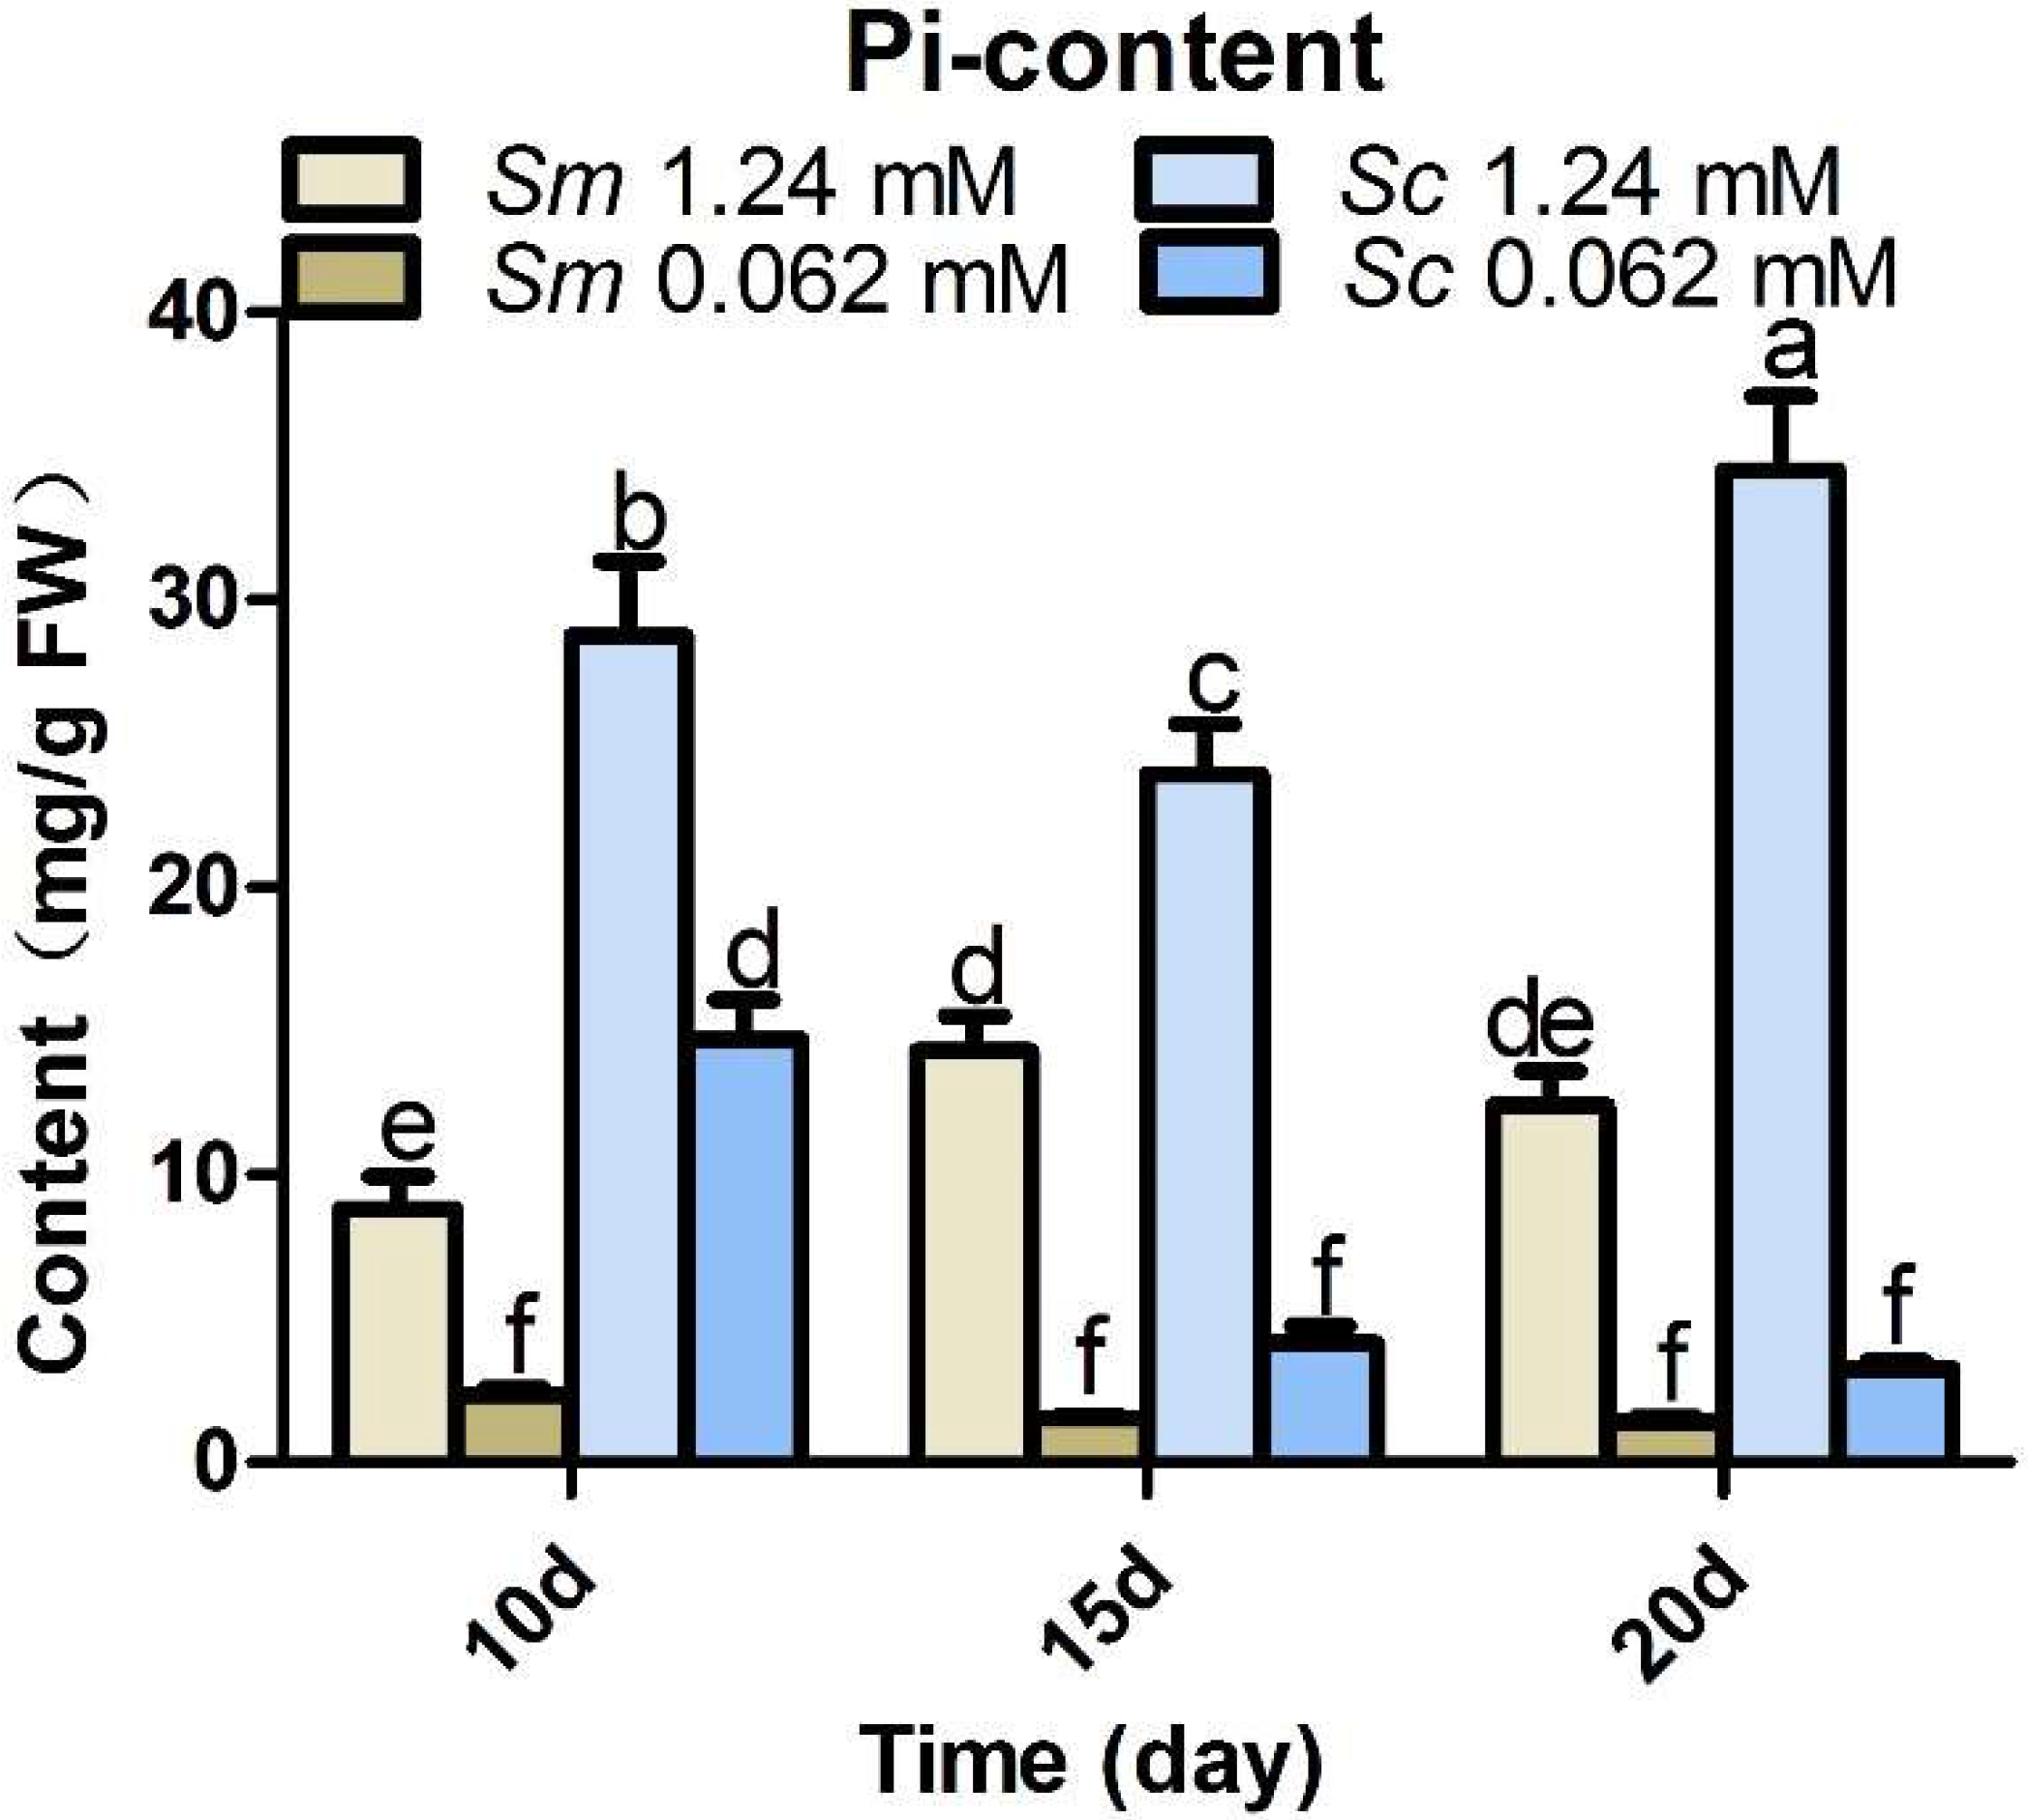
2.5. Pi Accumulation in Hairy Roots at Control and Pi Deficiency Conditions

To investigate Pi absorption and utilization efficiency in the two Salvia species, we measured the effective Pi content in S. miltiorrhiza hairy roots and S. castanea hairy roots under control and Pi-deficient conditions (Figure 5). Pi accumulation decreased markedly under Pi deficiency in both Salvia hairy roots. In S. miltiorrhiza hairy roots, the Pi concentration in the control group was 3.74, 8.8, and 8.9 times greater than in the various Pi-deficient groups on the 10th, 15th, and 20th day. In S. castanea hairy roots, the Pi concentration in the control group was 1.95, 5.8, and 10.6 times greater than the Pi-deficient groups on the 10th, 15th, and 20th day. The difference between the control group and the Pi-deficient group increased as the experiment progressed, possibly because the control group was able to uptake more Pi from the medium to sustain growth, while there was not enough Pi for the hairy roots of plants in the Pi-deficient groups.
In general, the S. castanea experimental and control groups contained more effective Pi than the S. miltiorrhiza groups, which indicated that S. castanea can utilize Pi more efficiently than S. miltiorrhiza. S. castanea needed more Pi to sustain normal growth and had a more sensitive response to Pi deficiency, which could make it more accessible to Pi uptake. It is necessary to develop a better understanding of the molecular events involved in controlling Pi homeostasis in plants.

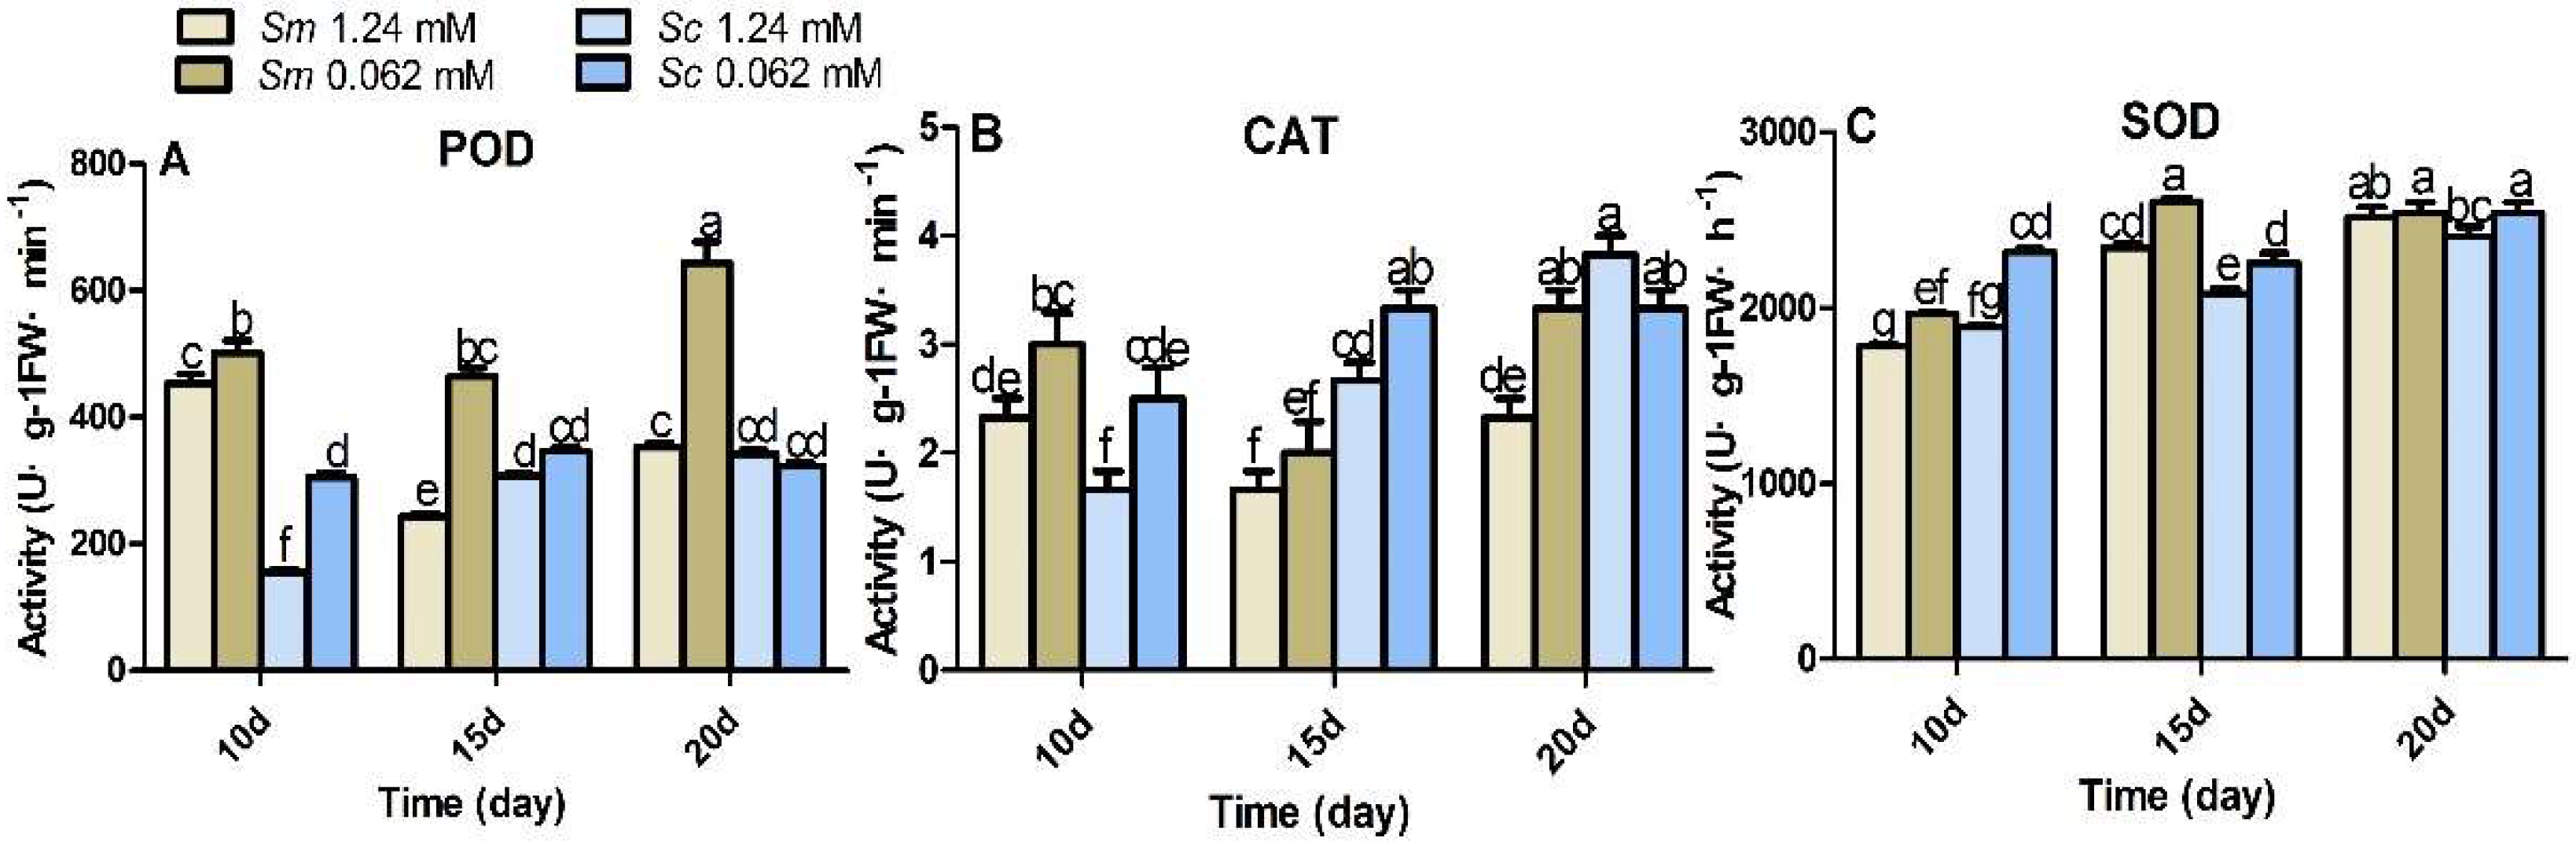
2.6. Antioxidant Enzyme Responses to Pi Deficiency

Antioxidant enzyme activities were increased in samples treated with Pi deficiency (Figure 6). After 10 days in the S. miltiorrhiza samples, the activities of POD, CAT, and SOD were increased by 10%, 29%, and 10%, respectively. After 10 days, in the S. castanea samples, the activities of POD, CAT, and SOD were increased by 20%, 50%, and 98%, respectively. However, as the experiment progressed, the induction degree decreased gradually until it was extinct. This happened after 20 days for SOD, POD, and CAT in S. castanea and for SOD in S. miltiorrhiza.
Stress conditions could promote the production of reactive oxygen species (ROS), and the induction of antioxidant systems protects the plants from oxidative damage [50,51]. In the present study, the activities of the antioxidant enzymes were induced to adapt to Pi deficiency. The degree of induction decreased gradually overtime until extinction (Figure 6), which was an adaptive process. S. castanea was more reactive than S. miltiorrhiza in both the control and Pi-deficient groups.

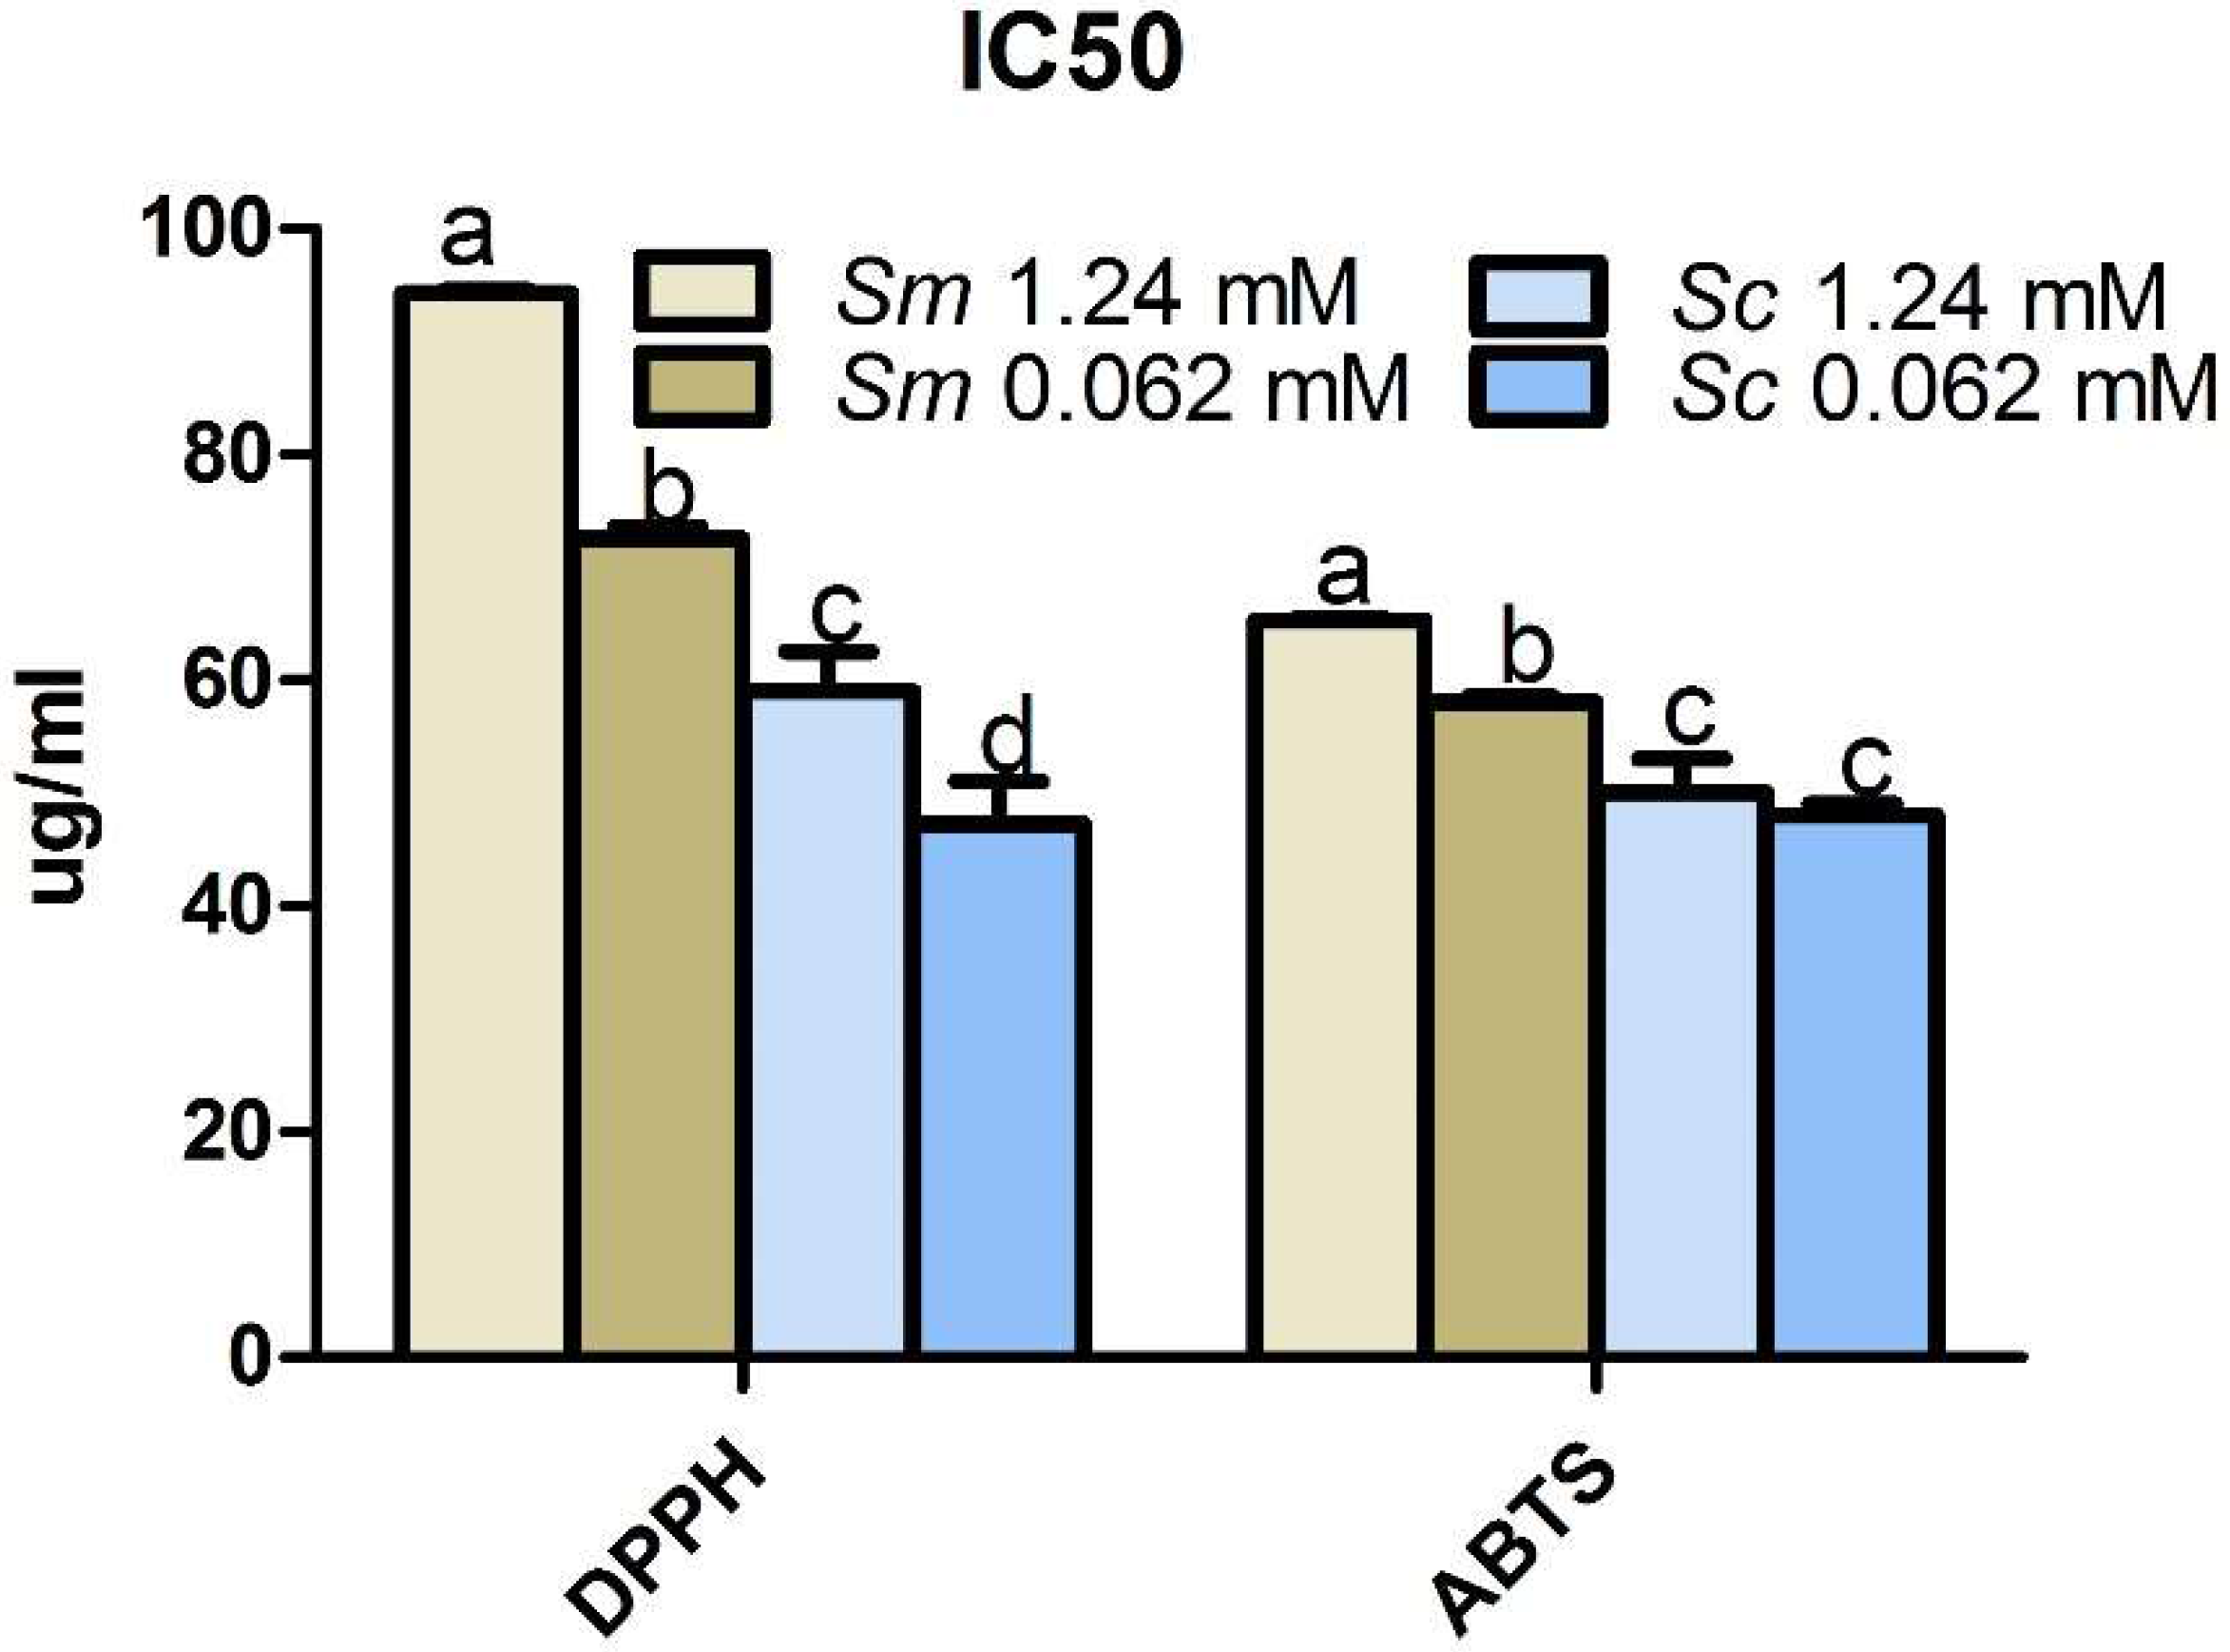
2.7. Effects of Pi Deficiency on the Antioxidant Activity of Salvia Hairy Roots

To investigate the influence of Pi deficiency on the antioxidant activity of Salvia hairy roots, DPPH radical scavenging activity and ABTS+ radical cation scavenging activity were measured (Figure 7). A lower DPPH or ABTS+ IC50 represented stronger antioxidant capacity. The radical scavenging ability of S. miltiorrhiza and S. castanea were induced by Pi deficiency. S. castanea showed stronger antioxidant ability than S. miltiorrhiza in both the control and Pi-deficient groups.
Secondary metabolism exerts antioxidation effects. Antioxidation characteristics reflect the quality of the medicinal material to some degree. Many reports strongly suggest that environmental conditions influence the antioxidant properties of plants [25,26,50]. In the present study, the DPPH scavenging capacity assay and ABTS+ radical scavenging assay promoted by Pi deficiency might not fully reflect the antioxidant properties of Salvia (Figure 7). Thus, further studies in cells and living organism are required. S. castanea had greater antioxidant activity than S. miltiorrhiza in both control and Pi-deficient groups. These data are consistent with the accumulation of secondary metabolites and provide further evidence that S. castanea was more amenable to Pi deficiency compared to S. miltiorrhiza.
The chemical compositions and antioxidant activity in medicinal plants may lead to significant differences in effectiveness as medicines, functional foods, and nutritional supplements. Pi deficiency should be considered as a strategy to improve the quality of traditional Chinese herbal medicine (Figure 8). S. castanea hairy roots was more adaptive to Pi deficiency than S. miltiorrhiza hairy roots, likely because of the S. castanea growing environment, which is harsh compared to that of S. miltiorrhiza [30]. This environmental difference may make S. castanea more capable of adapting to stressors. Our findings suggest the possibility of optimizing growing conditions for Pi high-efficiency in plants, with desired antioxidant properties.

3. Materials and Methods

3.1. Plant Material and Pi Deficiency Treatment

Two-year-old seeds of S. miltiorrhiza were obtained from the experimental field at Northwest A&F University, and 2-year-old seeds of S. castanea were collected from the Science and Technology Bureau of Nyingchi Prefecture, Tibet, People’s Republic of China. These seeds were sterilized and cultured on Murashige and Skoog solid medium to obtain sterile plantlets. Sterile plantlets were grown for 3 months. The Agrobacterium rhizogenes strain ATCC 15834 was applied to infect S. miltiorrhiza and S. castanea aseptic leaves to obtain hairy roots, and the hairy roots were subcultured every 30 days [28]. Hairy roots (0.2 g, fresh weight) were cultured in 100 mL flasks that contained 50 mL of 6, 7-v medium on an orbital shaker. The shaker was set at 110 rpm at 25 °C in the dark. The control group (CK) of Pi from NaH2PO4 in the 6, 7-v medium was 1.24 mM.
Five levels of Pi treatment (1.24 mM, 0.62 mM, 0.248 mM, 0.062 mM, and 0 mM) were used, corresponding to a control group, a slightly reduced level, a moderately reduced level, a seriously reduced level, and the complete absence of Pi, respectively.
For biomass and high-performance liquid chromatography (HPLC) measurement, the hairy roots grown at the five phosphate treatment levels were harvested after 28 days. The fresh weight of each sample was recorded, then, the samples were dried at 50 °C in an oven until constant dry weight for HPLC.
For Pi concentration measurement, hairy roots grown in 1.24 mM and in 0.062 mM Pi for 28 days were harvested to measure the concentration of Pi.
For quantitative real-time PCR (qRT-PCR) and antioxidant assays, the hairy roots were grown in the 1.24 mM and in 0.062 mM Pi levels, and hairy roots were collected at 10, 15, and 20 days, respectively.

3.2. High-Performance Liquid Chromatography (HPLC)

The extraction methods for active components (CA, LAB, RA, TI, TIIA, DT, CT) and HPLC were carried out in accordance with the general method used previously in our laboratory [52]. Dry sample powder (20 mg) was dissolved in 2 mL of 70% methanol and soaked for 12 h. The mixture was sonicated for 45 min and centrifuged at 8000 rpm for 10 min. The supernatant was filtered through a 0.22 um microporous membrane (F) for HPLC analysis using a Waters e2695 Separations Module and 2998 PDA Detector. Chromatography separation was performed with a C18 column (Waters), the temperature of column was 30 °C. The detected wavelength was 288 nm for phenolic acids and 270 nm for tanshinones. The mobile phase was acetonitrile (C) and 0.026% phosphoric acid solution (D) with the flow rate of 1.00 mL/min. The elution gradient was set as follows: t = 0–10 min, 5–20% C; t = 10–15 min, 20–25% C; t = 15–20 min, 25% C; t = 20–25 min, 25–20% C; t = 25–28 min, 20–30% C; t = 28–40 min, 30% C; t = 40–45 min, 45% C; t = 45–58 min, 45–58% C; t = 58–67 min, 58–50% C; t = 67–70 min, 50–60% C; t = 70–80 min, 60–65% C; t = 80–85 min, 65–95 C; t = 85–95 min, 95 C; t = 95–96 min, 5% C. Compounds were identified by comparison with the standard substances, which were purchased from the National Institutes for Food and Drug Control (Beijing, China).

3.3. RNA Extraction, cDNA Synthesis, and Quantitative Real-Time PCR (qRT-PCR) Assays

Total RNA was isolated from the fresh hairy root tissues (100 mg) using the RNAprep pure Plant Kit (Tiangen, Beijing, China). RNA (1 µg) was used to synthesize cDNA using the PrimeScript™ RT reagent kit with gDNA Eraser (Perfect Real Time, Takara, Tokyo, Japan) according to manufacturer’s instructions. The expression levels of genes were detected by qRT-PCR using SYBR® Premix Ex Taq™ II (Takara, Japan) using QuantStudio 6 Flex Real-Time PCR System (Thermo Fisher, Waltham, MA, USA). The constitutively expressed β-actin gene was used as an internal reference gene to estimate the relative gene expression. Primers used for qRT-PCR was designed though the website of https://www.genscript.com/tools/real-time-pcr-tagman-primer-design-tool and are listed in Supplementary Table S1. The qRT-PCR conditions were: 95 °C for 30 s, 1 cycle; followed by 95 °C for 5 s; and 58 °C for 30 s, 40 cycles. The data was analysed by the delta-delta Ct method [53].

3.4. Measurement of Effective Pi Concentration

Effective Pi concentrations in hairy roots were performed using the molybdenum blue method, as described by Nanamori et al. [8]. Hairy roots (0.5 g, fresh weigh) were powder using liquid nitrogen, and the powder was homogenized in 1 mL of 10% (w/v) perchloric acid (PCA), using an ice-cold mortar and pestle. The homogenate was then diluted 10 times with 5% (w/v) PCA and placed on ice for 30 min. It was then centrifuged at 10,000× g for 10 min at 4 °C. The supernatant was used to measure the concentration of Pi. Ammonium molybdate (0.4%, w/v) was melted in 0.5 M H2SO4 (solution A) and then was mixed with 10% ascorbic acid (solution B; A:B = 6:1). Two milliliters of this solution was added to 1 mL of the sample solution, and the resulting solution was incubated in a water bath at 40 °C for 20 min. After being cooled in ice, the absorbance was measured at 820 nm. Conversion of the Pi content referenced the standard curve.

3.5. Analysis of Enzyme Activities

Hairy roots (0.2 g, fresh weight) were ground into a mortar using liquid nitrogen, and 2 mL of phosphate buffer (50 mM, pH 7.8, 0.1 mM EDTA, 1% PVP) was added to form a homogenate with 8 mL of phosphate buffer. The homogenate was centrifuged twice at 4 °C for 15 min at 12,000 rpm. The supernatant was retained for the analysis of enzyme activities, the method followed described as previous [50,54].
Superoxide dismutase (SOD): The reaction mixture contained 1.5 mL of phosphate buffer, 0.3 mL of 130 mM methionine, 0.3 mL of 750 μM nitroblue tetrazolium (NBT), 0.3 mL of 100 μM EDTA, 0.5 mL of water, 0.1 mL of enzyme extract, and 0.3 mL of 20 µM riboflavin. The chromogenic reaction occurred for 15 min under 4000 lx. Absorbance was measured at 560 nm. One unit of SOD activity was defined as the enzyme amount that suppressed the NBT photochemical reduction in half.
Peroxidase (POD): POD activity was determined by monitoring the increase in absorbance at 470 nm of a solution of 50 mM phosphate buffer (pH 5.5) containing 1 mM guaiacol, 0.5 mM H2O2, and 0.1 mL of enzyme extract. One unit of POD activity was defined as the amount of enzyme that increased the absorbance of a material by 0.01 per min.
Catalase (CAT): CAT activity was measured by using H2O2 (extinction coefficient 39.4 mM cm−1) for 1 min at 240 nm. A reaction mixture (3 mL) that contained 1 mL Tris-HCl buffer (pH 7.0), 1.5 mL water, 0.2 mL enzyme extract, and 0.2 mL H2O2 (100 mM) was used.

3.6. DPPH and ABTS+ Radical Cation Screening Assay

Sample powder (20 mg, dry weight) was extracted with 70% methanol (2 mL) under sonication for 60 min, then centrifuged at 9000× g for 5 min. The supernatant (10 mg/mL) was then diluted 2, 4, 5, 6, and 12 times by using 70% methanol to form the gradient tested simples. We used published protocols by Liu to measure DPPH and ABTS+ radical scavenging activity [26,55].
The test samples (2 mL) were mixed with 2 mL of a DPPH solution (200 mM); the final concentration of DPPH was 100 mM. The mixture was shaken and allowed to react in the dark for 30 min. The absorbance was measured at 517 nm. IC50 values were defined as the effective concentrations at which DPPH radicals were scavenged by 50% and were obtained by interpolation from linear regression analysis.
The ABTS+ sample was prepared by mixing an ABTS+ stock solution (7 mM in water) with 2.45 mM of potassium persulfate. The ABTS+ solution was diluted with a phosphate buffered saline (PBS) solution (pH 7.4) to an initial absorbance of 0.7 at 734 nm. Tested samples (0.1 mL) were added to 3.9 mL of ABTS+ solution (OD = 0.7), and the absorbance was measured at 734 nm. IC50 values were defined as the effective concentrations at which ABTS+ radicals were scavenged by 50% and were obtained by interpolation from linear regression analysis.

3.7. Data Analysis

All experiments were repeated in triplicate, results are presented as means standard deviation (SD), all data were analyzed by using Statistical Package for Social science (IBM SPSS Statistics 19). Analyses were performed using one-way ANOVAs followed by the Duncan’s multiple range tests or Student’s t-test (indicated in the figure legends). Significant and highly significant levels were considered at 0.01 < p < 0.05 and p < 0.01, respectively. The figures were produced using GraphPad Prism 5.

4. Conclusions

Pi deficiency increased the accumulation of secondary metabolites and antioxidant activities, which improved the quality of the herbs (Figure 8). S. castanea hairy roots contained more Pi and was more responsive to Pi deficiency than S. miltiorrhiza hairy roots. The hairy roots culture could not fully represent the whole plant. Pi deficiency in whole plants may lead to undesirable losses, such as in biomass production, thus, losses in the yield of secondary compounds and crops yield can occur. In addition, results in this study raise the possibility of optimizing growing conditions of plants for the aspect of Pi high-efficiency, which could increase the yield of active compounds and save Pi resources. The research demonstrates that Pi fertilizer applied to agriculture should be based on different demands of agriculture.

Supplementary Materials

The following are available online at https://www.mdpi.com/1420-3049/23/5/1132/s1.

Author Contributions

Z.L. and D.Y. designed the study. L.L. and B.X. performed the experiments. L.L. and H.Z. analyzed data and wrote the paper. All authors approved the manuscript.

Acknowledgments

This work was supported by the National Natural Science Foundation of China (81373908, 81373536) and Zhejiang Provincial Natural Science Key Project (LZ16H280001, LQ15H280009).

Conflicts of Interest

The authors declared that they have no conflicts of interest to this work. This study has no commercial or associative interest.

References

  1. Lópezarredondo, D.L.; Leyvagonzález, M.A.; Gonzálezmorales, S.I.; Lópezbucio, J.; Herreraestrella, L. Phosphate Nutrition: Improving Low-Phosphate Tolerance in Crops. Annu. Rev. Plant Biol. 2014, 65, 95–123. [Google Scholar] [CrossRef] [PubMed]
  2. Mehra, P.; Pandey, B.K.; Giri, J. Improvement in phosphate acquisition and utilization by a secretory purple acid phosphatase (OsPAP21b) in rice. Plant Biotechnol. J. 2017, 15, 1054–1067. [Google Scholar] [CrossRef] [PubMed]
  3. Chorpet, S.; Nadia, B.; Mushtak, K.; Chanakan, P.U.T.; Patrick, D.; Hatem, R. The Involvement of OsPHO1;1 in the Regulation of Iron Transport Through Integration of Phosphate and Zinc Deficiency Signaling. Front. Plant Sci. 2016, 7, 396. [Google Scholar] [CrossRef]
  4. Xu, Y.; Fang, L.; Han, G.; Cheng, B. Genome-wide identification and comparative analysis of phosphate starvation-responsive transcription factors in maize and three other gramineous plants. Plant Cell Rep. 2018, 37, 711–726. [Google Scholar] [CrossRef] [PubMed]
  5. Heuer, S.; Gaxiola, R.; Schilling, R.; Herrera-Estrella, L.; López-Arredondo, D.; Wissuwa, M.; Delhaize, E.; Rouached, H. Improving phosphorus use efficiency: A complex trait with emerging opportunities. Plant J. 2017, 90, 868–885. [Google Scholar] [CrossRef] [PubMed]
  6. Lei, K.; Lin, Y.; Ren, J.; Bai, L.; Miao, Y.; An, G.; Song, C. Modulation of the Phosphate-Deficient Responses by the MicroRNA156 and its Targeted SQUAMOSA PROMOTER BINDING PROTEIN-LIKE 3 in Arabidopsis. Plant Cell Physiol. 2016, 57, 192–203. [Google Scholar] [CrossRef] [PubMed]
  7. Zhang, Z.; Liao, H.; Lucas, W.J. Molecular mechanisms underlying phosphate sensing, signaling, and adaptation in plants. Mol. Plant 2014, 56, 192–220. [Google Scholar] [CrossRef] [PubMed]
  8. Nanamori, M.; Shinano, T.; Wasaki, J.; Yamamura, T.; Rao, I.M.; Osaki, M. Low Phosphorus Tolerance Mechanisms: Phosphorus Recycling and Photosynthate Partitioning in the Tropical Forage Grass, Brachiaria Hybrid Cultivar Mulato Compared with Rice. Plant Cell Physiol. 2004, 45, 460–469. [Google Scholar] [CrossRef] [PubMed]
  9. Hammond, J.P.; Broadley, M.R.; White, P.J. Genetic responses to phosphorus deficiency. Ann. Bot. 2004, 94, 323–332. [Google Scholar] [CrossRef] [PubMed]
  10. Müller, R. Genome-wide analysis of the Arabidopsis leaf transcriptome reveals interaction of phosphate and sugar metabolism. Plant Physiol. 2007, 143, 156–171. [Google Scholar] [CrossRef] [PubMed]
  11. Devaiah, B.N.; Madhuvanthi, R.; Karthikeyan, A.S.; Raghothama, K.G. Phosphate Starvation Responses and Gibberellic Acid Biosynthesis Are Regulated by the MYB62 Transcription Factor in Arabidopsis. Mol. Plant 2009, 2, 43–58. [Google Scholar] [CrossRef] [PubMed]
  12. Pandey, B.K.; Mehra, P.; Verma, L.; Bhadouria, J.; Giri, J. OsHAD1, a haloacid dehalogenase-like APase enhances phosphate accumulation. Plant Physiol. 2017, 174, 2316–2332. [Google Scholar] [CrossRef] [PubMed]
  13. Zhu, Z.; Liang, Z.; Han, R.; Dong, J.e. Growth and saikosaponin production of the medicinal herb Bupleurum chinense DC. under different levels of nitrogen and phosphorus. Ind. Crops Prod. 2009, 29, 96–101. [Google Scholar] [CrossRef]
  14. Chen, H.; Chen, F.; Zhang, Y.-L.; Song, J.-Y. Production of lithospermic acid B and rosmarinic acid in hairy root cultures of Salvia miltiorrhiza. J. Ind. Microbiol. Biotechnol. 1999, 22, 133–138. [Google Scholar] [CrossRef]
  15. Rong, Q.; Jiang, D.; Chen, Y.; Shen, Y.; Yuan, Q.; Lin, H.; Zha, L.; Zhang, Y.; Huang, L. Molecular Cloning and Functional Analysis of Squalene Synthase 2(SQS2) in Salvia miltiorrhiza Bunge. Front. Plant. Sci. 2016, 7, 1274. [Google Scholar] [CrossRef] [PubMed]
  16. Yang, L.; Yang, C.; Li, C.; Zhao, Q.; Liu, L.; Fang, X.; Chen, X.Y. Recent advances in biosynthesis of bioactive compounds in traditional Chinese medicinal plants. Sci. Bull. 2016, 61, 3–17. [Google Scholar] [CrossRef] [PubMed]
  17. Li, B.; Zhang, C.; Peng, L.; Liang, Z.; Yan, X.; Zhu, Y.; Liu, Y. Comparison of essential oil composition and phenolic acid content of selected Salvia species measured by GC–MS and HPLC methods. Ind. Crops Prod. 2015, 69, 329–334. [Google Scholar] [CrossRef]
  18. Jia, Y.; Bai, Z.; Pei, T.; Ding, K.; Liang, Z.; Gong, Y. The Protein Kinase SmSnRK2.6 Positively Regulates Phenolic Acid Biosynthesis in Salvia miltiorrhiza by Interacting with SmAREB1. Front. Plant Sci. 2017, 8, 1384. [Google Scholar] [CrossRef] [PubMed]
  19. Kai, G.; Xu, H.; Zhou, C.; Liao, P.; Xiao, J.; Luo, X.; You, L.; Zhang, L. Metabolic engineering tanshinone biosynthetic pathway in Salvia miltiorrhiza hairy root cultures. Metab. Eng. 2011, 13, 319–327. [Google Scholar] [CrossRef] [PubMed]
  20. Zhang, S.; Ma, P.; Yang, D.; Li, W.; Liang, Z.; Liu, Y.; Liu, F. Cloning and characterization of a putative R2R3 MYB transcriptional repressor of the rosmarinic acid biosynthetic pathway from Salvia miltiorrhiza. PLoS ONE 2013, 8, e73259. [Google Scholar] [CrossRef]
  21. Liu, L.; Yang, D.; Liang, T.; Zhang, H.; He, Z.; Liang, Z. Phosphate starvation promoted the accumulation of phenolic acids by inducing the key enzyme genes in Salvia miltiorrhiza hairy roots. Plant Cell Rep. 2016, 35, 1933–1942. [Google Scholar] [CrossRef] [PubMed]
  22. Lv, Q.; Zhong, Y.; Wang, Y.; Wang, Z.; Li, Z.; Jing, S.; Wu, Z.; Yu, L.; Mao, C.; Yi, K. SPX4 Negatively Regulates Phosphate Signaling and Homeostasis through Its Interaction with PHR2 in Rice. Plant Cell 2014, 26, 1586–1597. [Google Scholar] [CrossRef] [PubMed]
  23. Wild, R.; Gerasimaite, R.; Jung, J.Y.; Truffault, V.; Pavlovic, I.; Schmidt, A.; Saiardi, A.; Jessen, H.J.; Poirier, Y.; Hothorn, M. Control of eukaryotic phosphate homeostasis by inositol polyphosphate sensor domains. Science 2016, 352, 986–990. [Google Scholar] [CrossRef] [PubMed]
  24. Liu, W.; Liu, J.; Yin, D.; Zhao, X. Influence of Ecological Factors on the Production of Active Substances in the anti-cancer plant Sinopodophyllum hexandrum (Royle) T.S. Ying. PLoS ONE 2015, 10, e0122981. [Google Scholar] [CrossRef] [PubMed]
  25. Wang, D.; He, F.; Lv, Z.; Li, D. Phytochemical composition, antioxidant activity and HPLC fingerprinting profiles of three Pyrola species from different regions. PLoS ONE 2014, 9, e96329. [Google Scholar] [CrossRef] [PubMed]
  26. Liu, W.; Yin, D.; Li, N.; Hou, X.; Wang, D.; Li, D.; Liu, J. Influence of Environmental Factors on the Active Substance Production and Antioxidant Activity in Potentilla fruticosa L. and Its Quality Assessment. Sci. Rep. 2016, 6, 28591. [Google Scholar] [CrossRef] [PubMed]
  27. Matkowski, A.; Zielinska, S.; Oszmianski, J.; Lamer-Zarawska, E. Antioxidant activity of extracts from leaves and roots of Salvia miltiorrhiza Bunge, S. przewalskii Maxim., and S. verticillata L. Bioresour. Technol. 2008, 99, 7892–7896. [Google Scholar] [CrossRef] [PubMed]
  28. Li, B.; Wang, B.; Li, H.; Peng, L.; Ru, M.; Liang, Z.; Yan, X.; Zhu, Y. Establishment of Salvia castanea Diels f. tomentosa Stib. hairy root cultures and the promotion of tanshinone accumulation and gene expression with Ag+, methyl jasmonate, and yeast extract elicitation. Protoplasma 2015, 253, 87–100. [Google Scholar] [PubMed]
  29. Manisha, N.; Raghavendrarao, S.; Vandna, R.; Ajay, J. Deciphering Phosphate Deficiency-Mediated Temporal Effects on Different Root Traits in Rice Grown in a Modified Hydroponic System. Front. Plant Sci. 2016, 7, 550. [Google Scholar] [CrossRef]
  30. Yang, D.; Ma, P.; Liang, X.; Liang, Z.; Zhang, M.; Shen, S.; Liu, H.; Liu, Y. Metabolic Profiles and cDNA-AFLP Analysis of Salvia miltiorrhiza and Salvia castanea Diel f. tomentosa Stib. PLoS ONE 2012, 7, e29678. [Google Scholar] [CrossRef] [PubMed]
  31. Xu, Z.; Peters, R.J.; Weirather, J.; Luo, H.; Liao, B.; Zhang, X.; Zhu, Y.; Ji, A.; Zhang, B.; Hu, S.; et al. Full-length transcriptome sequences and splice variants obtained by a combination of sequencing platforms applied to different root tissues of Salvia miltiorrhiza and tanshinone biosynthesis. Plant J. 2015, 82, 951–961. [Google Scholar] [CrossRef] [PubMed]
  32. Sun, L.; Tian, J.; Zhang, H.; Liao, H. Phytohormone regulation of root growth triggered by P deficiency or Al toxicity. J. Exp. Bot. 2016, 67, 3655–3664. [Google Scholar] [CrossRef] [PubMed]
  33. Kellermeier, F.; Amtmann, A. Analysis of the Root System Architecture of Arabidopsis Provides a Quantitative Readout of Crosstalk between Nutritional Signals. Plant Cell 2014, 26, 1480–1496. [Google Scholar] [CrossRef] [PubMed]
  34. Yang, D.; Yang, S.; Zhang, Y.; Liu, Y.; Meng, X.; Liang, Z. Metabolic profiles of three related Salvia species. Fitoterapia 2009, 80, 274–278. [Google Scholar] [CrossRef] [PubMed]
  35. Jiang, C.; Fu, X. Phosphate starvation root architecture and anthocyanin accumulation responses are modulated by the gibberellin-DELLA signaling pathway in Arabidopsis. Plant Physiol. 2007, 145, 1460–1470. [Google Scholar] [CrossRef] [PubMed]
  36. Zhou, J.; Jiao, F.; Wu, Z.; Li, Y.; Wang, X.; He, X.; Zhong, W.; Wu, P. OsPHR2 Is Involved in Phosphate-Starvation Signaling and Excessive Phosphate Accumulation in Shoots of Plants. Plant Physiol. 2008, 146, 1673–1686. [Google Scholar] [CrossRef] [PubMed]
  37. Huang, T.; Gao, W.Y.; Wang, J.; Cao, Y.; Zhao, Y.X.; Huang, L.Q.; Liu, C.X. Selection and optimization of a high-producing tissue culture of Panax ginseng C. A. Meyer. Acta Physiol. Plant. 2010, 32, 765–772. [Google Scholar] [CrossRef]
  38. Ding, K.; Pei, T.; Bai, Z.; Jia, Y.; Ma, P.; Liang, Z. SmMYB36, a Novel R2R3-MYB Transcription Factor, Enhances Tanshinone Accumulation and Decreases Phenolic Acid Content in Salvia miltiorrhiza Hairy Roots. Sci. Rep. 2017, 7, 5104. [Google Scholar] [CrossRef] [PubMed]
  39. Misson, J.; Raghothama, K.G.; Jain, A.; Jouhet, J.; Block, M.A.; Bligny, R.; Ortet, P.; Creff, A.; Somerville, S.; Rolland, N.; et al. A genome-wide transcriptional analysis using Arabidopsis thaliana Affymetrix gene chips determined plant responses to phosphate deprivation. Proc. Natl. Acad. Sci. USA 2005, 102, 11934–11939. [Google Scholar] [CrossRef] [PubMed]
  40. Morcuende, R.; Bari, R.; Gibon, Y.; Zheng, W.; Pant, B.D.; Blã¤Sing, O.; Usadel, B.; Czechowski, T.; Udvardi, M.K.; Stitt, M. Genome-wide reprogramming of metabolism and regulatory networks of Arabidopsis in response to phosphorus. Plant Cell Environ. 2007, 30, 85–112. [Google Scholar] [CrossRef] [PubMed]
  41. Hassler, S.; Jung, B.; Lemke, L.; Novák, O.; Strnad, M.; Martinoia, E.; Neuhaus, H.E. Function of the Golgi-located phosphate transporter PHT4;6 is critical for senescence-associated processes in Arabidopsis. J. Exp. Bot. 2016, 67, 4671–4684. [Google Scholar] [CrossRef] [PubMed]
  42. Sun, T.; Li, M.; Shao, Y.; Yu, L.; Ma, F. Comprehensive Genomic Identification and Expression Analysis of the Phosphate Transporter (PHT) Gene Family in Apple. Front. Plant Sci. 2017, 8, 426. [Google Scholar] [CrossRef] [PubMed]
  43. Du, H.; Yang, C.; Ding, G.; Shi, L.; Xu, F. Genome-Wide Identification and Characterization of SPX Domain-Containing Members and Their Responses to Phosphate Deficiency in Brassica napus. Front. Plant Sci. 2017, 8, 35. [Google Scholar] [CrossRef] [PubMed]
  44. Liu, T.Y.; Huang, T.K.; Yang, S.Y.; Hong, Y.T.; Huang, S.M.; Wang, F.N.; Chiang, S.F.; Tsai, S.Y.; Lu, W.C.; Chiou, T.J. Identification of plant vacuolar transporters mediating phosphate storage. Nat. Commun. 2016, 7, 11095. [Google Scholar] [CrossRef] [PubMed]
  45. Puga, M.I.; Mateos, I.; Charukesi, R.; Wang, Z.; Franco-Zorrilla, J.M.; De, L.L.; Irigoyen, M.L.; Masiero, S.; Bustos, R.; Rodríguez, J. SPX1 is a phosphate-dependent inhibitor of Phosphate Starvation Response 1 in Arabidopsis. Proc. Natl. Acad. Sci. USA 2014, 111, 14947–14952. [Google Scholar] [CrossRef] [PubMed]
  46. Duan, K.; Yi, K.; Dang, L.; Huang, H.; Wu, W.; Wu, P. Characterization of a sub-family of Arabidopsis genes with the SPX domain reveals their diverse functions in plant tolerance to phosphorus starvation. Plant J. 2008, 54, 965–975. [Google Scholar] [CrossRef] [PubMed]
  47. Jing, S.; Han, H.; Zhang, K.; Wei, Z.; Yu, Y.; Wu, Z.; Ping, W. The paralogous SPX3 and SPX5 genes redundantly modulate Pi homeostasis in rice. J. Exp. Bot. 2014, 65, 859–870. [Google Scholar]
  48. Secco, D.; Wang, C.; Arpat, B.A.; Wang, Z.; Poirier, Y.; Tyerman, S.D.; Wu, P.; Shou, H.; Whelan, J. The emerging importance of the SPX domain-containing proteins in phosphate homeostasis. New Phytol. 2012, 193, 842–851. [Google Scholar] [CrossRef] [PubMed]
  49. Shao, Y.; Wei, J.; Wu, F.; Zhang, H.; Yang, D.; Liang, Z.; Jin, W. DsTRD: Danshen Transcriptional Resource Database. PLoS ONE 2016, 11, e0149747. [Google Scholar] [CrossRef] [PubMed]
  50. Farooq, M.A.; Gill, R.A.; Faisal, I.; Basharat, A.; Liu, H.; Xu, J.; He, S.; Zhou, W. Methyl Jasmonate Regulates Antioxidant Defense and Suppresses Arsenic Uptake in Brassica napus L. Front. Plant Sci. 2016, 7, 468. [Google Scholar] [CrossRef] [PubMed]
  51. Sharma, P.; Jha, A.B.; Dubey, R.S.; Pessarakli, M. Reactive Oxygen Species, Oxidative Damage, and Antioxidative Defense Mechanism in Plants under Stressful Conditions. J. Bot. 2012, 2012, 217037. [Google Scholar] [CrossRef]
  52. Xing, B.; Yang, D.; Guo, W.; Liang, Z.; Yan, X.; Zhu, Y.; Liu, Y. Ag+ as a more effective elicitor for production of tanshinones than phenolic acids in Salvia miltiorrhiza hairy roots. Molecules 2015, 20, 309–324. [Google Scholar] [CrossRef] [PubMed]
  53. Livak, K.J.; Schmittgen, T.D. Analysis of relative gene expression data using real-time quantitative PCR and the 2(-Delta Delta C(T)) Method. Methods 2001, 25, 402–408. [Google Scholar] [CrossRef] [PubMed]
  54. Shi, Q.; Bao, Z.; Zhu, Z.; Ying, Q.; Qian, Q. Effects of Different Treatments of Salicylic Acid on Heat Tolerance, Chlorophyll Fluorescence, and Antioxidant Enzyme Activity in Seedlings of Cucumis sativa L. Plant Growth Regul. 2006, 48, 127–135. [Google Scholar] [CrossRef]
  55. Re, R.; Pellegrini, N.; Proteggente, A.; Pannala, A.; Yang, M.; Rice-Evans, C. Antioxidant activity applying an improved ABTS radical cation decolorization assay. Free Radic. Biol. Med. 1999, 26, 1231–1237. [Google Scholar] [CrossRef]
Sample Availability: Samples of the compounds are available from the authors.
Figure 1. Biomasses of hairy roots in different inorganic phosphate (Pi) concentration conditions. (A) The fresh weight. (B) The dry weight. Sm, S. miltiorrhiza; Sc, S. castanea. Different letters indicate significant differences by applying Duncan’s multiple range test.
Molecules 23 01132 g001
Figure 2. Effects of Pi deficiency on the content and yield of secondary metabolites in hairy roots. (A1,A2) Content and yield of CA. (B1,B2) Content and yield of RA. (C1,C2) Content and yield of LAB. (D1,D2) Content and yield of DT. (E1,E2) Content and yield of CT. (F1,F2) Content and yield of TI. (G1,G2) Content and yield of T2A. Different letters indicate significant differences by applying Duncan’s multiple range test. Sm, S. miltiorrhiza; Sc, S. castanea; CA, caffeic acid; LAB, salvianolic acids B; RSA, rosmarinic acids; TI, tanshinone I; IIA, tanshinone IIA; DT, dihydrotanshinone I; CT, cryptotanshinone.
Molecules 23 01132 g002
Figure 3. Quantification of the transcript levels of key enzyme genes in hairy roots under control and Pi-deficient conditions at different times (10th, 15th, 20th day). Quantification of the transcript levels of key enzyme genes were calculated in relation to β-actin reference gene transcript levels. (A) Genes involved in phenolic acid biosynthesis. (B) Genes involved in tanshinone biosynthesis. Sm, S. miltiorrhiza; Sc, S. castanea; PAL, phenylalanine ammonia lyase; TAT, tyrosine aminotransferase; RAS, rosmarinic acid synthase; CYP98A14, cytochrome P450-dependent monooxygenase; DXS1, 1-deoxy-d-xylulose 5-phosphate 1; HMGR, 3-hydroxy-3-methylglutary CoA reductase; KSL, kaurene synthase-like; CYP76AH1, cytochrome P450-dependent monooxygenase. The asterisk “*”represents 0.01 < p < 0.05; asterisks “**”represents p < 0.01 compared to the control phosphate value and obtained via Student’s t-test by SPSS.
Molecules 23 01132 g003
Figure 4. Expression of SPX1 and SPX3 in S. miltiorrhiza (A,C) and S. castanea (B,D) under control and Pi-deficient conditions. Quantification of the transcript levels of SPX genes were calculated in relation to β-actin reference gene transcript levels. Sm, S. miltiorrhiza; Sc, S. castanea; SPX, Syg1-Pho81-Xpr1. The double-asterisk “**”represents p < 0.01 compared to the control Pi value and obtained via Student’s t-test by SPSS.
Molecules 23 01132 g004
Figure 5. Pi concentration in hairy roots under control and Pi-deficient conditions. Sm, S. miltiorrhiza; Sc, S. castanea; different letters indicate significant differences by applying Duncan’s multiple range test.
Molecules 23 01132 g005
Figure 6. Antioxidant enzyme activities in hairy roots under control and Pi-deficient conditions. Sm, S. miltiorrhiza; Sc, S. castanea; different letters indicate significant differences by applying Duncan’s multiple range test.
Molecules 23 01132 g006
Figure 7. DPPH radical scavenging and ABTS radical scavenging of hairy roots under control and Pi-deficient conditions. Sm, S. miltiorrhiza; Sc, S. castanea; different letters indicate significant differences by applying Duncan’s multiple range test.
Molecules 23 01132 g007
Figure 8. The model of interaction of plants with Pi deficiency based on secondary metabolism and antioxidant defenses. Uncertain steps are represented by dotted lines.
Molecules 23 01132 g008

