Article

Single Laboratory Validation of a Quantitative Core Shell-Based LC Separation for the Evaluation of Silymarin Variability and Associated Antioxidant Activity of Pakistani Ecotypes of Milk Thistle (Silybum Marianum L.)

1
Laboratoire de Biologie des Ligneux et des Grandes Cultures (LBLGC), INRA USC1328, Université d’Orléans, Pôle Universitaire d’Eure et Loir, 21 rue de Loigny la Bataille, 28000 Chartres, France
2
Bioactifs et Cosmétiques, GDR 3711 COSMACTIFS, CNRS/Université d'Orléans, 45100 Orléans, France
3
Department of Biotechnology, Quaid-i-Azam University, Islamabad 45320, Pakistan
4
Ecole Sciences industrielles et technologiques de l’information (SITI), Département Chimie Alimentation Santé Environnement Risque (CASER), Le CNAM 75141 Paris Cedex 03, France
5
Plantes Médicinales et Aromatiques 28, PMA28, 1, place de l’Eglise, 28140 Varize, France
*
Author to whom correspondence should be addressed.
Molecules 2018, 23(4), 904; https://doi.org/10.3390/molecules23040904
Submission received: 21 February 2018 / Revised: 6 April 2018 / Accepted: 13 April 2018 / Published: 14 April 2018

Abstract

:
Fruits of Silybum marianum (L.) Gaernt are the main source of taxifolin derived flavonolignans. Together, these molecules constitute a mixture called silymarin with many useful applications for cosmetic and pharmaceutic industries. Here, a validated method for the separation of the silymarin constituents has been developed to ensure precision and accuracy in their quantification. Each compound was separated with a high reproducibility. Precision and repeatability of the quantification method were validated according to the AOAC recommendations. The method was then applied to study the natural variability of wild accessions of S. marianum. Analysis of the variation in the fruits composition of these 12 accessions from Pakistan evidenced a huge natural diversity. Correlation analysis suggested a synergistic action of the different flavonolignans to reach the maximal antioxidant activity, as determined by cupric ion reducing antioxidant capacity (CUPRAC) and ferric reducing antioxidant power (FRAP) assays. Principal component analysis (PCA) separated the 12 accessions into three distinct groups that were differing from their silymarin contents, whereas hierarchical clustering analysis (HCA) evidenced strong variations in their silymarin composition, leading to the identification of new silybin-rich chemotypes. These results proved that the present method allows for an efficient separation and quantification of the main flavonolignans with potent antioxidant activities.

Graphical Abstract

1. Introduction

The fruit of milk thistle (Silybum marianum L.) is a rich source of phytochemicals compounds with multiple biological interest. Among them, silymarin is accumulated in the pericarp (the most external part of the fruit) up to 9% (w/w) and it is composed of a mixture of flavonolignans: silybin A, silybin B, silydianin, silychristin, isosilybin A, and isosilybin B, deriving from taxifolin their common flavone precursor (Figure 1) [1,2,3,4,5,6,7].
Milk thistle has been used as a medicinal plant for centuries as a remedy for various diseases [8,9]. Its extract is used as food supplements based on its traditional use in the European pharmacopoeia as liver detoxifier [10] and as an antidote against Amanita phalloides intoxication [11,12]. Those effects have been related to its well-known hepatoprotective action [2,3,4,13,14], limiting acute liver injuries thanks to pronounced anti-inflammatory actions and antioxidant activity [15], which is described at both the cellular and molecular levels [16]. Its main constituent Silybin have been largely studied and proposed to display various health promoting effects, such as hypocholesterolaemic action [17] or potential chemopreventive action in human prostate carcinoma [18]. Topical applications of silybin also display a large array of beneficial actions on skin: anti-inflammatory [19], protection against UV-B radiations and sun burns [20,21,22], antiglycation action [23], and prevention of skin cancers [24].
All of those biological activities evidence the great potential of Silybum marianum extracts for pharmaceutical and cosmeceutical applications. Unfortunately, as reported by Chambers et al. [25], in most of the studies dealing with biological activities of S. marianum extract, their composition is rarely determined. Since silymarin content and composition greatly vary in large amounts depending on the extraction procedure, the genetic background, and/or the edaphic parameters, this could result in reproducibility and validity issues [25]. From a chemical point of view, silymarin is composed of different isomers that are difficult to separate. This could explain why, in many cases, publications that are dealing with the elucidation of S. marianum biological activities, silymarin is usually quantified as a whole whereas the relative amounts of the different constituents can vary and are not measured. Among these different constituents, silybins are the major bioactive component of S. marianum extract [6,7], thus reinforcing the need of validated (quantitative) methods for the accurate evaluation of their concentration levels.
The understanding of the flavonolignans biosynthesis is currently an important factor to progress in the use of these molecules. Learning more about the natural genetic influencing flavonolignans accumulation is an important step. Native from the Mediterranean area, S. marianum propagates through the world with a vigorous growth in warm and dry regions [2,26]. It was observed to develop locally adapted subpopulations, which are also known as ecotypes, which can differ by their phenotype, growth, tolerance for temperature, light, nutrients, and/or stress [27]. These ecotypes also displayed a wide range of variation in their silymarin content and composition, as described for ecotypes from Egypt, Iran, Poland, Hungary, Bulgaria, Germany, Canada, and New Zealand [25,28,29,30,31,32]. Because of the very rapid propagation of this plant, milk thistle has become a widespread weed, especially in north Pakistan, being widely used by phytomedicine industry [32]. However, variability in silymarin concentration and composition of wild S. marianum accessions from Pakistan have never been studied. Investigating the content of various ecotypes would help to discover the best plants for phytomedicine and cosmetic applications. In this context, optimizing the accurate and quantitative separation protocol for these compounds in a simple way is essential to facilitate their further exploration. For this purpose, we have first developed and validated a quantitative and reproducible LC-based method for the separation of the different flavonolignans from S. marianum fruits using core-shell technology. Subsequently, this method was applied to investigate the natural variability in the silymarin content of wild populations of S. marianum, which are grown in Pakistan in order to enhance our current understanding of the chemical diversity and to estimate associated antioxidant capacities of these compounds.

2. Materials and Methods

2.1. Plant Material

The achenes of Silybum marianum of Pakistani purple ecotypes were collected by the Department of Biotechnology from Quaid-i-Azam University and identified by Dr BH Abbasi [32].

2.2. Chemicals

All of the solvents and reagents for extraction and HPLC analysis were of analytical grade or the highest available purity (Thermo Fischer Scientific, Illkirch, France). Deionized water was purified by a Milli-Q water-purification system (Merck Millipore Fontenay sous Bois, Paris, France). All of the solutions that were prepared for HPLC were filtered through 0.45 µm nylon syringe membranes prior to use. Silybin A-B (1612630), silybin B (95684), isosilybin A (97326), isosilybin B (59527), silydianin (30494), and silychristin (51681) standards were purchased from Sigma Aldrich (Saint-Quentin Fallavier, France). Standardized commercial silymarin mixture (S0292) was purchased from Sigma Aldrich.

2.3. Extraction

Samples of 60mg milled inflorescences dry weight (DW) were extracted in 1 mL of 50% ethanol solvent. The ultrasonic bath used was a USC1200TH (VWR International, Fontenay-sous-Bois, France; inner dimension: 300 mm × 240 mm × 200 mm). The extraction was conducted for 60 minutes at an ultrasound frequency of 45 kHz and a temperature of 25 °C. According to Corbin et al., 2015 [33], the extract supernatant was filtered through 0.45 µm nylon syringe membranes before HPLC injection.

2.4. HPLC-ESI-MS Analysis

Silymarin compounds were quantified using a LC-MS analysis that was performed on a Water 2695 Alliance (Waters-Micromass, Manchester, UK) coupled with a single quadrupole mass spectrometer ZQ (Waters-Micromass, Manchester, UK). LC-ESI-MS data were collected in the positive and negative modes. Data acquisition and processing were performed with MassLynx 4.0 software (Waters-Micromass, Manchester, UK). The separation was performed at 35 °C on a core-shell column (Kinetex 5 µm XB-C18, 100 Å, LC Column 150 × 4.6 mm, C18 with iso-butyl side chains, and with TMS endcapping, core-shell silica, Phenomenex Le Pecq France). The mobile phase was composed with a mixture of methanol (solvent A) and HPLC grade water (solvent B), both being acidified with 0.05% formic acid. A linear gradient was applied for the mobile phase variation, ranging from a 5:95 (v/v) to 100:0 (v/v) mixture of solvents A and B, respectively, with a flow rate of 1.30 mL/min. The injection volume was 3 µL, the maximum back pressure was 110 bar and the detection was performed at 280 nm. Flavonolignans were identified by comparison with authentic standards (Sigma Aldrich). The limits of detection (LOD) and the limits of quantification (LOQ) were determined based on the signal-to-noise ratio (S:N) of 3:1 and 10:1, respectively.

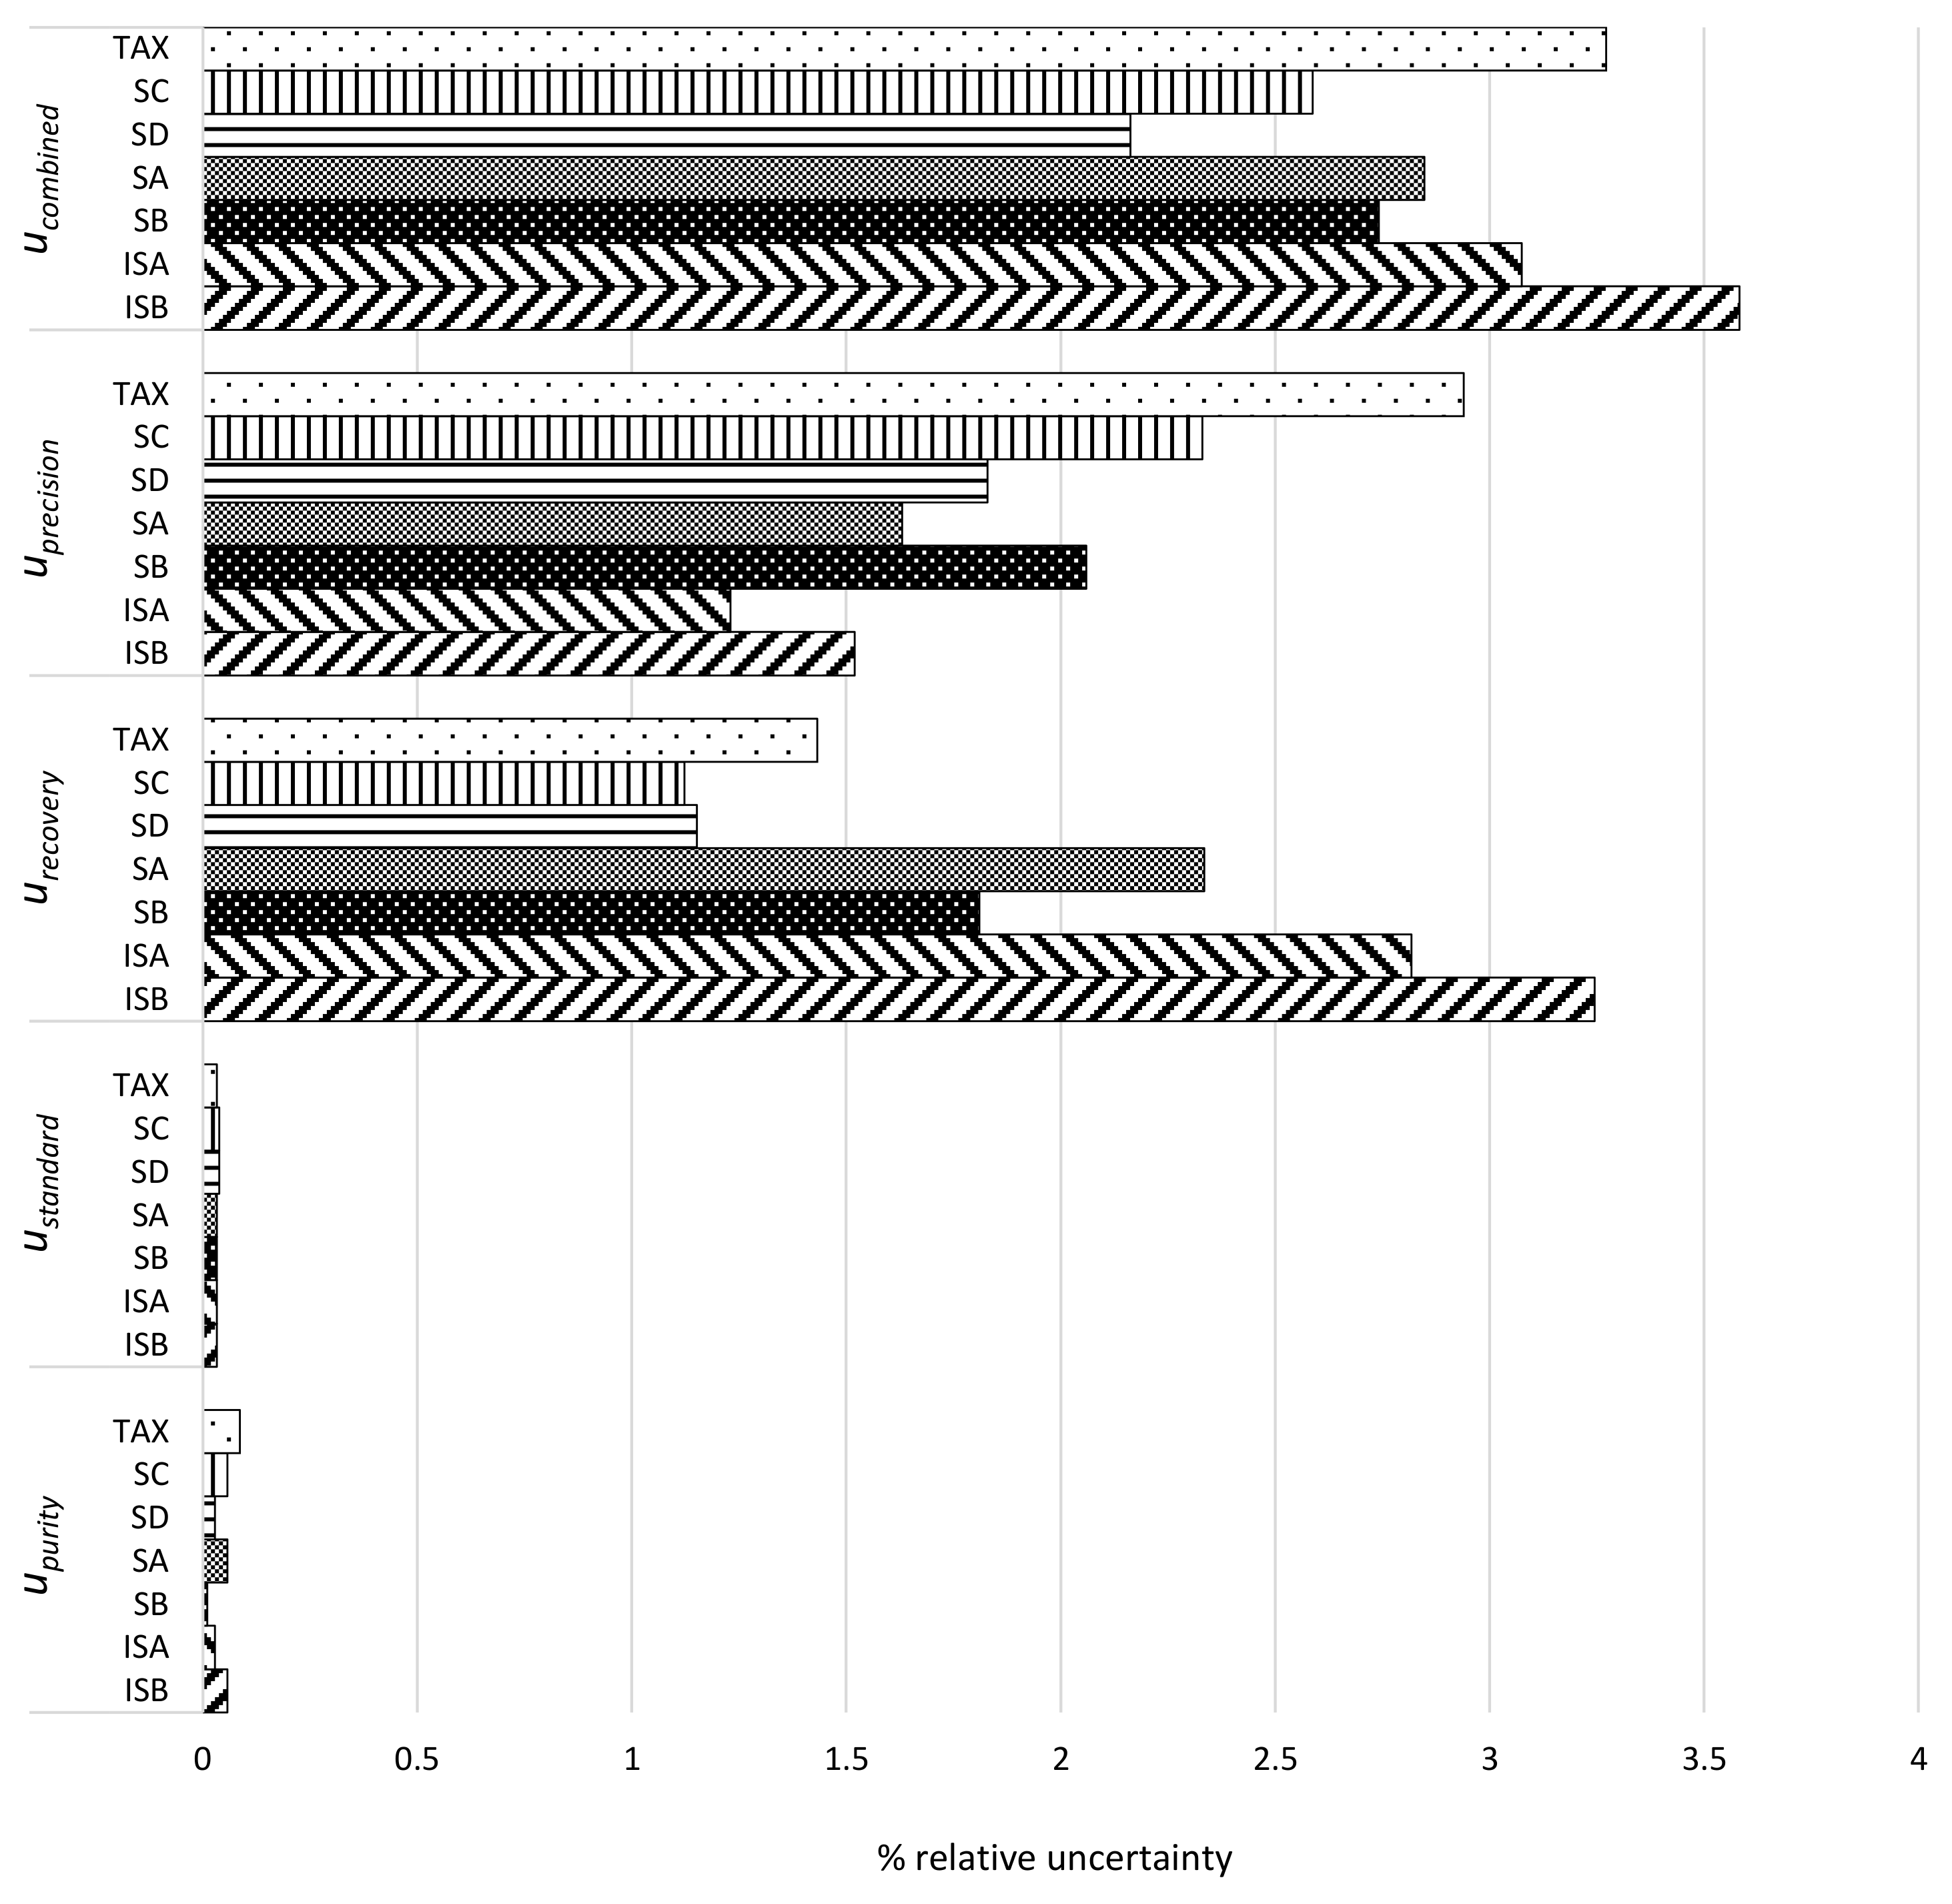
2.5. Method Validation

The separation method was validated as follows: The linear correlations between peak area and standard concentrations were found to be high in the range of 0.5–50 µg·mL−1. The resulting linear equations were obtained with R2-value for a six-point calibration graph >0.99, and the slopes of five replicates of the calibration graph covering the analytical range for each standard varied no more than 1% in terms of RSD over a period of four weeks. The LOD and LOQ were calculated using S/N ratio of 3 and 10, respectively. The repeatability precision was evaluated by six injections of the same sample that were performed on the same day. Stability was evaluated by calculating the recovery, RSD and average recovery using spiked concentration additions at three different levels (25, 50, and 100 ppm). The matrix effect was determined by calculating the recovery from two different matrixes (commercial silymarin preparation (Sigma Aldrich) and non-defatted whole fruit extract, which was prepared as described in paragraph 2.3).
Uncertainty estimation of the final quantitative results was evaluated using standard uncertainty calculations for intra-laboratory analytical procedure devoted to natural antioxidants deriving from plant materials [34,35,36]. Uncertainties u standard resulting from stock and calibration standard preparation, u purity resulting from standard purity, u recovery and u precision resulting from analytical method recovery and precision characteristics were calculated, as described by Sin et al (2006) [34].
u standard = ( u stock ) 2 + ( u volume ) 2 + ( u pipette ) 2
uncertainty of standard preparation calculated using
u stock = ( u balance ) 2 + ( u volume ) 2
with uncertainty of analytical balance ubalance (Mettler Toledo, Viroflay, France) and uncertainty of volume uvolume for volumetric flasks (Thermo) and pipettes (Eppendorf, Montesson, France), which were calculated using manufacturers specifications.
upurity calculated using purity percentages provided by manufacturer (Sigma Aldrich).
u recovery = RSD 1 2 ( n 1 1 ) + RSD 2 2 ( n 2 1 ) ( n 1 1 ) + ( n 2 1 )
calculated as the sum of the relative standard deviation (RSD) percentage of spike recovery (RSD1) and the difference from the standardized commercial preparation (S0292, Sigma Aldrich) (RSD2).
u precision = SD n
calculated using the standard deviation (SD) of the relative percentage difference of repeatability precision results, where n corresponds to the number (6) of independent replicates.
u Combined = ( u standard ) 2 + ( u purity ) 2 + ( u recovery ) 2 + ( u precision ) 2
calculated as the square root of the sum of individual uncertainty.

2.6. Determination of Total Phenolic Production

The total phenolic content (TPC) was analyzed by using Folin-Ciocalteu (FC, Sigma Aldrich) reagent, according to the method that was reported in [37]. 10 µL of milk thistle sample was mixed with 180 µL of a preparation composed to 4% Na2CO3 (in NaOH 0.1 M), 0.02% potassium sodium tartrate tetrahydrate and 0.02% CuSO4. After 10 min of incubation at room temperature (25 ± 2 °C), 10 µL of the FC reagent (diluted 1/3 with distilled water) were added to the above mixture and after 30 min of incubation at room temperature, the absorbance was measured at 735 nm with a spectrophotometer (BioTek ELX800 Absorbance Microplate Reader, BioTek Instruments, Colmar, France). Gallic acid (Sigma Aldrich) was used as the standard for the calibration curve, and the total phenolic contents (TPC) were expressed as milligrams gallic acid equivalents per gram.
Total phenolic production (mg·L−1) = DW (g·L−1) × TPC (mg·g−1)

2.7. Determination of Total Flavonoid Production

Total flavonoid content (TFC) was determined by using aluminum chloride (AlCl3, Sigma Aldrich) colorimetric method that was reported by Xu et al., 2015 [38] with minor modifications. Briefly, 10 μL of the Silybum marianum sample was mixed with 10 μL of potassium acetate (1 M) and 10 μL of AlCl3 (10%, w/v) and 170 µL double distilled water. This mixture was incubated for 30 min at room temperature (25 ± 2 °C), and then the absorbance was measured at 415 nm by using UV–visible spectrophotometer (BioTek ELX800 Absorbance Microplate Reader, BioTek Instruments). Quercetin (Sigma Aldrich) was used as the standard for the calibration curve, and the total flavonoid contents were expressed as milligrams quercetin equivalents per gram.
Total flavonoid production (mg·L−1) = DW (g·L−1) × TFC (mg·g−1)

2.8. Determination of Antioxidant Activity

For antioxidant activity determination, ferric reducing antioxidant power (FRAP) was used by [39] and cupric ion reducing antioxidant capacity (CUPRAC) by [40] with little modification. Briefly, for FRAP 10 μL of the extracted sample was mixed with 190 μL of FRAP (10 mM TPTZ; 20 mM FeCl3, 6H2O and 300 mM acetate buffer pH3.6; ratio 1:1:10 (v/v/v)) and for CUPRAC 10 μL of the extracted sample was mixed with 190 μL of CUPRAC (10mM Cu(II); 7.5 mM neocuproine and 1 M acetate buffer pH 7; ratio 1:1:1 (v/v/v)). Both of them incubated the reaction mixture for 15 min at room temperature (25 ± 2 °C). Absorbance of the reaction mixture was measured at 630 nm for FRAP, and 450 nm for CUPRAC by using a BioTek ELX800 Absorbance Microplate Reader (BioTek Instruments).

2.9. Statistical Treatment of Data

The means and the standard deviation were used to present the data composed of three to six independent replicates. ANOVA was performed for comparative statistical analyses by using XLSTAT 2015 (Addinsoft, Paris, France). The correlation matrix was obtained with R corrplot package by performing the Pearson parametric correlation test to obtain a correlogram.

3. Results and Discussion

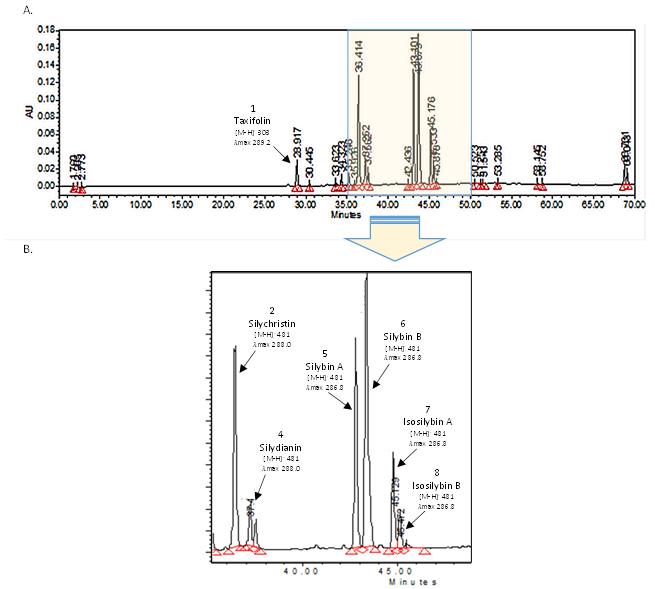
3.1. Single Laboratory Validation of a LC-Based Separation of the Silymarin Constituents

An optimal separation of the main constituents from a commercial silymarin mixture (Sigma Aldrich, S0292) was achieved using a core-shell column (Kinetex C18, 5 µm core-shell technology, Phenomenex) and a mobile phase that was consisting of a mixture of methanol and HPLC grade water, which were both acidified with 0.05% formic acid. In our hands, when compared to fully porous C18 column, the resolution was enhanced by the use of a core-shell column (data not shown). The superior efficiency and the improved peak symmetry and resolution of core-shell columns, when compared to the most common monolithic columns, for the analysis of the silybin (A and B) diastereoisomers were already described [22,23,41]. Moreover, the core-shell technology is enough versatile to allow for an easier possible transition of the present protocol to other methodologies, such as UPLC [41,42,43,44]. The typical LC-MS chromatogram (with detection set at 280 nm) is presented in Figure 2 and Figure S1.
In Figure 2, the effective separation of taxifolin (28.92 min, m/z [M − H] 303, λmax 289.2), silychristin (36.42 min, m/z [M − H] 481, λmax 288.0), silydianin (7.65 min, m/z [M − H] 481, λmax 288.0), silybin A (43.15 min, m/z [M − H] 481, λmax 286.8), silybin B (43.29 min, m/z [M − H] 481, λmax 288.0), isosilybin A (45.18 min, m/z [M − H] 481, λmax 288.0), and isolsilybin B (45.89 min, m/z [M − H] 481, λmax 288.0) is observed with a correct resolution of the method since all of the obtained Rs were greater than 1.5 (Table 1). Each compound was separated with a high stability, as indicated by their relative standard deviation in their retention time values ranging from 0.01, for silychristin, silybin A and isosilybin B, to 0.03 min for silydianin (i.e., lower than 0.01% variation). The detection and identification were asserted by both UV spectra and MS data as compared to those of authentic standards. To ensure precision and repeatability in the quantification, the method was then validated according to the association of analytical communities (AOAC) recommendations [45].
In our hands, the standard calibration curves exhibited correlation coefficient values that are greater than 0.9989 (Table 1). The limits of detection (LOD) and quantification (LOQ) ranged from 0.05 µg·mL−1 for silybins and isosilybins to 0.10 µg·mL−1 for silydianin for method LODs, and 0.15 µg·mL−1 for silybins to 0.32 µg·mL−1 for silydianin for method LOQs (Table 1). Our LODs and LOQs values are in the ranges that are described in the literature [41,44].
The repeatability precision was assessed by the percentage of relative standard deviation (RSD) as low as 5% and the Horwitz ratio (HorRat) as low as 1.69 (Table 2), which were calculated for the separation of each analyte from a standardized commercial Silymarin extract (S02092, Sigma Aldrich).
In order to evaluate the separation quality, the recovery of individual analytes was studied at three spiked concentration levels (Table 3).
The average recovery of each compound was at least 97.88% (for isosilybin A at 25 ppm spiked addition) and highest RSD as 7.71% (for isosilybin A at 50 ppm spiked addition) (Table 3), indicating a good stability of the separation.
The matrix effect was also investigated using a 50 ppm concentration level addition on extracts from different origins: a commercial preparation of silymarin and an extract of laboratory-grown non-defatted milk thistle fruits obtained following ultrasonic extraction (Table 4).
Values of recovery that were close to 100% indicate that the origin of the extract does not affect the quality of the different separation constituents, thus highlighting the absence of the concentration and matrix effect (Table 4), and evidencing that the present separation method is quantitative.
Uncertainty estimation of the final quantitative results was finally evaluated using standard a procedure that was described by Konieczka and Namiesnik [36], and the uncertainty calculations for analytical procedure devoted to natural antioxidants deriving from plant materials [34,35,36]. Sources of uncertainty were determined, as described in Figure S3. Uncertainties arising from standard stock purity upurity, standard preparation ustandard, method recovery urecovery, and intermediate precision uprecision and combined uncertainty ucombined were calculated for each compound and were presented in the uncertainty histogram that is shown in Figure 3.
The combined uncertainty ucombined for the different analytes ranged from 2.16% for silydianin to 3.58% for isosilybin B (Figure 3). As expected, the main contributors to uncertainty were those that were resulting from method recovery and intermediate precision (Figure 3). These values are in the ranges that were described in the literature for methods applied to the quantification of natural antioxidants from plant materials [34,35]. According to the recommendations for accreditation and quality assurance [46], the obtained uncertainty values confirmed that the overall method performances provide an adequate estimation of the different silymarin constituents for practical applications. Expanded uncertainty (uexpanded) using a coverage factor of 2 and at a 95% confidence level was estimated to be: ±7.2% for taxifolin, ±6.2% for silychristin, ±5.5% for silydianin, ±5.7% for silybin A, ±4.3% for silybin B, ±5.2% for isosilybin A, and ±6.5% for isosilybin B.
All together, these results confirmed that this single laboratory validated quantitative separation could be applied to the evaluation of silymarin constituents from different starting materials.

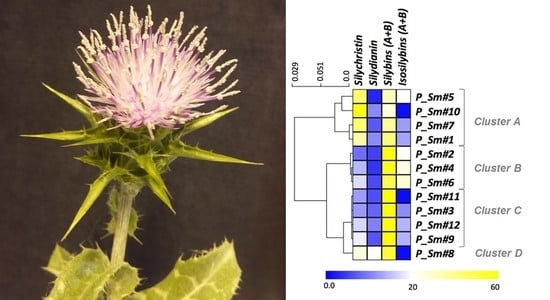
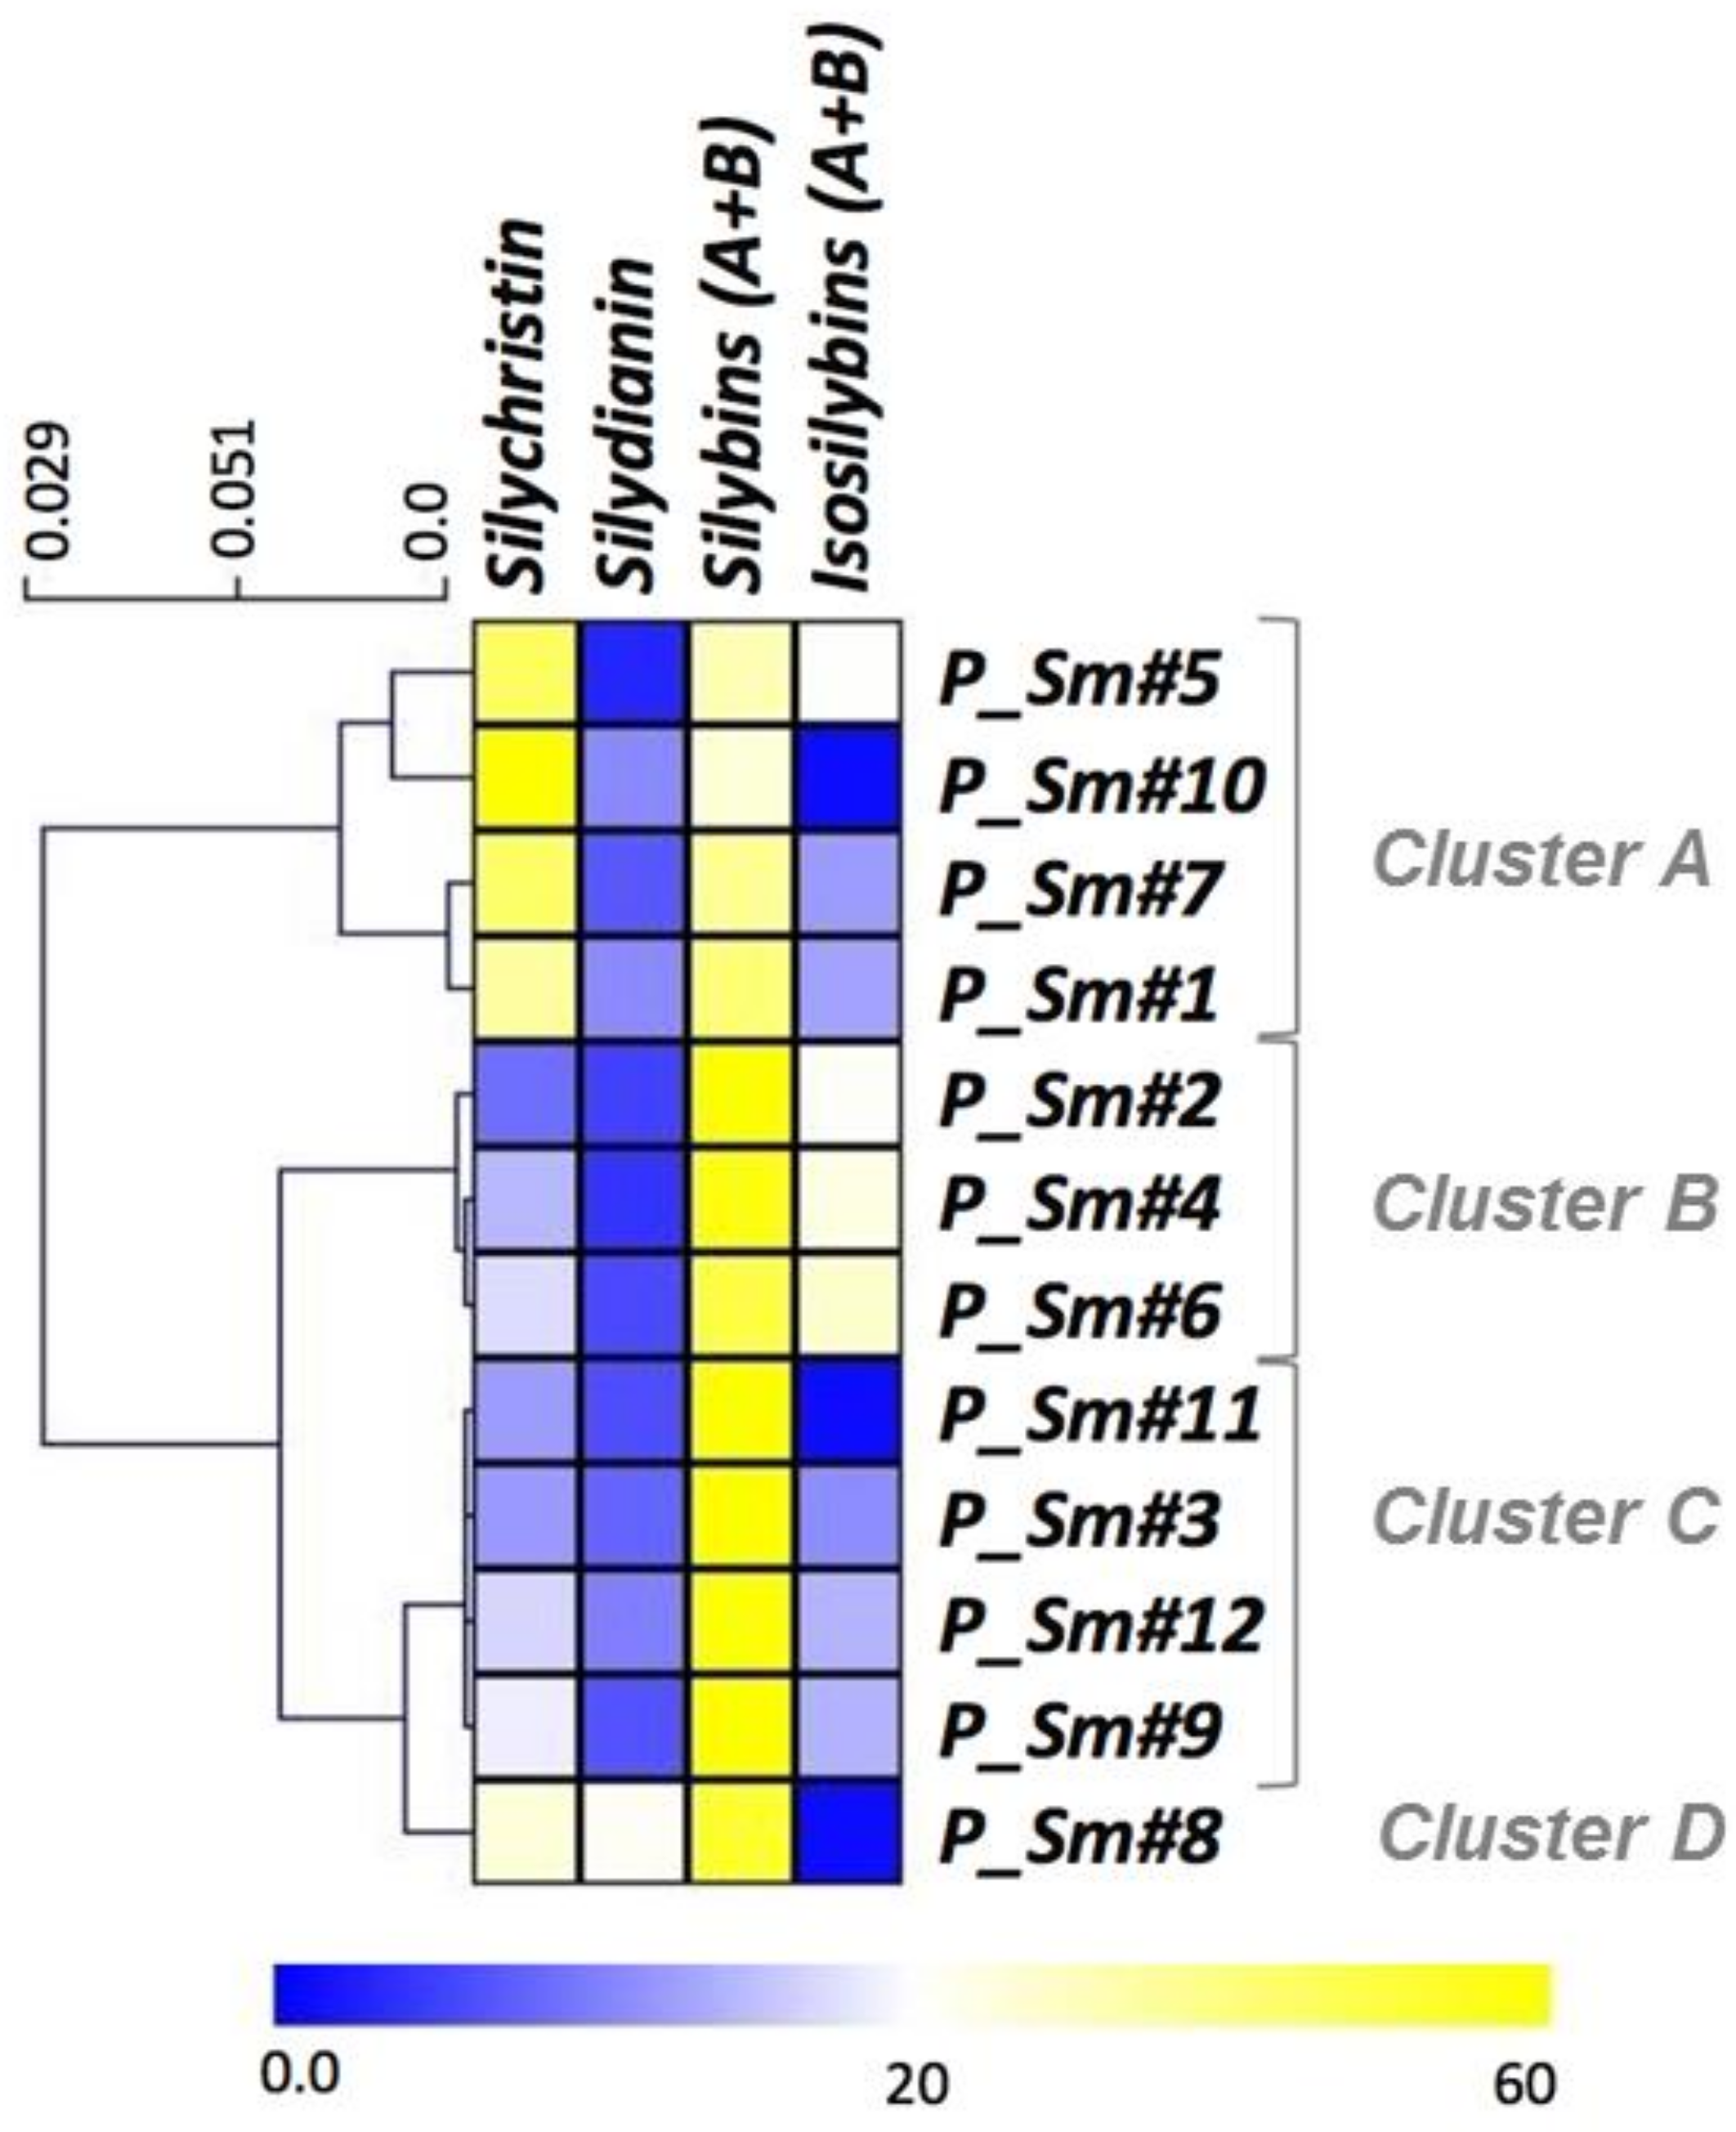
3.2. Evaluation of the Natural Variations in Silymarin Composition in Achene Extracts of Pakistani S. Marianum Accessions

Taking advantage of this validation separation method of the various constituents in silymarin mixture, its natural variation was further evaluated in the fruit (mature achene) of 12 wild Pakistani Silybum marianum samples (P_Sm#1-12). Non-defatted mature achenes were extracted using an ultrasound-assisted extraction procedure that is presented in Figure S4. This extraction procedure has been previously reported to enhance the amount of extracted silymarin extracted from mature fruits of S. marianum as compared to conventional methods, such as maceration [47]. Moreover, the defatting procedure has shown to result in severe silymarin loss [48]. With this extraction procedure, a huge variation in the silymarin content that ranged from 4.5 (P_Sm#10) to 23.6 (P_Sm#3) mg·g−1 DW of non-defatted whole fruits was observed (Table 5). This Silymarin variation range is comparable to those that were observed in other wild ecotypes from Egypt, Iran, Poland, Hungary, Bulgaria, Germany, Canada, and New Zealand (for review see [25]). Total phenolic and flavonoid contents were in the ranges of those that were previously reported [49]. This analysis revealed wild plants that contained high amounts of all these compounds (P_Sm#1 to #4), whereas some plants accessions were more specifically enriched in one compound: P_Sm#9 enriched in silybin A, P_Sm#5 and #7 enriched in silychristin, P_Sm#6 enriched in isosilybin or P_Sm#8 enriched in silydianin (Table 5). Concerning the individual variation in the different silymarin constituents, it ranged from: 0 to 2.1 mg·g−1 DW for taxifolin, 0.6 to 7.3 mg·g−1 DW for silychristin, 0.3 to 2.3 mg·g−1 DW for silydianin, 0.6 to 6.4 mg·g−1 DW for silybin A, 0.6 to 8.5 mg·g-1 DW for silybin B, 0 to 2.4 mg·g−1 DW for isosilybin A, and 0 to 2.3 mg·g−1 DW for isosilybin B (Table 5). These accumulation ranges were in line with those reported for other ecotypes [25].
It was mentioned that silymarin content and composition could deeply vary depending on the genetic background (i.e. ecotypes or cultivars) [30,50,51]. A strong fluctuation was also found in other studies, in particular, ecotypes from Egypt [52], Iran [50], as well as from Poland, Hungary, Bulgaria, and Germany [30].
The different ecotypes that were studied accumulated high levels of silybins (from 26% to 81% of total silymarin, for P_Sm#10 and P_Sm#11, respectively). Five ecotypes accumulated around 60% of silybins (P_Sm#2, #3, #9, #11 and #12) and four ecotypes of around 30% of silychristin (P_Sm#1, #5, #7, #8, and #10). Silydianin and isosilybins were accumulated in minor amounts: highest silydianin accumulations were around 20% for P_Sm#8 and c.a. for P_Sm#1, #10, and #12, whereas the uppermost accumulations of isosilybins were around 20% for P_Sm#2, #4, #5, and #6, and close to 10% for P_Sm#1, #3, #7, #9, and #12. All of these trends were presented in a heatmap representation and were analyzed through a hierarchical clustering analysis (HCA) in order to identify the potential chemotypes (Figure 4).
It has been previously shown that the composition of silymarin mixture depends on the Silybum marianum ecotypes from different countries [30]. Based on their phytochemical diversity, some of these milk thistles have been considered as chemotypes. To date, only three distinct Silybum marianum chemotypes have been described based on their silymarin composition: chemotype A, accumulating around 30% of silychristin and 60% of silybins; chemotype B, showing a silydianin content that was exceeding 70%; and, chemotype C, which was considered as an intermediate between chemotypes A and B with approximately 17% of silychristin, 40% silydianin and 30% silybins [53]. In our hands, P_Sm#1, #5, #7 and #10 from cluster A clearly matched the composition defined for chemotype A. As reported for chemotype C [53], P_Sm#8 presented a more balanced composition of silychristin, silydianin, and silybins, but without perfectly matching the percentages that were defined for this chemotype and could therefore be addressed to an enlarged chemotype C. The chemical profile of the two last clusters B and C, here observed, were not described to date and therefore constitute new chemotypes: chemotype D composed of 50% silybins and 20% isosilybins for cluster B grouping accessions P_Sm#2, #4, and #6 and chemotype E with a prominent accumulation of silybins (more than 60%) for cluster C grouping accessions P_Sm#3, #9, #11, and #12. Note that the silydianin-rich genotypes that were first described by Adzet et al. [54] were not found here within the 12 analyzed ecotypes. Further analyses will be necessary to conclude on the occurrence/absence of such silydianin-rich chemotype among Pakistani ecotypes.
Chemotypes could give important information about the biosynthesis sequence leading to the different flavonolignans constituting of the complex silymarin mixture. Despite the pharmacological and economic importance of these derivatives, to date, little is known about this biosynthetic pathway and its regulation. A principal component analysis (PCA) allow for us to further discriminate these 12 samples. The resulting biplot representation accounts for 80.42% (F1 + F2) of the initial variability of the data (Figure 5). Discrimination occurs mainly in the first dimension (F1 axis) which explains 65.71% of the initial variability and silymarin content, together with silybin A and taxifolin contents, was the main contributor for this axis. The other phytochemicals that were studied appeared to contribute to the second dimension (F2 axis), accounting for only 14.71% of the initial variability (Figure 2). PCA showed a significant grouping of samples as a function of their silymarin content. Using this analysis, the different ecotypes could also be easily discriminated into three different clusters depending on their phytochemical profile (Figure 4).This observation could be related to genetic data available for Pakistani genotypes [55]. The first cluster of four ecotypes (P_Sm#1, #2, #3, and #4) grouped ecotype together with high SM amount (high; Figure 4), as well as strong antioxidant activities (Figure 5). Contrarily, the last group is composed of six ecotypes (P_Sm#5, #6, #7, #8, #10, and #11) with low SM levels (low; Figure 5). The two remaining ecotypes (P_Sm#9 and #12) constitute the second cluster with an intermediate flavonolignans quantities and antioxidant activities (intermediate; Figure 5).
These results reflect the great natural genetic variability of these populations in terms of flavonolignans bioaccumulation. A similar separation was also proposed in a study of both wild and commercial populations from Iran, demonstrating the richness of wild ecotypes that will deserve further experiments [56]. Here, the wild ecotypes originating from Pakistan constitutes a natural source of biodiversity, moreover, due to the lack of cultivation of commercial varieties in this region, the risk of analyzing escape from commercial populations is lower. These 12 ecotypes showed chemical variations of their secondary metabolites due to the influence of their genetic background, although their morphology is not substantially transformed, only their chemical phenotype is shifting.

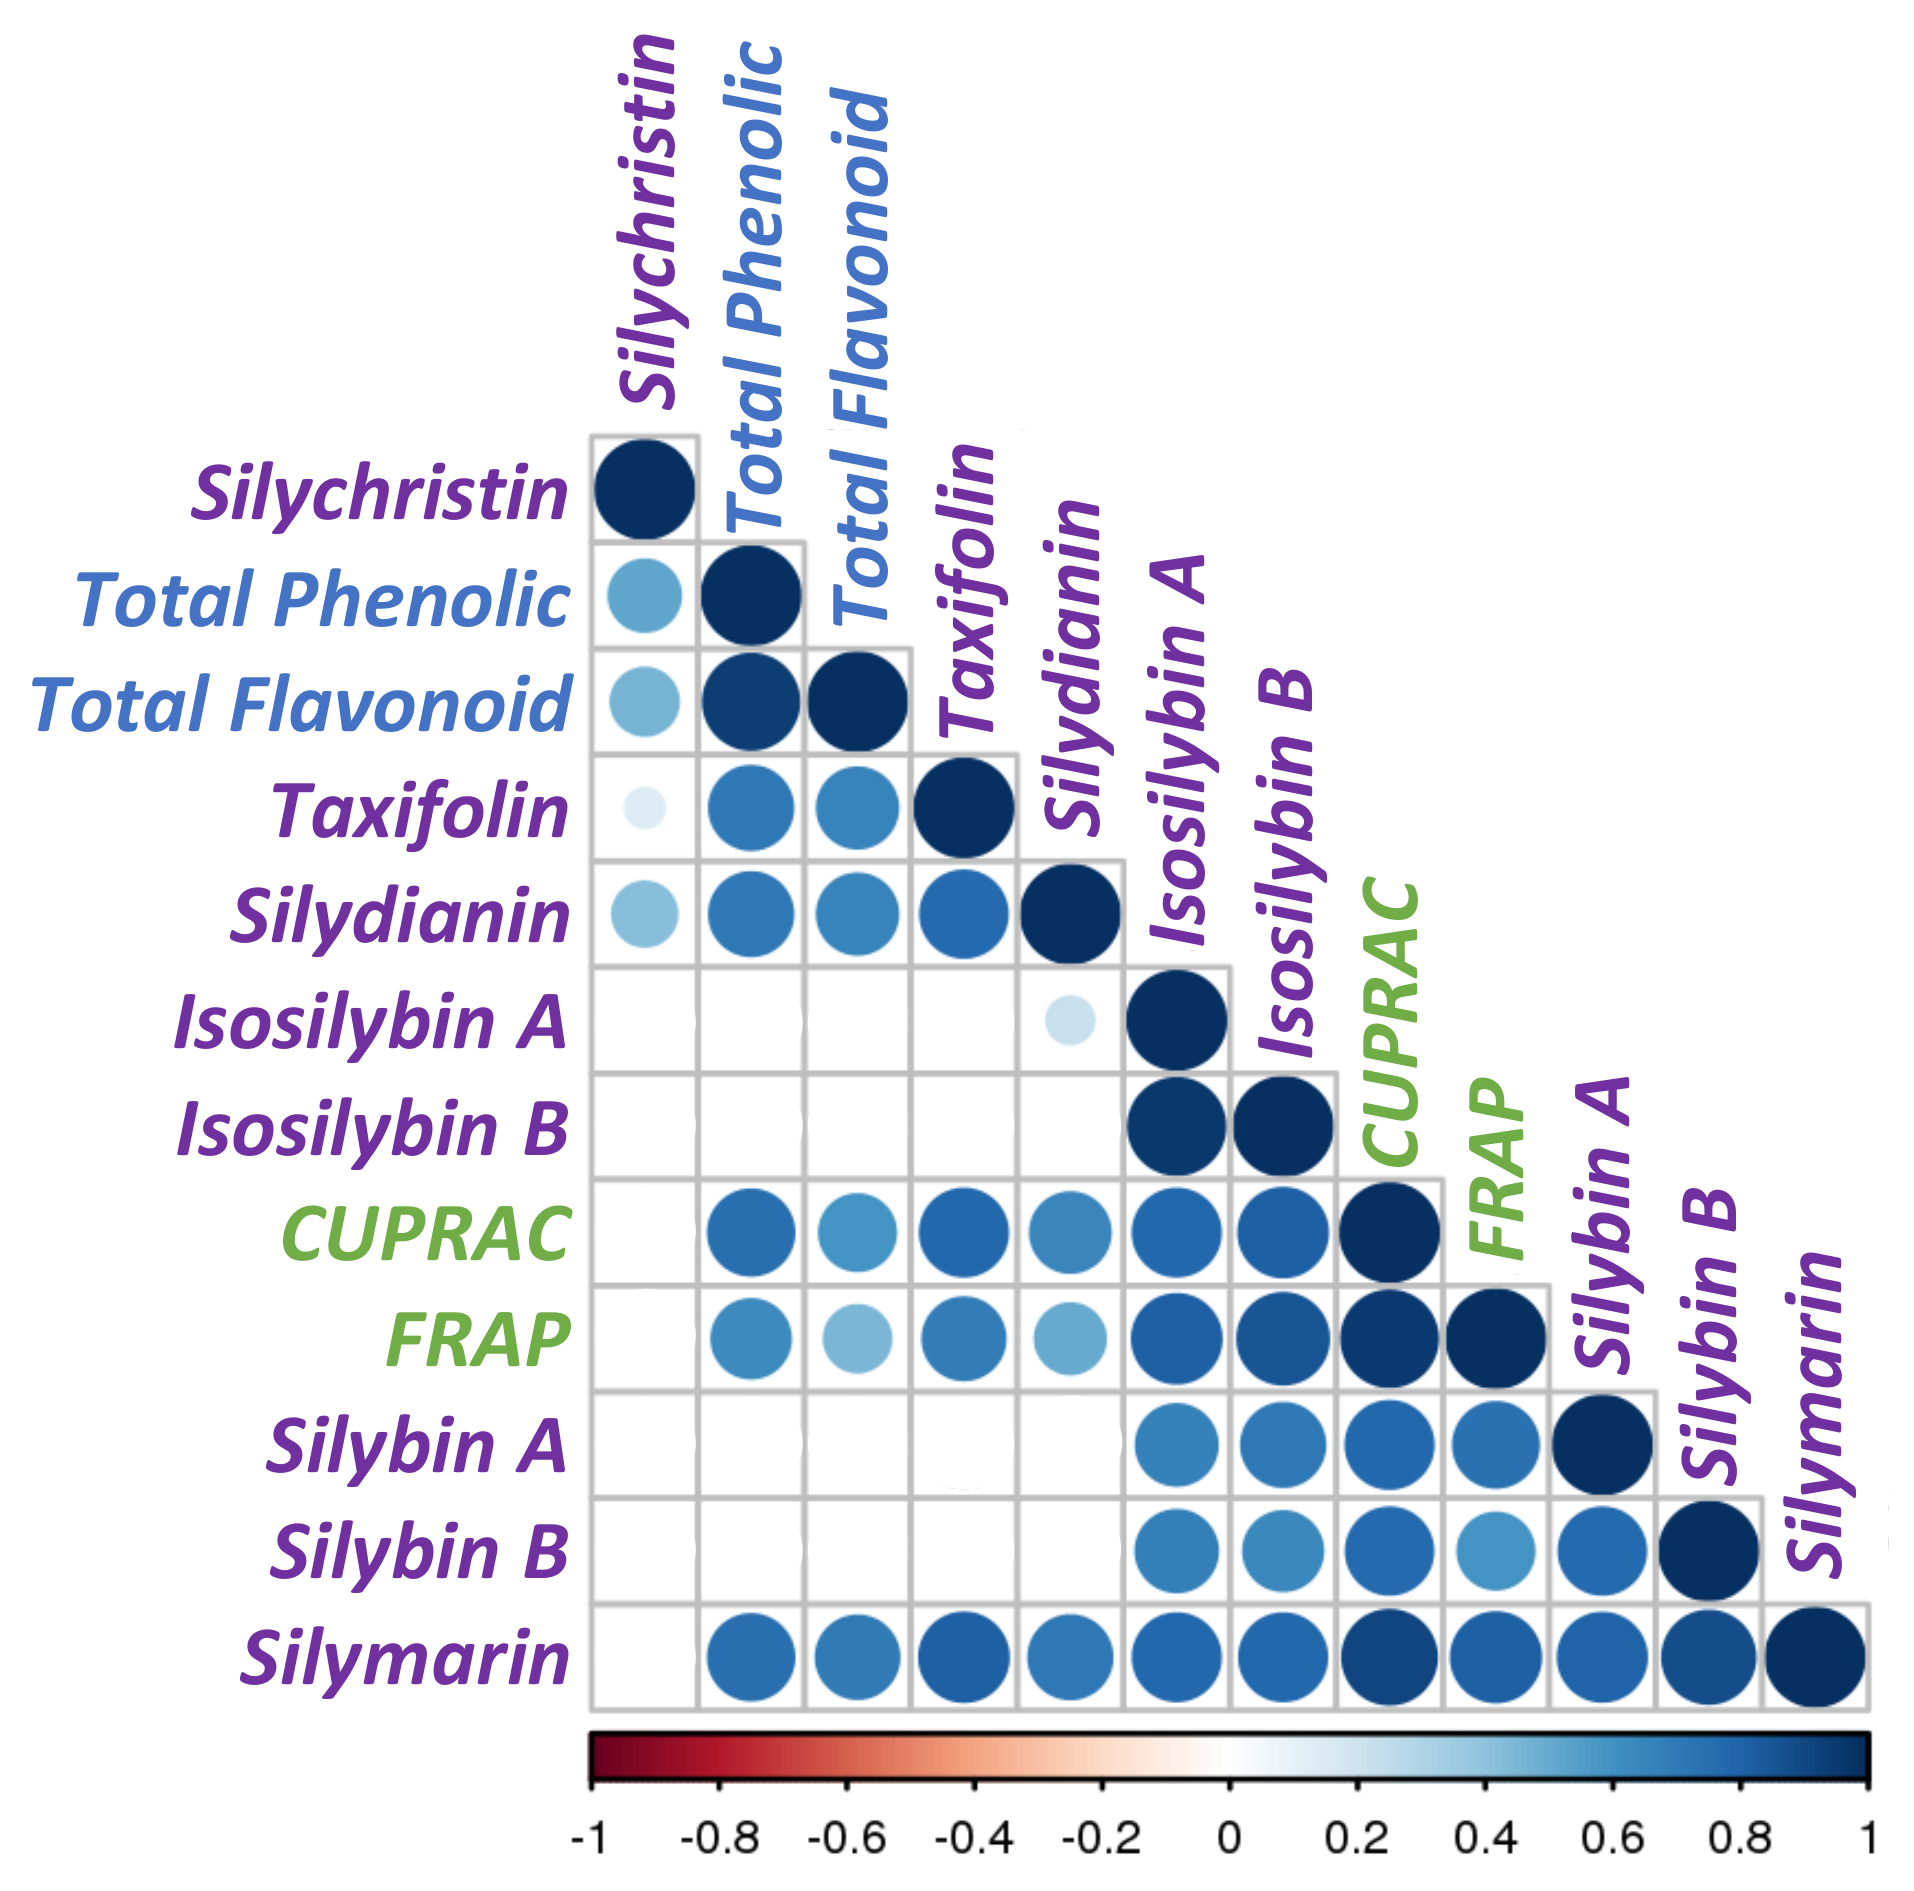
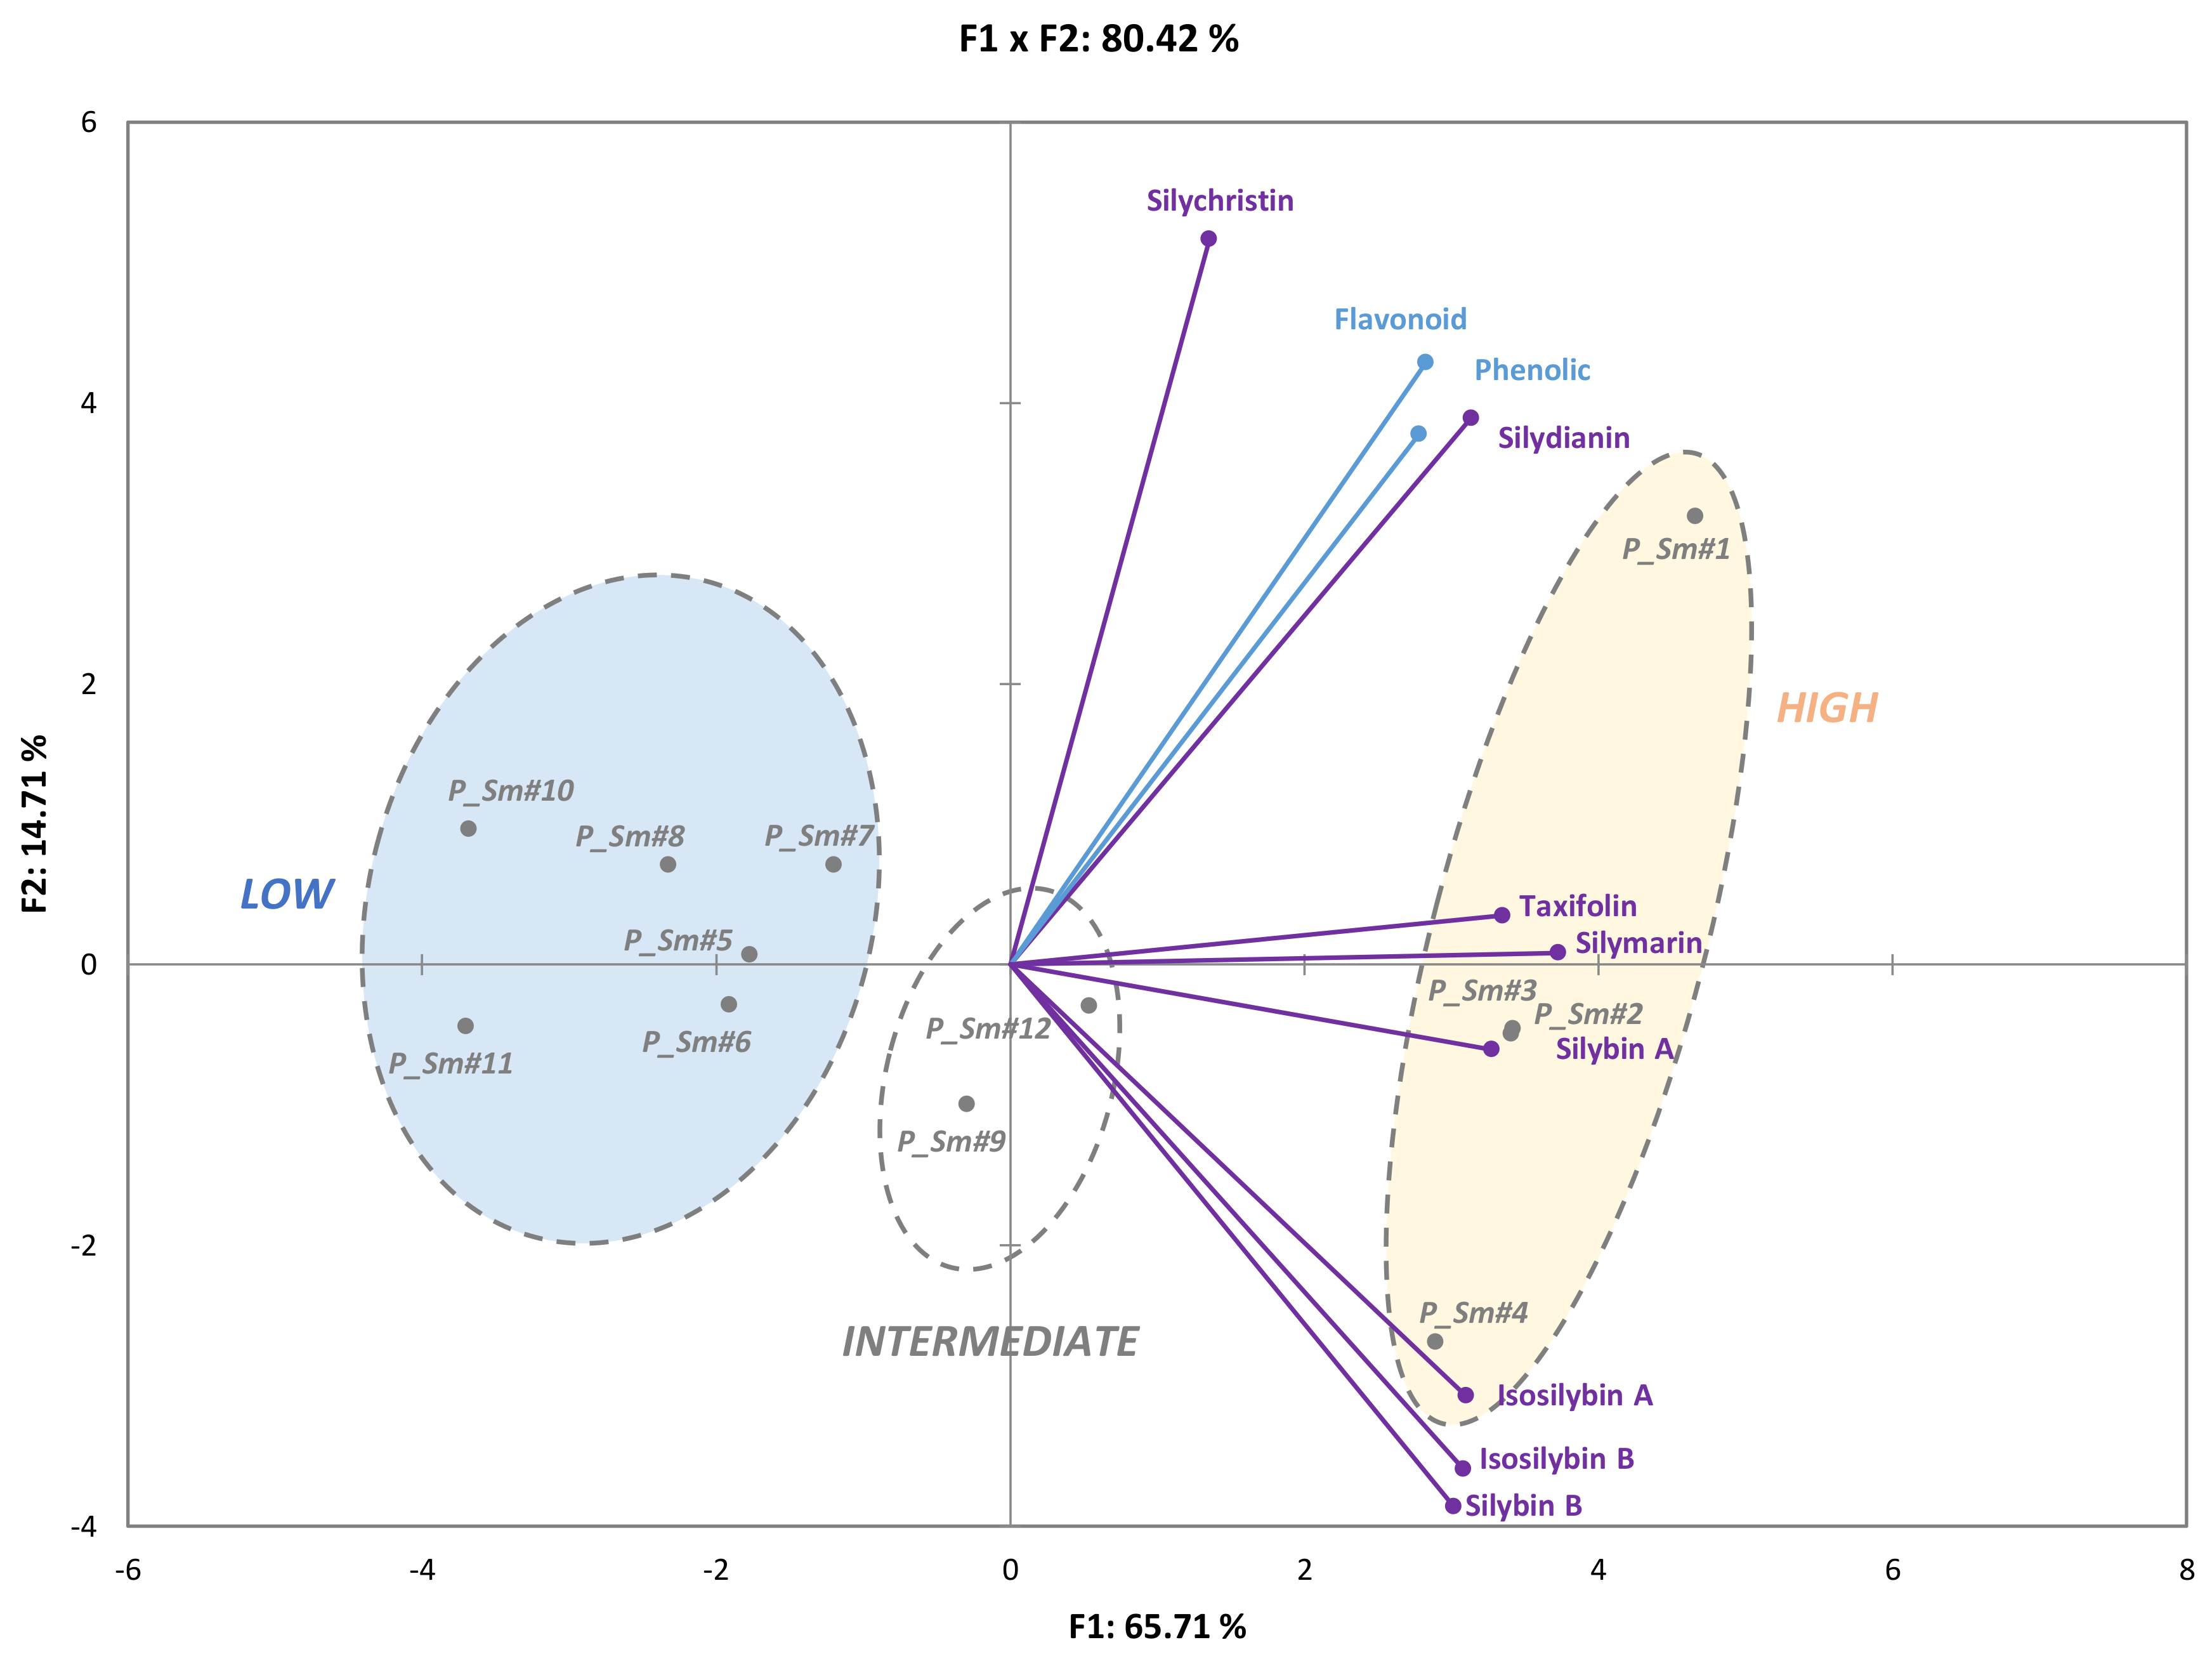
3.3. Correlations between Phytochemical Profiles and Antioxidant Activities

To evaluate the linkage between the antioxidant activity and the phytochemical profile of these chemotypes, Pearson correlation coefficient (PCC) were calculated and a matrix was constructed (Figure 6). This analysis evidenced the strength of the relationship between several variables (Figure 6 and Table S1). Not surprisingly, this correlogram showed a strong and highly significant (p < 0.001) correlation between silymarin content and the in vitro antioxidant assays CUPRAC (PCC = 0.92) and FRAP (PCC = 0.91). Total phenolic acids and total flavonoid contents were also significantly correlated with these two antioxidant assays, but with a weaker strength, suggesting that silymarin is the main contributor for the antioxidant capacity of these Silybum marianum extracts. With the exception of silychristin, all of the other constituents of the silymarin mixture were significantly correlated with CUPRAC and FRAP assays. We note that the PCCs that were calculated between each of the different constituents of the silymarin mixture and the antioxidant assays did not reach the value that was obtained for the complete mixture, indicating a possible synergistic effect. A stronger correlation (higher PCCs and more confident p-values) was observed with the CUPRAC assay for taxifolin, silydianin, as well as total phenolics and flavonoids, whereas both diasteroisomers of silybin and isosilybin were strongly correlated with the FRAP assay. When considering that the FRAP assay evidences the antioxidant activity of hydrophilic substances, whereas CUPRAC assay is more appropriate for both lipophilic and hydrophilic antioxidants [57], the two distinct behaviors merely relied on the physical and chemical properties of these compounds.
Little is known about the biosynthetic pathway leading to the flavonolignan biosynthesis. Our current knowledge on the flavonolignan biosynthesis involved the one-electron oxidation of two precursors (E-coniferyl alcohol and taxifolin), followed by a random coupling of those radicals, leading to the formation of one or several quinone methide intermediate(s) to form the different silymarin flavonolignans. With such a mechanism, only equimolar mixtures silybin (A and B) and isosilybin (A and B) diasteroisomers are supposed to be produced. However, some authors have reported different molar ratios [31,51,58,59]. Recently, Martinelli et al. [53] suggested the possible involvement of dirigent-like proteins that could explain such a discrepancy. Dirigent proteins (from the Latin: dirigere, to guide or to align) were first described to guide the stereoselective coupling of two phenoxy radicals that were derived from E-coniferyl alcohol, to give (+)-pinoresinol provided one electron oxidative capacity was also present to generate the phenoxy radical species [60]. To date there is no consensus about radical coupling mechanism involved in the biosynthesis of silybin and isosilybin diastereoisomers from Silybum marianum. Correlation analysis could also reveal the biochemical connectivity between the different intermediates and/or the branch of a biosynthetic pathway, as demonstrated by Nguyen et al. [61]. These authors proposed that the absence of correlation between substrate and the product of a considered enzymatic conversion suggests a strong contribution of this conversion to the flux control of the biosynthetic pathway and therefore a more complex regulation [61]. Such an enzymatic conversion is therefore a good candidate target for metabolic engineering. Here, PCCs suggested that silydianin and silychristin biosynthesis on the one hand, and silybins and isosilybins on the other hand, are governed by distinct control mechanisms. Indeed, strong and highly significant correlations linked taxifolin to silychristin and silychristin, whereas no correlations linked taxifolin to silybins, and isosilybins (Figure 6, Table S2). These results could therefore suppose a different mechanism leading to the biosynthesis of these flavonolignans involving random radical coupling for the biosynthesis of silychristin and silydianin, and the involvement of a dirigent-like protein for the biosynthesis of silybins and isosilybins. Nevertheless, in our hands, except P_Sm#4, the molar ratio of the different diastereoisomers were close to the 1:1 ratio that was observed in the case of random coupling, but the involvement of a dirigent-like protein cannot be excluded. Indeed, dirigent proteins with opposite stereospecificities could be involved, as observed for the biosynthesis of lignans in flax seeds [62]. These S. marianum ecotypes can be a good material to determine the biosynthetic relation linking the different flavonolignans and their precursor taxifolin, and to hypothesize the enzymatic pathways that are involved in their biosynthesis.

4. Conclusions

An efficient quantitative separation method for the concentration level evaluation of the different flavonolignans of the silymarin mixture from complex material have been validated. This method was applied to the phytochemical characterization of 12 wild Silybum marianum accessions from Pakistan and evidenced their pronounced chemical variability. Among these accessions, two new chemotypes that are rich in silybins and isosilybins are here described for the first time. A possible synergistic effect between the different constituents of the silymarin mixture to reach maximal antioxidant potential is proposed. Correlation analysis also suggested distinct control mechanisms leading to the biosynthesis of these flavonolignans, such as a random radical coupling for the biosynthesis of silychristin and silydianin, and the possible action of dirigent-like protein for the biosynthesis of silybin and isosilybin diastereoisomers. When considering that silybin is the most bioactive component of the silymarin mixture, the two newly described chemotypes are of particular interest and could have a great potential for cosmetic and pharmaceutical applications.

Supplementary Materials

The following are available online. Figure S1: MS spectra of the main flavonolignans from S. marianum extract: silychristin, silydianin, silybin A, silybin B, isosilybin A and isosilybin B, Figure S2: Identification of possible experimental errors present in the analysis, Figure S3: Analytical methodology for the extraction and analysis of the main flavonolignans from S. marianum extract, Table S1: Pearson Correlation Matrix for relationships between flavonolignan, total phenolic and total flavonoid contents and in vitro antioxidant activities.

Acknowledgments

This research was part of the MariLine program supported by Cosmetosciences, a global training and research program dedicated to the cosmetic industry. Located in the heart of the cosmetic valley, this program led by University of Orléans is funded by the Region Centre-Val de Loire.

Author Contributions

C.H. and B.H.A. conceived and designed the experiments; S.D., A.F., W.A. and S.K. performed the experiments; C.H. and S.D. analyzed the data; C.F., J.D. and J.R.V. contributed reagents/materials/analysis tools; S.D., E.L. and C.H. wrote the paper. All authors edited, read and approved the manuscript.

Conflicts of Interest

The authors declare no conflict of interest. The founding sponsors had no role in the design of the study, in the collection, analyses, or interpretation of data, in the writing of the manuscript, and in the decision to publish the results.

References

  1. Lee, D.Y.; Liu, Y. Molecular structure and stereochemistry of Silybin A, Silybin B, Isosilybin, and Isosilybin B, isolated from Silybum marianum (Milk Thistle). J. Nat. Prod. 2003, 66, 1171–1174. [Google Scholar] [CrossRef] [PubMed]
  2. Morazzoni, P.; Bombardelli, E. Silybum marianum (Carduus Marianus). Fitoterapia 1995, 66, 3–42. [Google Scholar]
  3. Madrid, E.; Corchete, P. Silymarin secretion and its elicitation by methyl jasmonate in cell cultures of Silybum marianum is mediated by phospholipase d-phosphatidic acid. J. Exp. Bot. 2010, 61, 747–754. [Google Scholar] [CrossRef] [PubMed]
  4. Abouzid, S.F.; Chen, S.; Mcalpine, J.B.; Friesen, J.B.; Pauli, G.F. Silybum marianum pericarp yields enhanced silymarin products. Fitoterapia 2016, 112, 136–143. [Google Scholar] [CrossRef] [PubMed]
  5. Hlangothia, D.; Abdel-rahman, F.; Nguyen, T.; Anthony, K.; Saleh, M.A. Distribution of Silymarin in the Fruit of Silybum marianum L. Pharm. Anal. Acta 2016, 7, 2. [Google Scholar] [CrossRef]
  6. Bijak, M. Silybin, a Major Bioactive Component of Milk Thistle (Silybum marianum L. Gaernt.)—Chemistry. Bioavailability, and Metabolism. Molecules 2017, 22, 1942. [Google Scholar] [CrossRef] [PubMed]
  7. Federico, A.; Dallio, M.; Loguercio, C. Silymarin/Silybin and chronic liver disease: A marriage of many years. Molecules 2017, 22, 191. [Google Scholar] [CrossRef] [PubMed]
  8. Bijak, M.; Szelenberger, R.; Saluk, J.; Nowak, P. Flavonolignans inhibit ADP induced blood platelets activation and aggregation in whole blood. Int. J. Biol. Macromol. 2017, 95, 682–688. [Google Scholar] [CrossRef] [PubMed]
  9. Bijak, M.; Saluk-bijak, J. Flavonolignans inhibit the arachidonic acid pathway in blood platelets. BMC Complement. Altern. Med. 2017, 17, 396. [Google Scholar] [CrossRef] [PubMed]
  10. Smith, B.T.; Kawa, K.; Eckl, V.; Morton, C.; Stredney, R. Herbal Supplement Sales in US Increase 7.7% in 2016. HerbalGram 2017, 115, 56–65. [Google Scholar]
  11. Tuchweber, B.; Sieck, R.; Trost, W. Prevention by Silybin of Phalloidin-Induced Acute Hepatoxicity. Toxicolo. Appl. Pharmaco. 1979, 51, 265–275. [Google Scholar] [CrossRef]
  12. Tamayo, C.; Diamond, S. Review of Clinical Trials Evaluating (Silybum marianum [L.] Gaertn.). Integr. Cancer Ther. 2007, 6, 146–157. [Google Scholar] [CrossRef] [PubMed]
  13. Shaker, E.; Mahmoud, H.; Mnaa, S. Silymarin, the antioxidant component and Silybum marianum extracts prevent liver damage. Food Chem. Toxicol. 2010, 48, 803–806. [Google Scholar] [CrossRef] [PubMed]
  14. Polyak, S.J.; Morishima, C.; Lohmann, V.; Pal, S.; Lee, D.Y.W.; Liu, Y.; Graf, T.N.; Oberlies, N.H. Identification of hepatoprotective flavonolignans from silymarin. Proc. Natl. Acad. Sci. USA 2010, 107, 5995–5999. [Google Scholar] [CrossRef] [PubMed]
  15. Fraschini, F.; Demartini, G.; Esposti, D. Pharmacology of Silymarin. Clin. Drug Investig. 2002, 22, 51–65. [Google Scholar] [CrossRef]
  16. Valenzuela, A.; Garrido, A. Biochemical bases of the pharmacological action of the flavonoid silymarin and of its structural isomer silibinin. Biol. Res. 1994, 27, 105–112. [Google Scholar] [PubMed]
  17. Wang, L.; Rotter, S.; Ladurner, A.; Heiss, E.H.; Oberlies, N.H.; Dirsch, V.M.; Atanasov, A.G. Silymarin Constituents Enhance ABCA1 Expression in THP-1 Macrophages. Molecules 2016, 21, 55. [Google Scholar] [CrossRef] [PubMed]
  18. Anestopoulos, I.; Sfakianos, A.P.; Franco, R.; Chlichlia, K.; Panayiotidis, M.I.; Kroll, D.J.; Pappa, A. A Novel Role of Silibinin as a Putative Epigenetic Modulator in Human Prostate Carcinoma. Molecules 2017, 22, 62. [Google Scholar] [CrossRef] [PubMed]
  19. Katiyar, S.K. Silymarin and skin cancer prevention : Anti-inflammatory, antioxidant and immunomodulatory effects (Review). Int. J. Oncol. 2005, 26, 169–176. [Google Scholar] [CrossRef] [PubMed]
  20. Kumar, R.; Deep, G.; Agarwal, R. An overview of ultraviolet B radiation-induced skin cancer chemoprevention by Silibinin. Curr. Pharmacol. Rep. 2015, 1, 206–215. [Google Scholar] [CrossRef] [PubMed]
  21. Toklu, H.Z.; Tunali-Akbay, T.; Erkanli, G.; Yüksel, M.; Ercan, F.; Şener, G. Silymarin, the antioxidant component of Silybum marianum, protects against burn-induced oxidative skin injury. Burns 2007, 33, 908–916. [Google Scholar] [CrossRef] [PubMed]
  22. Fehér, P.; Ujhelyi, Z.; Vecsernyés, M.; Fenyvesi, F.; Damache, G.; Ardelean, A.; Costache, M.; Dinischiotu, A.; Hermenean, A.; Bácskay, I. Hepatoprotective effects of a self-micro emulsifying drug delivery system containing Silybum marianum native seed oil against experimentally induced liver injury. Pharmazie 2015, 70, 231–238. [Google Scholar] [PubMed]
  23. Shin, S.; Lee, J.A.; Kim, M.; Kum, H.; Jung, E.; Park, D. Anti-Glycation activities of phenolic constituants from Silybum marianum (Milk Thistle) flower in vitro and on human explants. Molecules 2015, 20, 3549–3564. [Google Scholar] [CrossRef] [PubMed]
  24. Singh, R.P.; Agarwal, R. Mechanisms and preclinical efficacy of silibinin in preventing skin cancer. Eur. J. Cancer 2005, 41, 1969–1979. [Google Scholar] [CrossRef] [PubMed]
  25. Chambers, C.S.; Hole, V.; Petrásková, L.; Biedermann, D.; Buchta, M.; Vladimír, K. The silymarin composition … and why does it matter??? Food Res. Int. 2017, 100, 339–353. [Google Scholar] [CrossRef] [PubMed]
  26. Leng-Peschlow, E. Properties and medical use of flavonolignans (Silymarin) from Silybum marianum. Phyther. Res. 1996, 10, S25–S26. [Google Scholar]
  27. Odum, E.P. Ecology: A Bridge between Science and Society; Sinauer Associates: Georgia, UK, 1997. [Google Scholar]
  28. Radjabian, T.; Huseini, H.F. Anti-Hyperlipidemic and Anti-Atherosclerotic Activities of Silymarins from Cultivated and Wild Plants of Silybum marianum L. with different content of flavonolignans. Iran J. Pharmacol. Ther. 2010, 9, 63–67. [Google Scholar]
  29. Elwekeel, A.; Elfishawy, A.; Abouzid, S. Silymarin content in Silybum marianum fruits at different maturity stages. J. Med. Plants Res. 2013, 7, 1665–1669. [Google Scholar]
  30. Poppe, L.; Petersen, M. Variation in the flavonolignan composition of fruits from different Silybum marianum chemotypes and suspension cultures derived therefrom. Phytochemistry 2016, 131, 68–75. [Google Scholar] [CrossRef] [PubMed]
  31. Carrier, D.J.; Crowe, T.; Sokhansanj, S.; Wahab, J.; Branka, B. Milk Thistle, Silybum marianum (L.) Gaertn., flower head development and associated marker compound profile. J. Herbs Spices Med. Plants 2003, 10, 65–74. [Google Scholar] [CrossRef]
  32. Khan, M.A.; Blackshaw, R.E.; Marwat, K.B. Biology of milk thistle (Silybum marianum) and the management options for growers in north-western Pakistan. Weed Biol. Manag. 2009, 9, 99–105. [Google Scholar] [CrossRef]
  33. Corbin, C.; Fidel, T.; Leclerc, E.A.; Barakzoy, E.; Sagot, N.; Falguiéres, A.; Renouard, S.; Blondeau, J.P.; Ferroud, C.; Doussot, J.; et al. Development and validation of an efficient ultrasound assisted extraction of phenolic compounds from flax (Linum usitatissimum L.) seeds. Ultrason. Sonochem. 2015, 26, 176–185. [Google Scholar] [CrossRef] [PubMed]
  34. Sin, D.W.M.; Wong, Y.C.; Mak, C.Y.; Sze, S.T.; Yao, W.Y. Determination of five phenolic antioxidants in edible oils: Method validation and estimation of measurement uncertainty. J. Food Compost. Anal. 2006, 19, 784–791. [Google Scholar] [CrossRef]
  35. Dias, M.G.; Camões, M.F.G.F.C.; Oliveira, L. Uncertainty estimation and in-house method validation of HPLC analysis of carotenoids for food composition data production. Food Chem. 2008, 109, 815–824. [Google Scholar] [CrossRef] [PubMed]
  36. Konieczka, P.; Namieśnik, J. Estimating uncertainty in analytical procedures based on chromatographic techniques. J. Chromatogr. A 2010, 1217, 882–891. [Google Scholar] [CrossRef] [PubMed]
  37. Arias, J.P.; Zapata, K.; Rojano, B.; Arias, M. Effect of light wavelength on cell growth, content of phenolic compounds and antioxidant activity in cell suspension cultures of Thevetia peruviana. J. Photochem. Photobiol. B Biol. 2016, 163, 87–91. [Google Scholar] [CrossRef] [PubMed]
  38. Xu, A.; Zhan, J.-C.; Huang, W.-D. Effects of ultraviolet C, methyl jasmonate and salicylic acid, alone or in combination, on stilbene biosynthesis in cell suspension cultures of Vitis vinifera L. cv. Cabernet Sauvignon. Plant Cell Tissue Organ Cult. 2015, 122, 197–211. [Google Scholar] [CrossRef]
  39. Benzie, I.; Strain, J. The ferric reducing ability of plasma (FRAP) as a measure of “antioxidant power”: The FRAP assay. Anal. Biochem. 1996, 239, 70–76. [Google Scholar] [CrossRef] [PubMed]
  40. Apak, R.; Güçlü, K.; Ozyürek, M.; Karademir, S.E. Novel total antioxidant capacity index for dietary polyphenols and vitamins C and E, using their cupric ion reducing capability in the presence of neocuproine: CUPRAC method. J. Agric. Food Chem. 2004, 52, 7970–7981. [Google Scholar] [CrossRef] [PubMed]
  41. Fibigr, J.; Šatínský, D.; Solich, P. A new approach to the rapid separation of isomeric compounds in a Silybum marianum extract using UHPLC core-shell column with F5 stationary phase. J. Pharm. Biomed. Anal. 2017, 134, 203–213. [Google Scholar] [CrossRef] [PubMed]
  42. Marhol, P.; Gažák, R.; Bednár, P.; Kren, V. Narrow-bore core–shell particles and monolithic columns in the analysis of silybin diastereoisomers. J. Sep. Sci. 2011, 34, 2206–2213. [Google Scholar] [CrossRef] [PubMed]
  43. Mudge, E.; Paley, L.; Schieber, A.; Brown, P.N. Optimization and single-laboratory validation of a method for the determination of flavonolignans in milk thistle seeds by high-performance liquid chromatography with ultraviolet detection. Anal. Bioanal. Chem. 2015, 407, 7657–7666. [Google Scholar] [CrossRef] [PubMed]
  44. Graf, T.N.; Cech, N.B.; Polyak, S.J.; Oberlies, N.H. A validated UHPLC-tandem mass spectrometry method for quantitative analysis of flavonolignans in milk thistle (Silybum marianum) extracts. J. Pharm. Biomed. Anal. 2016, 126, 26–33. [Google Scholar] [CrossRef] [PubMed]
  45. Horwitz, W. AOAC Guidelines for Single Laboratory Validation of Chemical Methods for Dietary Supplements and Botanicals; AOAC Int: Gaithersburg, MD, USA, 2002; p. 1219. [Google Scholar]
  46. Ellison, S.L.R.; Barwick, V.J. Estimating measurement uncertainty: reconciliation using a cause and effect approach. Accredit. Qual. Assur. 1998, 3, 101–105. [Google Scholar] [CrossRef]
  47. Saleh, I.A.; Vinatoru, M.; Mason, T.J.; Abdel-azim, N.S.; Aboutabl, E.A.; Hammouda, F.M. Ultrasonic-Assisted Extraction and Conventional Extraction of Silymarin from Silybum marianum seeds; A Comparison. Res. J. Pharm. Biol. Chem. Sci. 2015, 6, 709–717. [Google Scholar]
  48. Wianowska, D.; Wis, M. Simplified Procedure of Silymarin Extraction from Silybum marianum L. Gaertner. J. Chromatogr. Sci. 2015, 53, 366–372. [Google Scholar] [CrossRef] [PubMed]
  49. Lucini, L.; Kane, D.; Pellizzoni, M.; Ferrari, A.; Trevisi, E.; Ruzickova, G.; Arslan, D. Phenolic profile and in vitro antioxidant power of different milk thistle [Silybum marianum (L.) Gaertn.] cultivars. Ind. Crop Prod. 2016, 83, 11–16. [Google Scholar] [CrossRef]
  50. Radjabian, T.; Rezazadeh, S.H.; Huseini, H.F. Analysis of silymarin components in the seed extracts of some milk thistle ecotypes from Iran by HPLc. Iran. J. Sci. Technol. 2008, 32, 6–8. [Google Scholar]
  51. Martin, R.J.; Lauren, D.R.; Smith, W.A.; Jensen, D.J.; Deo, B.; Douglas, J.A. Factors influencing silymarin content and composition in variegated thistle (Silybum marianum). New Zeal. J. Crop Hortic. Sci. 2006, 34, 239–245. [Google Scholar] [CrossRef]
  52. Hammoda, F.M.; Aboutabl, E.H.; Imbaby, S.I.; Nazief, H.N.; Abdallah, W.A.; Matter, M.A.; Ghareeb, H.A.; Saker, M.M.; Rady, M.R. Molecular and Phytochemical Characterization of Some Silybum Landraces Grown in Egypt. J. Genet. Eng. Biotechnol. 2009, 7, 1–6. [Google Scholar]
  53. Martinelli, T.; Whittaker, A.; Benedettelli, S.; Carboni, A. The study of flavonolignan association patterns in fruits of diverging Silybum marianum (L.) Gaertn. chemotypes provides new insights into the silymarin biosynthetic pathway. Phytochemistry 2017, 144, 9–18. [Google Scholar] [CrossRef] [PubMed]
  54. Adzet, T.; Coll, M.R.; Iglesias, J.; Puigmacia, M. Selection and improvement of Silybum marianum. 1: Characterization of populations from different origins [silymarin, flavonolignans]. Plant Physiol. Biochem. 1987, 25, 129–135. [Google Scholar]
  55. Mahmood, T.; Nazar, N.; Abbasi, B.H.; Khan, M.A.; Ahmad, M.; Zafar, M. Detection of somaclonal variations using RAPD fingerprinting in Silybum marianum (L.). J. Med. Plants Res. 2010, 4, 1822–1824. [Google Scholar]
  56. Shokrpour, M.; Moghaddam, M.; Mohammadi, S.A.; Ziai, S.A.; Javanshir, A. Genetic properties of Milk Thistle ecotypes from Iran for morphological and flavonolignans characters. Pakistan J. Biol. Sci. 2007, 10, 3266–3271. [Google Scholar]
  57. Ratz-lyko, A.; Arct, J.; Pytkowska, K. Methods for evaluation of cosmetic antioxidant capacity. Ski. Res. Technol. 2012, 18, 421–430. [Google Scholar] [CrossRef] [PubMed]
  58. Martinelli, T.; Potenza, E.; Moschella, A.; Zaccheria, F.; Benedettelli, S.; Andrzejewska, J. Phenotypic Evaluation of a Milk Thistle Phenotypic Evaluation of a Milk Thistle Germplasm Collection: Fruit Morphology and Chemical Composition. Crop Sci. 2016, 56, 3160–3172. [Google Scholar] [CrossRef]
  59. Abouzid, S.F.; Ahmed, H.S.; Moawad, A.S.; Owis, A.I.; Chen, S.; Nachtergael, A.; McAlpine, J.B.; Friesen, J.B.; Pauli, G.F. Chemotaxonomic and biosynthetic relationships between flavonolignans produced by Silybum marianum populations. Fitoterapia 2017, 119, 175–184. [Google Scholar] [CrossRef] [PubMed]
  60. Davin, L.B.; Wang, H.B.; Crowell, A.L.; Bedgar, D.L.; Martin, D.M.; Sarkanen, S.; Lewis, N.G. Stereoselective bimolecular phenoxy radical coupling by an auxiliary (dirigent) protein without an active center. Science 1997, 275, 362–366. [Google Scholar] [CrossRef] [PubMed]
  61. Nguyen, T.; Jamali, A.; Grand, E.; Morreel, K.; Marcelo, P.; Gontier, E.; Dauwe, R. Phenylpropanoid profiling reveals a class of hydroxycinnamoyl glucaric acid conjugates in Isatis tinctoria leaves. Phytochemistry 2017, 144, 127–140. [Google Scholar] [CrossRef] [PubMed]
  62. Dalisay, D.S.; Kim, K.W.; Lee, C.; Yang, H.; Rübel, O.; Bowen, B.P.; Davin, L.B.; Lewis, N.G. Dirigent Protein-Mediated Lignan and Cyanogenic Glucoside Formation in Flax Seed: Integrated Omics and MALDI Mass Spectrometry Imaging. J. Nat. Prod. 2015, 78, 1231–1242. [Google Scholar] [CrossRef] [PubMed]
Sample Availability: Samples and standards presented in this study are available from the authors upon request.
Figure 1. Chemical structure of the main six flavonolignans and one flavonoid (*) constituting the Silymarin mixture from Silybum marianum achene extract.
Molecules 23 00904 g001
Figure 2. Representative chromatogram of a complete HPLC analysis (A). The main compounds considered in this study are the flavonoid taxifolin and all flavonolignans: silychristin, silydianin, silybin A, silybin B, isosilybin A, and isosilybin B. Presented on a magnification (B). Mass spectra are presented in Figure S1.
Molecules 23 00904 g002
Figure 3. Uncertainty histogram showing the distribution of individual uncertainty component and combined expressed as percentage of taxifolin, silychristin, silydianin, silybin A, silybin B, isosilybin A, and isosilybin B in S. marianum preparation or extracts.
Molecules 23 00904 g003
Figure 4. Hierarchical clustering analysis of twelve inflorescences of Silybum marianum related to their phytochemical profile.
Molecules 23 00904 g004
Figure 5. Principal component analysis (PCA) of the different silymarin compounds and its extraction from twelve inflorescences. Variance of factor 1 (F1) = 65.71% and of factor 2 (F2) = 14.71%. Ecotypes are distributed into the three groups (Low, intermediate and high) according to their amount of extraction.
Molecules 23 00904 g005
Figure 6. Correlogram analysis between phytochemical profiles of Silybum marianum extracts analyzed in this study and their antioxidant activities. Positive correlations are displayed in blue and negative correlations in red. Color intensity and the size of the circles are proportional to the correlation coefficients. Below the correlogram of flavonolignans and antioxidant tests, the legend color shows the correlation coefficients and the corresponding colors.
Molecules 23 00904 g006
Table 1. Calibration function parameters for the different analytes using UV detection.
AnalyteRetention Time tRCalibration CurveLODLOQ
minRSDRSslopeinterceptR2(µg·mL−1)(µg·mL−1)
Taxifolin28.920.026.651292.90.70.99890.090.26
Silychristin36.420.015.582266.4−12.70.99940.050.17
Silydianin37.650.031.711649.834.80.99920.100.32
Silybin A43.150.011.692575.05.70.99970.050.15
Silybin B43.290.021.692515.927.30.99990.050.15
Isosilybin A45.180.021.782726.317.80.99980.050.16
Isosilybin B45.890.011.782861.11.90.99990.050.16
Linear range: 0.5–50 µg·mL−1; tR: retention time; RSD: Relative Standard deviation; RS: separation resolution; LOD: limit of detection; LOQ: limit of quantification
Table 2. Repeatability precision results summary for the quantification of the different analytes in standardized commercial silymarin preparation from milk thistle.
AnalyteMean (mg·g−1)RSD (%)HorRat
Taxifolin2.46 ± 0.104.171.69
Silychristin13.31 ± 0.423.161.64
Silydianin1.85 ± 0.052.601.01
Silybin A10.59 ± 0.242.311.17
Silybin B8.42 ± 0.242.921.43
Isosilybin A5.01 ± 0.091.750.78
Isosilybin B2.31 ± 0.052.151.69
Values are presented means of 6 independent replicates (mg·g−1), percentage of relative standard deviation (RSD) and Horwitz ratio (HorRat) for each analyte.
Table 3. Recovery results for individual analytes at three spiked concentrations in negative control (extraction solvent).
AnalyteSpiked Concentration (ppm)Recovery (%)Average Recovery (%)
Taxifolin25101.85 ± 1.98
50102.77 ± 3.80
100100.27 ± 0.35101.63 ± 2.04
Silychristin25102.25 ± 3.33
5099.70 ± 0.26
10099.96 ± 0.45100.64 ± 1.35
Silydianin25100.52 ± 3.10
50100.78 ± 0.46
10098.41 ± 1.4699.90 ± 1.67
Silybin A25101.75 ± 4.67
50102.45 ± 5.10
10099.00 ± 1.12101.07 ± 3.63
Silybin B25100.66 ± 3.84
5098.09 ± 2.55
10098.89 ± 2.8799.22 ± 3.09
Isosilybin A2597.88 ± 2.16
50100.06 ± 7.71
100101.54 ± 2.7299.83 ± 4.20
Isosilybin B25102.17 ± 6.79
50102.93 ± 5.25
100101.89 ± 4.60102.33 ± 5.55
Values are presented as recovery percentage means of 3 independent replicates (recovery) ± relative standard deviation (RSD) and average of recovery obtained for the three spiked concentrations.
Table 4. Estimation of matrix effects by recovery results for individual analytes at spiked concentration of 50 ppm in two different matrixes.
MatrixTaxifolinSilychristinSilydianinSilybin ASilybin BIsosilybin AIsosilybin B
Silymarin extract a98.91 ± 2.0499.54 ± 2.0694.42 ± 4.65100.77 ± 1.53100.26 ± 1.18100.33 ± 1.95101.96 ± 3.21
Milk thistle seed extract b99.60 ± 2.2499.15 ± 0.0492.00 ± 1.6899.48 ± 0.8198.99 ± 1.4898.22 ± 1.22100.53 ± 4.77
Values (n = 3) are the percent mean of the spiked analyte recovery ± %RSD; Values close to 100 indicate no matrix effect observed; a Standardized commercial Silymarin preparation from Sigma Aldrich (reference S0292); b non-defatted whole seed extract prepared as described in Materials and Methods.
Table 5. Content of silymarin constituents, total phenolics, total flavonoids, and antioxidant capacity of different genotypes of milk thistle from Pakistan.
SampleTAXaSCaSDaSAaSBaISAaISBaSMbPhecFladCUPRACeFRAPe
P_Sm#12.0
±0.3AB
7.3
±1.9ABC
2.3
±0.2A
4.9
±0.2AB
3.8
±0.4ABC
1.4
±0.0B
1.3
±0.0A
22.9
±2.2AB
363.6
±35.9A
51.4
±5.3A
1257.1
±162.2A
1657.9
±91.2AB
P_Sm#22.1
±0.3AB
1.7
±0.1ABC
1.0
±0.2ABCD
6.6
±0.1A
6.0
±0.2ABC
2.3
±0.2A
1.8
±0.0A
21.5
±0.7AB
247.0
±5.5AB
45.5
±2.4A
995.2
±50.6AB
1375.8
±218.8AB
P_Sm#32.1
±0.2A
2.6
±0.2ABC
1.7
±0.1AB
6.4
±0.4AB
8.5
±0.3A
1.1
±0.0B
1.3
±0.0AB
23.6
±0.1A
197.6
±11.7AB
24.
±4.6AB
1165.8
±40.9A
1509.3
±53.6AB
P_Sm#41.4
±0.2ABC
2.8
±0.2ABC
0.8
±0.2ABCD
3.5
±0.1BCDE
7.5
±0.8AB
2.4
±0.1A
2.3
±0.1A
20.7
±0.9AB
121.2
±13.1ABC
14.0
±1.1B
1237.7
±79.5A
1843.3
±74.9A
P_Sm#5nd
D
4.6
±0.2AB
0.3
±0.0D
1.5
±0.1DEFG
1.7
±0.0DE
1.0
±0.0B
1.1
±0.0AB
10.2
±0.3DEF
128.8
±11.5ABC
16.0
±1.2AB
731.0
±44.7AB
1235.8
±138.8AB
P_Sm#61.2
±0.1ABC
1.8
±0.3ABC
0.6
±0.3ABC
1.8
±0.1CDEF
3.3
±0.3BCDE
1.3
±0.0B
1.6
±0.1A
11.6
±0.9CDE
137.1
±9.9ABC
16.6
±3.0AB
866.4
±36.3AB
1357.8
±77.2AB
P_Sm#70.8
±0.1BCD
5.7
±0.2A
0.9
±0.2ABCD
1.4
±0.0EFG
3.4
±0.2ABCDE
0.8
±0.0B
0.8
±0.0AB
13.8
±0.3CD
81.3
±28.7C
19.0
±0.6AB
636.7
±150.4B
1120.0
±259.1AB
P_Sm#81.4
±0.1ABC
1.6
±0.1BC
1.3
±0.3ABC
0.6
±0.0G
2.6
±0.1CDE
nd
C
nd
B
7.6
±0.4CDEF
86.9
±9.4C
15.1
±2.7AB
623.2
±92.7B
1012.3
±150.4B
P_Sm#90.1
±0.0CD
2.0
±0.4ABC
0.7
±0.0ABCD
3.8
±0.2ABC
2.7
±0.3CDE
0.8
±0.0B
0.7
±0.0AB
11.0
±0.2CDEF
82.3
±15.6C
16.1
±1.0AB
702.5
±42.2AB
975.6
±220.1AB
P_Sm#10nd
D
2.9
±0.1ABC
0.5
±0.0BCD
0.6
±0.0G
0.6
±0.1E
nd
C
nd
B
4.5
±0.3F
105.1
±11.3BC
16.5
±1.1AB
587.0
±16.3B
994.7
±61.1B
P_Sm#11nd
D
0.6
±0.0C
0.3
±0.1CD
1.2
±0.1FG
2.8
±0.2CDE
nd
C
nd
B
4.9
±0.1EF
64.3
±15.2C
12.6
±2.1B
580.4
±57.9B
1041.0
±53.5B
P_Sm#120.9
±0.2ABCD
2.5
±0.0ABC
1.5
±0.2AB
3.7
±0.3ABCD
5.1
±0.5ABC
0.9
±0.0B
1.2
±0.1AB
15.8
±0.7ABC
122.2
±23.3ABC
20.3
±3.8AB
878.0
±112.8AB
1327.8
±102.9AB
a quantified by HPLC and expressed in mg·g−1 DW; b expressed in as the sum of in mg·g−1 DW taxifolin and flavonolignans quantified by HPLC; c Total phenolic estimated by Folin assay expressed in mg·g−1 DW gallic acid equivalent; d Total flavonoid content estimated by AlCl3 assay and expressed in mg·g−1 DW quercetin equivalent; e expressed in µM of Trolox equivalent antioxidant capacity. Each value represented mean ± SD of three independent replicate; nd non-determined (under the limits of quantification (LOQ)) for taxifolin and non-detectable (under the limits of detection (LOD) for isosilybin A and isosilybin B; superscript letters indicate differences on ANOVA at α = 0.05).

