Single, 14-Day, and 13-Week Repeated Dose Toxicity Studies of Daily Oral Gelidium elegans Extract Administration to Rats

Abstract
:1. Introduction
2. Results
2.1. Acute Oral Toxicity Study
2.2. 14 Day Repeated Oral Dose Toxicity Study
2.3. 13 Week Repeated Oral Dose Toxicity Study
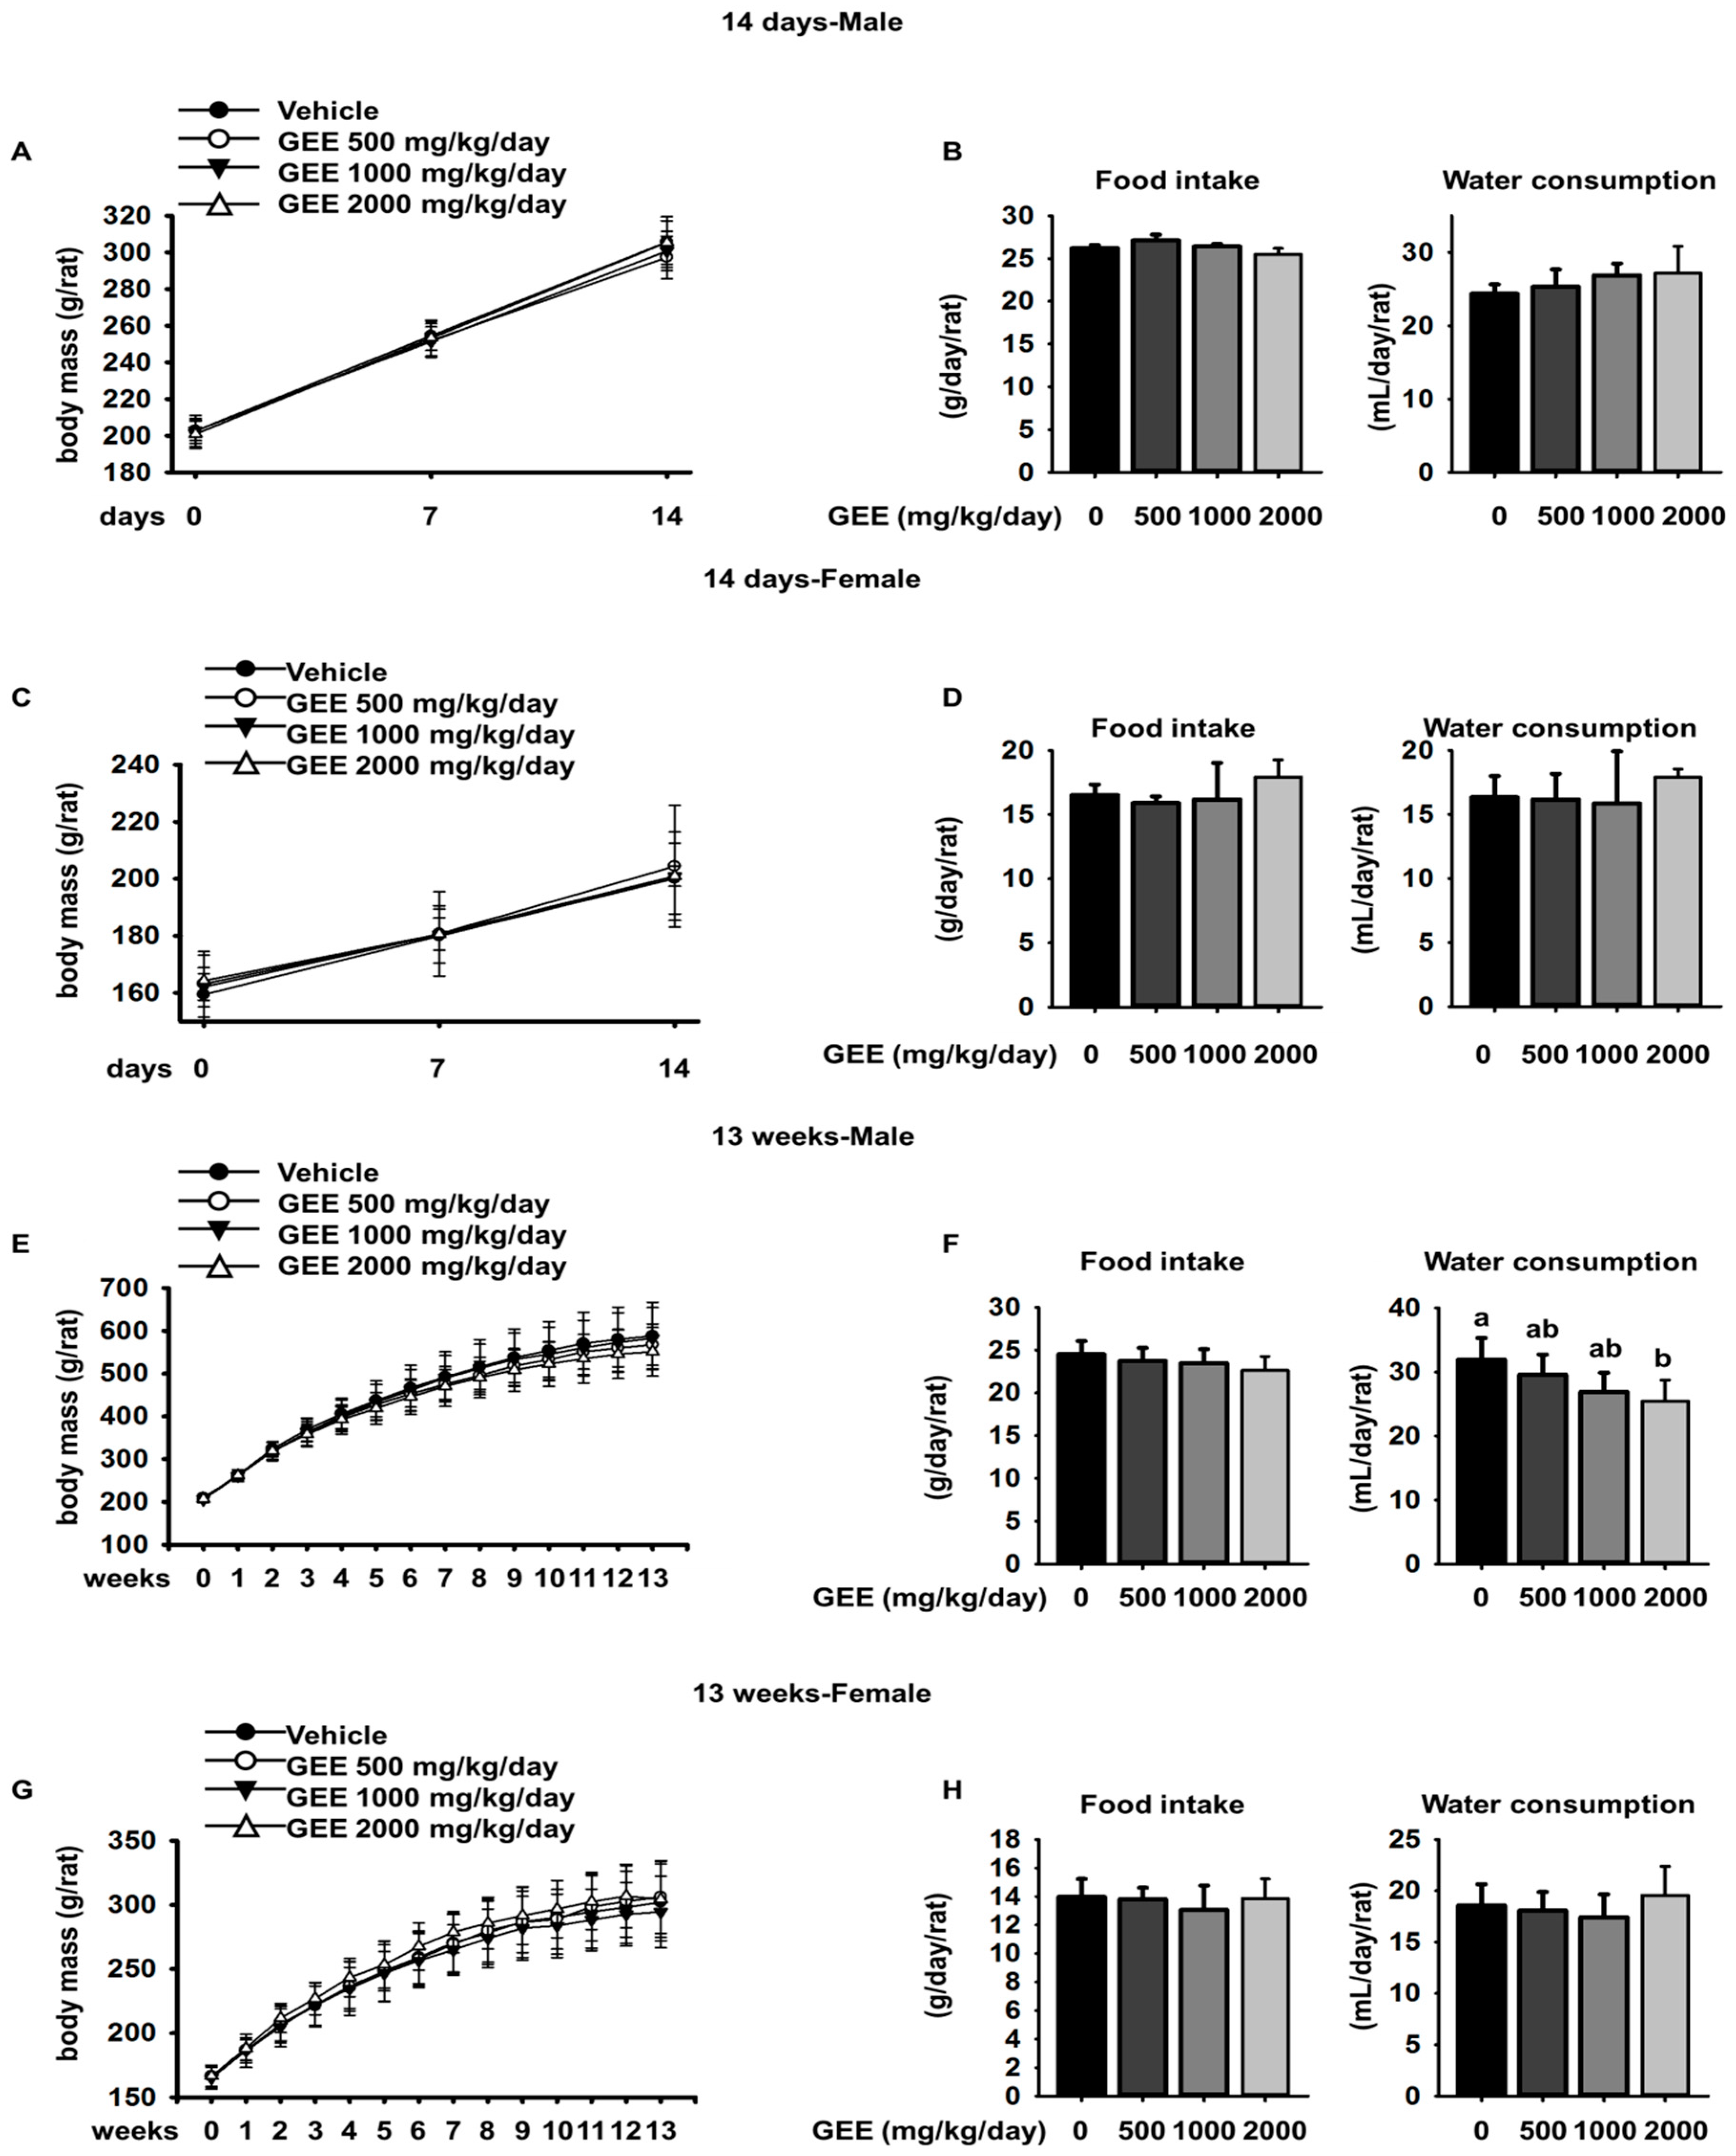
2.3.1. Mortality, Clinical Signs, Body Mass, Food Intake, and Water Consumption
2.3.2. Ophthalmic Examination, Hematology, and Serum Biochemistry
2.3.3. Organ Masses, Histopathology, and Urinalysis
3. Discussion
4. Materials and Methods
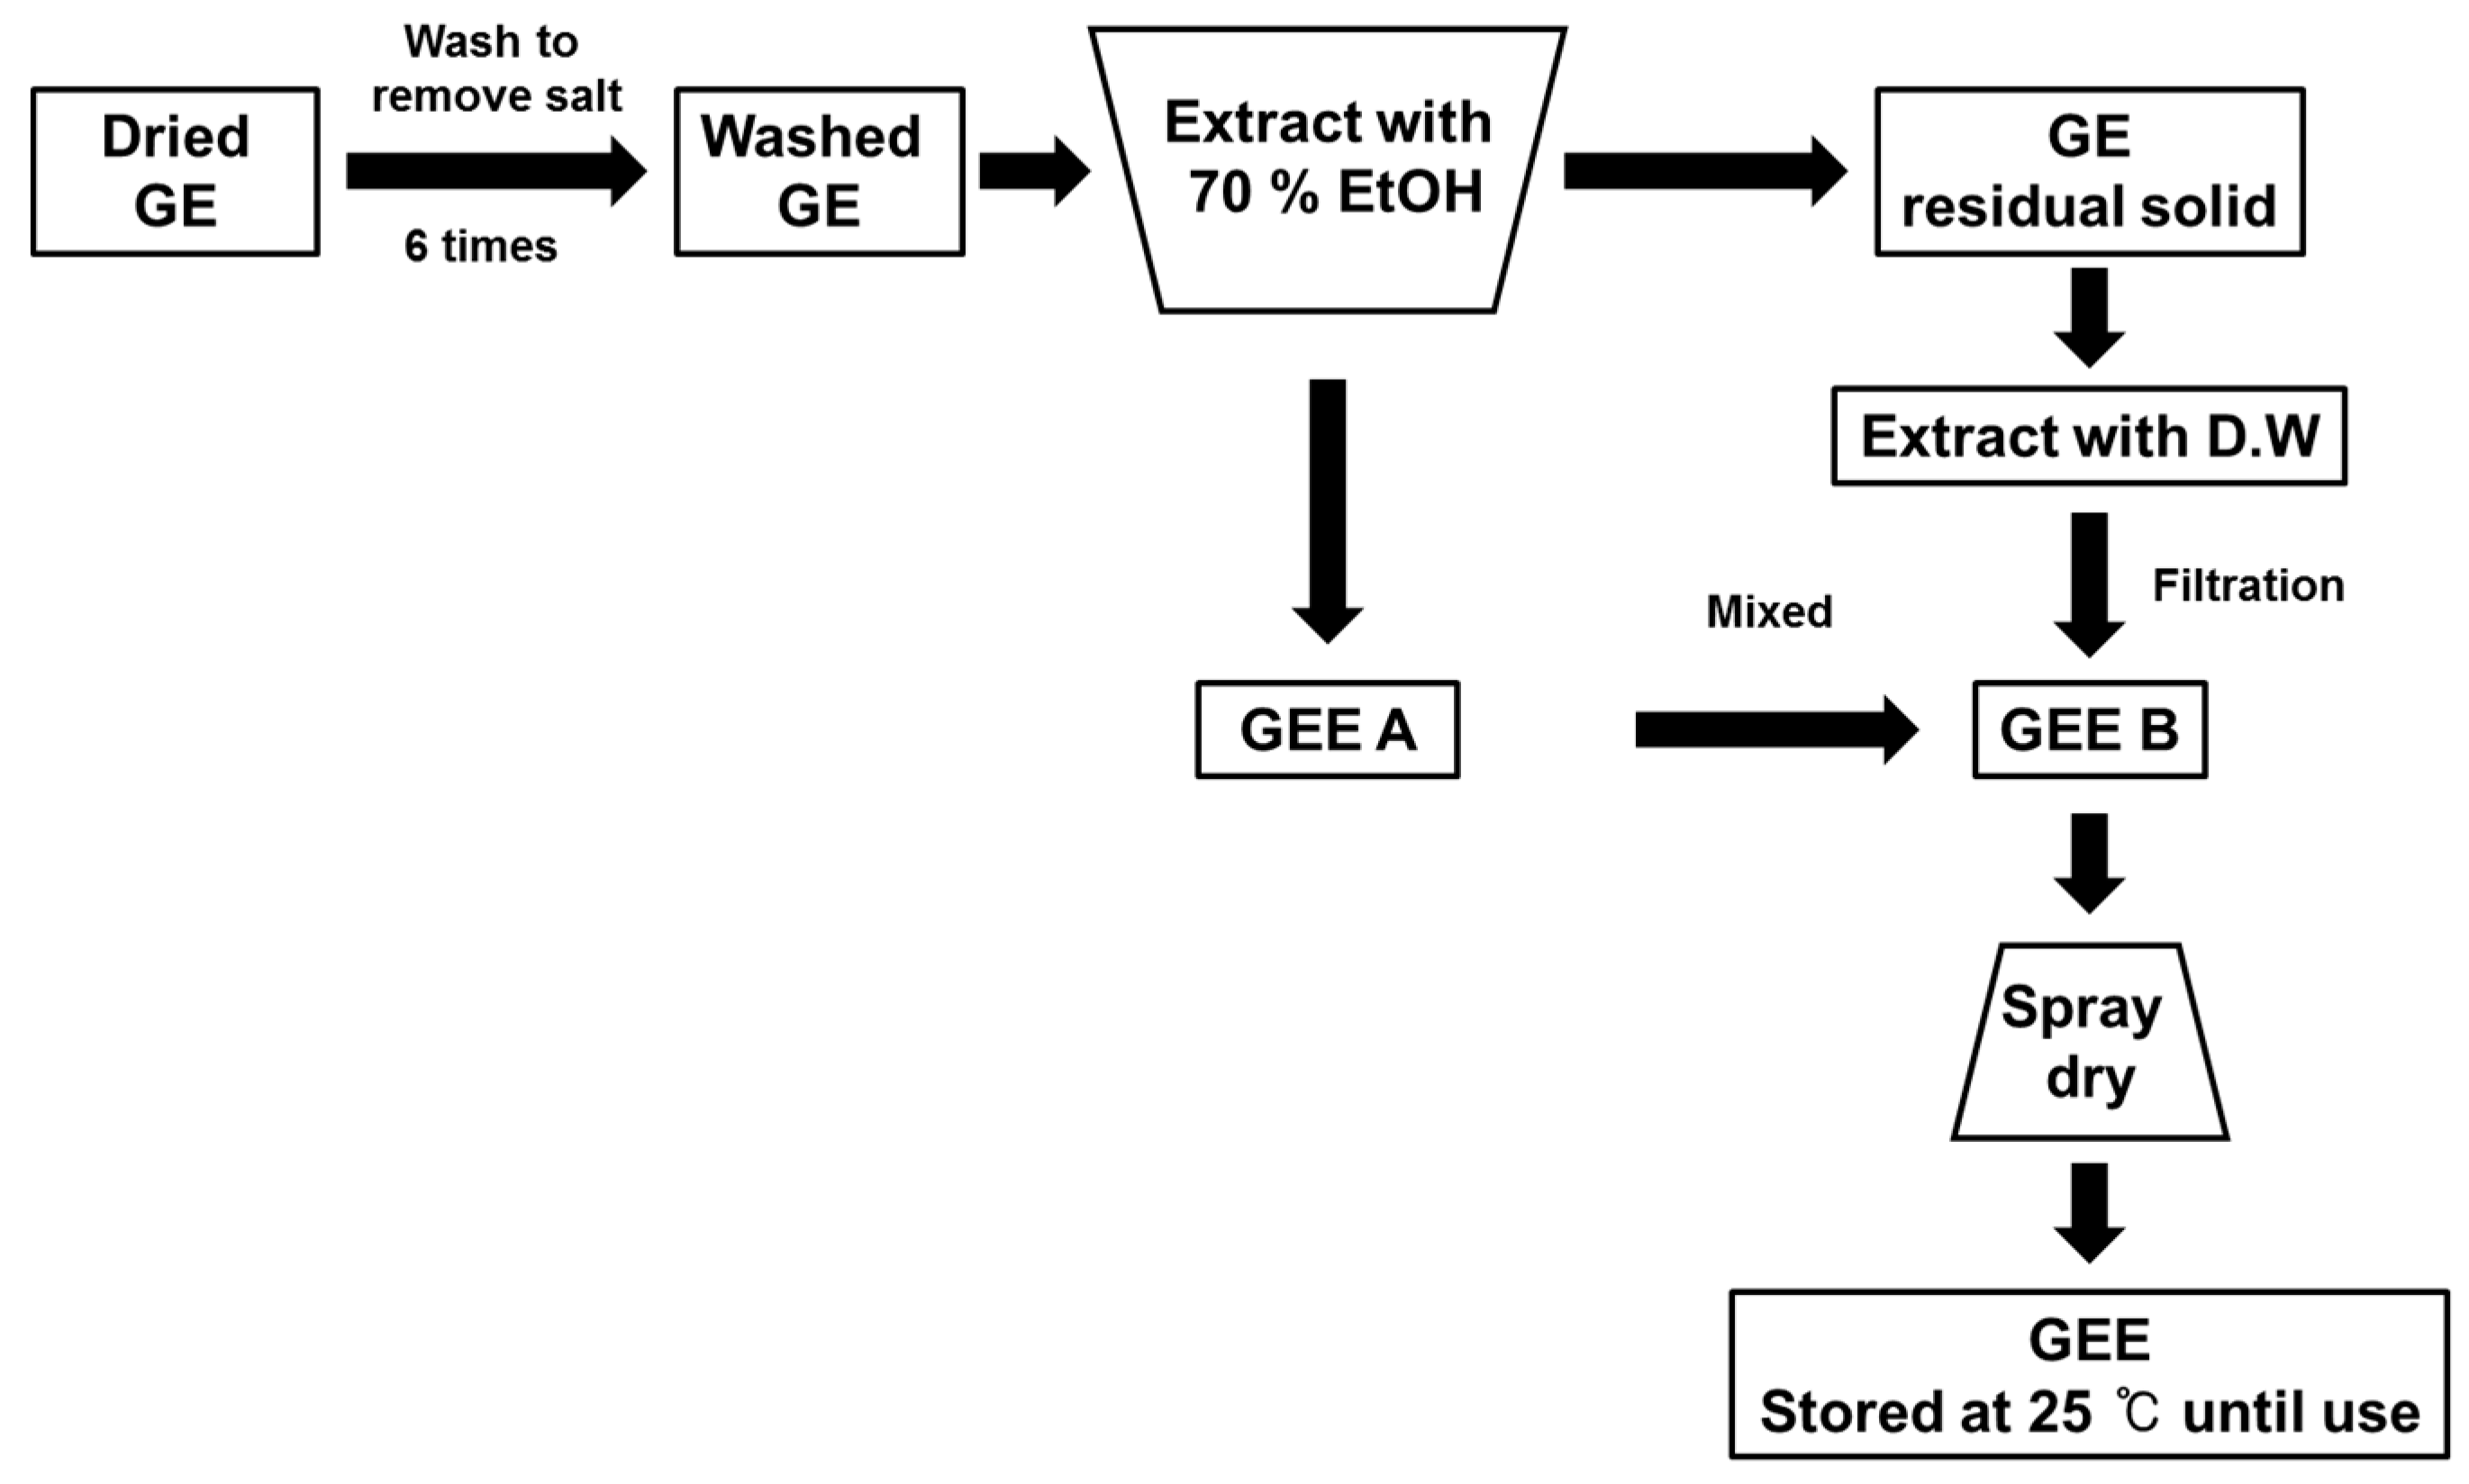
4.1. Preparation of Gelidium elegans Extract (GEE)
4.2. Test Substance
4.3. Experimental Animals
4.4. Study Design Overview
4.4.1. Acute Oral Dose Toxicity Study
4.4.2. 14 Day Repeated Oral Dose Toxicity Study
4.4.3. 13 Week Repeated Oral Dose Toxicity Study
4.5. Clinical Signs
4.6. Body Mass
4.7. Food and Water Consumption
4.8. Ophthalmic Examination
4.9. Hematology and Serum Biochemistry
4.10. Necropsy and Organ Masses
4.11. Urinalysis
4.12. Statistical Analysis
5. Conclusions
Acknowledgments
Author Contributions
Conflicts of Interest
References
- MacArtain, P.; Gill, C.I.; Brooks, M.; Campbell, R.; Rowland, I.R. Nutritional value of edible seaweeds. Nutr. Rev. 2007, 65, 535–543. [Google Scholar] [CrossRef] [PubMed]
- Choi, J.; Kim, K.J.; Koh, E.J.; Lee, B.Y. Gelidium elegans Regulates the AMPK-PRDM16-UCP-1 Pathway and Has a Synergistic Effect with Orlistat on Obesity-Associated Features in Mice Fed a High-Fat Diet. Nutrients 2017, 9, 342. [Google Scholar] [CrossRef] [PubMed]
- Yoshie-Stark, Y.; Hsieh, Y.-P.; Suzuki, T. Distribution of flavonoids and related compounds from seaweeds in Japan. J.-Tokyo Univ. Fish. 2003, 89, 1–6. [Google Scholar]
- Jensen, A. Present and future needs for algae and algal products. Hydrobiologia 1993, 260, 15–23. [Google Scholar] [CrossRef]
- Chen, Y.-H.; Tu, C.-J.; Wu, H.-T. Growth-inhibitory effects of the red alga Gelidium amansii on cultured cells. Biol. Pharm. Bull. 2004, 27, 180–184. [Google Scholar] [CrossRef] [PubMed]
- Jeon, H.J.; Seo, M.J.; Choi, H.S.; Lee, O.H.; Lee, B.Y. Gelidium elegans, an edible red seaweed, and hesperidin inhibit lipid accumulation and production of reactive oxygen species and reactive nitrogen species in 3T3-L1 and RAW264.7 cells. Phytother. Res. 2014, 28, 1701–1709. [Google Scholar] [CrossRef] [PubMed]
- Choi, J.; Kim, K.-J.; Koh, E.-J.; Seo, Y.-J.; Lee, B.-Y. Gelidium elegans Regulates Blood Glucose Homeostasis in ICR Mice. J. Food Nutr. Res. 2017, 5, 274–280. [Google Scholar]
- Choi, J.; Kim, K.-J.; Koh, E.-J.; Lee, B.-Y. Gelidium elegans Extract Ameliorates Type 2 Diabetes via Regulation of MAPK and PI3K/Akt Signaling. Nutrients 2018, 10, 51. [Google Scholar] [CrossRef] [PubMed]
- Kim, K.-J.; Choi, J.; Lee, B.-Y. Evaluation of the Genotoxicity of a Gelidium elegans Extract in Vitro and in Vivo. J. Food Nutr. Res. 2016, 4, 653–657. [Google Scholar]
- Choi, J.; Kim, K.-J.; Koh, E.-J.; Lee, B.-Y. Altered gelidium elegans extract-stimulated beige-like phenotype attenuates adipogenesis in 3t3-l1 cells. J. Food Nutr. Res. 2016, 4, 448–453. [Google Scholar]
- Fu, Y.-W.; Hou, W.-Y.; Yeh, S.-T.; Li, C.-H.; Chen, J.-C. The immunostimulatory effects of hot-water extract of Gelidium amansii via immersion, injection and dietary administrations on white shrimp Litopenaeus vannamei and its resistance against Vibrio alginolyticus. Fish Shellfish Immunol. 2007, 22, 673–685. [Google Scholar] [CrossRef] [PubMed]
- Kang, M.C.; Kang, N.; Kim, S.Y.; Lima, I.S.; Ko, S.C.; Kim, Y.T.; Kim, Y.B.; Jeung, H.D.; Choi, K.S.; Jeon, Y.J. Popular edible seaweed, Gelidium amansii prevents against diet-induced obesity. Food Chem. Toxicol. 2016, 90, 181–187. [Google Scholar] [CrossRef] [PubMed]
- Sparrow, S.S.; Robinson, S.; Bolam, S.; Bruce, C.; Danks, A.; Everett, D.; Fulcher, S.; Hill, R.E.; Palmer, H.; Scott, E.W.; et al. Opportunities to minimise animal use in pharmaceutical regulatory general toxicology: A cross-company review. Regul. Toxicol. Pharmacol. 2011, 61, 222–229. [Google Scholar] [CrossRef] [PubMed]
- Shin, S.H.; Koo, K.H.; Bae, J.S.; Cha, S.B.; Kang, I.S.; Kang, M.S.; Kim, H.S.; Heo, H.S.; Park, M.S.; Gil, G.H.; et al. Single and 90-day repeated oral dose toxicity studies of fermented Rhus verniciflua stem bark extract in Sprague-Dawley rats. Food Chem. Toxicol. 2013, 55, 617–626. [Google Scholar] [CrossRef] [PubMed]
- Weiner, M.L.; Freeman, C.; Trochimowicz, H.; de Gerlache, J.; Jacobi, S.; Malinverno, G.; Mayr, W.; Regnier, J.F. 13-Week drinking water toxicity study of hydrogen peroxide with 6-week recovery period in catalase-deficient mice. Food Chem. Toxicol. 2000, 38, 607–615. [Google Scholar] [CrossRef]
- Campbell, M.A.; Golub, M.S.; Iyer, P.; Kaufman, F.L.; Li, L.H.; Moran Messen, F.; Morgan, J.E.; Donald, J.M. Reduced water intake: Implications for rodent developmental and reproductive toxicity studies. Birth Defects Res. Part B Dev. Reprod. Toxicol. 2009, 86, 157–175. [Google Scholar] [CrossRef] [PubMed]
- Adrogué, H.J.; Madias, N.E. Hyponatremia. N. Engl. J. Med. 2000, 342, 1581–1589. [Google Scholar] [CrossRef] [PubMed]
- Valentine, W.N.; Lawrence, J.S.; Pearce, M.L.; Beck, W.S. The relationship of the basophil to blood histamine in man. Blood 1955, 10, 154–159. [Google Scholar] [PubMed]
- Baek, J.H.; Kim, H.-J.; Fava, M.; Mischoulon, D.; Papakostas, G.I.; Nierenberg, A.; Heo, J.-Y.; Jeon, H.J. Reduced Venous Blood Basophil Count and Anxious Depression in Patients with Major Depressive Disorder. Psychiatry Invest. 2016, 13, 321–326. [Google Scholar] [CrossRef] [PubMed]
- Han, Z.-Z.; Xu, H.-D.; Kim, K.-H.; Ahn, T.-H.; Bae, J.-S.; Lee, J.-Y.; Gil, K.-H.; Lee, J.-Y.; Woo, S.-J.; Yoo, H.-J. Reference data of the main physiological parameters in control Sprague-Dawley rats from pre-clinical toxicity studies. Lab. Anim. Res. 2010, 26, 153–164. [Google Scholar] [CrossRef]
- Chen, Y.-B. Blood differential test. Medlin. Plus 2015, 6, 440–446. [Google Scholar]
- Yun, J.W.; Che, J.H.; Kwon, E.; Kim, Y.S.; Kim, S.H.; You, J.R.; Kim, W.H.; Kim, H.H.; Kang, B.C. Safety evaluation of Angelica gigas: Genotoxicity and 13-weeks oral subchronic toxicity in rats. Regul. Toxicol. Pharmacol. 2015, 72, 473–480. [Google Scholar] [CrossRef] [PubMed]
- Mukinda, J.T.; Syce, J. Acute and chronic toxicity of the aqueous extract of Artemisia afra in rodents. J. Ethnopharmacol. 2007, 112, 138–144. [Google Scholar] [CrossRef] [PubMed]
- Park, J.-H.; Musa-Veloso, K.; Lynch, B.; Leslie, H.; Koo, K.-H.; Kim, S.-B.; Kang, S.-N. 13-Week oral toxicity study of oil derived from squid (Todarodes pacificus) in Sprague-Dawley rats. Regul. Toxicol. Pharmacol. 2012, 64, 195–204. [Google Scholar] [CrossRef] [PubMed]
- Hong, S.J.; Lee, J.-H.; Kim, E.J.; Yang, H.J.; Park, J.-S.; Hong, S.-K. Toxicological evaluation of neoagarooligosaccharides prepared by enzymatic hydrolysis of agar. Regul. Toxicol. Pharmacol. 2017, 90, 9–21. [Google Scholar] [CrossRef] [PubMed]
- Romarís–Hortas, V.; García-Sartal, C.; del Carmen Barciela-Alonso, M.; Domínguez-González, R.; Moreda-Piñeiro, A.; Bermejo-Barrera, P. Bioavailability study using an in-vitro method of iodine and bromine in edible seaweed. Food Chem. 2011, 124, 1747–1752. [Google Scholar] [CrossRef]
- Kim, H.M.; Lee, D.E.; Park, S.D.; Kim, Y.T.; Kim, Y.J.; Jeong, J.W.; Lee, J.-H.; Jang, S.S.; Chung, D.K.; Sim, J.-H. Preventive effect of fermented Gelidium amansii and Cirsium japonicum extract mixture against UVB-induced skin photoaging in hairless mice. Food Sci. Biotechnol. 2014, 23, 623–631. [Google Scholar] [CrossRef]
- Freireich, E.J.; Gehan, E.; Rall, D.; Schmidt, L.; Skipper, H. Quantitative comparison of toxicity of anticancer agents in mouse, rat, hamster, dog, monkey, and man. Cancer Chemother. Rep. 1966, 50, 219. [Google Scholar] [PubMed]
- Okazaki, K.; Okazaki, S.; Nishimura, S.; Nakamura, H.; Kitamura, Y.; Hatayama, K.; Nakamura, A.; Tsuda, T.; Katsumata, T.; Nishikawa, A. A repeated 28-day oral dose toxicity study of methoxychlor in rats, based on the ‘Enhanced OECD Test Guideline 407’ for screening endocrine-disrupting chemicals. Arch. Toxicol. 2001, 75, 513–521. [Google Scholar] [CrossRef] [PubMed]
- Food, K.; Adminisatration, D. Good laboratory practice regulation for non-clinical laboratory studies. Fed. Regul. 1978, 43, 247. [Google Scholar]
Sample Availability: Samples of the compounds are available from the authors. |


| Observation | 0 (mg/kg) | 5000 (mg/kg) | ||
|---|---|---|---|---|
| 6 h (M/F) | 14 Days (M/F) | 6 h (M/F) | 14 Days (M/F) | |
| Skin and fur | Normal | Normal | Normal | Normal |
| Eyes | Normal | Normal | Normal | Normal |
| Behavioral patterns | Normal | Normal | Normal | Normal |
| Compound-colored stools | Normal | Normal | 3/3 | Normal |
| Sleep | Normal | Normal | Normal | Normal |
| Diarrhea | Normal | Normal | 3/3 | Normal |
| Hematologic Values | |||||||||
|---|---|---|---|---|---|---|---|---|---|
| Male | Female | ||||||||
| Parameter | Dosage group (mg/kg/day) | Parameter | Dosage group (mg/kg/day) | ||||||
| 0 | 500 | 1000 | 2000 | 0 | 500 | 1000 | 2000 | ||
| RBC (106/μL) | 7.12 ± 0.38 | 7.43 ± 0.43 | 7.08 ± 0.26 | 7.18 ± 0.32 | RBC (106/μL) | 7.30 ± 0.50 | 7.11 ± 0.34 | 7.28 ± 0.30 | 7.27 ± 0.39 |
| HGB (g/dL) | 14.0 ± 0.7 | 14.5 ± 0.7 | 14.1 ± 0.5 | 14.3 ± 0.5 | HGB (g/dL) | 14.4 ± 0.3 | 13.9 ± 0.3 | 14.5 ± 0.6 | 14.1 ± 0.7 |
| HCT (%) | 43.3 ± 2.1 | 45.2 ± 2.0 | 43.4 ± 1.2 | 43.9 ± 1.4 | HCT (%) | 43.4 ± 1.3 | 41.8 ± 1.2 | 43.6 ± 1.5 | 42.1 ± 2.0 |
| MCV (fL) | 60.8 ± 0.9 | 60.9 ± 1.6 | 61.4 ± 2.2 | 61.2 ± 1.1 | MCV (fL) | 59.6 ± 2.6 | 58.8 ± 1.6 | 59.9 ± 0.6 | 58.1 ± 2.2 |
| MCH (pg) | 19.6 ± 0.3 | 19.6 ± 0.5 | 19.9 ± 0.7 | 19.8 ± 0.5 | MCH (pg) | 19.8 ± 1.1 | 19.5 ± 0.8 | 19.9 ± 0.5 | 19.4 ± 0.8 |
| MCHC (g/dL) | 32.3 ± 0.3 | 32.2 ± 0.2 | 32.5 ± 0.3 | 32.4 ± 0.4 | MCHC (g/dL) | 33.1 ± 0.5 | 33.2 ± 0.7 | 33.3 ± 0.6 | 33.4 ± 0.2 |
| RDW (%) | 12.6 ± 0.5 | 12.5 ± 0.3 | 12.1 ± 0.4 | 12.2 ± 0.5 | RDW (%) | 11.2 ± 0.3 b | 11.9 ± 0.4 a | 11.4 ± 0.2 b | 11.5 ± 0.3 b |
| HDW (g/dL) | 2.39 ± 0.16 | 2.42 ± 0.18 | 2.26 ± 0.15 | 2.29 ± 0.02 | HDW (g/dL) | 2.05 ± 0.08 | 2.20 ± 0.18 | 2.14 ± 0.16 | 2.24 ± 0.09 |
| PLT (103/μL) | 1158.4 ± 161.9 | 964.2 ± 80.3 | 1113.6 ± 123.7 | 1134.6 ± 113.0 | PLT (103/μL) | 1149.8 ± 118.0 | 1136.0 ± 72.1 | 1168.2 ± 127.4 | 1134.8 ± 141.8 |
| MPV (fL) | 5.14 ± 0.15 | 5.18 ± 0.08 | 5.14 ± 0.21 | 5.06 ± 0.11 | MPV (fL) | 5.00 ± 0.10 | 4.98 ± 0.22 | 4.96 ± 0.09 | 5.02 ± 0.18 |
| WBC (103/μL) | 9.93 ± 3.38 | 10.98 ± 2.18 | 11.59 ± 2.55 | 9.93 ± 2.57 | WBC (103/μL) | 7.35 ± 1.66 | 8.39 ± 1.42 | 11.00 ± 2.03 | 10.44 ± 3.94 |
| NEU (103/μL) | 1.4 ± 0.6 | 1.3 ± 0.4 | 1.4 ± 0.4 | 0.8 ± 0.4 | NEU (103/μL) | 0.7 ± 0.2 | 0.8 ± 0.3 | 1.1 ± 0.5 | 1.1 ± 0.5 |
| LYM (103/μL) | 8.1 ± 2.6 | 9.1 ± 1.9 | 9.7 ± 2.3 | 8.7 ± 2.0 | LYM (103/μL) | 6.3 ± 1.5 | 7.2 ± 1.3 | 9.4 ± 1.5 | 8.9 ± 3.3 |
| MONO (103/μL) | 0.34 ± 0.17 | 0.36 ± 0.12 | 0.38 ± 0.14 | 0.30 ± 0.11 | MONO (103/μL) | 0.19 ± 0.08 | 0.19 ± 0.07 | 0.33 ± 0.16 | 0.27 ± 0.14 |
| LUC (103/μL) | 0.08 ± 0.04 | 0.10 ± 0.04 | 0.09 ± 0.02 | 0.08 ± 0.04 | LUC (103/μL) | 0.06 ± 0.03 | 0.08 ± 0.02 | 0.12 ± 0.03 | 0.11 ± 0.07 |
| EOS (103/μL) | 0.06 ± 0.03 | 0.06 ± 0.01 | 0.06 ± 0.02 | 0.04 ± 0.04 | EOS (103/μL) | 0.08 ± 0.03 | 0.07 ± 0.02 | 0.08 ± 0.04 | 0.08 ± 0.05 |
| BASO (103/μL) | 0.02 ± 0.02 | 0.03 ± 0.01 | 0.03 ± 0.01 | 0.02 ± 0.01 | BASO (103/μL) | 0.01 ± 0.01 | 0.02 ± 0.01 | 0.03 ± 0.01 | 0.03 ± 0.02 |
| Serum Biochemical Parameters | |||||||||
|---|---|---|---|---|---|---|---|---|---|
| Male | Female | ||||||||
| Parameter | DOSAGE GROUP (mg/kg/day) | Parameter | DOSAGE GROUP (mg/kg/day) | ||||||
| 0 | 500 | 1000 | 2000 | 0 | 500 | 1000 | 2000 | ||
| AST (U/L) | 83.0 ± 8.8 | 100.4 ± 11.0* | 95.3 ± 9.1 | 91.2 ± 10.8 | AST (U/L) | 77.9 ± 6.6 | 88.2 ± 16.3 | 88.5 ± 6.2 | 79.7 ± 13.9 |
| ALT (U/L) | 25.8 ± 2.8 b | 31.2 ± 1.9 a | 32.7 ± 4.9a | 27.7 ± 4.0 b | ALT (U/L) | 20.5 ± 3.3 | 22.7 ± 3.4 | 24.4 ± 7.6 | 18.5 ± 3.8 |
| ALP (U/L) | 251.1 ± 28.1 | 308.1 ± 72.7 | 247.9 ± 67.3 | 249.2 ± 66.3 | ALP (U/L) | 174.1 ± 30.2 | 153.0 ± 57.1 | 165.0 ± 40.5 | 149.6 ± 33.8 |
| CPK (U/L) | 199.2 ± 61.0 | 224.4 ± 57.1 | 220.2 ± 73.9 | 227.0 ± 112.7 | CPK (U/L) | 156.2 ± 62.9 | 191.8 ± 109.6 | 204.4 ± 57.8 | 156.2 ± 73.1 |
| TBIL (mg/dL) | 0.13 ± 0.01 | 0.13 ± 0.01 | 0.15 ± 0.01 | 0.15 ± 0.01 | TBIL (mg/dL) | 0.14 ± 0.01 | 0.14 ± 0.02 | 0.15 ± 0.02 | 0.12 ± 0.02 |
| GLU (mg/dL) | 128.2 ± 27.3 | 116.4 ± 10.4 | 117.3 ± 8.8 | 114.0 ± 7.7 | GLU (mg/dL) | 118.5 ± 7.1 | 119.1 ± 20.6 | 116.0 ± 5.5 | 124.8 ± 16.1 |
| TCHO (mg/dL) | 49.0 ± 5.1 | 61.0 ± 11.7 | 57.6 ± 15.8 | 67.8 ± 14.1 | TCHO (mg/dL) | 61.4 ± 14.1 | 65.6 ± 7.7 | 69.4 ± 8.9 | 64.4 ± 5.5 |
| TG (mg/dL) | 46.4 ± 19.4 | 40.6 ± 11.0 | 46.2 ± 15.4 | 48.2 ± 8.0 | TG (mg/dL) | 18.2 ± 2.9 | 24.4 ± 3.4 | 22.6 ± 2.9 | 23.6 ± 6.2 |
| TP (g/dL) | 5.43 ± 0.34 | 5.50 ± 0.18 | 5.35 ± 0.21 | 5.59 ± 0.17 | TP (g/dL) | 5.73 ± 0.21 | 5.42 ± 0.24 | 5.92 ± 0.29 | 5.67 ± 0.29 |
| ALB (g/dL) | 3.06 ± 0.17 | 3.11 ± 0.11 | 3.00 ± 0.10 | 3.09 ± 0.07 | ALB (g/dL) | 3.32 ± 0.14 a | 3.06 ± 0.12 b | 3.38 ± 0.24 a | 3.18 ± 0.16 a |
| A/G ratio | 1.30 ± 0.04 | 1.30 ± 0.04 | 1.28 ± 0.03 | 1.24 ± 0.08 | A/G ratio | 1.38 ± 0.06 | 1.30 ± 0.05 | 1.33 ± 0.07 | 1.28 ± 0.06 |
| BUN (mg/dL) | 12.5 ± 2.0 | 13.4 ± 1.8 | 11.7 ± 2.0 | 11.6 ± 1.9 | BUN (mg/dL) | 16.6 ± 3.8 | 16.7 ± 7.8 | 16.4 ± 4.3 | 15.7 ± 2.8 |
| CRE (mg/dL) | 0.40 ± 0.02 | 0.42 ± 0.02 | 0.39 ± 0.03 | 0.39 ± 0.01 | CRE (mg/dL) | 0.43 ± 0.04 | 0.45 ± 0.11 | 0.42 ± 0.04 | 0.43 ± 0.05 |
| IP (mg/dL) | 8.85 ± 0.54 | 8.62 ± 0.31 | 8.66 ± 0.51 | 8.95 ± 0.37 | IP (mg/dL) | 7.98 ± 0.39 | 8.07 ± 1.20 | 8.28 ± 0.32 | 8.17 ± 0.41 |
| Ca2+ (mg/dL) | 10.18 ± 0.40 | 10.10 ± 0.18 | 10.19 ± 0.30 | 10.29 ± 0.17 | Ca2+ (mg/dL) | 10.28 ± 0.13 a | 9.98 ± 0.25 b | 10.35 ± 0.17 a | 10.04 ± 0.06 a |
| Na+ (mmol/L) | 142.0 ± 2.3 | 143.7 ± 1.0 | 143.3 ± 1.3 | 142.6 ± 1.5 | Na+ (mmol/L) | 142.0 ± 1.5 | 141.2 ± 0.9 | 141.6 ± 0.8 | 140.2 ± 2.3 |
| K+ (mmol/L) | 4.55 ± 0.28 | 4.61 ± 0.25 | 4.61 ± 0.27 | 4.90 ± 0.22 | K+ (mmol/L) | 4.65 ± 0.18 | 4.55 ± 0.40 | 4.77 ± 0.18 | 4.80 ± 0.37 |
| Cl− (mmol/L) | 100.6 ± 1.5 b | 103.1 ± 1.4 a | 102.0 ± 0.8 b | 101.1 ± 1.3 b | Cl− (mmol/L) | 102.9 ± 0.7 | 102.9 ± 2.2 | 102.0 ± 1.4 | 101.3 ± 0.9 |
| Organ Mass | |||||||||
|---|---|---|---|---|---|---|---|---|---|
| Male | Female | ||||||||
| Parameter | DOSAGE GROUP (mg/kg/day) | Parameter | DOSAGE GROUP (mg/kg/day) | ||||||
| 0 | 500 | 1000 | 2000 | 0 | 500 | 1000 | 2000 | ||
| Brain | 1.9908 ± 0.127 | 1.8411 ± 0.0583 | 1.8600 ± 0.0930 | 1.9268 ± 0.1207 | Brain | 1.7817 ± 0.0491 | 1.8381 ± 0.0844 | 1.8083 ± 0.0916 | 1.8393 ± 0.0733 |
| Liver | 8.6867 ± 0.6709 | 8.3086 ± 0.5847 | 8.4274 ± 0.4454 | 8.7122 ± 0.3498 | Liver | 5.6089 ± 0.6423 | 6.2158 ± 0.9499 | 6.0697 ± 0.4692 | 6.2916 ± 0.5655 |
| Lung | 1.2767 ± 0.0698 | 1.2879 ± 0.0717 | 1.2442 ± 0.0677 | 1.2160 ± 0.0922 | Lung | 1.0667 ± 0.1454 | 1.0345 ± 0.1511 | 0.9943 ± 0.0668 | 0.9776 ± 0.0781 |
| Heart | 1.0914 ± 0.0980 | 1.0828 ± 0.0992 | 1.0728 ± 0.1155 | 1.0801 ± 0.0846 | Heart | 0.7640 ± 0.0313 | 0.7465 ± 0.0492 | 0.7684 ± 0.0234 | 0.7604 ± 0.0418 |
| Adrenal gland (left) | 0.0296 ± 0.0040 | 0.0269 ± 0.0037 | 0.0272 ± 0.0013 | 0.0286 ± 0.0032 | Adrenal gland (left) | 0.0307 ± 0.0009 | 0.0318 ± 0.0037 | 0.0367 ± 0.0053 | 0.0308 ± 0.0045 |
| Adrenal gland (right) | 0.0288 ± 0.0028 | 0.0262 ± 0.0023 | 0.0275 ± 0.0011 | 0.0259 ± 0.0041 | Adrenal gland (right) | 0.0286 ± 0.0027 | 0.0315 ± 0.0021 | 0.0352 ± 0.0085 | 0.0297 ± 0.0031 |
| Thymus | 0.5798 ± 0.1385 | 0.5142 ± 0.0747 | 0.5884 ± 0.1450 | 0.5601 ± 0.0620 | Thymus | 0.4132 ± 0.1156 | 0.4396 ± 0.1106 | 0.4600 ± 0.0761 | 0.4084 ± 0.0879 |
| Prostate gland | 0.2975 ± 0.0776 | 0.3365 ± 0.0979 | 0.3012 ± 0.0938 | 0.3969 ± 0.0651 | Ovary (left) | 0.0320 ± 0.0051 | 0.0335 ± 0.0056 | 0.0398 ± 0.0066 | 0.0401 ± 0.0078 |
| Testis (left) | 1.5784 ± 0.1467 | 1.4622 ± 0.1154 | 1.4963 ± 0.1423 | 1.5880 ± 0.1190 | Ovary (right) | 0.0354 ± 0.0041 | 0.0370 ± 0.0033 | 0.0365 ± 0.0037 | 0.0384 ± 0.0063 |
| Testis (right) | 1.5844 ± 0.1562 | 1.4693 ± 0.1179 | 1.5258 ± 0.1786 | 1.6005 ± 0.1273 | Uterus and cervix | 0.3542 ± 0.0425 | 0.4892 ± 0.1713 | 0.3866 ± 0.0548 | 0.4678 ± 0.1171 |
| Epididymis (left) | 0.3127 ± 0.0348 | 0.3114 ± 0.0455 | 0.3223 ± 0.0712 | 0.3036 ± 0.0359 | |||||
| Epididymis (right) | 0.3298 ± 0.0397 | 0.3287 ± 0.0497 | 0.3296 ± 0.0359 | 0.3073 ± 0.0434 | |||||
| Spleen | 0.6983 ± 0.1169 | 0.6959 ± 0.1093 | 0.7273 ± 0.0763 | 0.6948 ± 0.1020 | Spleen | 0.3974 ± 0.0681 | 0.4780 ± 0.1353 | 0.4525 ± 0.0152 | 0.4598 ± 0.0719 |
| Kidney (left) | 1.0931 ± 0.0698 | 1.1250 ± 0.0853 | 1.1321 ± 0.0920 | 1.1686 ± 0.0695 | Kidney (left) | 0.7273 ± 0.0711 | 0.8073 ± 0.1017 | 0.8012 ± 0.026 | 0.8245 ± 0.0389 |
| Kidney (right) | 1.1054 ± 0.0618 | 1.1423 ± 0.0927 | 1.1642 ± 0.0705 | 1.1781 ± 0.0816 | Kidney (right) | 0.7821 ± 0.0857 | 0.8424 ± 0.1099 | 0.8441 ± 0.0500 | 0.8502 ± 0.0479 |
| Urinalysis Findings | |||||||||||||
|---|---|---|---|---|---|---|---|---|---|---|---|---|---|
| Male | Female | ||||||||||||
| Parameter | Result | Grade | DOSAGE GROUP (mg/kg/day) | Parameter | Result | DOSAGE GROUP (mg/kg/day) | |||||||
| 0 | 500 | 1000 | 2000 | 0 | 500 | 1000 | 2000 | ||||||
| Glucose (mg/dL) | Negative | 5 | 5 | 5 | 5 | Glucose (mg/dL) | Negative | 5 | 5 | 5 | 5 | ||
| Bilirubin | Negative | 5 | 5 | 5 | 5 | Bilirubin | Negative | 5 | 5 | 5 | 5 | ||
| Ketone body (mg/dL) | - | 5 | 5 | 5 | 1 | Ketone body (mg/dL) | - | 5 | 5 | 5 | 5 | ||
| pH | 7 | 1 | pH | 7 | |||||||||
| 7.5 | 1 | 7.5 | 1 | ||||||||||
| 8 | 2 | 4 | 1 | 1 | 1 | 8 | 2 | 1 | 2 | ||||
| 8.5 | 3 | 1 | 4 | 4 | 3 | 8.5 | 3 | 5 | 4 | 5 | 3 | ||
| ≥9.0 | 4 | ≥9.0 | 4 | ||||||||||
| Urobilinogen (Ehrlich unit/dL) | 0.2 | 5 | 5 | 5 | 5 | Urobilinogen (Ehrlich unit/dL) | 0.2 | 5 | 5 | 5 | 5 | ||
| Occult blood | Negative | 4 | 5 | 4 | 5 | Occult blood | Negative | 4 | 5 | 5 | 5 | ||
| Trace | 1 | 1 | 1 | Trace | 1 | 1 | |||||||
| Small | 2 | Small | 2 | ||||||||||
| Hematologic Values | |||||||||
|---|---|---|---|---|---|---|---|---|---|
| Male | Female | ||||||||
| Parameter | DOSAGE GROUP (mg/kg/day) | Parameter | DOSAGE GROUP (mg/kg/day) | ||||||
| 0 | 500 | 1000 | 2000 | 0 | 500 | 1000 | 2000 | ||
| RBC (106/mL) | 8.40 ± 0.20 | 8.30 ± 0.50 | 8.30 ± 0.30 | 8.20 ± 0.20 | RBC (106/mL) | 7.79 ± 0.34 | 7.68 ± 0.32 | 7.41 ± 0.36 | 7.54 ± 0.36 |
| HGB (g/dL) | 14.30 ± 0.60 | 14.00 ± 0.60 | 14.40 ± 0.50 | 14.10 ± 0.60 | HGB (g/dL) | 14.30 ± 0.60 a | 14.00 ± 0.50 a,b | 13.50 ± 0.40 b | 13.90 ± 0.70 a,b |
| HCT (%) | 44.30 ± 1.80 | 43.30 ± 2.20 | 44.20 ± 1.30 | 43.40 ± 2.00 | HCT (%) | 42.60 ± 2.10 a | 41.80 ± 1.10 a,b | 40.50 ± 1.20 b | 41.60 ± 1.60 a,b |
| MCV (fL) | 52.70 ± 1.10 | 52.10 ± 1.30 | 53.00 ± 1.30 | 52.40 ± 1.30 | MCV (fL) | 54.80 ± 1.60 | 54.50 ± 1.30 | 54.70 ± 1.50 | 55.20 ± 1.20 |
| MCH (pg) | 17.00 ± 0.50 | 16.90 ± 0.60 | 17.30 ± 0.60 | 17.00 ± 0.50 | MCH (pg) | 18.30 ± 0.50 | 18.20 ± 0.40 | 18.30 ± 0.70 | 18.50 ± 0.40 |
| MCHC (g/dL) | 32.20 ± 0.40 | 32.40 ± 0.40 | 32.60 ± 0.50 | 32.60 ± 0.30 | MCHC (g/dL) | 33.40 ± 0.20 | 33.40 ± 0.50 | 33.40 ± 0.50 | 33.40 ± 0.50 |
| RDW (%) | 13.50 ± 1.20 | 13.30 ± 0.90 | 13.40 ± 0.70 | 13.00 ± 0.70 | RDW (%) | 11.70 ± 0.30 | 11.80 ± 0.50 | 11.70 ± 0.60 | 11.70 ± 0.30 |
| HDW (g/dL) | 2.50 ± 0.30 | 2.50 ± 0.20 | 2.50 ± 0.10 | 2.40 ± 0.10 | HDW (g/dL) | 2.21 ± 0.09 | 2.15 ± 0.14 | 2.15 ± 0.14 | 2.17 ± 0.15 |
| PLT (103/mL) | 882.40 ± 88.60 | 947.80 ± 116.30 | 922.50 ± 68.70 | 845.80 ± 104.10 | PLT (103/mL) | 914.20 ± 51.30 | 983.80 ± 114.90 | 927.10 ± 94.50 | 959.70 ± 91.80 |
| MPV (fL) | 5.00 ± 0.10 | 5.30 ± 0.50 | 5.14 ± 0.20 | 5.13 ± 0.20 | MPV (fL) | 5.15 ± 0.17 | 5.13 ± 0.13 | 5.26 ± 0.25 | 5.17 ± 0.31 |
| WBC (103/μL) | 9.00 ± 2.25 | 10.69 ± 2.62 | 9.84 ± 2.58 | 10.00 ± 2.01 | WBC (103/μL) | 5.73 ± 2.21 | 6.93 ± 2.26 | 5.23 ± 1.20 | 6.36 ± 1.54 |
| NEU (103/μL) | 1.7 ± 0.6 | 2.4 ± 0.9 | 2.2 ± 1.4 | 1.9 ± 0.6 | NEU (103/μL) | 0.8 ± 0.4 | 1.8 ± 1.5 | 0.8 ± 0.4 | 0.9 ± 0.3 |
| LYM (103/mL) | 6.80 ± 1.90 | 7.80 ± 2.10 | 7.20 ± 2.00 | 7.70 ± 1.90 | LYM (103/mL) | 4.60 ± 1.80 | 4.80 ± 1.50 | 4.20 ± 1.40 | 5.30 ± 1.40 |
| MONO (103/mL) | 0.33 ± 0.14 | 0.32 ± 0.13 | 0.31 ± 0.10 | 0.35 ± 0.14 | MONO (103/mL) | 0.16 ± 0.07 | 0.23 ± 0.16 | 0.14 ± 0.06 | 0.14 ± 0.05 |
| LUC (%) | 0.50 ± 0.20 | 0.40 ± 0.20 | 0.40 ± 0.20 | 0.40 ± 0.40 | LUC (%) | 0.67 ± 0.39 | 0.59 ± 0.29 | 0.51 ± 0.27 | 0.42 ± 0.16 |
| EOS (103/μL) | 0.09 ± 0.03 | 0.08 ± 0.02 | 0.09 ± 0.04 | 0.84 ± 0.30 | EOS (103/μL) | 0.07 ± 0.02 | 0.08 ± 0.04 | 0.06 ± 0.02 | 0.07 ± 0.04 |
| BASO (103/μL) | 0.01 ± 0.01 | 0.02 ± 0.01 | 0.02 ± 0.01 | 0.02 ± 0.01 | BASO (103/μL) | 0.01 ± 0.01 | 0.01 ± 0.00 | 0.00 ± 0.01 | 0.00 ± 0.01 |
| Serum Biochemical Parameters | |||||||||
|---|---|---|---|---|---|---|---|---|---|
| Male | Female | ||||||||
| Parameter | DOSAGE GROUP (mg/kg/day) | Parameter | DOSAGE GROUP (mg/kg/day) | ||||||
| 0 | 500 | 1000 | 2000 | 0 | 500 | 1000 | 2000 | ||
| AST (U/L) | 114.40 ± 24.70 | 107.80 ± 29.80 | 98.50 ± 20.30 | 94.60 ± 15.70 | AST (U/L) | 105.90 ± 33.20 | 98.50 ± 22.40 | 99.10 ± 18.30 | 87.20 ± 20.60 |
| ALT (U/L) | 28.50 ± 2.80 | 27.80 ± 5.90 | 26.40 ± 3.80 | 28.30 ± 5.10 | ALT (U/L) | 23.90 ± 5.70 | 30.70 ± 27.00 | 22.20 ± 5.50 | 18.50 ± 2.60 |
| ALP (U/L) | 78.30 ± 8.00 | 73.60 ± 11.40 | 82.80 ± 26.90 | 79.80 ± 17.80 | ALP (U/L) | 48.50 ± 10.70 | 45.10 ± 10.80 | 43.80 ± 17.10 | 36.00 ± 12.50 |
| CPK (U/L) | 323.60 ± 194.90 | 377.50 ± 317.00 | 290.90 ± 162.30 | 207.60 ± 105.70 | CPK (U/L) | 404.70 ± 326.40 | 258.20 ± 140.60 | 269.40 ± 133.80 | 233.60 ± 110.70 |
| TBIL (mg/dL) | 0.10 ± 0.00 | 0.10 ± 0.00 | 0.10 ± 0.00 | 0.10 ± 0.00 | TBIL (mg/dL) | 0.18 ± 0.03 | 0.18 ± 0.01 | 0.18 ± 0.02 | 0.17 ± 0.02 |
| GLU (mg/dL) | 142.60 ± 18.10 | 141.70 ± 15.10 | 137.50 ± 15.90 | 137.30 ± 19.60 | GLU (mg/dL) | 125.60 ± 15.20 | 130.80 ± 9.90 | 130.00 ± 12.60 | 137.10 ± 13.00 |
| TCHO (mg/dL) | 60.60 ± 16.10 | 56.20 ± 14.70 | 55.40 ± 13.50 | 49.50 ± 9.10 | TCHO (mg/dL) | 82.40 ± 15.80 | 79.40 ± 16.10 | 73.20 ± 22.50 | 69.90 ± 14.20 |
| TG (mg/dL) | 59.60 ± 19.60 | 65.70 ± 24.90 | 69.40 ± 26.60 | 47.50 ± 17.20 | TG (mg/dL) | 46.20 ± 19.10 | 44.80 ± 15.60 | 39.30 ± 10.70 | 38.30 ± 7.50 |
| TP (g/dL) | 5.80 ± 0.20 | 5.80 ± 0.20 | 5.80 ± 0.20 | 5.80 ± 0.20 | TP (g/dL) | 6.60 ± 0.40 | 6.50 ± 0.40 | 6.50 ± 0.40 | 6.40 ± 0.30 |
| ALB (g/dL) | 2.90 ± 0.10 | 2.90 ± 0.10 | 2.90 ± 0.10 | 2.90 ± 0.10 | ALB (g/dL) | 3.40 ± 0.20 | 3.40 ± 0.30 | 3.50 ± 0.30 | 3.40 ± 0.20 |
| A/G ratio | 0.90 ± 0.00 | 0.90 ± 0.00 | 0.90 ± 0.00 | 0.90 ± 0.00 | A/G ratio | 1.10 ± 0.00 | 1.10 ± 0.00 | 1.10 ± 0.00 | 1.10 ± 0.00 |
| BUN (mg/dL) | 13.00 ± 1.50 | 12.60 ± 1.30 | 12.10 ± 1.30 | 11.80 ± 1.30 | BUN (mg/dL) | 15.90 ± 2.20 | 16.20 ± 3.60 | 15.90 ± 2.20 | 16.50 ± 2.20 |
| CRE (mg/dL) | 0.40 ± 0.00 | 0.40 ± 0.00 | 0.40 ± 0.00 | 0.40 ± 0.00 | CRE (mg/dL) | 0.50 ± 0.00 | 0.50 ± 0.00 | 0.50 ± 0.00 | 0.50 ± 0.00 |
| IP (mg/dL) | 6.30 ± 0.70 | 6.20 ± 0.50 | 6.60 ± 0.30 | 6.60 ± 0.60 | IP (mg/dL) | 5.40 ± 0.70 | 5.40 ± 0.70 | 5.30 ± 0.80 | 5.00 ± 0.50 |
| Ca2+ (mg/dL) | 9.60 ± 0.30 | 9.50 ± 0.30 | 9.60 ± 0.20 | 9.50 ± 0.10 | Ca2+ (mg/dL) | 9.70 ± 0.30 | 9.80 ± 0.20 | 9.80 ± 0.30 | 9.60 ± 0.20 |
| Na+ (mmol/L) | 137.3 ± 1.0 | 136.9 ± 1.3 | 137.9 ± 0.9 | 137.2 ± 1.0 | Na+ (mmol/L) | 139.0 ± 1.4 | 139.6 ± 1.0 | 140.3 ± 0.9 | 140.0 ± 1.1 |
| K+ (mmol/L) | 4.40 ± 0.30 | 4.30 ± 0.10 | 4.50 ± 0.20 | 4.30 ± 0.20 | K+ (mmol/L) | 4.10 ± 0.10 | 4.00 ± 0.20 | 4.10 ± 0.20 | 4.10 ± 0.20 |
| Cl− (mmol/L) | 103.00 ± 0.70 a,b | 101.80 ± 1.10 b | 102.60 ± 1.80 a,b | 103.70 ± 1.20 a | Cl− (mmol/L) | 105.00 ± 2.40 | 105.30 ± 1.30 | 105.00 ± 1.90 | 104.90 ± 1.20 |
| Organ Mass | |||||||||
|---|---|---|---|---|---|---|---|---|---|
| Male | Female | ||||||||
| Parameter | DOSAGE GROUP (mg/kg/day) | Parameter | DOSAGE GROUP (mg/kg/day) | ||||||
| 0 | 500 | 1000 | 2000 | 0 | 500 | 1000 | 2000 | ||
| Brain | 2.1722 ± 0.0870 | 2.1986 ± 0.0835 | 2.1897 ± 0.0659 | 2.2072 ± 0.0692 | Brain | 1.9980 ± 0.0509 | 2.0040 ± 0.0814 | 2.0165 ± 0.0561 | 1.9942 ± 0.1344 |
| Liver | 14.0444 ± 2.0679 | 14.1644 ± 1.9002 | 14.2981 ± 2.3778 | 13.6100 ± 2.2241 | Liver | 6.9079 ± 0.8804 | 7.4317 ± 1.4922 | 7.2338 ± 0.9856 | 7.3973 ± 0.8108 |
| Lung | 1.6469 ± 0.1532 | 1.7322 ± 0.1829 | 1.7312 ± 0.1256 | 1.6717 ± 0.1063 | Lung | 1.3203 ± 0.1561 | 1.2862 ± 0.1248 | 1.2307 ± 0.1022 | 1.3026 ± 0.1534 |
| Heart | 1.6364 ± 0.2549 | 1.5973 ± 0.1365 | 1.5962 ± 0.1673 | 1.5401 ± 0.1419 | Heart | 0.9488 ± 0.0584 | 0.9672 ± 0.1070 | 0.9387 ± 0.1000 | 0.9532 ± 0.0945 |
| Adrenal gland (left) | 0.0317 ± 0.0065 a,b | 0.0328 ± 0.0058a | 0.0282 ± 0.0059 a,b | 0.0271 ± 0.0023 b | Adrenal gland (left) | 0.0348 ± 0.0038 | 0.0334 ± 0.0066 | 0.0351 ± 0.0054 | 0.0322 ± 0.0048 |
| Adrenal gland (right) | 0.0302 ± 0.0055 a | 0.0303 ± 0.0043a | 0.0268 ± 0.0053 a,b | 0.0251 ± 0.0016 b | Adrenal gland (right) | 0.0331 ± 0.0033 | 0.0314 ± 0.0059 | 0.0331 ± 0.0051 | 0.0312 ± 0.0041 |
| Thymus | 0.2616 ± 0.0819 | 0.2656 ± 0.0519 | 0.2344 ± 0.0622 | 0.2207 ± 0.0438 | Thymus | 0.2378 ± 0.0525 a,b | 0.2136 ± 0.0589 a,b | 0.2005 ± 0.0383 b | 0.2509 ± 0.0527 a |
| Prostate gland | 0.6121 ± 0.1828 | 0.6580 ± 0.2972 | 0.6861 ± 0.2216 | 0.6156 ± 0.1483 | Ovary (left) | 0.0397 ± 0.0058 | 0.0377 ± 0.0106 | 0.0391 ± 0.0078 | 0.0433 ± 0.0091 |
| Testis (left) | 1.8282 ± 0.0968 | 1.8374 ± 0.2510 | 1.8507 ± 0.1118 | 1.8145 ± 0.0958 | Ovary (right) | 0.0401 ± 0.0050 | 0.0370 ± 0.0089 | 0.0393 ± 0.0059 | 0.0424 ± 0.0132 |
| Testis (right) | 1.8265 ± 0.1172 | 1.8273 ± 0.2536 | 1.8414 ± 0.1086 | 1.8167 ± 0.1191 | Uterus and cervix | 0.7733 ± 0.1765 | 0.8494 ± 0.2801 | 0.8345 ± 0.3134 | 0.6764 ± 0.2565 |
| Epididymis (left) | 0.6682 ± 0.0414 | 0.7074 ± 0.0725 | 0.6761 ± 0.0413 | 0.6726 ± 0.0379 | |||||
| Epididymis (right) | 0.6826 ± 0.0430 | 0.7055 ± 0.0762 | 0.6746 ± 0.0484 | 0.6772 ± 0.0455 | |||||
| Spleen | 0.9013 ± 0.1871 | 0.9034 ± 0.1801 | 0.8648 ± 0.0925 | 0.8385 ± 0.1602 | Spleen | 0.5547 ± 0.1078 | 0.5442 ± 0.0681 | 0.5112 ± 0.0958 | 0.5308 ± 0.0741 |
| Kidney (left) | 1.5667 ± 0.1984 | 1.5774 ± 0.2051 | 1.5679 ± 0.1791 | 1.6136 ± 0.1419 | Kidney (left) | 0.8260 ± 0.0764 | 0.9073 ± 0.1266 | 0.8913 ± 0.1462 | 0.8989 ± 0.0966 |
| Kidney (right) | 1.5988 ± 0.1988 | 1.6185 ± 0.2202 | 1.6256 ± 0.1887 | 1.6591 ± 0.1470 | Kidney (right) | 0.8560 ± 0.0750 | 0.9106 ± 0.1154 | 0.9148 ± 0.1228 | 0.9151 ± 0.0940 |
| Urinalysis Findings | |||||||||||||
|---|---|---|---|---|---|---|---|---|---|---|---|---|---|
| Male | Female | ||||||||||||
| Parameter | Result | Grade | DOSAGE GROUP (mg/kg/day) | Parameter | Result | Grade | DOSAGE GROUP (mg/kg/day) | ||||||
| 0 | 500 | 1000 | 2000 | 0 | 500 | 1000 | 2000 | ||||||
| Glucose (mg/dL) | Negative | 5 | 5 | 5 | 5 | Glucose (mg/dL) | Negative | 5 | 5 | 5 | 5 | ||
| Bilirubin | Negative | 5 | 5 | 5 | 4 | Bilirubin | Negative | 5 | 5 | 5 | 4 | ||
| Small | 1 | 1 | Small | 1 | |||||||||
| Ketone body (mg/dL) | - | 3 | 2 | 2 | 1 | Ketone body (mg/dL) | - | 5 | 5 | 4 | 5 | ||
| +/− | 1 | 1 | 1 | 1 | 1 | +/− | 1 | 1 | |||||
| 1+ | 2 | 1 | 2 | 2 | 3 | 1+ | 2 | ||||||
| pH | 7 | pH | 7 | 1 | |||||||||
| 7.5 | 1 | 7.5 | 1 | 1 | |||||||||
| 8 | 2 | 1 | 8 | 2 | 4 | 1 | |||||||
| 8.5 | 3 | 5 | 5 | 3 | 4 | 8.5 | 3 | 1 | 4 | 3 | 4 | ||
| ≥9.0 | 4 | 2 | ≥9.0 | 4 | 1 | ||||||||
| Urobilinogen (Ehrlich unit/dL) | 0.2 | 5 | 5 | 5 | 4 | Urobilinogen (Ehrlich unit/dL) | 0.2 | 5 | 5 | 5 | 5 | ||
| 1 | 1 | 1 | 1 | 1 | |||||||||
| Occult blood | Negative | 3 | 3 | 2 | 3 | Occult blood | Negative | 5 | 5 | 5 | 5 | ||
| Trace | 1 | 2 | 2 | 1 | Trace | 1 | |||||||
| Small | 2 | 2 | 2 | Small | 2 | ||||||||
| Nutrient | Ingredient | Content |
|---|---|---|
| Proximate composition (%) | Moisture | 5.1 |
| Crude ash | 24.1 | |
| Crude protein | 16.7 | |
| Carbohydrate | 47.6 | |
| Total polyphenols | 8.79 mg/g | |
© 2018 by the authors. Licensee MDPI, Basel, Switzerland. This article is an open access article distributed under the terms and conditions of the Creative Commons Attribution (CC BY) license (http://creativecommons.org/licenses/by/4.0/).
Share and Cite
Choi, J.; Ryu, S.-J.; Kim, K.-J.; Kim, H.-M.; Chung, H.-C.; Lee, B.-Y. Single, 14-Day, and 13-Week Repeated Dose Toxicity Studies of Daily Oral Gelidium elegans Extract Administration to Rats. Molecules 2018, 23, 217. https://doi.org/10.3390/molecules23010217
Choi J, Ryu S-J, Kim K-J, Kim H-M, Chung H-C, Lee B-Y. Single, 14-Day, and 13-Week Repeated Dose Toxicity Studies of Daily Oral Gelidium elegans Extract Administration to Rats. Molecules. 2018; 23(1):217. https://doi.org/10.3390/molecules23010217
Chicago/Turabian StyleChoi, Jia, Su-Jung Ryu, Kui-Jin Kim, Hyung-Min Kim, Hee-Chul Chung, and Boo-Yong Lee. 2018. "Single, 14-Day, and 13-Week Repeated Dose Toxicity Studies of Daily Oral Gelidium elegans Extract Administration to Rats" Molecules 23, no. 1: 217. https://doi.org/10.3390/molecules23010217
APA StyleChoi, J., Ryu, S.-J., Kim, K.-J., Kim, H.-M., Chung, H.-C., & Lee, B.-Y. (2018). Single, 14-Day, and 13-Week Repeated Dose Toxicity Studies of Daily Oral Gelidium elegans Extract Administration to Rats. Molecules, 23(1), 217. https://doi.org/10.3390/molecules23010217