The Application of Quantitative 1H-NMR for the Determination of Orlistat in Tablets

State Key Laboratory for Bioactive Substances and Functions of Natural Medicines and Beijing Key Laboratory of New Drug Mechanisms and Pharmacological Evaluation Study, Institute of Materia Medica, Chinese Academy of Medical Sciences and Peking Union Medical College, No.1 Xiannongtan Street, Beijing 100050, China
*
Author to whom correspondence should be addressed.
Molecules 2017, 22(9), 1517; https://doi.org/10.3390/molecules22091517
Submission received: 7 August 2017
/
Revised: 7 September 2017
/
Accepted: 8 September 2017
/
Published: 10 September 2017
Abstract
:A quantitative nuclear magnetic resonance (qNMR) method to measure the content of Orlistat in tablets was studied and found to be efficient, accurate, reliable, and simple. In this paper, phloroglucinolanhydrous and dimethylsulfoxide-d6 (DMSO-d6) served as the internal standard and solvent, respectively. The qNMR methodology, including the linearity, range, the limit of detection (LOD) and quantification (LOQ), stability, precision, and accuracy, was validated seriatim, and the results were very favorable. The content determination results of three batches of Orlistat in tablets were almost identical upon comparing the qNMR method and the high-performance liquid chromatography (HPLC) method. The recommended method authentically compensated the deficiencies of the current HPLC method for determining Orlistat content, and proved to be a method complementary to traditional analysis for the purity measurement of Orlistat in some pharmaceutical preparations.
1. Introduction
First used to determine compound purity and drug content in 1963 [1,2], NMR has since gradually developed into a precise quantitative analysis method. Though it has a lower sensitivity relative to HPLC and mass spectrometry (MS) [3], the quantitative NMR (qNMR) method possesses distinctive advantages: (1) it can be conducted without analyte reference materials; (2) it can provide structural information and does not destroy the samples; (3) it can undertake multicomponent analysis in a mixture without pre-isolation; and (4) it requires a comparatively short time [4,5,6,7,8,9]. Nowadays, qNMR is mainly applied to identify and quantify drugs, biological metabolites, and natural products [10,11,12,13,14,15,16]. The basis of qNMR is the proportional relationship between the given integral resonance and the number of protons. Therefore, the drug content can be calculated with the integral values of the analyte and the internal standard in the same solution. To obtain accurate analysis results, the quantitative peaks and internal standard peaks should not exhibit interference with any other signals. There should also be better optimized spectral acquisition parameters.
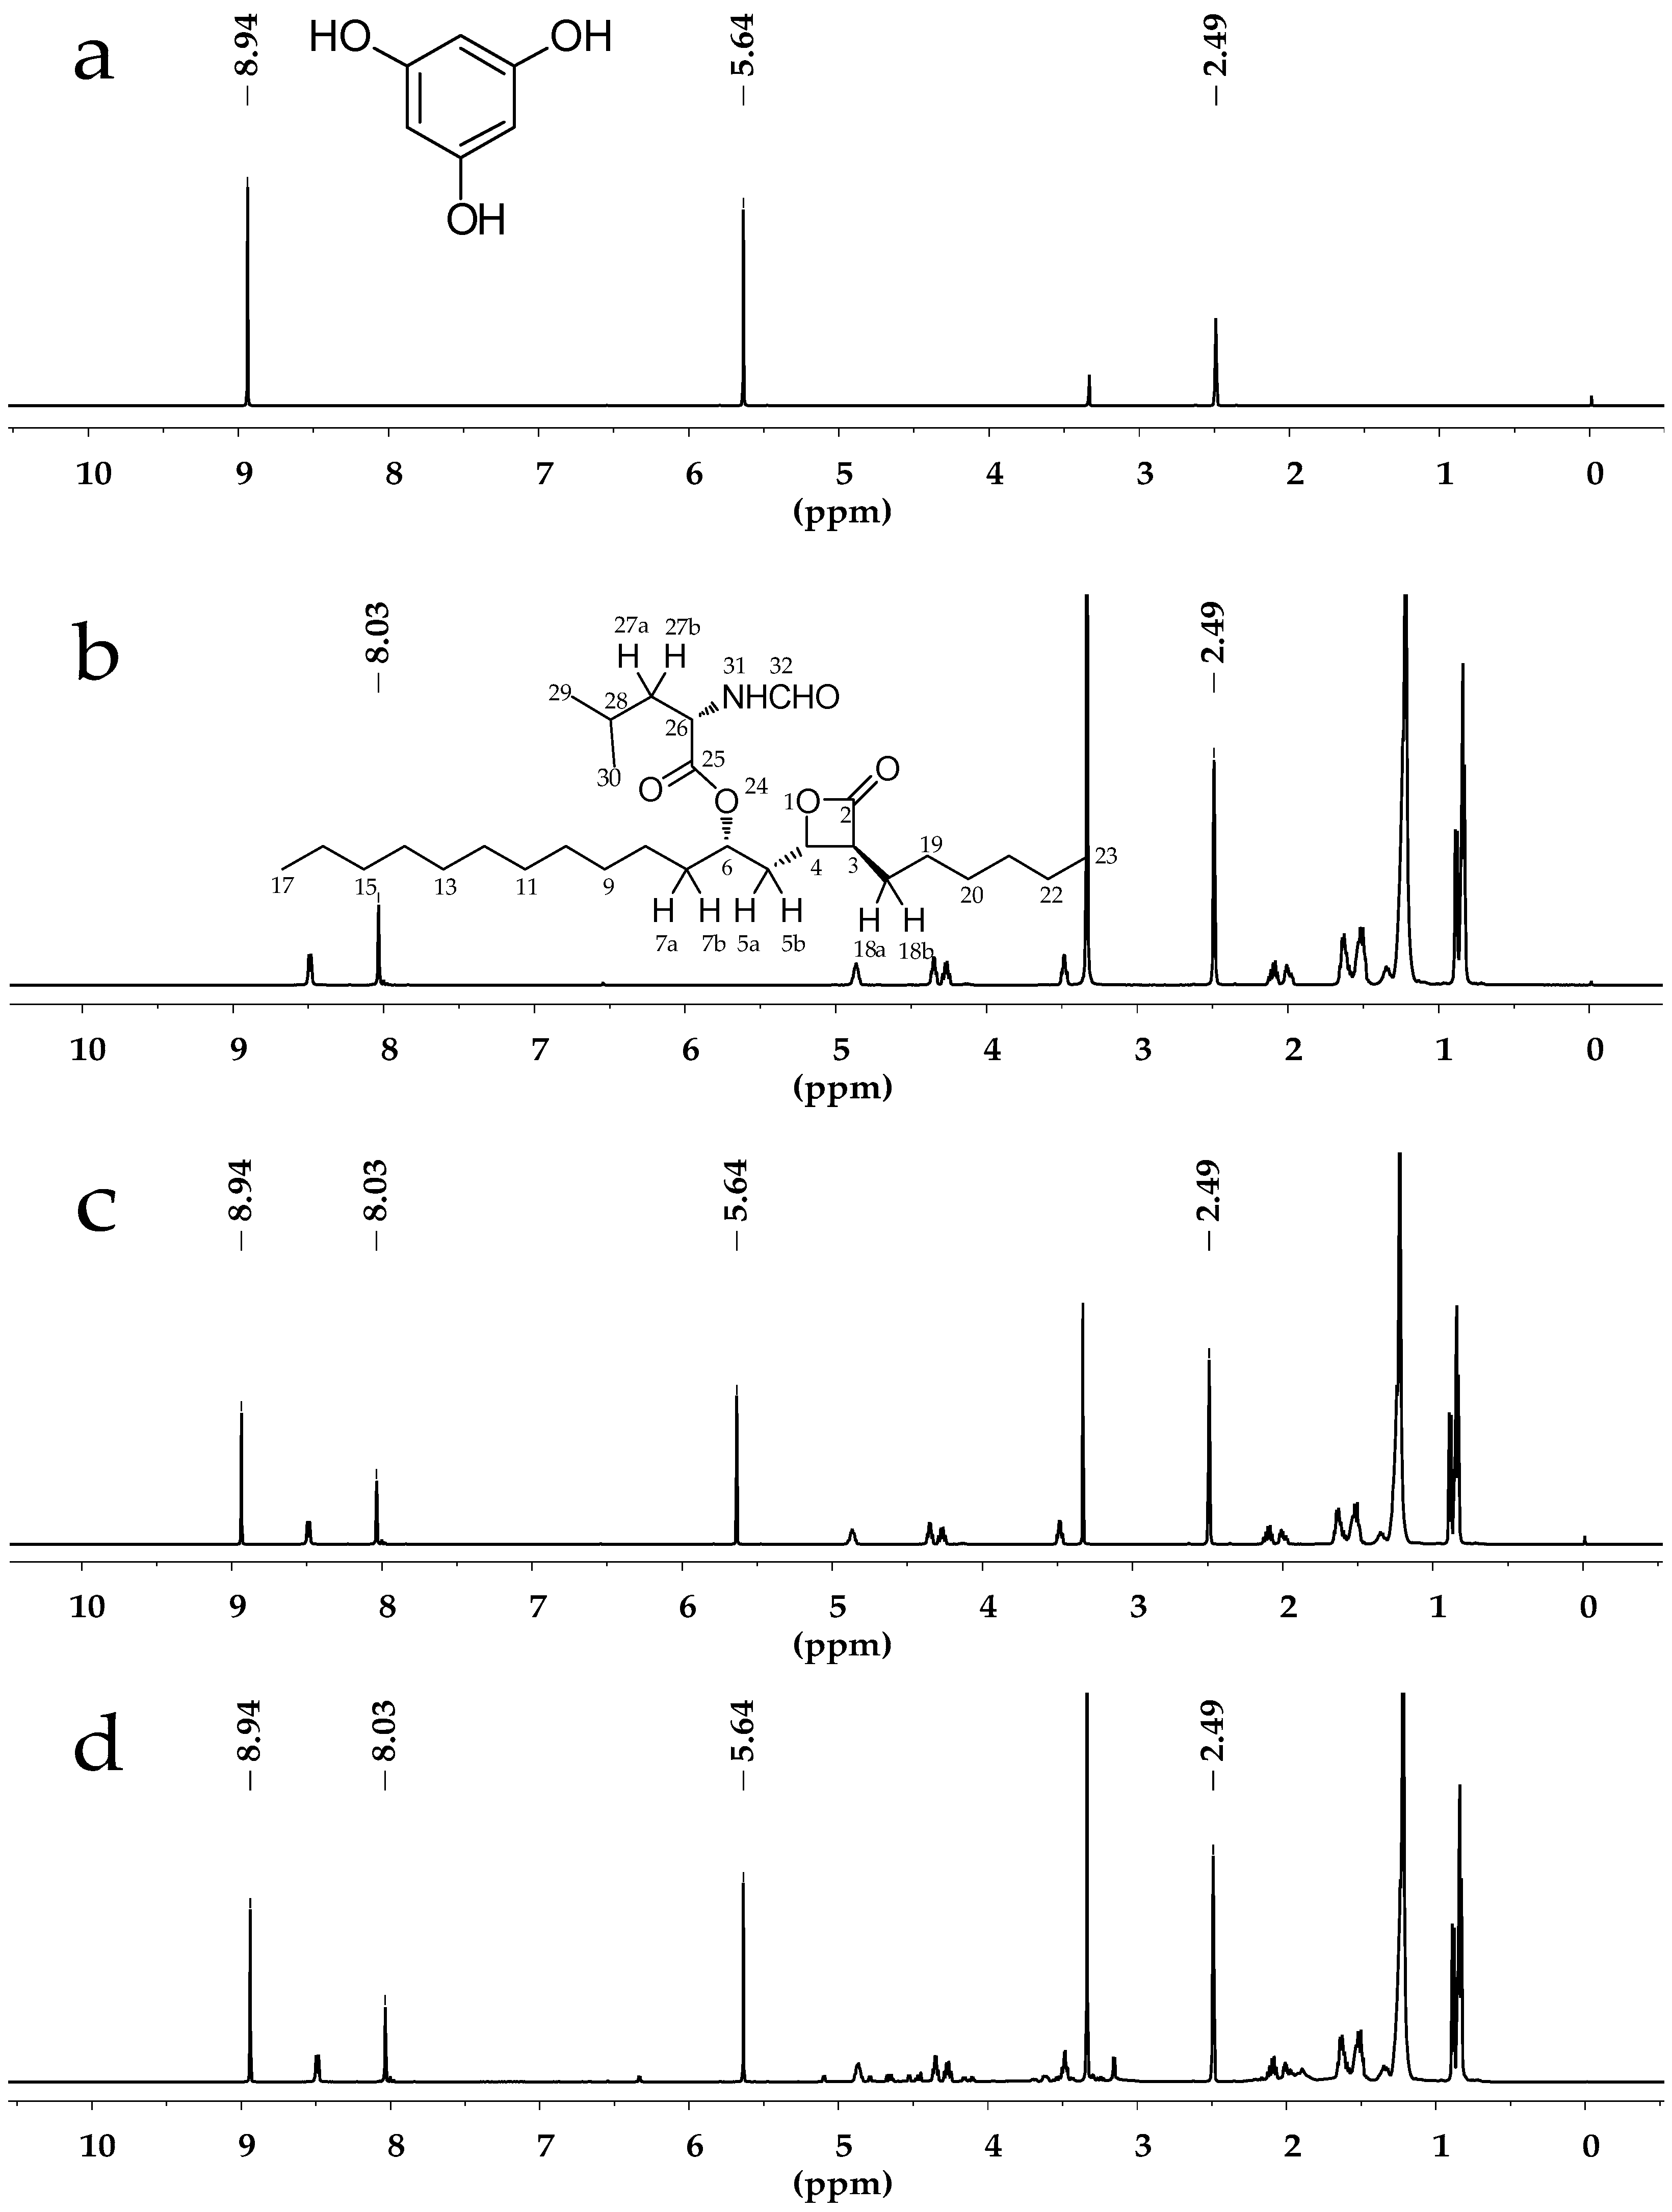
Orlistat,(S)-((S)-1-((2S,3S)-3-Hexyl-4-oxooxetan-2-yl)tridecan-2-yl)2-formamido-4-methylpentanoate, the structure of which is shown in Figure 1b, is a potent and long-lasting gastrointestinal tract lipase inhibitor that works by directly blocking the fat absorption into bodies. It is currently the sole over-the-counter (OTC) weight-loss drug in the world. The reported methods on Orlistat quantitative analysis in tablets, capsule, and functional foods have mainly been obtained through reversed phase high-performance liquid chromatography (RP-HPLC) [17], HPLC-MS [18], ultra-high-pressure liquid chromatography (UPLC) [19] and microwave-assisted extraction/high-performance liquid chromatography tandem mass spectrometry [20]. These methods not only need more analysis time and consume large quantities of mobile phase, but also require rigorous experimental conditions and imply complicated operational procedures. However, no research on qNMR used to determine Orlistat content has yet been reported.
This study found a specific, accurate, efficient, and feasible qNMR method to determine Orlistat content in tablets. Phloroglucinolanhydrous was selected as the internal standard to mix with Orlistat in dimethylsulfoxide-d6 (DMSO-d6). The practicability of the qNMR method was further verified by the consistent determination results of three batches of Orlistat tablets using the qNMR method and the HPLC method.
2. Results and Discussion
2.1. Selection of Deuterated Solvent
Several deuterated solvents were screened for the experiment. Chloroform-d1 was abandoned because its strong volatility, which made the solution volume variable, increased the difficulty in quantification. Deuterium oxide was excluded on account of its poor solubility for Orlistat (less than 1 mg/100 mL at 23 °C). Methanol-d4 was unsuitable because the signals of phenolic hydroxyl protons of phloroglucinolanhydrous did not appear. Acetone-d6 was eliminated due to the volatility and the close signal interference (shown in Supplementary Materials Figure S5). DMSO-d6 was an excellent solvent, as it ensured a good solubility of Orlistat in DMSO-d6 of about 19 mg/mL, and as the quantitative signals of Orlistat and phloroglucinolanhydrous in DMSO-d6 did not overlap with other signals. Moreover, DMSO-d6 does not volatilize at room temperature.
All displayed chemical shifts were calibrated relative to the signals of DMSO-d6 at 2.49 ppm. The quantitative proton of Orlistat was selected at 8.03 ppm (singlet, H-32) while quantitative protons of phloroglucinolanhydrous were selected at 5.64 ppm (singlet, Ph-H) and 8.94 ppm (singlet, OH). The NMR spectra are exhibited in Figure 1a,b. The solvent signals at 2.49 ppm did not interfere with the analyte signal at 8.03 ppm or the internal standard signals at 5.64 and 8.94 ppm.
2.2. Determination of Relaxation Time
The main influencing factor in qNMR is the relaxation time, which depends on the longitudinal relaxation time (T1) of all signals during the acquisition. T1 is calculated with the following Equation (1):
Mz and M0 belong to the magnetizations along the z-axis. Spin-lattice relaxation occurs and reaches a thermal equilibrium after the repetition time (τ) [9]. τ should not be less than five times the T1 to ensure a reliable experimental data [21].
In this work, the inversion recovery pulse sequence experiment was used to determine the T1 of all the protons in the mixture solution of Orlistat (9.028 mg/mL) and phloroglucinolanhydrous (1.019 mg/mL). The relaxation delay used for the inversion recovery experiments was 32 s. The T1 of Orlistat at 8.03 ppm was 1.7 s and the T1 of phloroglucinolanhydrous at 5.64 and 8.94 ppm was 2.2 s and 1.5 s, respectively. According to the preceding standpoint, the relaxation delay of 32s was enough to ensure absolutely T1 relaxation between any two neighbor pulses.
2.3. Validation
2.3.1. Specificity and Selectivity
The specificity and selectivity were to estimate the possible interference from sample solutions. According to the solution preparation processes, a specificity study was carried out through analyzing DMSO-d6, phloroglucinolanhydrous, Orlistat standard solution, and the sample solution individually. 1H-NMR spectra are presented in Figure 1. It was clear that the solvent and ingredients did not affect signals at δ 8.03, 5.64 and 8.94 ppm after the extraction. Moreover, the three integrated signals did not overlap each other. The spectra revealed a satisfying specificity and selectivity of the qNMR method for Orlistat determination.
2.3.2. Linearity and Range
Linearity was assessed by measuring six different concentration solutions of Orlistat in the range (w/w) of 1.075, 3.076, 6.039, 9.079, 11.765, 16.971. The calibration curves are presented below with the ratio of the mass as the x-axis and integral values as the y-axis. The correlation coefficients of quantitative protons at 5.64 ppm in Linear Equation (2) and 8.94 ppm in Linear Equation (3) were 0.99996 and 0.99997, respectively. The regression results showed a perfect linearity of the qNMR method.
2.3.3. Accuracy
The accuracy of qNMR was evaluated by the recovery test, in which a known quantity of Orlistat (at 80%, 100%, and 120%, respectively) was added into the tablet powder after extraction. The accuracy was calculated with Equation (4), shown below. The average recoveries were 99.83% and 99.45% with the relative standard deviations (RSDs) of 1.46% and 1.50%, respectively. Table 1 suggests that the qNMR method could provide an ideal accuracy for Orlistat determination.
mx is the obtained weight of Orlistat, m0 is the Orlistat weight in tablets, and ms is the weight of the added standard Orlistat.
2.3.4. Precision
Good or poor precision was expressed by the RSD of repeatability and intra-day precision. The repeatability was tested using three different concentration solutions in triplicate, and the intra-day precision was tested with the Orlistat concentration at 8.246 mg/mL on different days. The RSDs for both repeatability and intra-day precision, shown in Table 2, were less than 1%, which satisfied the requirement of the Chinese Pharmacopoeia.
2.3.5. Stability
The stability further showed whether there was significant variation after the initial solution was stored for a period of time. The stability of Orlistat solution at a concentration of 8.316 mg/mLwas assessed by comparing the amount of Orlistat present in the initial sample versus the sample stored for 0, 6, 12, 24, 48, and 72 h at room temperature, as shown in Table 3. The RSDs were 0.19% and 0.14% for δ 5.64 and 8.94 ppm, respectively, which indicated that the Orlistat solution was adequately stable during the testing period.
2.3.6. Limit of Detection (LOD) and Limit of Quantification (LOQ)
The concentration was defined as LOD when the signal-to-noise ratio (S/N) of quantitive signals reached 3:1 or 2:1. Similarly, it was defined as LOQ when the S/N was 10:1. This study found that the LOD for Orlistat in DMSO-d6 was about 0.004 mg/mL (S/N was 2.98:1) and the LOQ was 0.014 mg/mL (S/N was 9.71:1).
2.3.7. Robustness
Robustness refers to the effect of experimental results caused by the variations of acquisition parameters. The robustness assessment of this study was based on the difference analysis from the single variable test of the following acquisition parameters: the number of scans, the relaxation delay, the pulse width, the data points, spectral width, the acquisition time, and selected different integrated protons. The Orlistat content (about 8.246 mg/mL) measured with optimal parameters was 100.46% and 99.67% at δ 5.64 and 8.94 ppm, respectively. Robustness results are exhibited in Table 4. The maximum difference of 0.57% illustrated that these parameters did not significantly alter the results in comparison to the optimized state.
2.4. Assay of Orlistat in Tablets
The proposed method was exploited to determine Orlistat content in three batches of tablets, and the qNMR results were compared with the HPLC results. The average values of %label claim (n = 3) and RSD% are listed in Table 5. The determination results at 5.64 ppm were higher than those at 8.94 ppm, perhaps due to the difference between the T1 of the two protons. The determined contents using the qNMR and HPLC methods were almost identical, which indicated that qNMR could develop into a method for purity determination parallel to the conventional methods.
3. Materials and Methods
3.1. Materials
The Orlistat reference material 99.3% (standard for HPLC) was bought from National Institutes for Food and Drug Control (Batch No.: 520027-201401). The commercial Orlistat tablets were bought from ZHE JIANG HISUN PHARMACEUTICAL CO., LTD. (Zhejiang, China; Batch No. 15082101, 0.12 g; Batch No. 21606151, 0.12 g; and Batch No. 21605111, 0.12 g). The 99.0% phloroglucinolanhydrous was obtained from TCI (Shanghai, China) Development Co., Ltd. (Shanghai, China; CN NO.: 61727; Lot. JAM8I-EN, 25 g). Deuterated solvent (DMSO-d6, 99.9%) was bought from Sigma-Aldrich Co., (Louis, MO, USA). Methanol (HPLC Grade) was bought from Fisher Scientific (Fair Lawn, NJ, USA). The Wahaha water (596 mL, Batch No.: 52157W) was bought from the Wahaha Group Co., Ltd. (Tianjin, China).
3.2. Instruments
All NMR data were obtained with a Bruker Spectrometer (AV-III-500, Burlingame, CA, USA) equipped with Cryoprobes (5 mm CPPTCI 1H/19F-13C/15N/D z-GRD z135420/0004) at 500.06 MHz proton frequency. All the solid substances were weighed with METTLER TOLEDO XP2U (0.0001 mg, Greifensee, Switzerland).
HPLC was performed on a Shimadzu Prominence LC-20A liquid chromatography system with an SPD-M20A prominence diode array detector and Inertsil ODS-3 (5 μm, 4.6 mm × 250 mm, Shimadzu Co., Kyoto, Japan).
3.3. Test Solutions Preparation
3.3.1. Standard Solution Preparation for qNMR
A moderate amount of Orlistat reference material (about 1, 3, 6, 9, 12, and 18 mg) and phloroglucinolanhydrous (about 1 mg) were accurately weighed and transferred into a stoppered tube, and then 1 mL of DMSO-d6 was added to fully dissolve the two materials with the ultrasound. The transparent liquid was transferred into a 5-mm NMR tube, and then the data acquisition was carried out. Each concentration solution was prepared in triplicate.
3.3.2. Tablet Powder Solution Preparation for qNMR
Ten commercial Orlistat tablets were weighed and powdered in a mortar. Then, proper Orlistat tablet powder (equivalent to Orlistat 10 mg) was weighed and extracted three times by chloroform. When the chloroform fully volatilized at room temperature, the next step was performed similarly to that described in Section 3.3.1.
3.3.3. Sample Solution Preparation for HPLC
The Orlistat reference material (about 1 mg) was weighed accurately and fully dissolved in 2 mL of methanol. Then, it was filtered into a vial for HPLC analysis with 0.45 μm Nylon membrane. This solution was used as the standard solution. The Orlistat tablet powder (equivalent to Orlistat 1 mg) was prepared using the same method.
3.4. Data Acquisition and Processing
The optimal experiment parameters for 1H-NMR spectra at 298.0 K are listed below: pulse angle 90°, pulse width 8.00 μs, data points 64 K, number of scans 32, relaxation delay 32 s (five times as much as T1 to ensure full relaxation), acquisition time (AQ) 3.277 s, and spectral width (SW) 20.00 ppm.
For all 1H-NMR obtained spectra, the manual corrections of the phase and baseline were essential to ensure correct, accurate, and repeatable integrations of the typical quantitative peaks and internal standard peaks. To satisfy the statistic, each spectrum was manually integrated five times and the average value was used for calculation.
For HPLC, the mobile phase consisted of methanol and 1‰ formic acid aqueous solution with a constant-gradient ratio of 92:8. The chromatographic condition included a temperature of 30 °C, flow rate of 1.5 mL/min, injection volume of 20 μL, and ultraviolet (UV) detection at 210 nm.
3.5. Content Calculation
As has been reported in the literature, the fundamental principle of qNMR is that the NMR signals intensity (I) has a direct ratio relation with the number of nuclei (n) [8,9], as the following Equation (5) describes:
Ks is an unknown constant to all proton signals in the same 1H-NMR spectrum because they are running the same single-pulse. Although different signals contain different numbers of nuclei, their relationship can be described by Equation (6):
The the percentage of Orlistat accounting for tablets label claim can be calculated by Equation (7):
%LC is the percentage of Orlistat accounting for tablets label claim. Ix and Istd indicate the integrated value of Orlistat and phloroglucinolanhydrous. Nx and Nstd define the number of protons contained in the quantitative signals of Orlistat and phloroglucinolanhydrous. Mx and Mstd correspond to the molecular weight of Orlistat and phloroglucinolanhydrous. mpowder and mstd denote the mass of Orlistat tablet powder and phloroglucinolanhydrous. T is the average tablet weight; and L is the labeled amount of Orlistat in the tablets. Pstd represents the purity of phloroglucinolanhydrous.
4. Conclusions
A practicable and reliable qNMR method was developed and evaluated to measure the content of Orlistat in tablets. The content determination results of qNMR were consistent with HPLC, and proved that qNMR was a specific, accurate, precise, simple, and repeatable method for Orlistat content determination. The proposed qNMR method authentically perfected the determination analysis method of Orlistat, which is currently mainly measured by HPLC. The qNMR method is simpler in multicomponent sample preparation, faster in sample analysis, less rigorous in experimental conditions, and better in repeatability compared with HPLC. The most vital advantage of the qNMR method over traditional analytical methods is that it can achieve precise quantification without analyte reference materials; thus, the qNMR method makes it possible for medicine and compounds that lack reference materials to be absolutely quantified. The content determination results of Orlistat tablets was almost identical when comparing the qNMR method and HPLC method, which indicates that the qNMR method could be used in a complementary manner to the traditional analysis method for the purity measurement of Orlistat in some pharmaceutical preparations.
Supplementary Materials
The following are available online, Figure S1: 1H-NMR spectrum of Orlistat in DMSO-d6 (500 MHz), Figure S2: COSY-NMR spectrum of Orlistat in DMSO-d6 (500 MHz), Figure S3: TOCSY-NMR spectrum of Orlistat in DMSO-d6 (500 MHz), Figure S4: ROESY-NMR spectrum of Orlistat in DMSO-d6 (500 MHz), Figure S5: 1H-NMR spectrum of Orlistat and Phloroglucinol Anhydrous in different deuterated solvents, Table S1:The assignment of 1H-NMR data of the Orlistat in DMSO-d6, Table S2: The integral values of different experiments.
Acknowledgments
The financial support of this work was National Key Technology Program during the Thirteenth Five-year Plan Period (2017ZX09101003-002-004).
Author Contributions
Shanshan Sun and Yinghong Wang conceived and designed the experiments; Shanshan Sun and MengxiaJin performed the experiments; Shanshan Sun, XiangjuJin and Hongyue Liu analyzed the data; Xia Zhou and Jinghua Ni contributed materials; Shanshan Sun wrote the paper.
Conflicts of Interest
The authors declare that they have no conflict of interest.
References
- Jungnickel, J.L.; Forbes, J.W. Quantitative measurement of hydrogen types by integrated nuclear magnetic resonance intensities. Anal. Chem. 1963, 35, 938–942. [Google Scholar] [CrossRef]
- Hollis, D.P. Quantitative analysis of aspirin, phenacetin and caffeine mixtures by nuclear magnetic resonance spectrometry. Anal. Chem. 1963, 35, 1682–1684. [Google Scholar] [CrossRef]
- Simmler, C.; Napolitano, J.G.; McAlpine, J.B.; Chen, S.N.; Pauli, G.F. Universal quantitative NMR analysis of complex natural samples. Curr. Opin. Biotechnol. 2014, 25, 51–59. [Google Scholar] [CrossRef] [PubMed]
- Saito, T.; Nakaie, S.; Kinoshita, M.; Ihara, T.; Kinugasa, S.; Nomura, A.; Meada, T. Practical guide for accurate quantitative solution state NMR analysis. Metrologia 2004, 41, 213–218. [Google Scholar] [CrossRef]
- Farrant, R.D.; Hollerton, J.C.; Lynn, S.M.; Provera, S.; Sidebottom, P.J.; Upton, R.J. NMR quantification using an artificial signal. Magn. Reson. Chem. 2010, 48, 753–762. [Google Scholar] [CrossRef] [PubMed]
- Pauli, G.F.; Godecke, T.; Jaki, B.U.; Lankin, D.C. Quantitative 1H-NMR. Development and potential of an analytical method: An update. J. Nat. Prod. 2012, 75, 834–851. [Google Scholar] [CrossRef] [PubMed]
- Pinciroli, V.; Biancardi, R.; Visentin, G.; Rizzo, V. The well-characterized synthetic molecule: A role for quantitative 1H-NMR. Org. Process. Res. Dev. 2004, 8, 381–384. [Google Scholar] [CrossRef]
- Sahu, A.; Narayanam, M.; Kurmi, M.; Ladumor, M.K.; Singh, S. Quantitation of memantine hydrochloride bulk drug and its tablet formulation using proton nuclear magnetic resonance spectrometry. Magn. Reson. Chem. 2016, 54, 632–636. [Google Scholar] [CrossRef] [PubMed]
- Liang, X.R.; Du, L.P.; Su, F.; Parekh, H.S.; Su, W.K. The application of quantitative NMR for the facile, rapid and reliable determination of clindamycin phosphate in a conventional tablet formulation. Magn. Reson. Chem. 2014, 52, 178–182. [Google Scholar] [CrossRef] [PubMed]
- Yang, Q.Y.; Qiu, H.; Guo, W.; Wang, D.M.; Zhou, X.N.; Xue, D.; Zhang, J.L.; Wu, S.; Wang, Y.H. Quantitative 1H-NMR method for the determination of tadalafil in bulk drugs and its tablets. Molecules 2015, 20, 12114–12124. [Google Scholar] [CrossRef] [PubMed]
- Jiang, C.Y.; Yang, K.M.; Yang, L.; Miao, Z.X.; Wang, Y.H.; Zhu, H.B. A 1H-NMR-based metabonomic investigation of time-related metabolic trajectories of the plasma, urine and liver extracts of Hyperlipidemic Hamsters. PLoS ONE 2013, 8, e66786. [Google Scholar] [CrossRef] [PubMed]
- Salem, A.A.; Mossa, H.A. Method validation and determination of levofloxacin, metronidazole and sulfamethoxazole in an aqueous pharmaceutical, urine and blood plasma samples using quantitative nuclear magnetic resonance spectrometry. Talanta 2012, 88, 104–114. [Google Scholar] [CrossRef] [PubMed]
- Garrido, R.; Puyada, A.; Fernandez, A.; Gonzalez, M.; Ramirez, U.; Cardoso, F.; Valdes, Y.; Gonzalez, D.; Fernandez, V.; Verez, V.; et al. Quantitative proton nuclear magnetic resonance evaluation and total assignment of the capsular polysaccharide Neisseria meningitides serogroup X. J. Pharm. Biomed. Anal. 2012, 70, 295–300. [Google Scholar] [CrossRef] [PubMed]
- Staneva, J.; Denkova, P.; Todorova, M.; Evstatieva, L. Quantitative analysis of sesquiterpene lactones in extract of Arnica montana L. by 1H-NMR spectroscopy. J. Pharm. Biomed. Anal. 2011, 54, 94–99. [Google Scholar] [CrossRef] [PubMed]
- Goger, N.G.; Parlatan, H.K.; Basan, H.; Berkkan, A.; Ozden, T. Quantitative determination of azathioprine in tablets by 1H-NMR spectroscopy. J. Pharm. Biomed. Anal. 1999, 21, 685–689. [Google Scholar] [CrossRef]
- Zoppi, A.; Linares, M.; Longhi, M. Quantitative analysis of enalapril by 1H-NMR spectroscopy in tablets. J. Pharm. Biomed. Anal. 2005, 37, 627–630. [Google Scholar] [CrossRef] [PubMed]
- Liu, J.; Zhao, Z.Q.; Wang, M.; Bai, X.D.; Liu, M.T.; Chen, Y.; Liu, J. Content determination of orlistat tablet by RP-HPLC method. Prog. Mod. Biomed. 2010, 10, 4360–4362. [Google Scholar]
- Xiao, S.; Zhu, X.L.; Chen, B.; Yao, S.Z. Determination of orlistat in Capsules by HPLC/MS. Chin. J. Pharm. Anal. 2005, 25, 1055–1057. [Google Scholar]
- Xu, Y.H.; Peng, W.; Tang, B.X.; Wang, D.G.; Liu, D.F. Purification of Orlistat by preparative HPLC and its determination by UPLC. Chin. J. Pharm. 2012, 43, 690–692. [Google Scholar]
- Ma, W.; Fu, L.; Wang, H.B.; Chen, W.; Wang, X.J.; Yu, J.; Tang, Y.Z. Determination of illegal drug orlistat added in the weight-loss functional foods by Microwave Assisted Extraction/High Performance Liquid Chromatography tandem Mass Spectrometry. J. Instrum. Anal. 2009, 28, 1045–1048. [Google Scholar]
- Holzgrabe, U. Quantitative NMR spectroscopy in pharmaceutical applications. Prog. Nucl. Magn. Reson. Spectrosc. 2010, 57, 229–240. [Google Scholar] [CrossRef] [PubMed]
Sample Availability: Samples of the compounds Orlistat and Phloroglucinol Anhydrous are available from the authors. |
Figure 1.
(a) 1H-NMR spectrum of phloroglucinolanhydrous in dimethylsulfoxide-d6 (DMSO-d6); (b) 1H-NMR spectrum of Orlistat in DMSO-d6; (c) 1H-NMR spectrum of Orlistat and phloroglucinolanhydrous in DMSO-d6; (d) 1H-NMR spectrum of Orlistat tablet powder extractive and phloroglucinolanhydrous in DMSO-d6.

Table 1.
Recovery test results of Orlistat purity determination.
| No. | Orlistat | Recovery (%) | ||||
|---|---|---|---|---|---|---|
| m0 (mg) | ms (mg) | mx (mg) | ||||
| δ*5.64 | δ*8.94 | δ*5.64 | δ*8.94 | |||
| 1 | 2.302 | 1.795 | 4.096 | 4.091 | 99.94 | 99.68 |
| 2 | 2.238 | 1.943 | 4.136 | 4.136 | 97.71 | 97.71 |
| 3 | 2.295 | 1.875 | 4.170 | 4.154 | 100.03 | 99.19 |
| 4 | 2.259 | 2.197 | 4.442 | 4.442 | 99.35 | 99.39 |
| 5 | 2.311 | 2.271 | 4.556 | 4.527 | 98.85 | 97.57 |
| 6 | 2.248 | 2.295 | 4.507 | 4.497 | 98.43 | 97.97 |
| 7 | 2.099 | 2.768 | 4.873 | 4.896 | 100.20 | 101.02 |
| 8 | 2.229 | 2.853 | 5.136 | 5.114 | 101.89 | 101.13 |
| 9 | 2.213 | 2.821 | 5.093 | 5.073 | 102.07 | 101.36 |
| Average value | / | / | / | / | 99.83 | 99.45 |
| RSD% | / | / | / | / | 1.46 | 1.50 |
δ* in ppm; /: blank cell; RSD: relative standard deviations; mx: obtained weight of Orlistat; m0: weight of Orlistat in tablets; ms: weight of added standard Orlistat.
Table 2.
Precision and repeatability results of Orlistat purity determination.
| No. | mstd (mg) | mx (mg) | Px (%) | ||
|---|---|---|---|---|---|
| δ*5.64 | δ*8.94 | ||||
| Repeatability | 1 | 1.119 | 6.042 | 98.91 | 99.16 |
| 2 | 1.068 | 6.024 | 99.09 | 98.14 | |
| 3 | 1.072 | 6.050 | 98.83 | 97.87 | |
| 4 | 1.122 | 9.343 | 98.64 | 99.25 | |
| 5 | 1.092 | 9.060 | 98.96 | 98.53 | |
| 6 | 1.067 | 8.833 | 98.11 | 97.10 | |
| 7 | 1.078 | 11.164 | 98.49 | 97.83 | |
| 8 | 1.055 | 12.930 | 99.08 | 98.16 | |
| 9 | 1.118 | 11.200 | 98.65 | 97.82 | |
| Average value | / | / | 98.75 | 98.21 | |
| RSD % | / | / | 0.32 | 0.70 | |
| Inter-day precision | 1 | / | / | 100.40 | 99.65 |
| 2 | 100.46 | 99.68 | |||
| 3 | 100.43 | 99.62 | |||
| 4 | 100.35 | 99.61 | |||
| 5 | 100.20 | 99.32 | |||
| 6 | 100.10 | 99.49 | |||
| Average value | / | / | 100.32 | 99.56 | |
| RSD % | / | / | 0.14 | 0.14 | |
δ* in ppm; /: blank cell; mstd: weight of phloroglucinolanhydrous; mx: weight of Orlistat; Px: purity of Orlistat.
Table 3.
Stability results of Orlistat purity determination.
| Time (h) | δ*5.64 | δ*8.94 | ||
|---|---|---|---|---|
| Assay (%) | Diff (%) | Assay (%) | Diff (%) | |
| 0 | 100.30 | / | 99.53 | / |
| 6 | 100.14 | 0.16 | 99.37 | 0.16 |
| 12 | 100.07 | 0.23 | 99.26 | 0.28 |
| 24 | 100.01 | 0.29 | 99.23 | 0.31 |
| 48 | 99.90 | 0.40 | 99.24 | 0.30 |
| 72 | 99.74 | 0.60 | 99.12 | 0.41 |
| Average value | 100.03 | / | 99.30 | / |
| RSD % | 0.19 | / | 0.14 | / |
δ* in ppm; /: blank cell.
Table 4.
Robustness results of Orlistat purity determination.
| Parameters (Target Value) | Change | δ*5.64 | δ*8.94 | ||
|---|---|---|---|---|---|
| Assay (%) | Diff (%) | Assay (%) | Diff (%) | ||
| Number of scans (32) | 16 | 100.11 | 0.35 | 99.39 | 0.28 |
| 48 | 100.05 | 0.41 | 99.33 | 0.34 | |
| Relaxation delay (32 s) | 24 | 100.08 | 0.38 | 99.36 | 0.31 |
| 40 | 99.98 | 0.47 | 99.37 | 0.30 | |
| Acquisition time (3.277 s) | 2.277 | 100.13 | 0.33 | 99.55 | 0.12 |
| 4.277 | 100.21 | 0.25 | 99.51 | 0.16 | |
| Data points (64 K) | 32 | 100.03 | 0.43 | 99.43 | 0.25 |
| 128 | 99.93 | 0.53 | 99.44 | 0.23 | |
| Spectral width (20 ppm) | 15 | 99.89 | 0.57 | 99.35 | 0.32 |
| 25 | 99.91 | 0.55 | 99.36 | 0.31 | |
| P1 (8.00 μsec) | 7.00 | 99.95 | 0.51 | 99.30 | 0.35 |
| 9.00 | 99.96 | 0.50 | 99.40 | 0.27 | |
δ* in ppm.
Table 5.
The determination results of Orlistat by qNMR and HPLC.
| Batch No. | qNMR (n = 3) | HPLC | |||
|---|---|---|---|---|---|
| δ | % Label Claim | RSD% | % Label Claim | RSD% | |
| 15082101 | 5.64 | 100.65 | 0.38 | 99.71 | 0.61 |
| 8.94 | 99.99 | 0.34 | |||
| 21606151 | 5.64 | 98.58 | 1.11 | 96.75 | 0.85 |
| 8.94 | 99.03 | 0.86 | |||
| 21605111 | 5.64 | 98.75 | 0.33 | 97.87 | 1.20 |
| 8.94 | 97.42 | 0.51 | |||
*δ in ppm.
© 2017 by the authors. Licensee MDPI, Basel, Switzerland. This article is an open access article distributed under the terms and conditions of the Creative Commons Attribution (CC BY) license (http://creativecommons.org/licenses/by/4.0/).
Share and Cite
MDPI and ACS Style
Sun, S.; Jin, M.; Zhou, X.; Ni, J.; Jin, X.; Liu, H.; Wang, Y. The Application of Quantitative 1H-NMR for the Determination of Orlistat in Tablets. Molecules 2017, 22, 1517. https://doi.org/10.3390/molecules22091517
AMA Style
Sun S, Jin M, Zhou X, Ni J, Jin X, Liu H, Wang Y. The Application of Quantitative 1H-NMR for the Determination of Orlistat in Tablets. Molecules. 2017; 22(9):1517. https://doi.org/10.3390/molecules22091517
Chicago/Turabian StyleSun, Shanshan, Mengxia Jin, Xia Zhou, Jinghua Ni, Xiangju Jin, Hongyue Liu, and Yinghong Wang. 2017. "The Application of Quantitative 1H-NMR for the Determination of Orlistat in Tablets" Molecules 22, no. 9: 1517. https://doi.org/10.3390/molecules22091517