Article

Investigation of the Effect of the Degree of Processing of Radix Rehmanniae Preparata (Shu Dihuang) on Shu Dihuangtan Carbonization Preparation Technology

1
Department of Herbology, College of Korean Medicine, Dongguk University, 38066 Gyeongju, Korea
2
Institute of Pharmaceutical & Food Engineering and College of Chinese Materia Medica, Shanxi University of Chinese Medicine, Jinzhong 030619, Shanxi, China
*
Author to whom correspondence should be addressed.
These authors contributed equally to this work.
Molecules 2017, 22(7), 1193; https://doi.org/10.3390/molecules22071193
Submission received: 15 June 2017 / Revised: 13 July 2017 / Accepted: 13 July 2017 / Published: 18 July 2017

Abstract

:
Carbonization of Radix Rehmanniae Preparata (Shu Dihuangtan) via stir-frying could increase its homeostasis maintaining and antidiarrheal effects. To ensure these pharmacological functions, the quality of the raw material (processed Rehmanniae Radix) must be well controlled. Therefore, we analyzed the effects of different degrees of processing and adjuvants on processed Rehmanniae Radix (Shu Dihuang) by High Performance Liquid Chromatography (HPLC) chromatographic fingerprints, thermal gravimetric analysis and Fourier transform infrared spectroscopy (FTIR). Based on the results from HPLC fingerprints combined with similarity analysis (SA) and hierarchical cluster analysis (HCA) the optimum processing method for Shu Dihuang was five cycles of steaming and polishing, which follows the ancient processing theory. The intensity of thermal weight loss rate peaked near 210.33 ± 4.32 °C or 211.33 ± 2.62 °C, which was an important indicator for the degree of processing of Shu Dihuang. A temperature near 290.89 ± 2.51 °C was the upper limit for carbonizing Shu Dihuangtan. FTIR spectroscopy analysis showed that the overall chemical composition of Shu Dihuangtan was affected by both the degree of processing and adjuvant, which are very important for its quality.

1. Introduction

Chinese medicinal herb preparation is an integral and important part of the Chinese medicine heritage, which has played an important role in the prevention and cure of diseases in China for thousands of years. Chinese herbal medicines need to be processed using different methods before being used, according to the state of an illness and the actual clinical need, in order to give full play to their disease preventive and curative effects, to overcome adverse reactions and guarantee their safety and effectiveness.
Rehmanniae Radix (Dihuang in Chinese), which is derived from the root of Rehmannia glutinosa Libosch, has long been used in traditional Chinese medicine (TCM). It was first reported in the Canon on Medicinal Herbs by Divine Ploughman (ca. 200 B.C.) from Shen-nong Bencao Jing [1]. It is classified as a high-grade (very safe) medicine. In traditional Chinese medicine, based on the processing methods, there are two types of Rehmanniae Radix that are frequently used in clinical prescriptions, raw Rehmanniae Radix (Sheng Dihuang) and Radix Rehmanniae Preparata (Shu Dihuang). Sheng Dihuang is obtained by drying the fresh root of R. glutinosa. It is known to be able to “reduce the heat in blood, nourish yin and promote the production of body fluids”, and thereby is used for treating maculation, nosebleeds, rash, and skin eruptions. In contrast, Shu Dihuang is prepared by steaming or braising the raw Rehmanniae Radix with yellow rice wine (or not). It can “nourish yin and replenish blood, thus reinforcing essence and marrow”, and is thus used for treating anemia, diabetes, dizziness, tinnitus, nocturnal emission and palpitations [2,3]. The preparation method of Shu Dihuang is very controversial because of the inconsistency between different heating methods (steaming or braising, cycles and time) and processing adjuvants (yellow rice wine or none). The old approach, “steaming and drying for several cycles (generally nine times)”, has been regarded as the golden standard method according to the ancient processing theory.
Carbonization by stir-frying is a common and important method for processing traditional Chinese medicinal materials, and the herbs’ homeostasis maintaining and antidiarrheal effects are more remarkable after being processed in this way [4]. The carbonization of Radix Rehmanniae Preparata (Shu Dihuangtan) is accomplished through stir-frying or calcining. However, there’s no consistent conclusion on which processing technology works the best, and there are also no related reports comparing different processing methods and their effects on Shu Dihuangtan’s pharmacological actions. This lack of comparative studies has hindered the optimization of processing technology and the improvement of Shu Dihuangtan quality.
Thermal analysis [5] is a groups of techniques used to measure the physical properties of materials as they change with temperature and time when subjected to a programmed heating process. It includes thermal gravimetry (TG), derivative thermogravimetry (DTG), differential thermal analysis (DTA), thermo-mechanical analysis (TMA), dynamic mechanical analysis (DMA), and combined use of thermal gravimetry with mass spectrometry (MS), Fourier transform infrared spectroscopy (FTIR), or gas chromatography (GC). In recent years, these technologies have been progressively applied to traditional Chinese medicine studies, such as thermal analysis of chemical compositions [6] and decomposition [7], identification of product origin [8] or relatives [9], etc. We have applied these techniques to streamline the processing of traditional Chinese medicines. Previously, we used TG/DTG methods to simulate the processing procedure of Zushima, in order to qualitatively demonstrate the overall compositional changes [10,11], and also analyzed the effects of pyrolysis in an inert Ar atmosphere on the preparation of gallic acid, rhubarb, mudan and burnet [12]. We also calculated the energy dynamics during the stir-frying process based on the data obtained from thermal analysis techniques [13]. These applications have greatly enhanced our experimental and theoretical understanding of the processing procedures of traditional Chinese medicines.
In this study, we compared the HPLC fingerprints of Shu Dihuang samples prepared with different degrees of processing and adjuvants, and classified the fingerprint data using several chemometrics methods, such as similarity analysis (SA) and hierarchical cluster analysis (HCA). According to the statistical results and chromatographic fingerprints, we identified the peaks corresponding to different degrees of processing and adjuvants, and analyzed how these peaks changed during the processing procedure. Moreover, the pyrolysis characteristics of Shu Dihuang with different degrees of processing and adjuvants were compared by thermal gravimetric analysis (TGA), and the upper and optimum temperature limit for carbonization were quantified. Finally, Fourier transform infrared (FTIR) spectroscopy was used to qualitatively analyze the discrepancies between different carbonization processes for Shu Dihuangtan at the optimum temperature. Overall, this study provides a scientific support for studying carbonization technology based on the ancient processing theory.

2. Results and Discussion

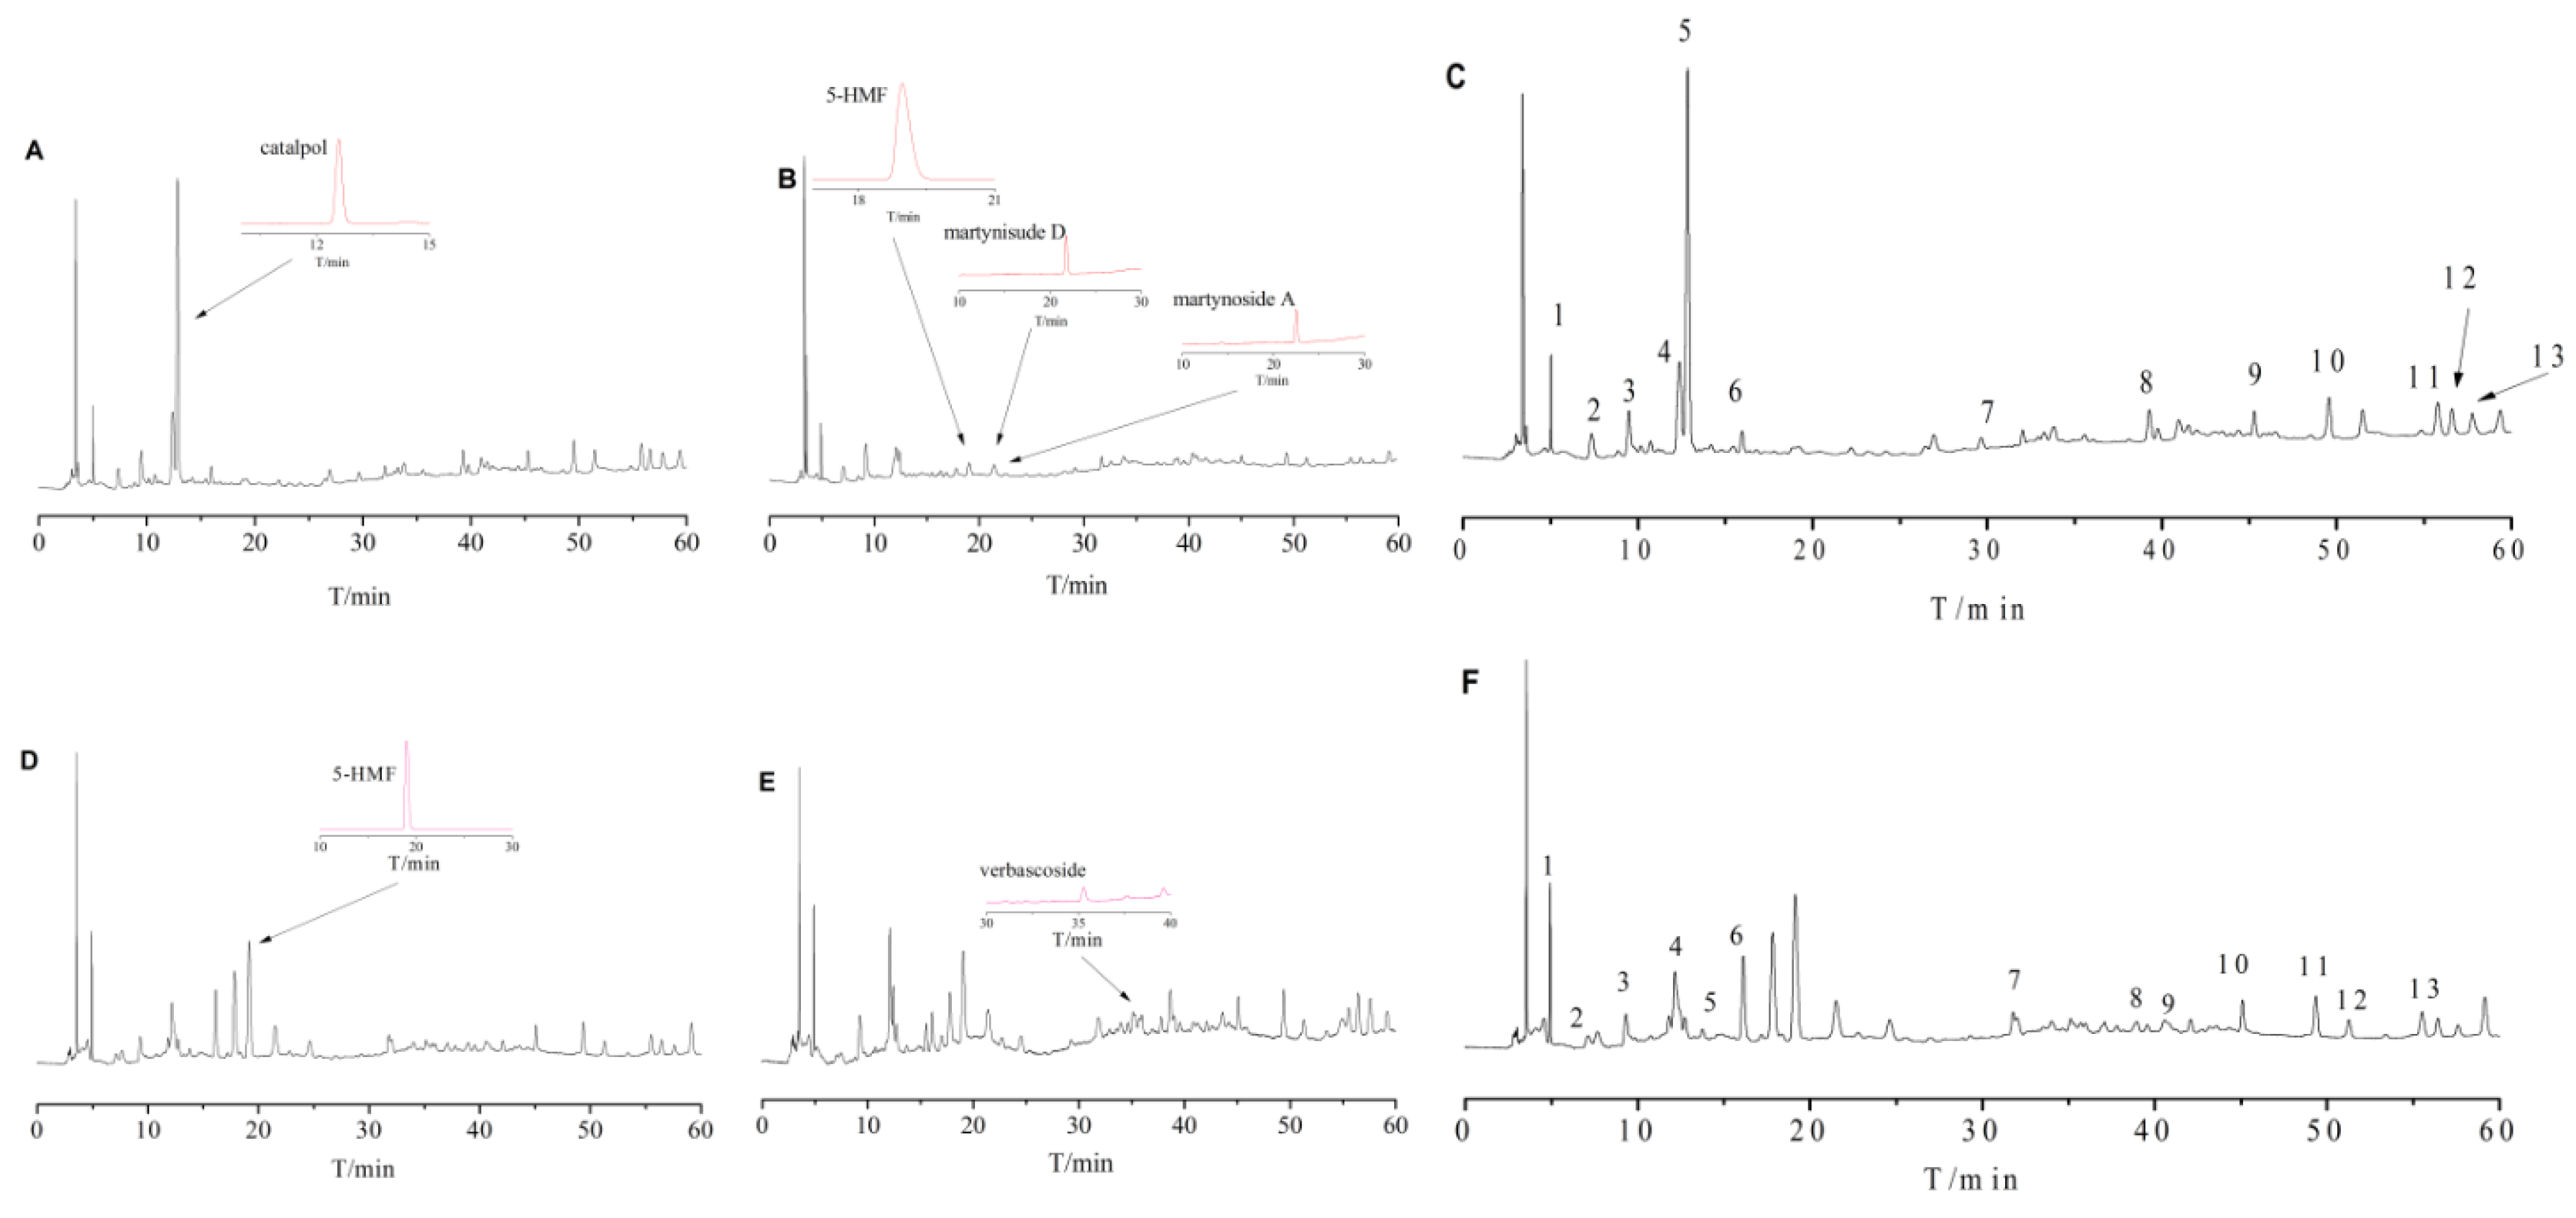
2.1. The Diverse HPLC Fingerprints of Shu Dihuang with Different Degrees of Processing and Adjuvants

HPLC chromatographic conditions were optimized based on references and actual experiments. The HPLC chromatograms of Shu Dihuang whole extract had unsteady baselines and the reproducibility was bad, which was mainly due to the complex chemical composition changing as a result of the different steaming and drying times and processing adjuvants. Also, there was no peak after 140 min and some peaks around 20 min were not completely separated. To simplify the HPLC chromatographic fingerprint and time frame, different parts of the extract were separated and the collection time was shortened. The petroleum ether, chloroform, ethyl acetate, n-butyl alcohol and water fractions extracted from test samples were assessed with HPLC chromatographic fingerprint in many preliminary experiments, and water fraction had the best reproducibility. Therefore, in this experiment we mainly used the water fraction for HPLC chromatographic fingerprinting.
For the methodology validation, the RSD values calculated from the relative retention time and relative peak area were less than 3%, which demonstrated that the instrumental and sampling precision were good, and the extraction method and chromatographic conditions were appropriate.
With SP and SWP as references, 13 common peaks were determined at 205 nm and 284 nm detection wavelengths, as shown in 
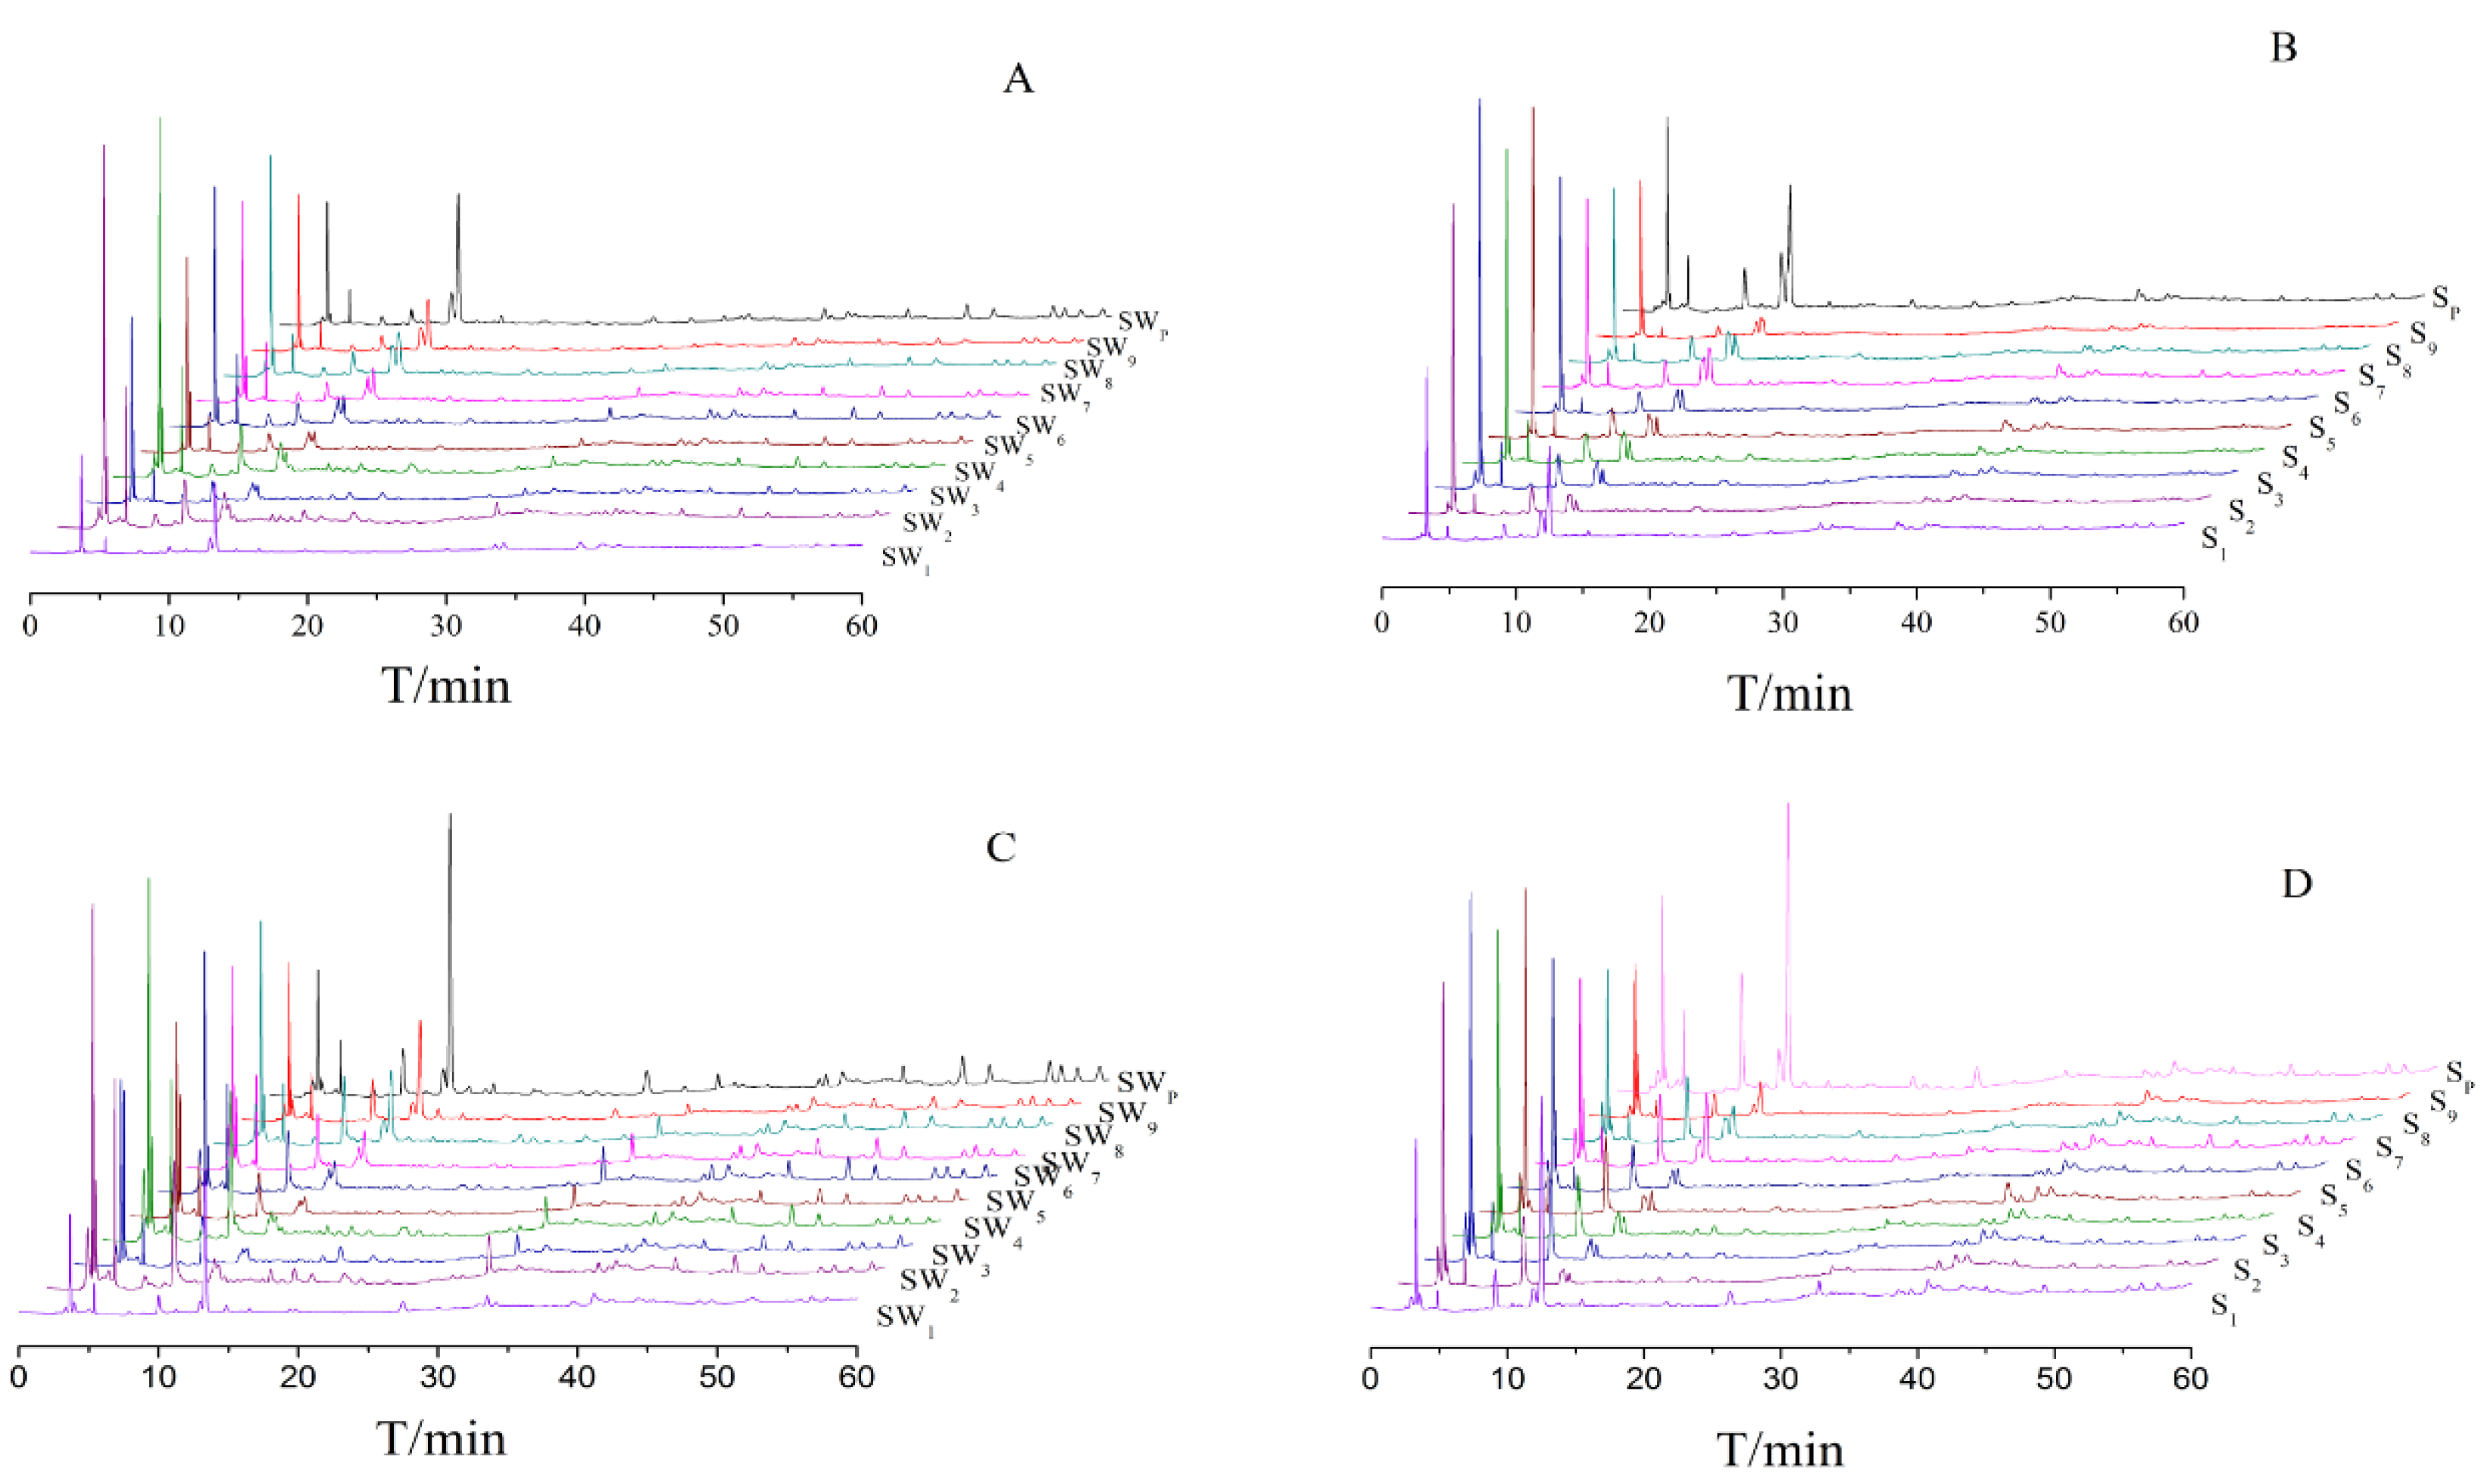
Figure 1E,F. Because of the different processing procedures of Shu Dihuang, the HPLC chromatographic fingerprints were also very diverse. The overlaid HPLC chromatograms of Shu Dihuang are shown in Figure 2. Their similarities were shown in Table 1, Table 2, Table 3 and Table 4. With Shu Dihuang (SWP) as the reference (Table 3 and 
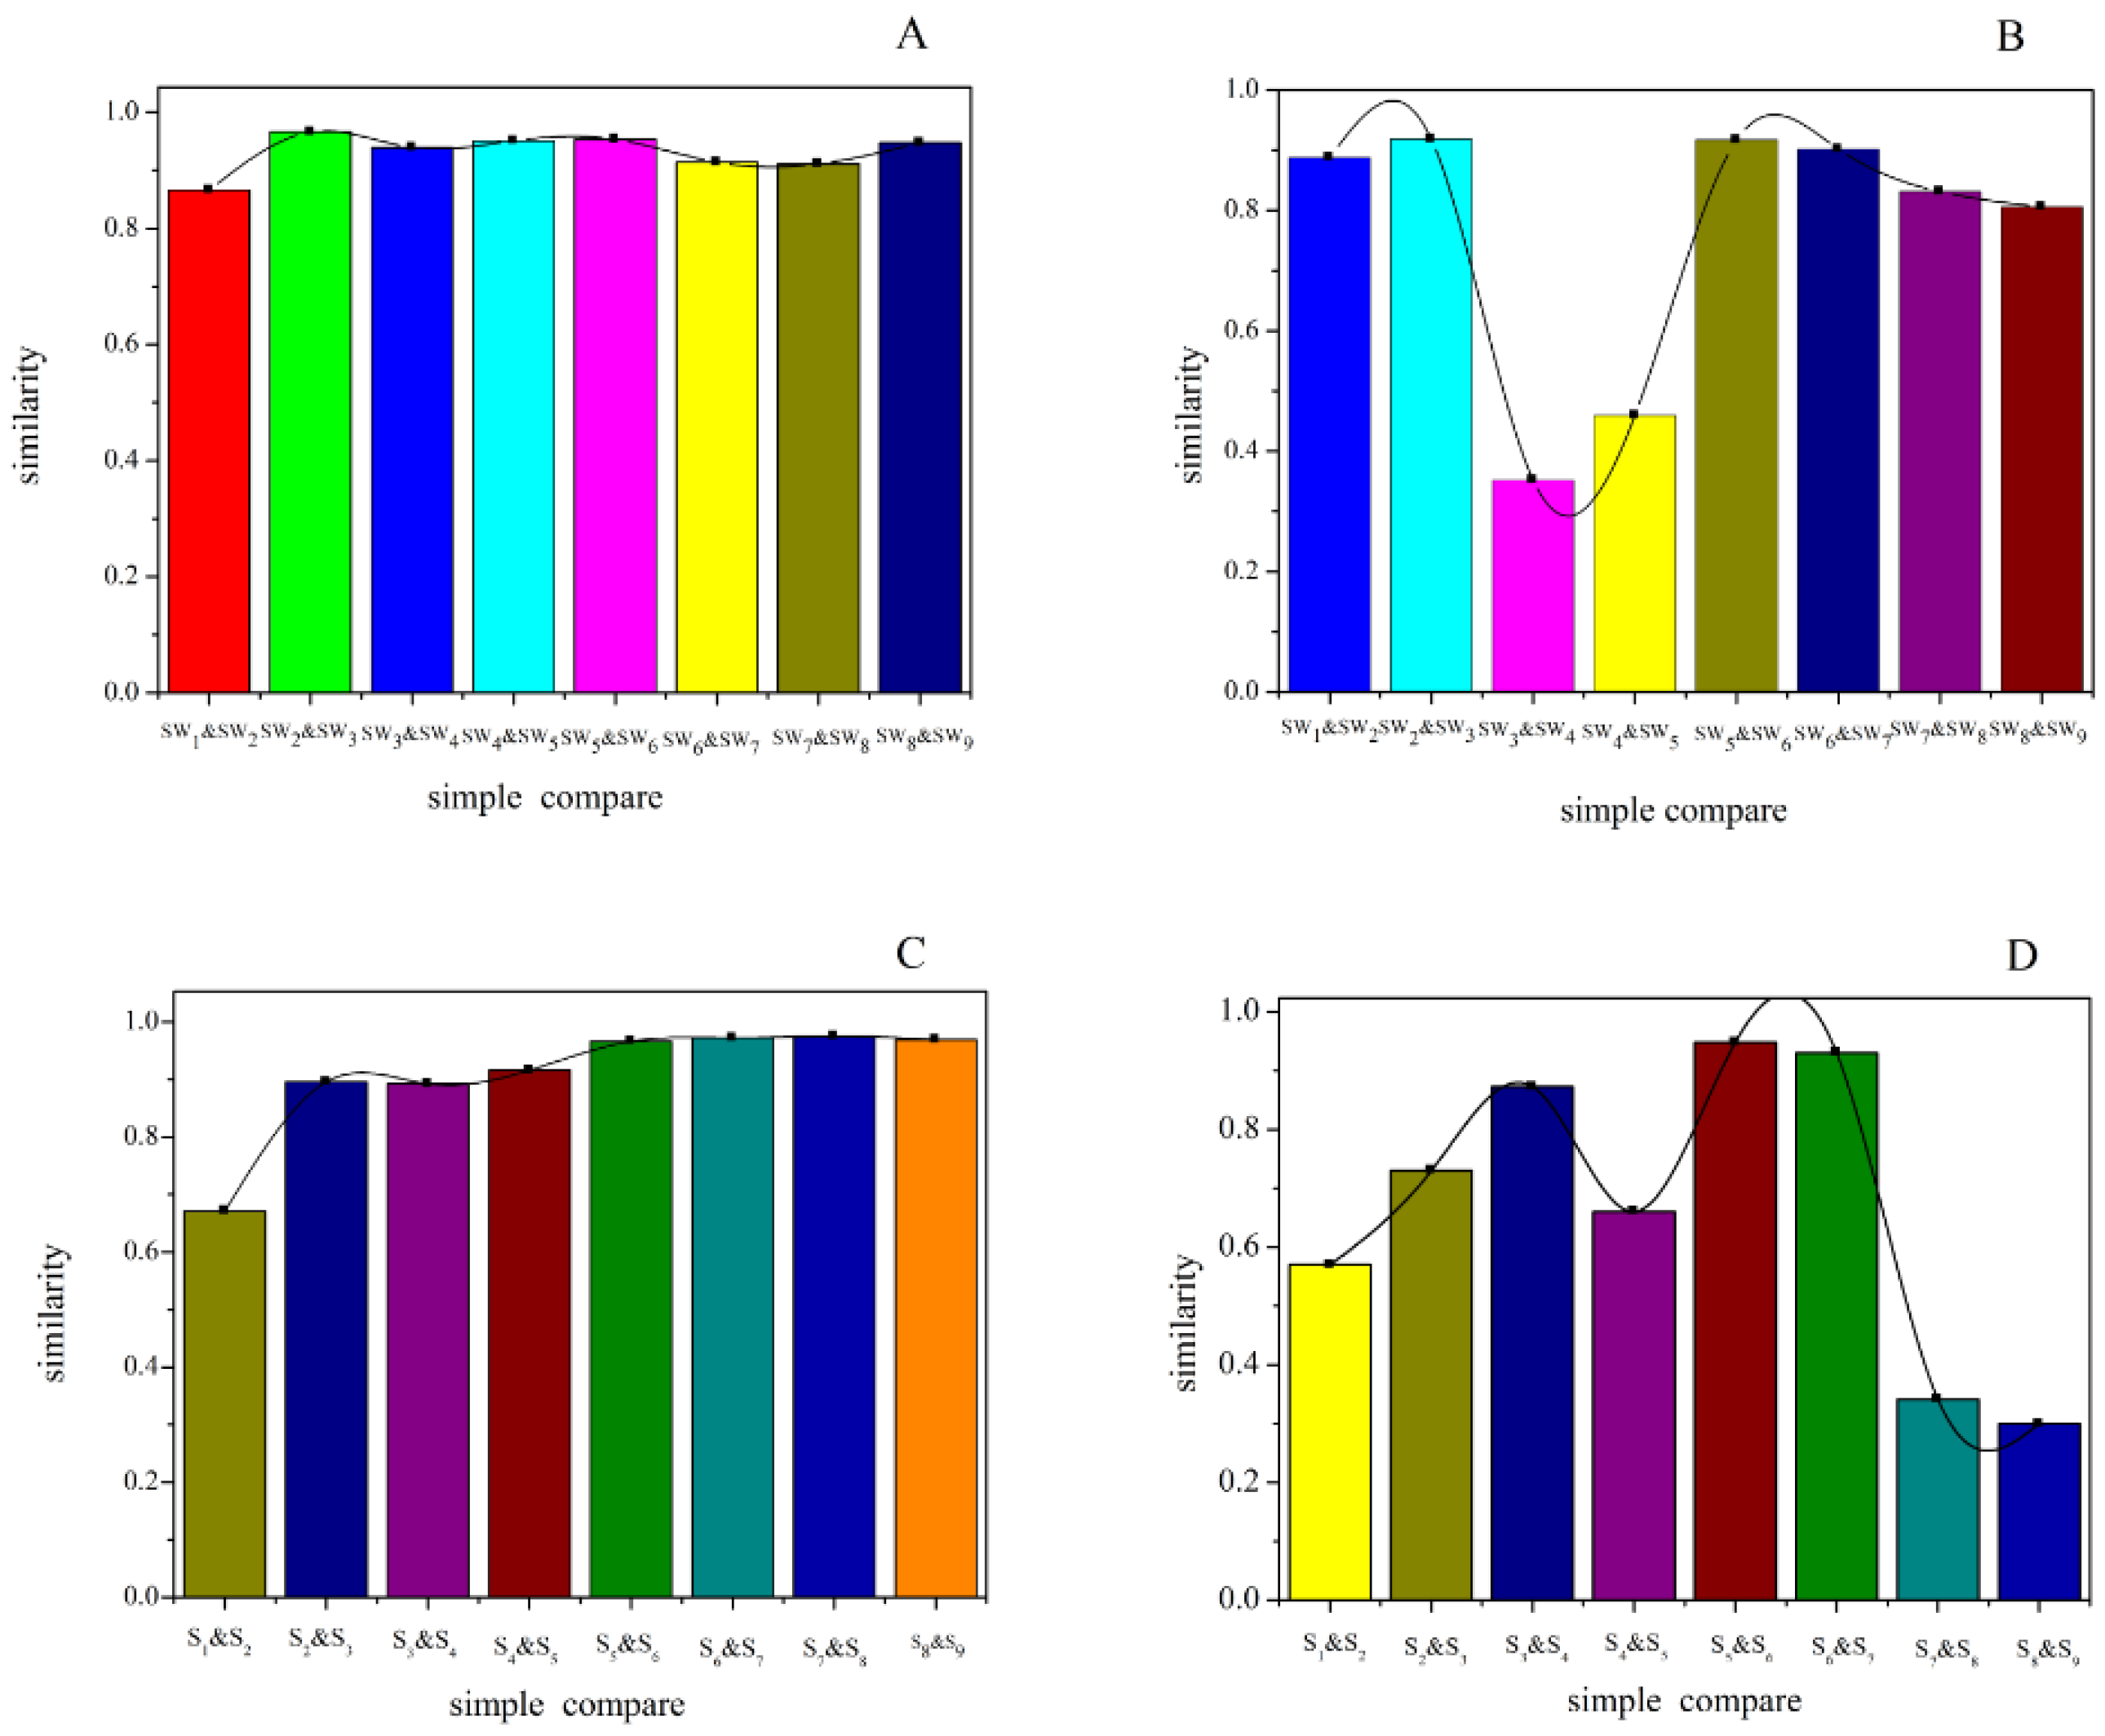
Table 4), the similarities were 0.442–0.969 and 0.472–0.949 at 205 and 284 nm detection wavelengths, respectively. When compared with the generated common peak HPLC chromatogram (R), SW3 had higher similarity values (0.972 and 0.949) at both 205 and 284 nm detection wavelength. For the relative similarity at 205 nm, there was higher similarity between SW2 and SW9 (greater than 0.9), and lower similarity between SW2 and SW1 (0.866) (Figure 3). SW4 and SW5 both had higher similarities with the other samples, and they also had relatively high similarity with SWP and R.
For the relative similarity at 284 nm, the two smallest values appeared between SW4 and SW3, and SW5 and SW4 (0.352 and 0.459, respectively), and other samples’ relative similarities were all greater than 0.8. As shown in Table 3, the similarities of SW5 with the other samples were higher than SW4. Compared with SWP and R, SW5 also had higher similarity. Overall, SW5 had higher similarity than SW4.
With Shu Dihuang (SP) as the reference (Table 4 and Table 5), similarities were 0.813–0.972 and 0.497–0.854 at 205 and 284 nm detection wavelengths, respectively. When compared with the generated common peak HPLC chromatogram (R), S5 (at 205 nm) and S3 (at 284 nm) had high similarities, which were 0.972 and 0.854. For the relative similarity at 205 nm, the smallest similarity appeared between S1 and S2 (0.671), and the other samples’ relative similarities were all greater than 0.9. S4 and S5 both had higher similarities with the other samples. But most of the other samples had higher similarities with S5. For the relative similarity at 284 nm, there were two small similarity values between S9 and S8 (0.3), and S8 and S7 (0.341). Similarly, S5 had higher similarity compared with the other samples.
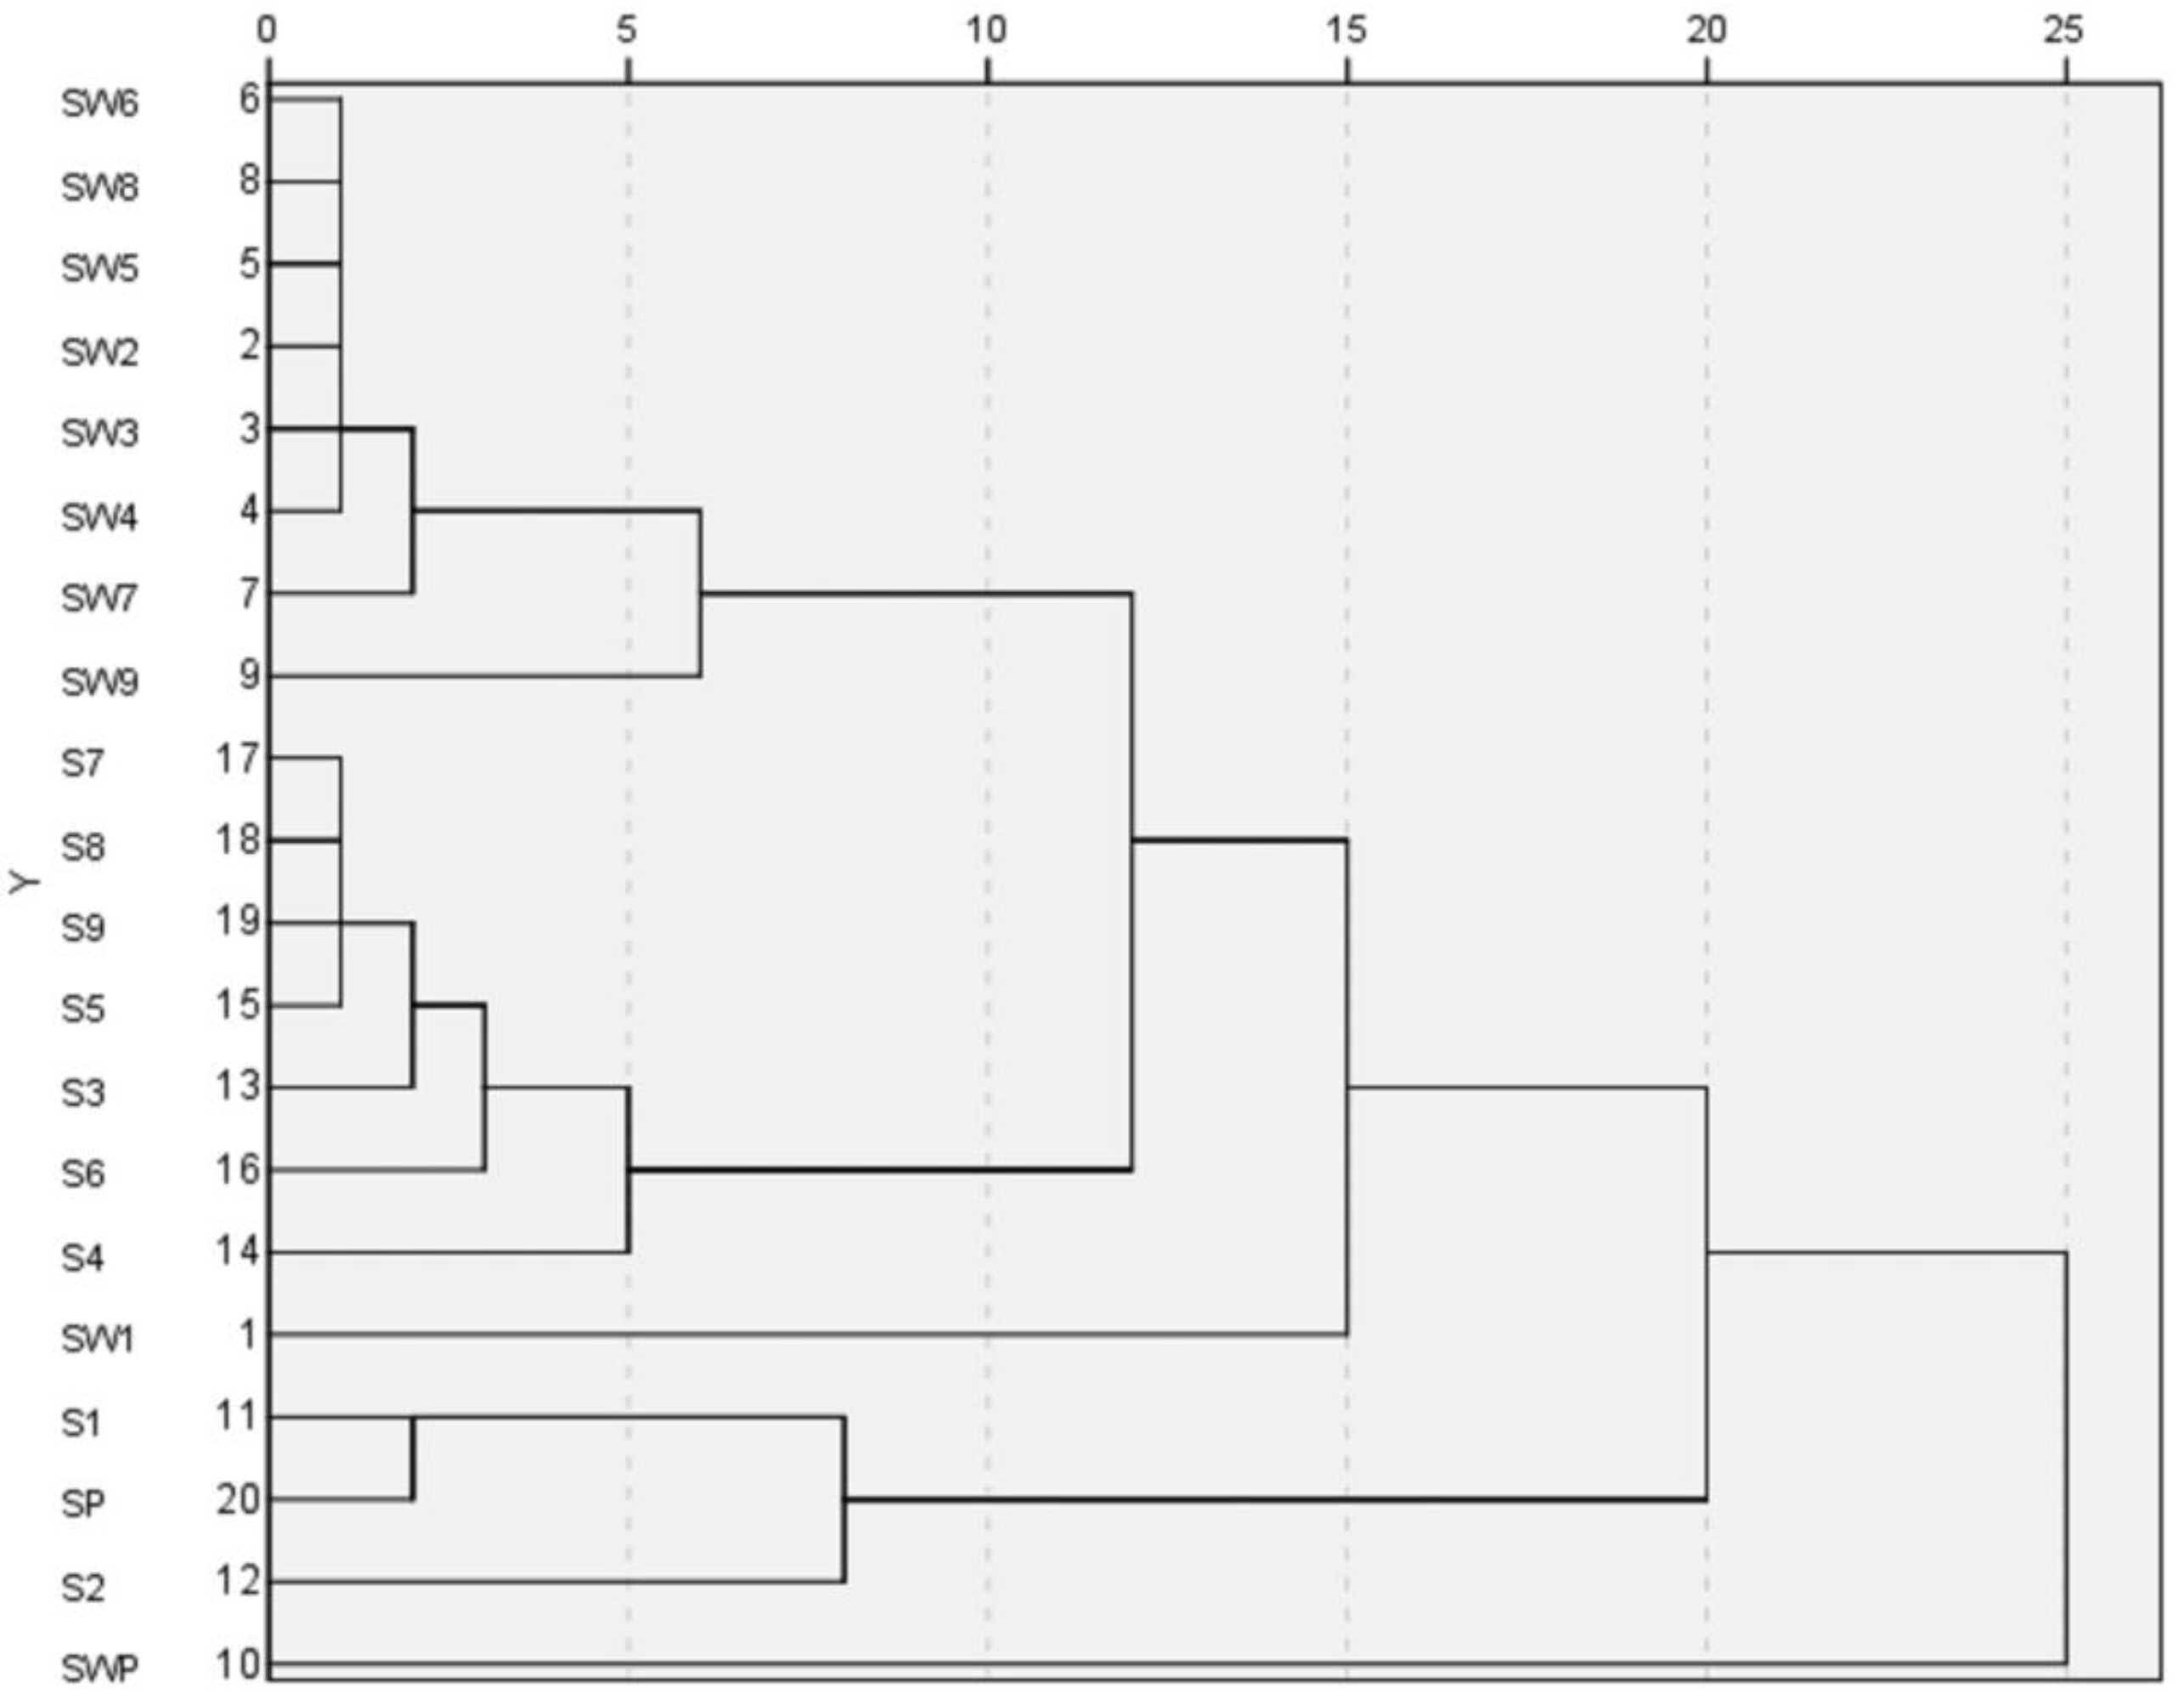
HCA is a way to structure a complicated set of observations into unique and mutually exclusive subject groups (clusters) that are similar to each other with respect to certain characteristics. The HCA results of S1~S9, SW1~SW9, SP and SWP of Shu Dihuang determined at 285 nm were shown in Figure 4. Overall, it was clear that Shu Dihuang and Shu Dihuang processed with yellow rice wine were clustered separately into two groups, indicating that the processing adjuvant (yellow rice wine) caused changes in the composition and/or content of components. This further reflected the differences seen in relative similarity. SW5 and most of the samples processed with yellow rice wine were clustered into the same group, including SW6, SW8, SW2, SW3, SW4, SW7 and SW9. Similarly, S5, S7, S8, S9, S3, S6 and S4 were clustered into another group. Moreover, this result was consistent with the previous results.
In summary, the overall chemical composition of Shu Dihuang was affected by steaming and polishing cycles and processing adjuvant (yellow rice wine). Catalpol, a kind of cycloalkene ether terpenoid, was detected at 205 nm, while 5-HMF and verbascoside were mainly detected at 284 nm. The related studies had shown that the content of cycloalkene ether terpenoids was reduced while the content of 5-HMF was increased as the degree of processing increased, and 5-HMF was an important indicator for the quality of Shu Dihuang [14,15]. Therefore, the correlation result at 285 nm detection wavelength was a critical parameter. This also led to the low number of common peaks (13) and the absence of reference substances in common peaks. Based on the results from comparing the effects of steaming and polishing times and processing adjuvants, we could draw the conclusion that the overall chemical composition experienced a great change from three to five cycles of steaming and drying, and five cycles was a simple processing method of Shu Dihuang which obeyed the ancient processing theory. These results also suggested that the degree of processing must be taken into account when preparing Shu Dihuangtan.

2.2. The Pyrolysis and Combustion Characteristics of Shu Dihuang with Different Degrees of Processing and Adjuvants

The TG-DTG curves of Shu Dihuang are shown in Figure 5, and the pyrolysis parameters and combustion characteristics are listed in Table 5. Three different pyrolysis and combustion stages were observed: drying and dehydration, pyrolysis and combustion, carbonization and combustion. Since the pyrolysis and combustion characteristics were used to simulate the preparation process of Shu Dihuangtan, we focused more on the pyrolysis and combustion stage.
In the pyrolysis and combustion stagef, two obvious thermal weight loss phases and two thermal weight loss rate peaks appeared for Shu Dihuang with different steaming and drying cycles and adjuvants. For Shu Dihuang processed with yellow rice wine, the initial temperature and the final temperature in these two phases were 151 ± 8.16 °C to 266.67 ± 1.56 °C and 266.67 ± 1.56 °C to 386.67 ± 4.32 °C, respectively. Moreover, the intensities of the two thermal weight loss rate peaks were 6.07 ± 1.16%·min−1 and 2.74 ± 0.15%·min−1, and they appeared at 210.33 ± 4.32 °C and 294.89 ± 1.66 °C, respectively. Moreover, the pyrolysis-combustion characteristics of Shu Dihuang processed with no adjuvant were similar. The initial temperature and final temperature in the two phases were 158.22 ± 6.75 °C to 266.33 ± 5.37 °C and 266.33 ± 5.37 °C to 378.56 ± 4.30 °C, respectively. The intensities of the thermal weight loss rate peaks were 7.25 ± 1.38%·min−1 and 2.80 ± 0.14%·min−1, and they appeared at 211.33 ± 2.62 °C and 290.89 ± 2.51 °C, respectively.
Along with the increase of steaming and polishing cycles, both the mean intensity of the two thermal weight loss rate peaks and the temperature interval (initial and final temperature) decreased in the pyrolysis and combustion stage. For Shu Dihuang processed with yellow rice wine, the initial and the final temperatures for SW2 were respectively continuous within the range of 163 °C and 396 °C, and the intensities of the thermal weight loss rate peaks were 7.68%·min−1 and 2.78%·min−1. The initial and the final temperatures for SW5 were between 144 °C and 385 °C, and the intensities of thermal weight loss rate peaks were 5.84%·min−1 and 2.77%·min−1. For SW8, the initial temperature was 145 °C and the final temperature was 381 °C, and the intensities of thermal weight loss rate peaks were 4.88%·min−1 and 2.96%·min−1. For Shu Dihuang processed without adjuvant, the temperature interval for S2 started at 163 °C and finished at 396 °C, and the intensities of thermal weight loss rate peaks were 8.20%·min−1 and 3.00%·min−1. The initial and final temperatures for S5 were continuously within 148 °C and 377 °C, and the intensities of thermal weight loss rate peaks were 7.55%·min−1 and 2.46%·min−1. For S8, the initial temperature was 158 °C and the final temperature was 373 °C, and the intensities of thermal weight loss rate peaks were 5.86%·min−1 and 2.68%·min−1. However, overall, the differences of thermal weight loss and thermal weight loss rate were very small from SW5 to SW9. Also, the peak temperature of thermal weight loss rate of SW5 was similar to SW6-SW9 (Figure 5), demonstrating that the trends for Shu Dihuang processed with or without adjuvant were similar, so we hold the opinion that five cycles represent a relatively good processing method.
For Shu Dihuang processed with the same steaming and polishing cycles, the pyrolysis-combustion characteristics were also different because of the processing adjuvants (with yellow rice wine or not). The intensity of the thermal weight loss rate peak was less for the Shu Dihuang processed with yellow rice wine compared to the Shu Dihuang processed without adjuvants at the same steaming and polishing cycle. Meanwhile, the Shu Dihuang processed with yellow rice wine spanned a smaller temperature interval during its thermal weight loss.
To summarize, the degree of processing and adjuvant are important conditions in the carbonization process for preparing Shu Dihuangtan. The intensity of thermal weight loss rate peak near 210.33 ± 4.32 °C or 211.33 ± 2.62 °C was an important indicator of the degree of processing of Shu Dihuang. Moreover, the corresponding temperature of the thermal weight loss rate peak in the second stage of pyrolysis-combustion near 290.89 ± 2.51 °C was the upper temperature limit of carbonization of Shu Dihuang.

2.3 FTIR Diversity of Shu Dihuangtan

As shown in Figure 6, there were nine common peaks in the FTIR spectra located at 3000, 2920, 1702, 1650, 1609, 1430, 785, 720 and 667 cm−1, respectively. The Shu Dihuangtan peaks of (CS1~CS9, CSW1-~CSW9, CSP and CSWP) at 3000 cm−1 were possibly due to the stretching vibration of ν=C-H [16], and the peak near 1650 cm−1 was assigned to the stretching vibration of ν=C-C [17]. Combining these data with the out-of-plane bending vibration at 720 cm−1 from the second derivative spectrum, we concluded that there was an olefin structure with a bis-substituted cis single olefin in Shu Dihuangtan [18]. Furthermore, the peak near 2920 cm−1 was classified as the stretching vibration of -CH3 and -CH2 [19], the peak at 1702 cm−1 belonged to the carboxyl C=O stretching vibration, and the peaks at 1609 and 1430 cm−1 were the characteristic absorption peaks of aromatic acidic material [20]. Combining these data with the aromatic compound C–H vibration absorption peak at 785 cm−1, we speculated that there was benzodiazepine material in Shu Dihuangtan [21]. In addition, the peak at 667 cm−1 was classified as the in-plane bending vibration of CO2 [22], and the peaks at 720 cm−1 and 667 cm−1 had significant differences in the second derivative spectrum. The peak intensities of CS5 and CSW5 were smaller than others, while the peak intensities of CS4 and CSW4 were much stronger.
With Shu Dihuangtan (CSP) as the reference (Table 6), the similarities ranged from 0.285 to 0.871 (CS1 to CS9, processed with no adjuvants). The highest similarity was between CS1 and CSP (0.871), while the lowest similarity was between CS4 and CSP (0.285). For the similarities between any two samples, CS3 and CS9 were relatively higher. Meanwhile, the relative similarity between CS3 and CSP as well as the sample with several cycles of steaming and drying (generally nine cycles) in the ancient theory were both obviously high. For the relative similarities among CS1-CS9, as shown in 
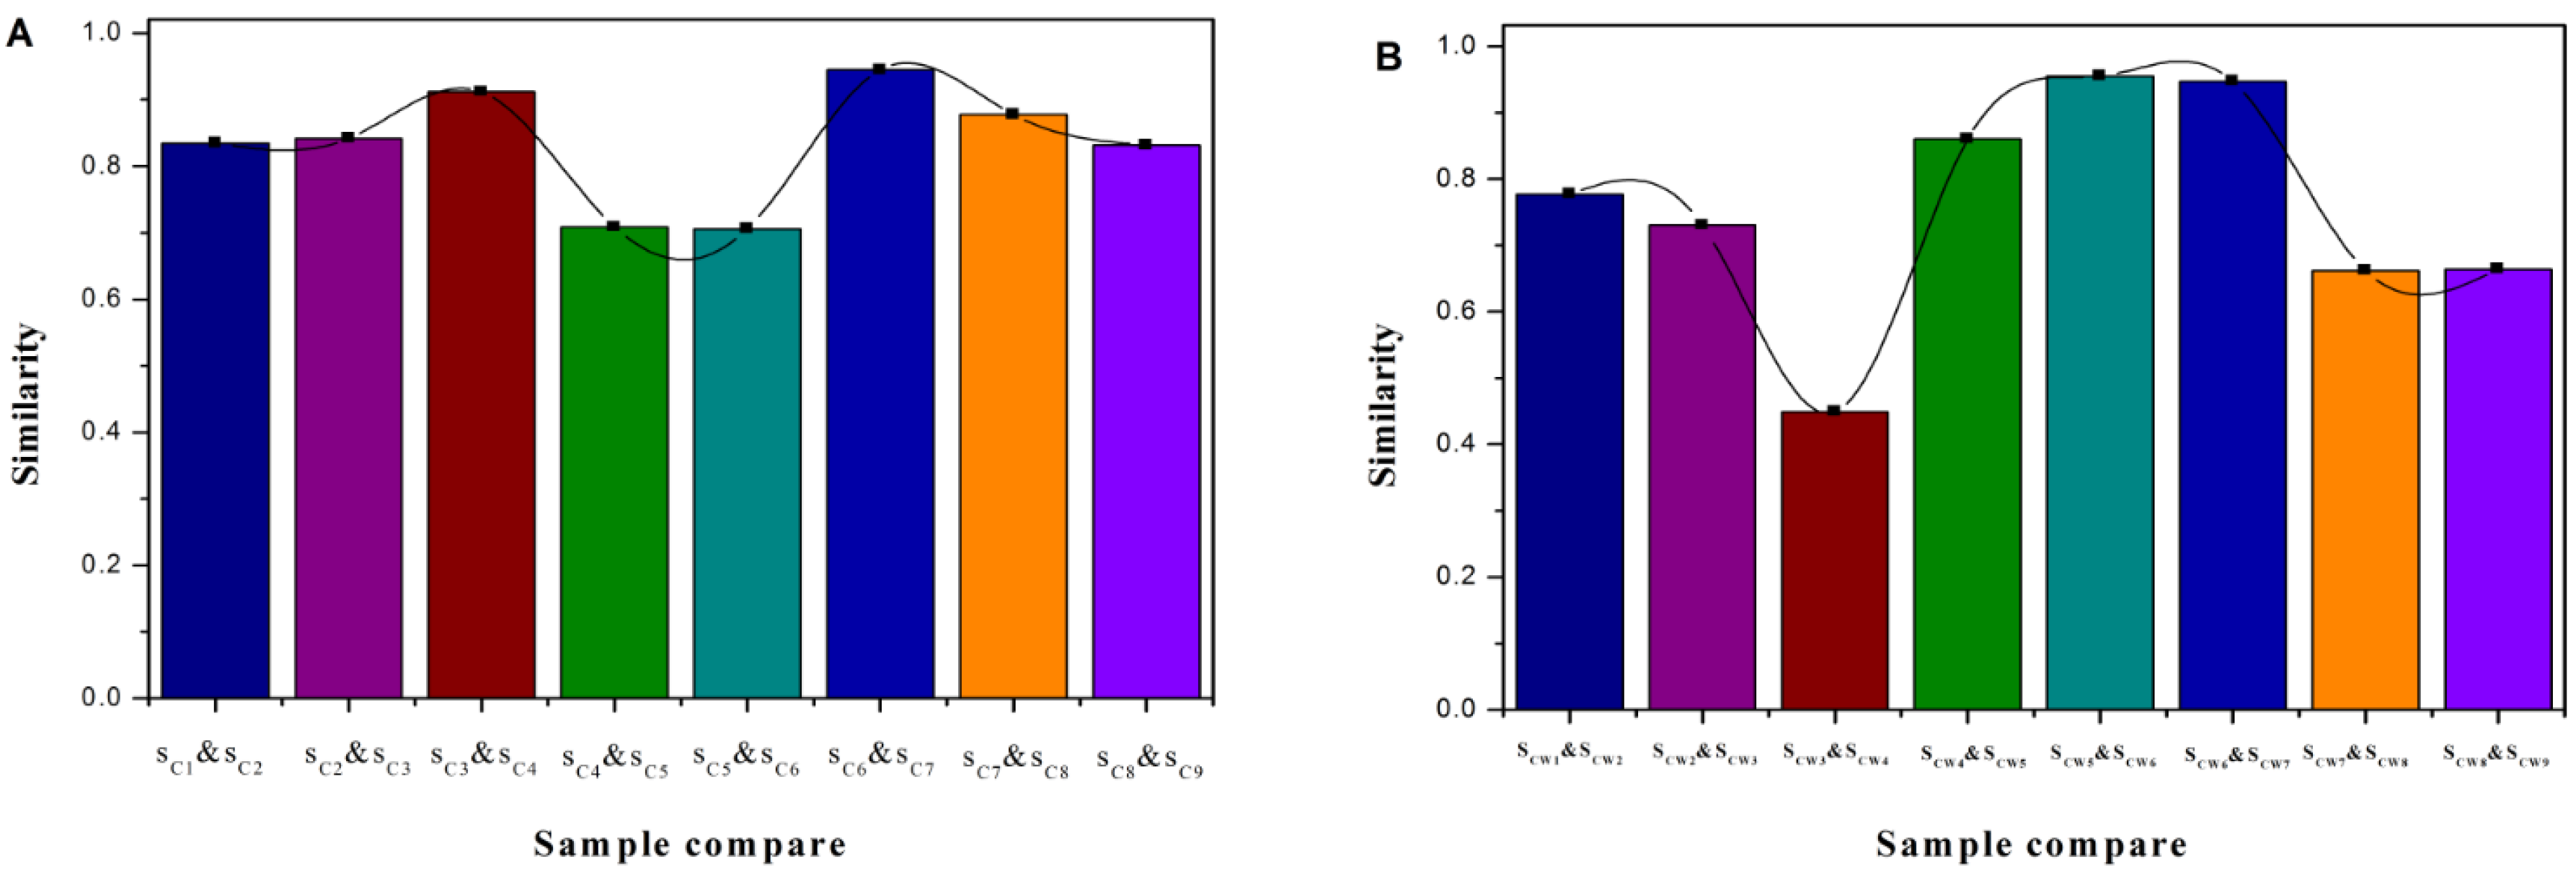
Figure 7, the highest two were CS4 and CS3 (0.912), and CS7 and CS6 (0.945); the lowest two were CS5 and CS4 (0.709), and CS6 and CS5 (0.706).
With Shu Dihuangtan (CSWP) as the reference (Table 7), the similarities ranged from 0.623 to 0.951 (CSW1 to CSW9, processed with yellow rice wine). The highest similarity was between CSW7 and CSWP (0.951), while the lowest similarity was between CSW8 and CSP (0.623). For the similarities between any two samples, CSW4 and CSW9 were relatively higher, and CSW5 and CSW6 had the highest similarity (0.955). For the relative similarities among CSW1-CSW9, as shown in Figure 6, the smallest was CSW4 and CSW3 (0.449), and the similarities among CSW4-CSW7 were kept at high levels.
Overall, all samples’ similarities were different and most of them were relatively small. The global chemical composition of Shu Dihuangtan was affected by both the degree of processing and adjuvant.

3. Materials and Methods

3.1. Materials and Reagents

Acetonitrile (chromatographic grade) was purchased from Beijing Bailingwei Tech Co., Ltd. (Beijing, China). Methanol (analytical reagent) was purchased from Tianjin Beichenfangzheng Reagent Factory (Tianjin, China). Phosphoric acid (chromatographic grade) was purchased from Tianjin Kemiou Chemical Development Center (Tianjin, China). Potassium bromide (spectroscopy grade) was purchased from ANPEL Laboratory Technologies (Shanghai, China). Standard reagents: acteoside, catalpol, 5-hydroxymethylfurfural, rehmaionoside A and rehmaionoside D (production batch numbers 150401, 150331, 160126, 140506 and 140402, respectively) were purchased from Chengdu Pufei De Biotech Co., Ltd. (Chengdu, China). The mass fraction of all standard reagents were ≥98%. The crude plant materials of raw Rehmanniae Radix (Sheng Dihuang) used in this study were collected from Xiangfen (Shanxi Province, China). They were confirmed as the roots of Rehmannia glutinosa Libosch. By Prof. Zhang Shuosheng from Shanxi University of Chinese Medicine of China.

3.2. Sample Preparation

3.2.1. The Preparation of Different Types of Shu Dihuang

Sheng Dihuang was placed in a steamer and heated for 6 h. Then the samples were put into a drying oven and dried for 24 h at 60 °C. This steaming and polishing step was repeated nine times on nine samples which were separated after each cycle. Samples were cut in pieces, dried at 60 °C and labeled from S1 to S9 [23,24,25,26]. These were the sample batch processed without adjuvants.
For the sample batches processed with adjuvant, yellow rice wine was used as the processing adjuvant, and the ratio between the yellow wine and herb was 10:4. The other conditions were kept the same as above. The samples were labeled from SW1 to SW9.
According to Chinese National Pharmacopoeia (2015), Sheng Dihuang was steamed until the herb turned black. Then the samples were exposed to sunlight until 80% dry and cut into thick slices or pieces and dried completely. This sample was labeled as SP.
According to Chinese National Pharmacopoeia (2015), Sheng Dihuang was steamed with yellow rice wine (Tapai yellow rice wine from Zhejiang Tapai Shaoxing Wine Co., Ltd., Shaoxing, China) until the wine was fully absorbed. The sample was then exposed to sunlight until the surface was slightly dried. After that, the sample was cut into thick slices or pieces and dried completely. The sample was labeled as SWP (30~50 kg of wine was used in every 100 kg of Sheng Dihuang).
To prepare carbonized Shu Dihuangtan samples a simultaneous thermal analyzer (STA-409C, NETZSCH, Waldkraiburg, Germany) was used to heat S1~S9, SW1~SW9, SP and SWP from room temperature to the maximum temperature indicated in Section 2.2 at the rate of 10 °C·min−1. The samples were marked as SC1~SC9, SCW1~SCW9, SCP and SCWP.

3.2.2. Sample Preparation for HPLC

The tested samples were crushed into powder with a pulverizer for 1 min, and passed through a 40 μm-mesh sieve. A portion of each sample (1.0 g) was accurately weighed and placed into a 50 mL flask, added with methanol and soaked overnight (12 h) at room temperature. Then the sample was extracted with an ultrasonic extraction device for 1.5 h, cooled down to room temperature, the weight loss supplemented with fresh solvent, and filtered through filter paper. An aliquot (25 mL) of the filtrate was dried using a water-bath. The residue was dissolved with deionized water and extracted successively with petroleum ether, chloroform, ethyl acetate, and n-butyl alcohol. The aqueous solvent fraction was evaporated on a rotary vacuum evaporator at 60 °C until the weight of the dry extract was constant. Then the dry extract was dissolved with 20% methanol in a 10 mL flask and filtered through 0.45 μm microporous membrane. A 10 μL aliquot of the filtrate was then injected for fingerprint analysis. Reference solutions (standards) containing catalpa alcohol (202.4 μg·mL−1), rehmannioside D (78.2 μg·mL−1), rehmannioside A (83 μg·mL−1), acteoside (200 μg·mL−1), and 5-HMF (2276 μg·mL−1) were prepared with 20% methanol and filtered through 0.45 μm microporous membranes. A 10 μL aliquot of the filtrate was injected for fingerprint analysis.

3.3. Chromatographic Conditions, Methodology Validation and Data Analysis

All HPLC analyses were performed with a U3000 series system (Thermo Fisher Scientific, Waltham, MA, USA). A Hypersil GOLD aQ C18 column (250 mm × 4.6 mm, 5 μm) was used. The mobile phase consisted of 0.1% phosphoric acid (A) and acetonitrile (B) [27]. The gradient program was developed as shown in Table 8. The flow rate was kept at 1.0 mL·min−1 and the column temperature was maintained at 25 °C. The injection volume was 10 μL and the detection wavelengths were selected at 205 and 284 nm.
All the tests below were carried out on Shu Dihuang prepared as described in Section 3.2. The precision was determined by repeating HPLC injections of the same sample six times per day. Six independent samples (prepared as described in Section 3.2.2) were extracted and analyzed in parallel for the evaluation of reproducibility. The stability was assessed by measuring a single sample solution stored at room temperature at 0, 2, 4, 8, 16 and 24 h.
HPLC chromatographic data of all the samples were integrated automatically and exported as *.AIA format files for further processing. The *.AIA files were imported into the similarity evaluation system for chromatographic fingerprint of TCM (Version 2004 A, Committee for the Pharmacopeia of PR China, Beijing, China). A reference sample was selected stochastically from the most representative samples among the middle of the analytical sequence to generate a template. Then, all of the samples were overlaid based on the template, and common peaks were aligned to the ones in template. The relative retention time (RRT) and relative peak area (RPA) were calculated simultaneously and were exported as an excel file for further statistical analysis. Hierarchical cluster analysis (HCA) was performed by IBM SPSS 22.0 (International Business Machines Corporation, Armonk, NY, USA).

3.4. Thermal Gravimetric Analysis (TGA)

A simultaneous thermal analyzer (STA-409C, NETZSCH) was used for TGA. The herb sample (30 ± 5 mg) was placed in a crucible under a constant flow of simulated air (100 mL·min−1, N2:O2 = 4:1). The temperature of the crucible was increased from room temperature to 600 °C at 10 °C·min−1 (heating rate). The experiments were repeated twice.

3.5. Fourier Transformation Infrared Spectrometry (FTIR) Experiment

A Fourier transform infrared spectrometer (MB104, BOMEM, Quebec, Canada) was used for FTIR. The tests were performed on KBr pellets with a middle infrared detector, and the spectral resolution was 4 cm−1, the detection range was 4000~500 cm−1, and the scan signal was accumulated 32 times. Automatic correction, curve smoothing and longitudinal coordinate normalization were performed on the collected data with the Thermo Fisher Nicolet FTIR OMNIC 8.0 software.

4. Conclusions

In summary, the degree of processing (steaming and polishing times) and processing adjuvant (yellow rice wine) had a great influence on the overall chemical composition of Shu Dihuangtan. This influence also caused the differences in Shu Dihuang’s pyrolysis-combustion characteristics and the FTIR spectrogram similarities. 210.33 ± 4.32 °C can be used as optimum temperature reference. The optimum processing method of Shu Dihuang was steaming and polishing for five cycles, which followed the ancient processing theory. Since the quality of Shu Dihuang is closely related to the quality of Shu Dihuangtan, the degree of processing and use or not of processing adjuvant of Shu Dihuang are very important for Shu Dihuangtan preparation. As for the reason why the processed of Shu Dihuang is steaming and drying for several cycles (generally nine times) in the ancient theory, we need to further combine these results with the pharmacology of Shu Dihuangtan to confirm the reasons.

Acknowledgments

Support was provided by the National Natural Science Foundation of China (81673601).

Author Contributions

X.L.M and M.J.H. are co-first authors on this work. S.S.Z. is corresponding author. All authors contributed to the experiments and approved the final manuscript.

Conflicts of Interest

The authors declare no conflicts of interest.

References

  1. Chang, H.C.; Tsay, Q.H. Processing of Chinese Medicine Materials, 2nd ed.; China Medical College Press: Taichung, China, 2003; pp. 2–4. [Google Scholar]
  2. Ye, D.J. Processing Study on Traditional Chinese Medicine; Scientific Technology Press: Shanghai, China, 1996; pp. 238–239. [Google Scholar]
  3. Chinese Pharmacopeia Commission. Pharmacopeia of the People’s Republic of China; China Medical Science Press: Beijing, China, 2015; Volume 1, pp. 124–125. ISBN 978-7-5067-7337-9. [Google Scholar]
  4. Shan, M.Q.; Zhang, L.; Ding, A.W. Advances in studies on carbonic herbs. Chin. Tradit. Herb. Drugs 2008, 39, 631–634. [Google Scholar]
  5. Hill, J.O. For Better Thermal Analysis and Calorimetry, 3rd ed.; International Confederation for Thermal Analysis and Calorimetry (ICTAC): London, UK, 1991. [Google Scholar]
  6. Yu, L.P.; Liang, X.L.; Zeng, Y.C. Ephedra Scum Components by Thermal TG-DTG-DSC Analysis and Pyrolytic GC-MS Analysis. Acta Sci. Nat. Univ. Sunyatseni 2011, 50, 94–97. [Google Scholar]
  7. Ma, J.N.; Meng, X.L.; Zhang, S.S. Characteristic Study on Pyrolysis and Combustion Kinetics of Gallate. World J. Integr. Tradit. West. Med. 2013, 8, 468–471. [Google Scholar]
  8. Song, A.X.; Zhang, J.W.; Li, M.J. Identification of Rhizome Dioscoreae in different areas by thermal analysis. Chin. Tradit. Herb. Drugs 2003, 34, 169–171. [Google Scholar]
  9. Wang, S.J.; Gao, W.Y.; Chen, H.X. Identification of Chinese medicine material of Fritillaria by themogravimetric/diffrential thermal analysis. China J. Chin. Mater. Med. 2007, 32, 296–299. [Google Scholar]
  10. Meng, X.L.; Guo, X.H.; Zhang, S.S. Research on processing mechanism of Zushima which was stir-fried with licorice based on TG-DTG. China J. Chin. Mater. Med. 2012, 23, 3558–3563. [Google Scholar]
  11. Meng, X.L. Research on Processing Mechanism of Zushima Stir-Fried with Licorice, and Carbonizing Process of Rhei Radix et Rhizoma, Moudan Cortex, and Sanguisorbae Radix based on Thermal Analysis. Master’s Thesis, Hubei University of Traditional Chinese Medicine, Wuhan, Hubei Province, China, 25 May 2013. [Google Scholar]
  12. Meng, X.L.; Guo, X.H.; Cui, N.N.; Ma, J.N.; Zhang, S.S.; Fan, Z. Pyrolysis characteristics of Radix Rhizoma Rhei, Cortex Moudan Radicis, and Radix Sanguisorbae and correlations with the carbonizing process of Chinese herbs. China J. Chin. Mater. Med. 2014, 12, 55–64. [Google Scholar] [CrossRef]
  13. Ma, J.N.; Meng, X.L.; Guo, X.H.; Lan, Y.R.; Zhang, S.S. Thermal analysis during partial carbonizing process of rhubarb, moutan and burnet. PLoS ONE 2017, 12, e0173946. [Google Scholar] [CrossRef] [PubMed]
  14. Cao, J.J. Studies on Quality Evaluation and Germplasm Resources Utilization of Rehmannia based on HPLC Fingerprints. Master’s Thesis, Northwest A&F University, Yangling, Shanxi Province, China, April 2012. [Google Scholar]
  15. Meng, X.L.; Ma, J.N.; Zhang, S.S.; Li, K.; Xue, F.F.; Zhang, J.; Yuan, Z.C.; Tian, Y.F.; Wang, M.F. Content changes of chemical components and their effect of adjuvants during the process of Rehmanniae Radix Praeparata (steamed for nine times and shined for nine times). Chin. Tradit. Herb. Drugs 2016, 47, 752–759. [Google Scholar]
  16. Duan, L.T.; Liu, Z.M. Partition of infrared spectrogram. J. North China Univ. Sci. Technol. 2006, 8, 336–337. [Google Scholar]
  17. Zhang, L.M.; Wang, L.L.; Gao, W.Y. Characteristics analysis of FTIR spectra of the different extracts of xacin. Chin. Tradit. Herb. Drugs 2009, 40, 1413–1416. [Google Scholar]
  18. Zhenmin, H.; Jonathan, W.; Sanford, A.A. UV Resonance Raman and DFT Studies of Arginine Side Chains in Peptides: Insights into Arginine Hydration. J. Phys. Chem. B 2013, 117, 7145–7156. [Google Scholar]
  19. Ruan, X.X.; Sun, P.; Ouyang, X.X.; Qian, G.R. Characteristics and mechanisms of sorption of organic contaminants onto sodium dodecyl sulfate modified Ca-Al layered double hydroxides. Chin. Sci. Bull. 2011, 32, 3431–3436. [Google Scholar] [CrossRef]
  20. Wan, R.Y. Study on Fourier Transform Infrared Spectroscopy for the Determination of Vitamin C Active Pharmaceutical Ingredient and Preparation. Master’s Thesis, Shenyang University of Technology, Shenyang, Liaoning Province, China, 1 March 2016. [Google Scholar]
  21. Li, F.M. Analytical Chemistry, 7nd ed.; People’s Medical Publishing House: Beijing, China, 2011. [Google Scholar]
  22. Buryan, P.; Staff, M. Pyrolysis of the waste biomass. J. Therm. Anal. Calorim. 2008, 93, 637–640. [Google Scholar] [CrossRef]
  23. Zhang, L.P.; Li, J.; Zhang, Z.L.; Bai, Y.; Wang, L.; Wang, X.G. Determination of the reducing sugar content in Radix Rehmanniae steamed and steamed for nine times and shined for nine times. J. Henan Univ. Chin. Med. 2005, 20, 22–23. [Google Scholar]
  24. Lu, P.W. Study on the Chemical Components and the Preparation Comparison of Rehmannia Glutinosa Libosch. Master’s Thesis, Henan University, Kaifeng, Henan Province, China, 2008. [Google Scholar]
  25. Zhang, J.; Ma, Y. Optimization of processing technology of nine steaming nine drying of Rehmannia glutinosa by multiple indexes comprehensive balance method-orthogonal test. China Pharm. 2016, 27, 962–965. [Google Scholar]
  26. Liu, M.; Li, G.S.; Wang, H.S.; Lu, P.W. Determination and dynamic variation of leonuride contents with processing in Radix Rehmanniae steamed for nine times and shined for nine times. Chin. Pharm. J. 2009, 44, 658–660. [Google Scholar]
  27. Cao, J.J.; Liang, Z.S.; Yang, D.F.; Liu, Y.H.; Duan, Q.M. Determination of the processing end-point of Radix Rehmanniae by HPLC fingerprint technique. China J. Chin. Mater. Med. 2010, 35, 2556–2560. [Google Scholar]
Figure 1. HPLC chromatograms of Shu Dihuang. Notes: (AC) HPLC figures of Shu Dihuang (SW1, SW3 and SW3) determined at 205 nm; (DF) HPLC figures of Shu Dihuang (SW6, S4 and SW6) determined at 284 nm.
Molecules 22 01193 g001
Figure 2. Overlaid HPLC chromatograms of Shu Dihuang. Notes: (A) and (B) were determined at 205 nm; (C) and (D) were determined at 285 nm; (A) and (C) belong to Shu Dihuang processed with yellow rice wine; (B) and (D) belong to Shu Dihuang.
Molecules 22 01193 g002
Figure 3. The relative similarity of Shu Dihuang. Notes: (A) and (C) were determined at 205 nm; (B) and (D) were determined at 285 nm; (A) and (B) belong to Shu Dihuang processed with yellow rice wine; (C) and (D) belong to Shu Dihuang.
Molecules 22 01193 g003
Figure 4. Dendrogram of the hierarchical cluster analysis of Shu Dihuang determined at 285 nm.
Molecules 22 01193 g004
Figure 5. Pyrolysis and combustion TG/DTG curves for Shu Dihuang. Notes: (A) and (C) were respectively TG and DTG curves of Shu Dihuang processed with yellow rice wine; (B) and (D) were respectively TG and DTG curves of Shu Dihuang.
Molecules 22 01193 g005
Figure 6. FTIR Spectra of Shu Dihuangtan. Notes: (A) and (B) were belong to Shu Dihuangtan, (C) and (D) were belong to Shu Dihuangtan processed with yellow rice wine.
Molecules 22 01193 g006
Figure 7. The FTIR relative similarity of Shu Dihuang. Notes: (A) was belong to Shu Dihuangtan, (B) was belong to Shu Dihuangtan processed with yellow rice wine.
Molecules 22 01193 g007
Table 1. The similarity result of Shu Dihuang processed with yellow rice wine determined at 205 nm.
SW1SW2SW3SW4SW5SW6SW7SW8SW9SWPR
SW110.8660.7730.6750.650.6110.4850.5420.4860.7350.754
SW20.86610.9660.8840.860.8480.7450.8070.7690.5620.934
SW30.7730.96610.9390.9230.9170.8460.8930.8680.4380.972
SW40.6750.8840.93910.9510.9320.8960.9130.9040.3590.965
SW50.650.860.9230.95110.9530.9190.9230.940.3230.969
SW60.6110.8480.9170.9320.95310.9140.9410.9250.2780.954
SW70.4850.7450.8460.8960.9190.91410.9110.9550.1720.915
SW80.5420.8070.8930.9130.9230.9410.91110.9470.2130.931
SW90.4860.7690.8680.9040.940.9250.9550.94710.1740.927
SWp0.7350.5620.4380.3590.3230.2780.1720.2130.17410.442
R0.7540.9340.9720.9650.9690.9540.9150.9310.9270.4421
Table 2. The similarity result of Shu Dihuang processed with yellow rice wine determined at 284 nm.
SW1SW2SW3SW4SW5SW6SW7SW8SW9SWpR
SW110.8880.7420.2420.5140.4770.3060.3080.3760.6790.734
SW20.88810.9180.2810.740.7130.5770.5640.630.6540.894
SW30.7420.91810.3520.850.8570.7770.7140.7690.5480.949
SW40.2420.2810.35210.4590.4070.380.4060.3420.1210.472
SW50.5140.740.850.45910.9170.8470.8380.8170.4020.907
SW60.4770.7130.8570.4070.91710.9020.8810.8870.3730.911
SW70.3060.5770.7770.380.8470.90210.8310.9150.260.835
SW80.3080.5640.7140.4060.8380.8810.83110.8060.2630.795
SW90.3760.630.7690.3420.8170.8870.9150.80610.3240.853
SWp0.6790.6540.5480.1210.4020.3730.260.2630.32410.61
R0.7340.8940.9490.4720.9070.9110.8350.7950.8530.611
Table 3. The similarity result of Shu Dihuang determined at 205 nm.
S1S2S3S4S5S6S7S8S9SpR
S110.6710.7980.8520.6920.6550.6770.6720.6060.9540.816
S20.67110.8960.8790.9660.950.9330.9320.9410.7590.95
S30.7980.89610.8920.9190.9110.8890.9060.8940.8040.952
S40.8520.8790.89210.9160.8680.8930.8640.8310.8970.951
S50.6920.9660.9190.91610.9660.9730.960.9570.7540.972
S60.6550.950.9110.8680.96610.9720.970.9880.7170.963
S70.6770.9330.8890.8930.9730.97210.9750.9650.7190.965
S80.6720.9320.9060.8640.960.970.97510.9690.7180.962
S90.6060.9410.8940.8310.9570.9880.9650.96910.6790.945
Sp0.9540.7590.8040.8970.7540.7170.7190.7180.67910.858
R0.8160.950.9520.9510.9720.9630.9650.9620.9450.8581
Table 4. The similarity result of Shu Dihuang determined at 284 nm.
S1S2S3S4S5S6S7S8S9SpR
S110.570.5070.5950.4230.3940.3840.2990.3260.8230.781
S20.5710.730.6560.8820.8650.8460.230.2440.440.824
S30.5070.7310.8730.7780.8030.780.3440.380.4040.854
S40.5950.6560.87310.660.6550.650.2930.310.5060.828
S50.4230.8820.7780.6610.9480.920.2690.280.240.796
S60.3940.8650.8030.6550.94810.930.3040.3270.2620.808
S70.3840.8460.780.650.920.9310.3410.3280.2480.802
S80.2990.230.3440.2930.2690.3040.34110.30.4720.542
S90.3260.2440.380.310.280.3270.3280.310.2150.497
Sp0.8230.440.4040.5060.240.2620.2480.4720.21510.696
R0.7810.8240.8540.8280.7960.8080.8020.5420.4970.6961
Table 5. Parameters of pyrolysis characteristics of Shu Dihuang.
SampleThermal Decomposition PeriodsMass/(%)DTGmax/(%·min−1)
SW1Water loss (Room temperature~165 °C)4.031.21
Pyrolysis & Combustion165~270 °C19.208.33
270~390 °C24.222.75
Carbonization & Combustion (390 °C~Final temperature)21.508.83
SW2Water loss (Room temperature~165 °C)4.271.34
Pyrolysis & Combustion165~265 °C18.947.68
265~395 °C24.232.78
Carbonization & Combustion (395 °C~Final temperature)21.9710.07
SW3Water loss (Room temperature~155 °C)4.341.34
Pyrolysis & Combustion155~270 °C18.276.47
270~390 °C22.152.46
Carbonization & Combustion (390 °C~Final temperature)21.055.07
SW4Water loss (Room temperature~155 °C)3.801.31
Pyrolysis & Combustion155~270 °C17.326.11
270~390 °C24.622.58
Carbonization & Combustion (390 °C~Final temperature)23.274.47
SW5Water loss (Room temperature~145 °C)3.201.20
Pyrolysis & Combustion145~265 °C16.565.84
265~385 °C24.782.77
Carbonization & Combustion (385 °C~Final temperature)26.555.51
SW6Water loss (Room temperature~150 °C)3.651.15
Pyrolysis & Combustion150~270 °C15.625.21
270~385 °C24.222.81
Carbonization & Combustion (385 °C~Final temperature)25.285.46
SW7Water loss (Room temperature~150 °C)3.731.23
Pyrolysis & Combustion150~270 °C15.385.30
270~385 °C24.562.67
Carbonization & Combustion (385 °C~Final temperature)25.705.03
SW8Water loss (Room temperature~145 °C)3.991.18
Pyrolysis & Combustion145~270 °C14.514.88
270~380 °C22.932.96
Carbonization & Combustion (380 °C~Final temperature)23.974.68
SW9Water loss (Room temperature~145 °C)3.611.19
Pyrolysis & Combustion145~270 °C14.624.85
270~385 °C23.852.90
Carbonization & Combustion (385 °C~Final temperature)25.445.45
S1Water loss (Room temperature~170 °C)4.420.91
Pyrolysis & Combustion170~260 °C16.2910.57
260~385 °C25.532.93
Carbonization & Combustion (385 °C~Final temperature)19.845.71
S2Water loss (Room temperature~160 °C)1.920.62
Pyrolysis & Combustion160~270 °C15.828.20
270~380 °C26.363.00
Carbonization & Combustion (380 °C~Final temperature)19.925.15
S3Water loss (Room temperature~155 °C)2.940.96
Pyrolysis & Combustion155~270 °C17.587.23
270~385 °C24.352.70
Carbonization & Combustion (385 °C~Final temperature)21.184.47
S4Water loss (Room temperature~155 °C)4.990.82
Pyrolysis & Combustion155~270 °C13.916.63
270~380 °C23.492.72
Carbonization & Combustion (380 °C~Final temperature)21.694.35
S5Water loss (Room temperature~150 °C)6.281.28
Pyrolysis & Combustion150~270 °C12.857.55
270~380 °C24.702.66
Carbonization & Combustion (380 °C~Final temperature)20.704.10
S6Water loss (Room temperature~160 °C)5.420.91
Pyrolysis & Combustion160~270 °C13.377.05
270~380 °C24.252.68
Carbonization & Combustion (380 °C~Final temperature)31.203.09
S7Water loss (Room temperature~160 °C)5.021.00
Pyrolysis & Combustion160~270 °C13.566.29
270~370 °C23.652.78
Carbonization & Combustion (370 °C~Final temperature)21.522.98
S8Water loss (Room temperature~160 °C)5.100.98
Pyrolysis & Combustion160~275 °C13.875.86
275~375 °C23.612.68
Carbonization & Combustion (375 °C~Final temperature)21.973.27
S9Water loss (Room temperature~170 °C)6.551.17
Pyrolysis & Combustion170~255 °C12.175.84
255~380 °C24.203.03
Carbonization & Combustion (380 °C~Final temperature)21.965.10
SWPWater loss (Room temperature~170 °C)4.001.23
Pyrolysis & Combustion170~270 °C20.059.65
270~370 °C24.182.78
Carbonization & Combustion (370 °C~Final temperature)23.086.27
SPWater loss (Room temperature~175 °C)7.172.04
Pyrolysis & Combustion175~260 °C18.129.19
260~390 °C24.392.90
Carbonization & Combustion (390 °C~Final temperature)20.999.83
Table 6. The FTIR similarity result of Shu Dihuang.
S1S2S3S4S5S6S7S8S9SP
S110.8350.6960.4280.6760.6260.6910.5340.6400.871
S20.83510.8420.6660.9260.7290.8590.8090.8380.716
S30.6960.84210.9120.8050.9190.9560.8980.8600.539
S40.4280.6660.91210.7090.9150.9010.8870.7840.285
S50.6760.9260.8050.70910.7060.8430.8730.8410.520
S60.6260.7290.9190.9150.70610.9450.8040.7890.549
S70.6910.8590.9560.9010.8430.94510.8780.8560.608
S80.5340.8090.8980.8870.8730.8040.87810.8320.331
S90.6400.8380.8600.7840.8410.7890.8560.83210.489
SP0.8710.7160.5390.2850.5200.5490.6080.3310.4891
Table 7. The FTIR similarity result of Shu Dihuang processed with yellow rice wine.
SW1SW2SW3SW4SW5SW6SW7SW8SW9SWP
SW110.7770.8080.7510.9180.9320.9210.7500.7440.864
SW20.77710.7300.6760.8000.8140.7570.6730.5070.674
SW30.8080.73010.4490.7920.8280.9100.4180.5450.844
SW40.7510.6760.44910.8600.8120.7170.8820.8020.723
SW50.9180.8000.7920.86010.9550.9470.7880.8590.925
SW60.9320.8140.8280.8120.95510.9470.8090.7700.896
SW70.9210.7570.9100.7170.9470.94710.6620.7910.951
SW80.7500.6730.4180.8820.7880.8090.66210.6640.623
SW90.7440.5070.5450.8020.8590.7700.7910.66410.837
SWP0.8640.6740.8440.7230.9250.8960.9510.6230.8371
Table 8. The HPLC mobile phase gradient program.
T/min0.1% Phosphoric Acid/%Acetonitrile/%
01000
51000
10982
22964
408515
508020
607525

