
The Performance of Several Docking Programs at Reproducing Protein–Macrolide-Like Crystal Structures


Abstract
:
1. Introduction
2. Results and Discussion
2.1. Self-Docking of the Twenty PDB Structures
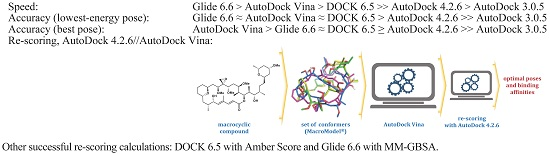
2.2. Ligand Conformational Search
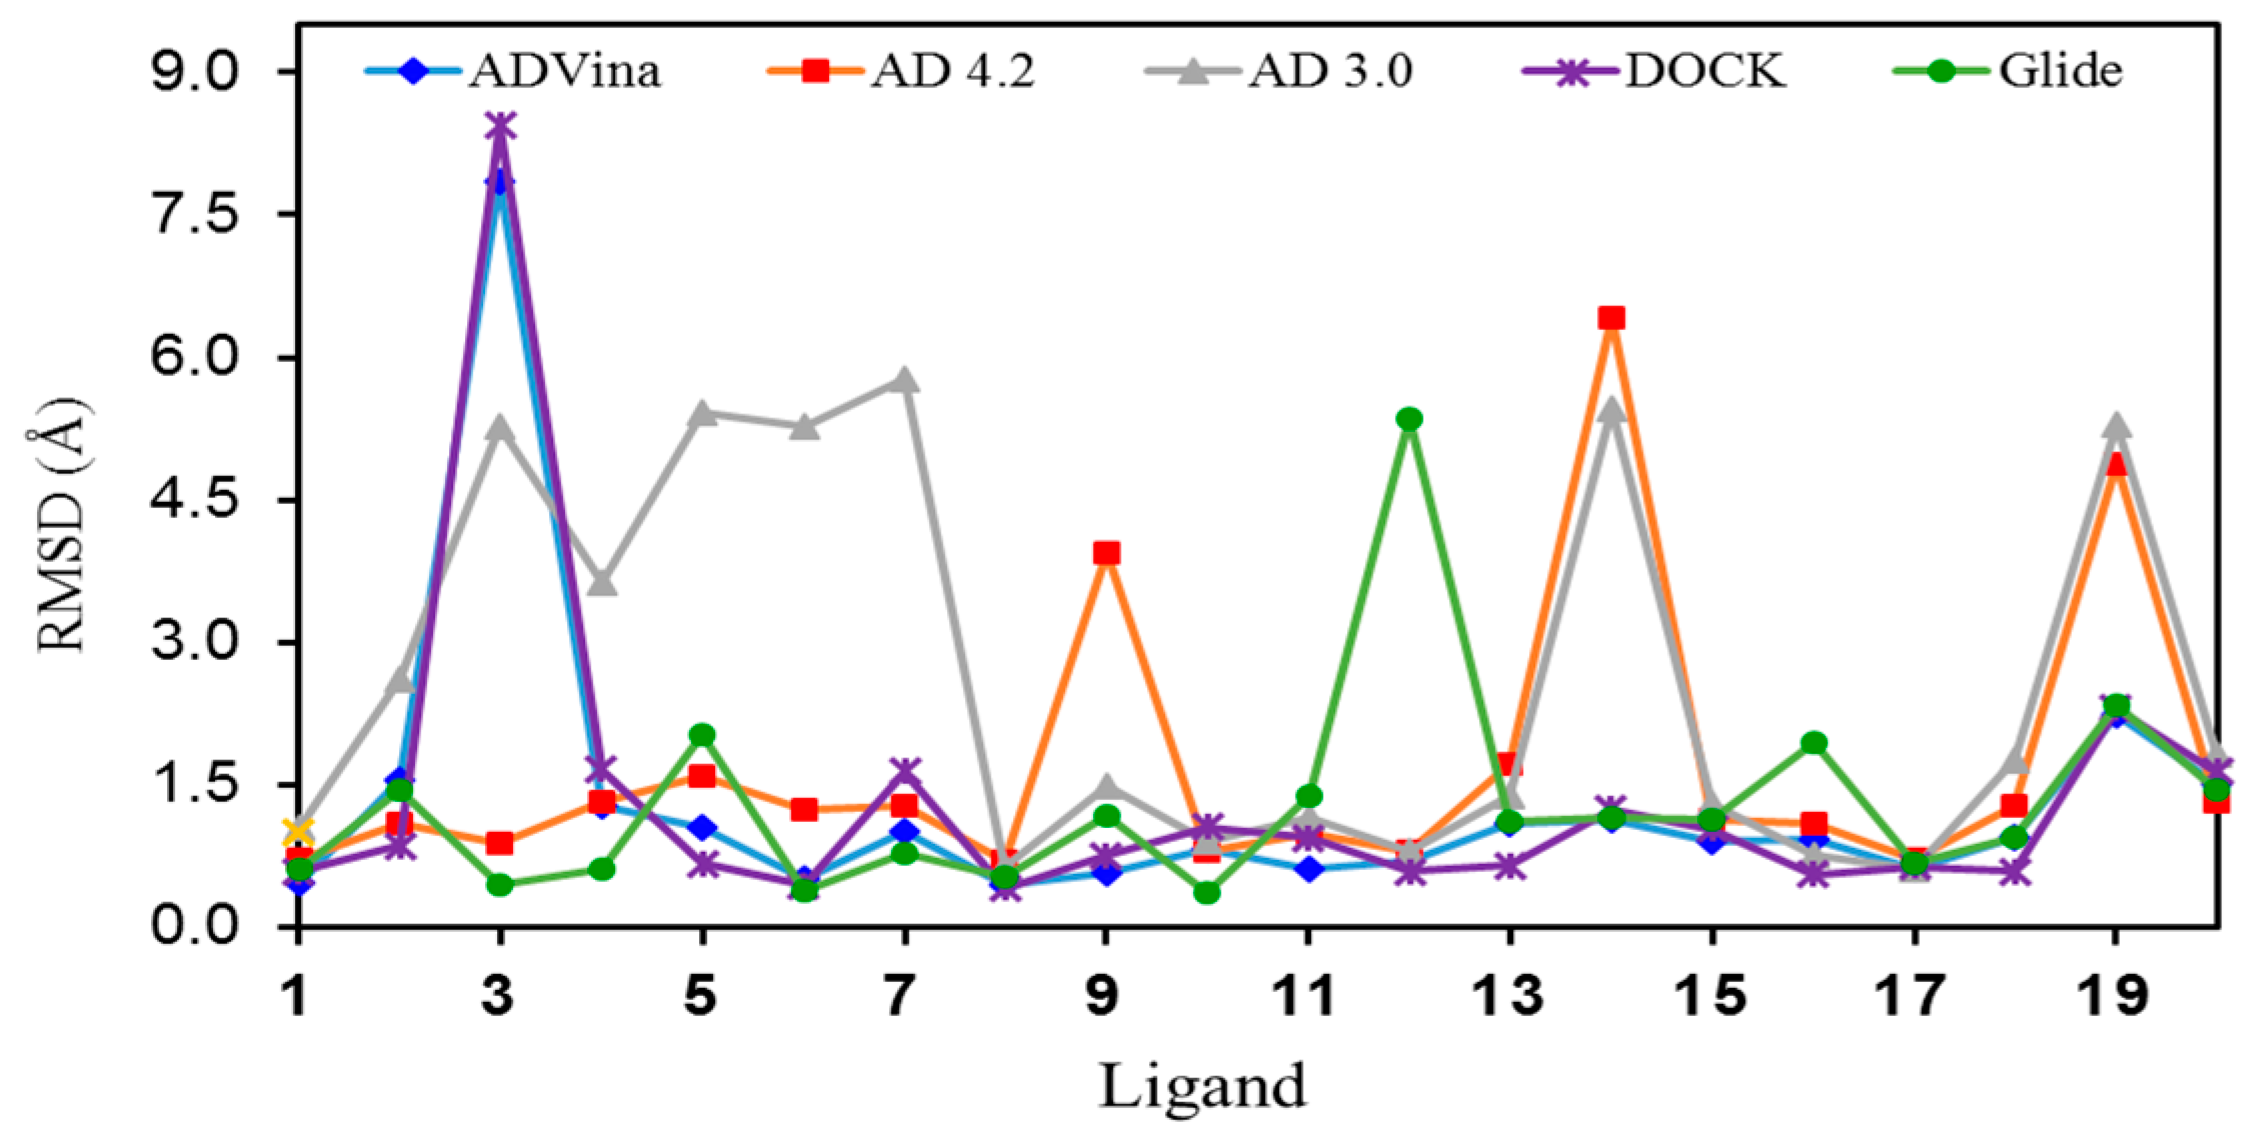
2.3. Docking of all the Conformers of Each Ligand
2.4. Comparison of AD Vina with PSOVina
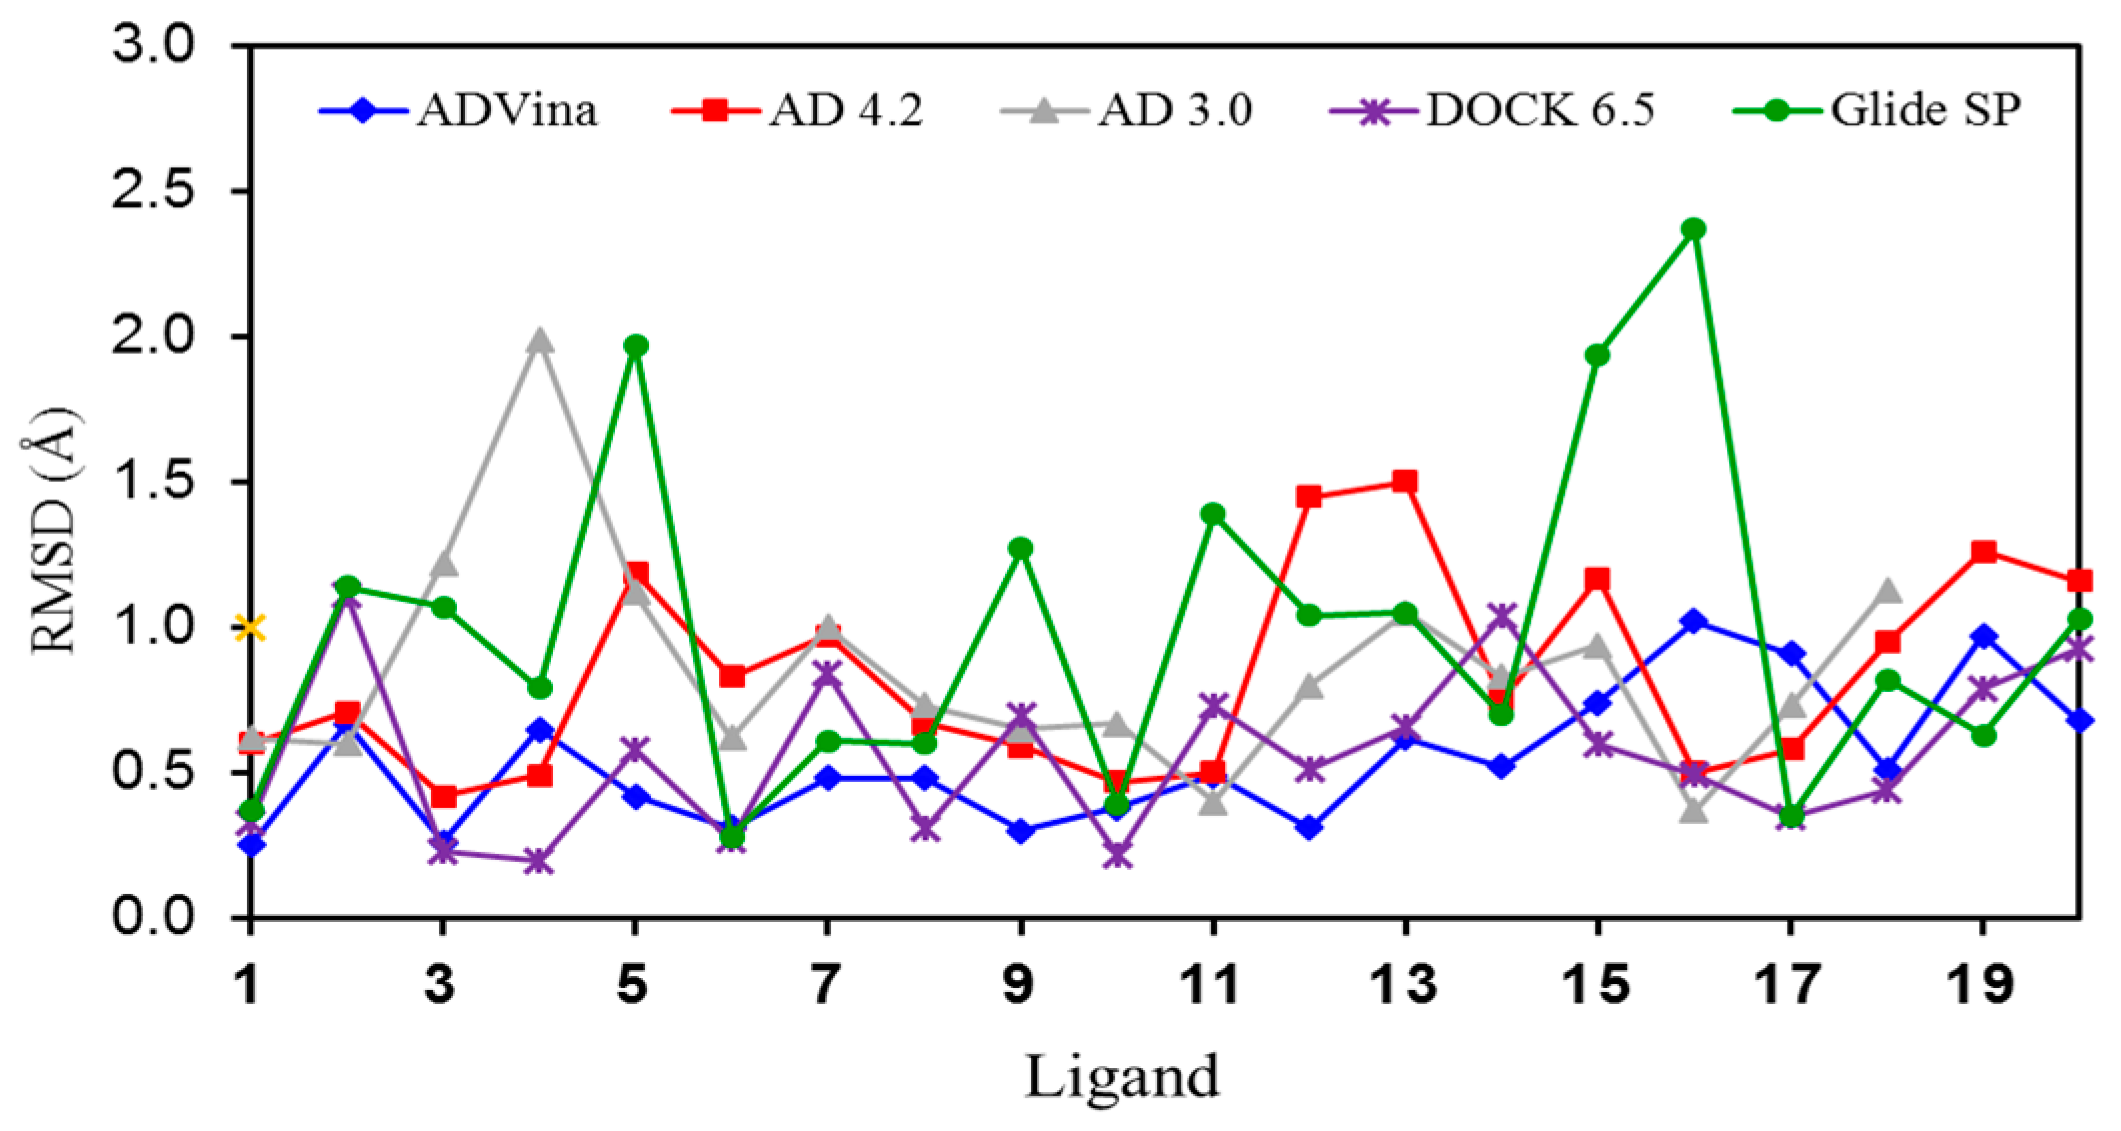
2.5. Poses with Lower RMSD Values
2.6. Re-Scoring
- (a)
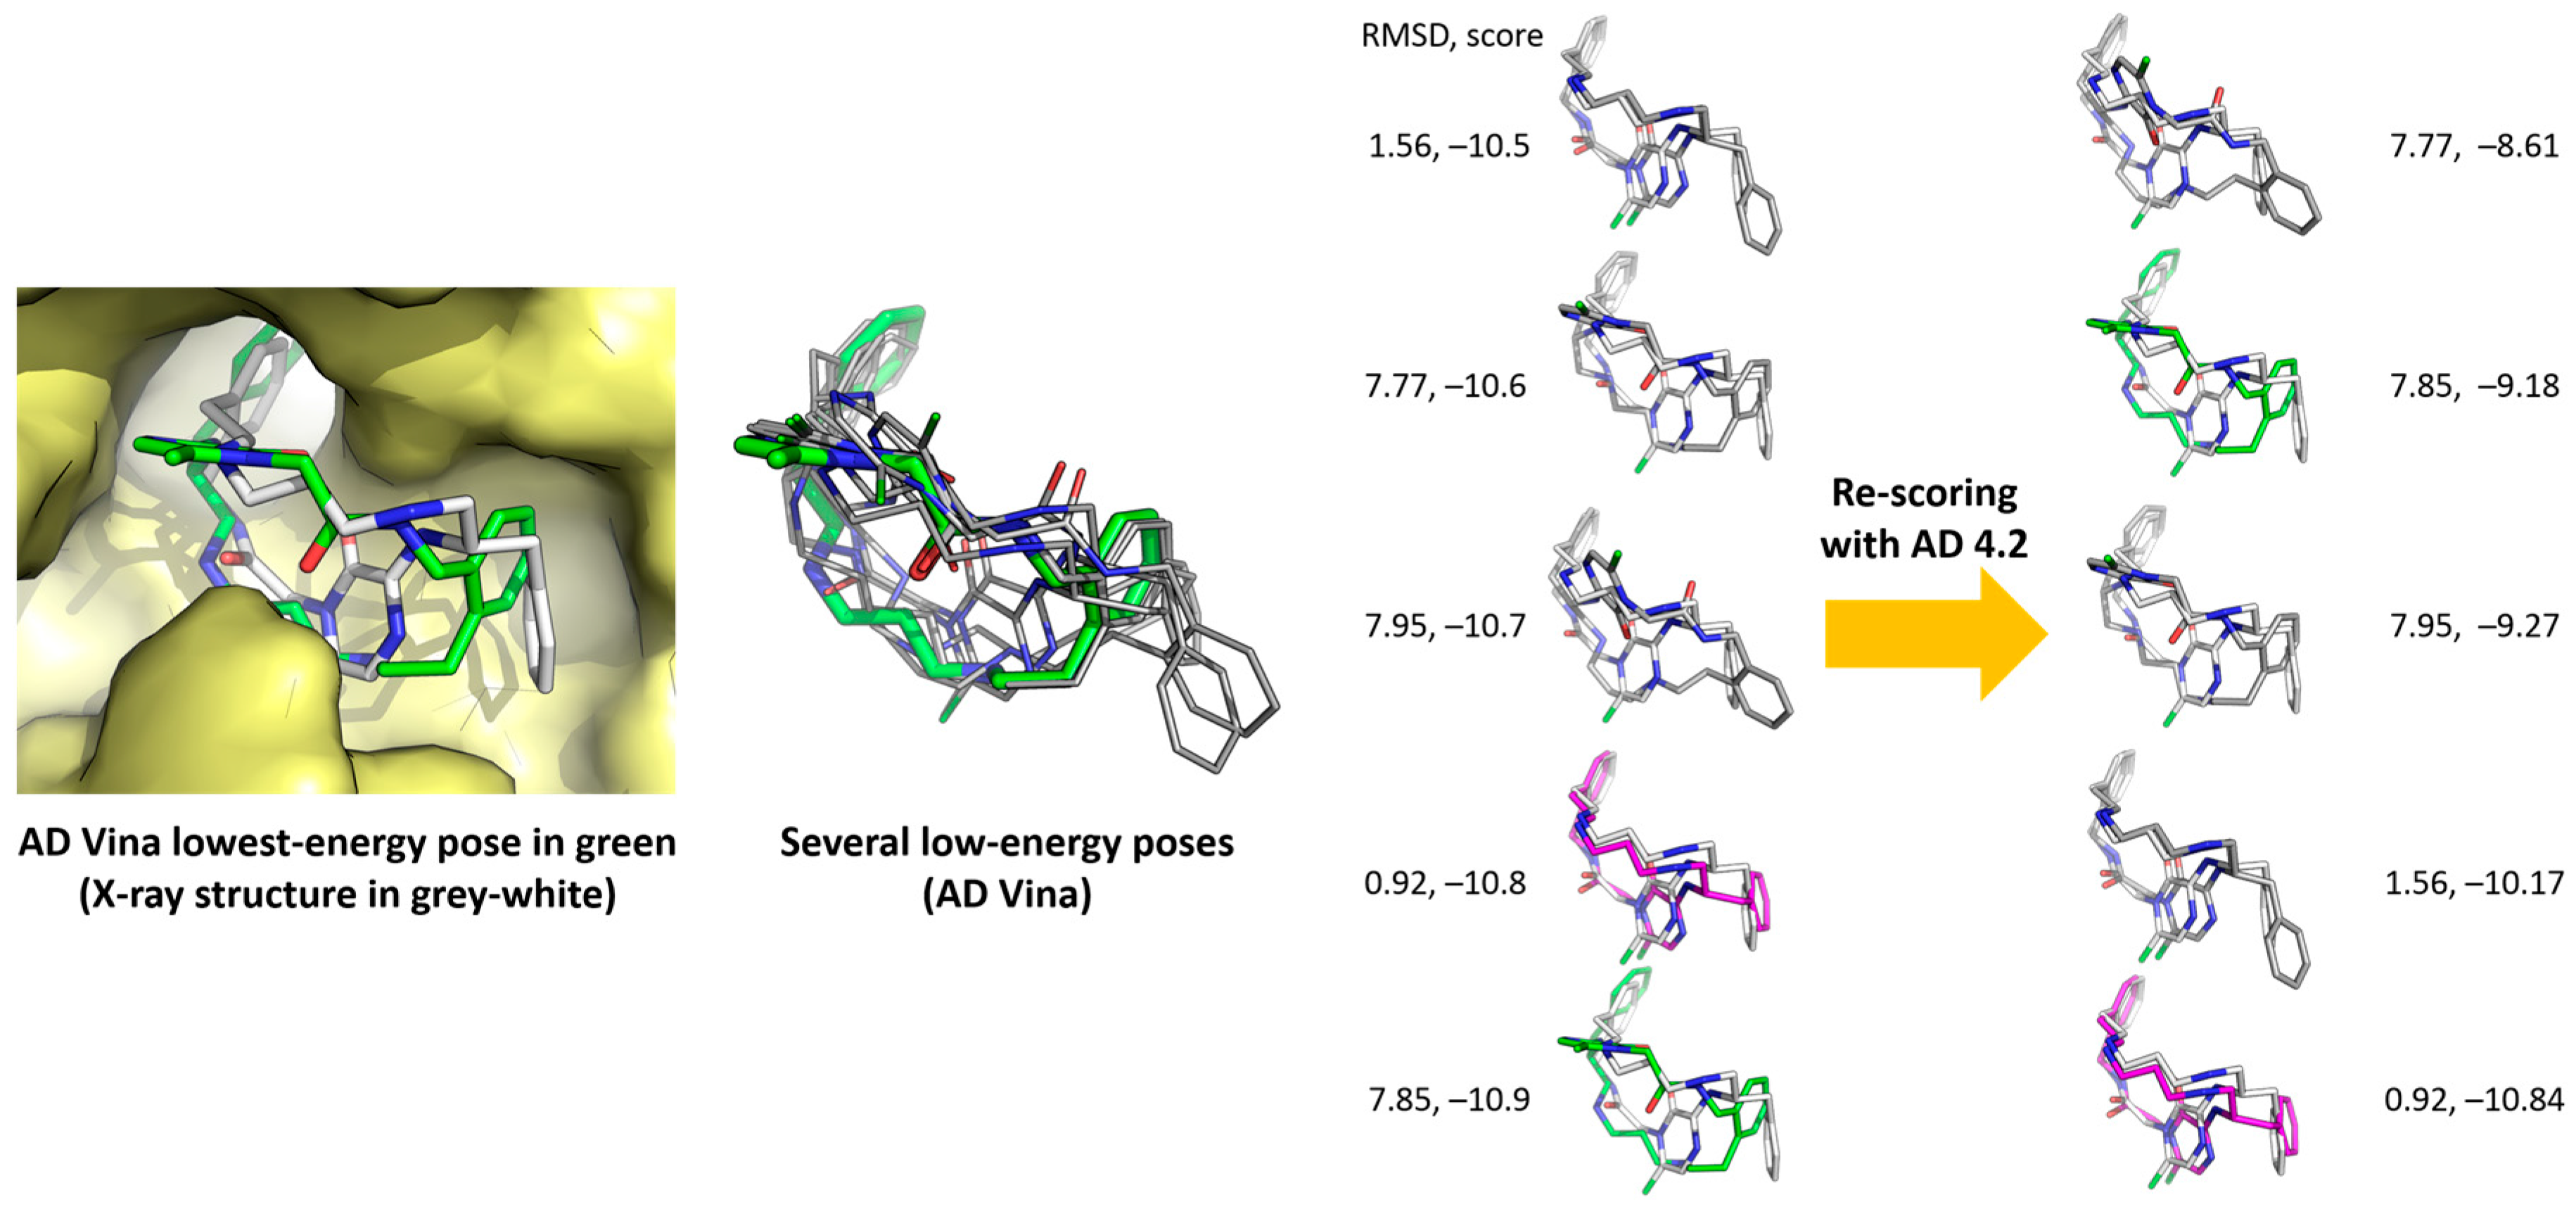
- With AD 4.2//Vina, 9 out of the 20 ligands overlap almost perfectly with their respective poses in the crystals (ligands 1, 3, 7, 8, 9, 10, 12, 17, and 18, RMSD overlap = 0.32–0.67 Å), 6 ligands can be superimposed moderately well with their crystalline structures, at least their cyclic moieties (RMSD overlap = 0.79–0.93), and there are four calculated structures that do not match sufficiently well (5, 11, 13, and 14, RMSD overlap = 1.04–1.10). The worst result is for ligand 19 (RMSD overlap = 2.14); we have no explanation for it, but the crystalline structure of the complex was poorly reproduced by most methods (see Table 2, Table 3, Table 4, Table 5 and Table 6).
- (b)
- Three poses that improved after re-scoring of DOCK with Amber (Table 6) showed values of RMSD overlap for 7, 15, and 19 equal to 0.87, 1.12, and 0.75, respectively (two match partially and one not sufficiently well, also by visual inspection).
- (c)
- For the six Glide poses re-scored with MM-GBSA (Table 6), the RMSD-overlap values were 1.13, 1.36, 0.69, 0.64, 0.73, and 0.67. In other words, three ligands (12, 13, and 19) were almost superimposable with their respective experimental structures, but there were two that did not match well. It is worth noting that 19/3UYK is better described by Glide (docking and re-scoring) than by AD 4.2 (docking and AD 4.2//Vina re-scoring, respectively).
3. Materials and Methods
3.1. Crystalline Complexes
3.2. Preparation of the Ligand Files
3.3. Conformer Calculations
3.4. Preparation of the Protein Files
3.5. Docking Algorithms
3.6. Calculations of RMSD Values
4. Conclusions
Supplementary Materials
Acknowledgments
Author Contributions
Conflicts of Interest
References
- Villar, E.A.; Beglov, D.; Chennamadhavuni, S.; Porco, J.A.; Kozakov, D.; Vajda, S.; Whitty, A. How proteins bind macrocycles. Nat. Chem. Biol. 2014, 10, 723–731. [Google Scholar] [CrossRef] [PubMed]
- Allen, S.E.; Dokholyan, N.V.; Bowers, A.A. Dynamic docking of conformationally constrained macrocycles: Methods and applications. ACS Chem. Biol. 2016, 11, 10–24. [Google Scholar] [CrossRef] [PubMed]
- Martín, M.; Mas, G.; Urpí, F.; Vilarrasa, J. High-yielding enantioselective synthesis of the macrolactam aglycon of Sch 38516 from two units of (2R)-2-ethyl-4-penten-1-ol. Angew. Chem. Int. Ed. Engl. 1999, 38, 3086–3089. [Google Scholar] [CrossRef]
- Llàcer, E.; Urpí, F.; Vilarrasa, J. Efficient approach to fluvirucins B2–B5, Sch 38518, and Sch 39185. First synthesis of their aglycon, via CM and RCM reactions. Org. Lett. 2009, 11, 3198–3201. [Google Scholar] [CrossRef] [PubMed]
- Rodríguez-Escrich, C.; Urpí, F.; Vilarrasa, J. Stereocontrolled total synthesis of amphidinolide X via a silicon-tethered metathesis reaction. Org. Lett. 2008, 10, 5191–5194. [Google Scholar] [CrossRef] [PubMed]
- Mola, L.; Olivella, A.; Urpí, F.; Vilarrasa, J. Synthesis of amphidinolide Y precursors. Tetrahedron Lett. 2014, 55, 900–902. [Google Scholar] [CrossRef]
- Andreou, T.; Costa, A.M.; Esteban, L.; Gonzalez, L.; Mas, G.; Vilarrasa, J. Synthesis of (−)-amphidinolide K fragment C9–C22. Org. Lett. 2005, 7, 4083–4086. [Google Scholar] [CrossRef] [PubMed]
- Esteban, J.; Costa, A.M.; Vilarrasa, J. Synthesis of amphidinolide E C10−C26 fragment. Org. Lett. 2008, 10, 4843–4846. [Google Scholar] [CrossRef] [PubMed]
- Sidera, M.; Costa, A.M.; Vilarrasa, J. Iododesilylation of TIPS-, TBDPS-, and TBS-substituted alkenes in connection with the synthesis of amphidinolides B/D. Org. Lett. 2011, 13, 4934–4937. [Google Scholar] [CrossRef] [PubMed]
- Carrillo, J.; Gómez, A.; Costa, A.M.; Fernández, P.; Isart, C.; Sidera, M.; Vilarrasa, J. A synthetic approach to palmerolides via Negishi cross coupling. The challenge of the C15–C16 bond formation. Tetrahedron Lett. 2014, 55, 4623–4627. [Google Scholar] [CrossRef]
- Pineda, O.; Farràs, J.; Maccari, L.; Manetti, F.; Botta, M.; Vilarrasa, J. Computational comparison of microtubule-stabilising agents laulimalide and peloruside with taxol and colchicine. Bioorg. Med. Chem. Lett. 2004, 14, 4825–4829. [Google Scholar] [CrossRef] [PubMed]
- Buey, R.M.; Calvo, E.; Barasoain, I.; Pineda, O.; Edler, M.C.; Matesanz, R.; Cerezo, G.; Vanderwal, C.D.; Day, B.W.; Sorensen, E.J.; et al. Cyclostreptin binds covalently to microtubule pores and lumenal taxoid binding sites. Nat. Chem. Biol. 2007, 3, 117–125. [Google Scholar] [CrossRef] [PubMed]
- Pera, B.; Razzak, M.; Trigili, C.; Pineda, O.; Canales, A.; Buey, R.M.; Jiménez-Barbero, J.; Northcote, P.T.; Paterson, I.; Barasoain, I.; et al. Molecular recognition of peloruside A by microtubules. The C24 primary alcohol is essential for biological activity. ChemBioChem 2010, 11, 1669–1678. [Google Scholar] [CrossRef] [PubMed]
- Trigili, C.; Pera, B.; Barbazanges, M.; Cossy, J.; Meyer, C.; Pineda, O.; Rodríguez-Escrich, C.; Urpí, F.; Vilarrasa, J.; Díaz, J.F.; et al. Mechanism of action of the cytotoxic macrolides amphidinolide X and J. ChemBioChem 2011, 12, 1027–1030. [Google Scholar] [CrossRef] [PubMed]
- Calvo, E.; Barasoain, I.; Matesanz, R.; Pera, B.; Camafeita, E.; Pineda, O.; Hamel, E.; Vanderwal, C.D.; Andreu, J.M.; López, J.A.; et al. Cyclostreptin derivatives specifically target cellular tubulin and further map the paclitaxel site. Biochemistry 2012, 51, 329–341. [Google Scholar] [CrossRef] [PubMed]
- Chen, Y.-C. Beware of docking! Trends Pharmacol. Sci. 2015, 36, 78–95. [Google Scholar] [CrossRef] [PubMed]
- Grinter, S.Z.; Zou, X. Challenges, applications, and recent advances of protein-ligand docking in structure-based drug design. Molecules 2014, 19, 10150–10176. [Google Scholar] [CrossRef] [PubMed]
- Sousa, S.F.; Ribeiro, A.J.M.; Coimbra, J.T.S.; Neves, R.P.P.; Martins, S.A.; Moorthy, N.S.H.N.; Fernandes, P.A.; Ramos, M.J. Protein-ligand docking in the new millennium—A retrospective of 10 years in the field. Curr. Med. Chem. 2013, 20, 2296–2314. [Google Scholar] [CrossRef] [PubMed]
- Yuriev, E.; Ramsland, P.A. Latest developments in molecular docking: 2010–2011 in review. J. Mol. Recognit. 2013, 26, 215–239. [Google Scholar] [CrossRef] [PubMed]
- Plewczynski, D.; Łaźniewski, M.; Augustyniak, R.; Ginalski, K. Can we trust docking results? Evaluation of seven commonly used programs on PDBbind database. J. Comput. Chem. 2011, 32, 742–755. [Google Scholar] [CrossRef] [PubMed]
- Biesiada, J.; Porollo, A.; Velayutham, P.; Kouril, M.; Meller, J. Survey of public domain software for docking simulations and virtual screening. Hum. Genom. 2011, 5, 497–505. [Google Scholar] [CrossRef]
- Yuriev, E.; Agostino, M.; Ramsland, P.A. Challenges and advances in computational docking: 2009 in review. J. Mol. Recognit. 2011, 24, 149–164. [Google Scholar] [CrossRef] [PubMed]
- Huang, S.-Y.; Zou, X. Advances and challenges in protein–ligand docking. Int. J. Mol. Sci. 2010, 11, 3016–3034. [Google Scholar] [CrossRef] [PubMed]
- Li, X.; Li, Y.; Cheng, T.; Liu, Z.; Wang, R. Evaluation of the performance of four molecular docking programs on a diverse set of protein-ligand complexes. J. Comput. Chem. 2010, 31, 2109–2125. [Google Scholar] [CrossRef] [PubMed]
- Cross, J.B.; Thompson, D.C.; Rai, B.K.; Baber, J.C.; Fan, K.Y.; Hu, Y.; Humblet, C. Comparison of several molecular docking programs: Pose prediction and virtual screening accuracy. J. Chem. Inf. Model. 2009, 49, 1455–1474. [Google Scholar] [CrossRef] [PubMed]
- Kirchmair, J.; Markt, P.; Distinto, S.; Wolber, G.; Langer, T. Evaluation of the performance of 3D virtual screening protocols: RMSD comparisons, enrichment assessments, and decoy selection—What can we learn from earlier mistakes? J. Comput. Aided Mol. Des. 2008, 22, 213–228. [Google Scholar] [CrossRef] [PubMed]
- Onodera, K.; Satou, K.; Hirota, H. Evaluations of molecular docking programs for virtual screening. J. Chem. Inf. Model. 2007, 47, 1609–1618. [Google Scholar] [CrossRef] [PubMed]
- Morris, G.M.; Goodsell, D.S.; Halliday, R.S.; Huey, R.; Hart, W.E.; Belew, R.K.; Olson, A.J. Automated docking using a Lamarckian genetic algorithm and an empirical binding free energy function. J. Comput. Chem. 1998, 19, 1639–1662. [Google Scholar] [CrossRef]
- Morris, G.M.; Huey, R.; Lindstrom, W.; Sanner, M.F.; Belew, R.K.; Goodsell, D.S.; Olson, A.J. AutoDock4 and AutoDockTools4: Automated docking with selective receptor flexibility. J. Comput. Chem. 2009, 30, 2785–2791. [Google Scholar] [CrossRef] [PubMed]
- Trott, O.; Olson, A.J. AutoDock Vina: Improving the speed and accuracy of docking with a new scoring function, efficient optimization, and multithreading. J. Comput. Chem. 2010, 31, 455–461. [Google Scholar] [CrossRef] [PubMed]
- Ng, M.C.K.; Fong, S.; Siu, S.W.I. PSOVina: The hybrid particle swarm optimization algorithm for protein–ligand docking. J. Bioinform. Comput. Biol. 2015, 13, 1541007. [Google Scholar] [CrossRef] [PubMed]
- Lang, P.T.; Brozell, S.R.; Mukherjee, S.; Pettersen, E.F.; Meng, E.C.; Thomas, V.; Rizzo, R.C.; Case, D.A.; James, T.L.; Kuntz, I.D. DOCK 6: Combining techniques to model RNA-small molecule complexes. RNA 2009, 15, 1219–1230. [Google Scholar] [CrossRef] [PubMed]
- Glide; Version 5.9; Schrödinger, LLC: New York, NY, USA, 2013.
- Jogalekar, A.S.; Damodaran, K.; Kriel, F.H.; Jung, W.-H.; Alcaraz, A.A.; Zhong, S.; Curran, D.P.; Snyder, J.P. Dictyostatin flexibility bridges conformations in solution and in the β-tubulin taxane binding site. J. Am. Chem. Soc. 2011, 133, 2427–2436. [Google Scholar] [CrossRef] [PubMed]
- Davis, I.W.; Baker, D. RosettaLigand docking with full ligand and receptor flexibility. J. Mol. Biol. 2009, 385, 381–392. [Google Scholar] [CrossRef] [PubMed]
- Fage, C.D.; Isiorho, E.A.; Liu, Y.; Wagner, D.T.; Liu, H.; Keatinge-Clay, A.T. The structure of SpnF, a standalone enzyme that catalyzes [4 + 2] cycloaddition. Nat. Chem. Biol. 2015, 11, 256–258. [Google Scholar] [CrossRef] [PubMed]
- Anighoro, A.; de la Vega de León, A.; Bajorath, J. Predicting bioactive conformations and binding modes of macrocycles. J. Comput. Aided Mol. Des. 2016, 30, 841–849. [Google Scholar] [CrossRef] [PubMed]
- Hawkins, P.C.D.; Kelley, B.P.; Warren, G.L. The application of statistical methods of cognate docking: A path forward? J. Chem. Inf. Mod. 2014, 54, 1339–1355. [Google Scholar] [CrossRef] [PubMed]
- Bjerrum, E.J. Machine learning optimization of cross docking accuracy. Comput. Biol. Chem. 2016, 62, 133–144. [Google Scholar] [CrossRef] [PubMed]
- Vadivelu, A.; Gopal, V.; Reddy, C.U.M. Molecular docking studies of 1,3,4-thiadiazoles as novel peptide deformylase inhibitors as potential antibacterial agents. Int. J. Pharm. Sci. Rev. Res. 2015, 31, 58–62. [Google Scholar]
- Li, H.; Leung, K.-S.; Wong, M.-H.; Ballester, P.J. Improving AutoDock Vina using random forest: The growing accuracy of binding affinity prediction by the effective exploitation of larger data sets. Mol. Inform. 2015, 34, 115–126. [Google Scholar] [CrossRef] [PubMed]
- Greenidge, P.A.; Kramer, C.; Mozziconacci, J.-C.; Sherman, W. Improving docking results via reranking of ensembles of ligand poses in multiple X-ray protein conformations with MM-GBSA. J. Chem. Inf. Model. 2014, 54, 2697–2717. [Google Scholar] [CrossRef] [PubMed]
- Durrant, J.D.; Friedman, A.J.; Rogers, K.E.; McCammon, J.A. Comparing neural-network scoring functions and the state of the art: Applications to common library screening. J. Chem. Inf. Model. 2013, 53, 1726–1735. [Google Scholar] [CrossRef] [PubMed]
- Anighoro, A.; Rastelli, G. BEAR, a molecular docking refinement and rescoring method. Comput. Mol. Biosci. 2013, 3, 27–31. [Google Scholar] [CrossRef]
- Çifci, G.; Aviyente, V.; Akten, E.D. Molecular docking study based on pharmacophore modeling for novel phosphodiesterase IV inhibitors. Mol. Inform. 2012, 31, 459–471. [Google Scholar] [CrossRef] [PubMed]
- Kukol, A. Consensus virtual screening approaches to predict protein ligands. Eur. J. Med. Chem. 2011, 46, 4661–4664. [Google Scholar] [CrossRef] [PubMed]
- Wang, R.; Lu, Y.; Wang, S. Comparative evaluation of 11 scoring functions for molecular docking. J. Med. Chem. 2003, 46, 2287–2303. [Google Scholar] [CrossRef] [PubMed]
- Hawkins, G.D.; Cramer, C.J.; Truhlar, D.G. Parametrized models of aqueous free energies of solvation based on pairwise descreening of solute atomic charges from a dielectric medium. J. Phys. Chem. 1996, 100, 19824–19839. [Google Scholar] [CrossRef]
- Tsui, V.; Case, D.A. Theory and applications of the generalized born solvation model in macromolecular simulations. Biopolymers 2000, 56, 275–291. [Google Scholar] [CrossRef]
- Graves, A.P.; Shivakumar, D.M.; Boyce, S.E.; Jacobson, M.P.; Case, D.A.; Shoichet, B.K. Rescoring docking hit lists for model cavity sites: Predictions and experimental testing. J. Mol. Biol. 2008, 377, 914–934. [Google Scholar] [CrossRef] [PubMed]
- Friesner, R.A.; Murphy, R.B.; Repasky, M.P.; Frye, L.L.; Greenwood, J.R.; Halgren, T.A.; Sanschagrin, P.C.; Mainz, D.T. Extra precision glide: Docking and scoring incorporating a model of hydrophobic enclosure for protein-ligand complexes. J. Med. Chem. 2006, 49, 6177–6196. [Google Scholar] [CrossRef] [PubMed]
- PRIME MM-GBSA. Available online: https://www.schrodinger.com/kb/1484 (accessed on 4 March 2016, demo version).
- Sadowski, J.; Gasteiger, J.; Klebe, G. Comparison of automatic three-dimensional model builders using 639 X-ray structures. J. Chem. Inf. Model. 1994, 34, 1000–1008. [Google Scholar] [CrossRef]
- LigPrep. Available online: https://www.schrodinger.com/ligprep (accessed on 4 March 2016, demo version).
- MacroModel; Version 10.0; Schrödinger: New York, NY, USA, 2013.
- Chen, I.-J.; Foloppe, N. Tackling the conformational sampling of larger flexible compounds and macrocycles in pharmacology and drug discovery. Bioorg. Med. Chem. 2013, 21, 7898–7920. [Google Scholar] [CrossRef] [PubMed]
- Watts, K.S.; Dalal, P.; Tebben, A.J.; Cheney, D.L.; Shelley, J.C. Macrocycle conformational sampling with MacroModel. J. Chem. Inf. Model. 2014, 54, 2680–2696. [Google Scholar] [CrossRef] [PubMed]
- Pettersen, E.F.; Goddard, T.D.; Huang, C.C.; Couch, G.S.; Greenblatt, D.M.; Meng, E.C.; Ferrin, T.E. UCSF Chimera visualization system for exploratory research and analysis. J. Comput. Chem. 2004, 25, 1605–1612. [Google Scholar] [CrossRef] [PubMed]
- Sample Availability: Not available.


| AD Vina | AD 4.2 | AD 3.0 | DOCK | Glide | |||||||
|---|---|---|---|---|---|---|---|---|---|---|---|
| RMSD | Score | RMSD | Score | RMSD | Score | RMSD | Score | RMSD | Score | ||
| 1 | 1ESV | 0.25 | −10.8 | 0.60 | −8.52 | 0.62 | −10.40 | 0.33 | −67.42 | 0.37 | −7.84 |
| 2 | 1FKD | 0.67 | −11.3 | 0.71 | −11.10 | 0.66 | −12.38 | 1.11 | −61.33 | 1.14 | −6.95 |
| 3 | 1NM6 | 0.26 | −12.8 | 0.42 | −12.79 | 1.22 | −12.24 | 0.23 | −88.46 | 1.07 | −11.32 |
| 4 | 1NT1 | 0.65 | −13.3 | 0.49 | −13.50 | 1.99 | −6.89 | 0.20 | −85.14 | 0.79 | −9.68 |
| 5 | 1PKF | 0.42 | −13.7 | 1.19 | −12.73 | 1.12 | −13.67 | 0.58 | −77.96 | 1.97 | −8.32 |
| 6 | 1R8Q | 0.31 | −12.6 | 0.83 | −10.66 | 0.62 | −11.69 | 0.27 | −65.97 | 0.28 | −11.73 |
| 7 | 1UU3 | 0.48 | −11.9 | 0.97 | −11.69 | 1.00 | −12.88 | 0.84 | −84.54 | 0.61 | −10.27 |
| 8 | 1W96 | 0.48 | −11.7 | 0.67 | −12.03 | 0.73 | −13.92 | 0.31 | −95.40 | 0.60 | −8.86 |
| 9 | 2C6H | 0.30 | −11.1 | 0.59 | −9.99 | 0.65 | −12.36 | 0.70 | −79.95 | 1.27 | −6.61 |
| 10 | 2E9U | 0.38 | −10.2 | 0.47 | −9.10 | 0.67 | −10.20 | 0.22 | −67.52 | 0.39 | −8.68 |
| 11 | 2IYA | 0.49 | −13.2 | 0.50 | −11.60 | 0.40 | −14.73 | 0.73 | −84.69 | 1.39 | −9.37 |
| 12 | 2VWC | 0.31 | −9.4 | 1.45 | −9.15 | 0.80 | −10.43 | 0.51 | −78.13 | 1.04 | −6.94 |
| 13 | 2XBK | 0.62 | −18.5 | 1.50 | −15.23 | 1.05 | −18.33 | 0.66 | −115.34 | 1.05 | −11.64 |
| 14 | 2XX5 | 0.52 | −11.3 | 0.75 | −10.58 | 0.83 | −8.92 | 1.04 | −73.64 | 0.70 | −8.84 |
| 15 | 3DV1 | 0.74 | −10.9 | 1.17 | −11.57 | 0.94 | −14.29 | 0.60 | −94.39 | 1.94 | −9.25 |
| 16 | 3DV5 | 1.02 | −11.6 | 0.50 | −15.36 | 0.37 | −17.22 | 0.49 | −113.99 | 2.37 b | −8.20 |
| 17 | 3EKS | 0.91 | −11.5 | 0.58 | −11.77 | 0.73 | −12.06 | 0.35 | −75.36 | 0.35 | −10.00 |
| 18 | 3QTF | 0.51 | −13.3 | 0.95 | −10.88 | 1.13 | −12.57 | 0.44 | −78.45 | 0.82 | −11.53 |
| 19 | 3UYK | 0.97 | −10.7 | 1.26 | −10.03 | 1.39 | −10.76 | 0.79 | −55.11 | 0.63 | −7.92 |
| 20 | 4DRU | 0.68 | −13.1 | 1.16 | −12.99 | 1.16 | −12.92 | 0.93 | −71.69 | 1.03 | −8.78 |
| mean | 0.55 ± 0.05 | 0.84 ± 0.08 | 0.90 ± 0.08 | 0.57 ± 0.06 | 0.99 ± 0.13 | ||||||
| SD | 0.23 | 0.34 | 0.37 | 0.28 | 0.57 | ||||||
| median | 0.50 | 0.73 | 0.82 | 0.55 | 0.93 | ||||||
| No. Conf. | AD Vina | AD 4.2 | AD 3.0 | DOCK | Glide | |||||||
|---|---|---|---|---|---|---|---|---|---|---|---|---|
| RMSD | Score | RMSD | Score | RMSD | Score | RMSD | Score | RMSD | Score | |||
| 1 | 1ESV | 73 | 0.47 | −10.7 | 0.72 | −9.47 | 1.04 | −11.56 | 0.59 | −61.98 | 0.62 | −8.44 |
| 2 | 1FKD | 315 | 1.55 | −9.1 | 1.09 | −10.29 | 2.62 | −9.89 | 0.86 | −71.40 | 1.45 | −7.00 |
| 3 | 1NM6 | 531 | 7.85 | −10.9 | 0.89 | −12.17 | 5.28 | −10.67 | 8.44 | −71.02 | 0.44 | −10.20 |
| 4 | 1NT1 | 246 | 1.28 | −13.2 | 1.33 | −12.53 | 3.63 | −11.50 | 1.66 | −67.53 | 0.61 | −11.43 |
| 5 | 1PKF | 412 | 1.05 | −13.3 | 1.59 | −13.56 | 5.41 | −14.72 | 0.67 | −78.59 | 2.03 | −8.86 |
| 6 | 1R8Q | 109 | 0.50 | −11.5 | 1.23 | −10.43 | 5.28 | −11.92 | 0.44 | −63.66 | 0.38 | −11.66 |
| 7 | 1UU3 | 38 | 1.00 | −10.9 | 1.27 | −11.16 | 5.77 | −11.40 | 1.64 | −83.79 | 0.78 | −10.58 |
| 8 | 1W96 | 278 | 0.45 | −11.7 | 0.69 | −12.27 | 0.64 | −12.66 | 0.41 | −86.84 | 0.52 | −8.92 |
| 9 | 2C6H | 69 | 0.58 | −10.9 | 3.94 | −9.86 | 1.49 | −11.83 | 0.75 | −84.40 | 1.17 | −7.02 |
| 10 | 2E9U | 36 | 0.82 | −10.9 | 0.79 | −8.98 | 0.91 | −10.12 | 1.06 | −60.40 | 0.36 | −8.75 |
| 11 | 2IYA | 265 | 0.62 | −11.8 | 0.98 | −16.08 | 1.15 | −14.82 | 0.94 | −99.18 | 1.39 | −9.99 |
| 12 | 2VWC | 60 | 0.70 | −9.8 | 0.79 | −9.36 | 0.79 | −10.87 | 0.59 | −76.21 | 5.36 | −6.15 |
| 13 | 2XBK | 373 | 1.09 | −16.3 | 1.72 | −19.73 | 1.39 | −18.66 | 0.65 | −111.52 | 1.12 | −12.84 |
| 14 | 2XX5 | 422 | 1.14 | −11.3 | 6.41 | −11.49 | 5.47 | −9.68 | 1.24 | −73.53 | 1.15 | −8.96 |
| 15 | 3DV1 | 1106 | 0.90 | −11.4 | 1.14 | −13.05 | 1.29 | −13.48 | 1.03 | −96.73 | 1.14 | −10.68 |
| 16 | 3DV5 | 1402 | 0.92 | −12.4 | 1.10 | −14.39 | 0.76 | −16.47 | 0.56 | −102.58 | 1.94 | −8.04 |
| 17 | 3EKS | 17 | 0.61 | −10.8 | 0.71 | −12.97 | 0.61 | −12.37 | 0.64 | −70.42 | 0.67 | −10.02 |
| 18 | 3QTF | 24 | 0.94 | −13.4 | 1.28 | −11.59 | 1.75 | −13.73 | 0.59 | −74.86 | 0.94 | −11.62 |
| 19 | 3UYK | 78 | 2.23 | −10.0 | 4.88 | −10.57 | 5.30 | −10.78 | 2.30 | −52.57 | 2.33 | −7.46 |
| 20 | 4DRU | 50 | 1.50 | −13.1 | 1.31 | −12.56 | 1.82 | −12.90 | 1.64 | −77.54 | 1.44 | −8.23 |
| mean | 1.31 ± 0.36 | 1.69 ± 0.34 | 2.62 ± 0.45 | 1.34 ± 0.39 | 1.29 ± 0.25 | |||||||
| SD | 1.60 | 1.54 | 2.01 | 1.75 | 1.11 | |||||||
| median | 0.93 | 1.19 | 1.62 | 0.81 | 1.13 | |||||||
| mean corr. b | 0.90 ± 0.08 | 1.09 ± 0.07 | 0.94 ± 0.10 | 0.95 ± 0.11 | ||||||||
| No. of Conform. | AD Vina | PSOVina | ||||||
|---|---|---|---|---|---|---|---|---|
| RMSD | Score | Time | RMSD | Score | Time | |||
| 1 | 1ESV | 73 | 0.47 | −10.7 | 8 min | 0.47 | −10.71 | 5 min |
| 5 | 1PKF | 412 | 1.05 | −13.3 | 71 min | 1.04 | −13.26 | 52 min |
| 6 | 1R8Q | 109 | 0.50 | −11.5 | 11 min | 0.48 | −11.50 | 8 min |
| 8 | 1W96 | 278 | 0.45 | −11.7 | 66 min | 0.45 | −11.72 | 50 min |
| 9 | 2C6H | 69 | 0.58 | −10.9 | 11 min | 0.58 | −10.85 | 15 min |
| 11 | 2IYA | 265 | 0.62 | −11.8 | 180 min | 0.96 | −11.86 | 85 min |
| 13 | 2XBK | 373 | 1.09 | −16.3 | 225 min | 1.10 | −16.24 | 101 min |
| 19 | 3UYK | 78 | 2.23 | −10.0 | 6 min | 2.25 | −10.01 | 10 min |
| mean | 0.87 ± 0.21 | 0.92 ± 0.21 | ||||||
| SD | 0.60 | 0.60 | ||||||
| median | 0.60 | 0.77 | ||||||
| No. Conf. | AD Vina | AD 4.2 | AD 3.0 | DOCK | Glide | ||||||||||||
|---|---|---|---|---|---|---|---|---|---|---|---|---|---|---|---|---|---|
| RMSD | Score | Pose a | RMSD | Score | Pose | RMSD | Score | Pose | RMSD | Score | Pose | RMSD | Score | Pose | |||
| 1 | 1ESV | 73 | 0.47 | −10.7 | 1 | 0.61 | −9.29 | 5 | 0.82 | −11.24 | 4 | 0.59 | −61.98 | 1 | 0.36 | −8.31 | 3 |
| 2 | 1FKD | 315 | 1.04 | −9.0 | 2 | 1.09 | −10.29 | 1 | 1.63 | −9.12 | 5 | 0.86 | −71.40 | 1 | 1.12 | −6.94 | 6 |
| 3 | 1NM6 | 531 | 0.92 | −10.8 | 3 | 0.89 | −12.17 | 1 | 2.34 | −10.10 | 3 | 2.31 | −67.63 | 7 | 0.44 | −10.20 | 1 |
| 4 | 1NT1 | 246 | 1.28 | −13.2 | 1 | 0.85 | −11.63 | 9 | 2.90 | −11.18 | 4 | 1.66 | −67.53 | 1 | 0.48 | −11.14 | 2 |
| 5 | 1PKF | 412 | 0.58 | −12.8 | 9 | 1.20 | −13.05 | 8 | 2.07 | −14.18 | 8 | 0.67 | −78.59 | 1 | 2.03 | −8.86 | 1 |
| 6 | 1R8Q | 109 | 0.50 | −11.5 | 1 | 0.84 | −10.31 | 3 | 0.75 | −11.52 | 7 | 0.44 | −63.66 | 1 | 0.38 | −11.66 | 1 |
| 7 | 1UU3 | 38 | 1.00 | −10.9 | 1 | 1.27 | −11.16 | 1 | 1.00 | −11.07 | 5 | 1.14 | −79.11 | 4 | 0.78 | −10.58 | 1 |
| 8 | 1W96 | 278 | 0.45 | −11.7 | 1 | 0.69 | −12.27 | 1 | 0.64 | −12.66 | 1 | 0.41 | −86.84 | 1 | 0.52 | −8.92 | 1 |
| 9 | 2C6H | 69 | 0.56 | −10.8 | 2 | 0.79 | −9.69 | 5 | 0.88 | −11.46 | 5 | 0.75 | −84.40 | 1 | 0.82 | −6.85 | 15 |
| 10 | 2E9U | 36 | 0.82 | −10.9 | 1 | 0.79 | −8.98 | 1 | 0.91 | −10.12 | 1 | 1.06 | −60.40 | 1 | 0.36 | −8.75 | 1 |
| 11 | 2IYA | 265 | 0.52 | −11.7 | 5 | 0.98 | −16.08 | 1 | 0.53 | −14.64 | 4 | 0.94 | −99.18 | 1 | 1.39 | −9.99 | 1 |
| 12 | 2VWC | 60 | 0.70 | −9.8 | 1 | 0.79 | −9.36 | 1 | 0.79 | −10.87 | 1 | 0.59 | −76.21 | 1 | 5.36 c | −6.15 | 1 |
| 13 | 2XBK | 373 | 0.66 | −16.2 | 3 | 1.72 | −19.73 | 1 | 1.39 | −18.66 | 1 | 0.65 | −111.52 | 1 | 0.80 | −12.74 | 4 |
| 14 | 2XX5 | 422 | 0.77 | −10.8 | 5 | 1.74 | −10.42 b | 43 | 4.81 | −9.59 | 8 | 1.24 | −73.53 | 1 | 0.91 | −8.91 | 4 |
| 15 | 3DV1 | 1106 | 0.90 | −11.4 | 1 | 0.92 | −12.80 | 6 | 1.29 | −13.48 | 1 | 0.86 | −95.70 | 8 | 1.14 | −10.68 | 1 |
| 16 | 3DV5 | 1402 | 0.92 | −12.4 | 1 | 0.67 | −14.14 | 8 | 0.76 | −16.47 | 1 | 0.56 | −102.58 | 1 | 1.94 | −8.04 | 1 |
| 17 | 3EKS | 17 | 0.61 | −10.8 | 1 | 0.71 | −12.97 | 1 | 0.61 | −12.37 | 1 | 0.45 | −69.80 | 4 | 0.31 | −10.00 | 2 |
| 18 | 3QTF | 24 | 0.56 | −13.3 | 2 | 0.81 | −11.14 | 9 | 1.75 | −13.73 | 1 | 0.59 | −74.86 | 1 | 0.52 | −10.97 | 3 |
| 19 | 3UYK | 78 | 2.23 | −10.0 | 1 | 1.56 | −9.77 | 10 | 1.57 | −10.24 | 5 | 1.57 | −49.93 | 15 | 1.69 | −7.45 | 2 |
| 20 | 4DRU | 50 | 1.07 | −12.9 | 5 | 1.31 | −12.56 | 1 | 1.82 | −12.90 | 1 | 1.30 | −76.28 | 3 | 1.44 | −8.23 | 1 |
| mean | 0.83 ± 0.09 | 0.97 ± 0.08 | 1.46 ± 0.22 | 0.93 ± 0.11 | 0.92 ± 0.25 | ||||||||||||
| SD | 0.39 | 0.34 | 0.99 | 0.48 | 0.54 | ||||||||||||
| median | 0.74 | 0.87 | 1.15 | 0.81 | 0.81 | ||||||||||||
| AD 4.2 (Table 4) | AD 4.2//Vina | ||||||
|---|---|---|---|---|---|---|---|
| RMSD | Score | Pose | RMSD | Score | Pose | ||
| 1 | 1ESV | 0.61 | −9.29 | 5 | 0.47 | −8.68 | 1 |
| 2 | 1FKD | 1.09 | −10.29 | 1 | 1.20 | −8.79 | 1 |
| 3 | 1NM6 | 0.89 | −12.17 | 1 | 0.92 | −10.84 | 1 |
| 4 | 1NT1 | 0.85 | −11.63 | 9 | 1.28 | −12.20 | 1 |
| 5 | 1PKF | 1.20 | −13.05 | 8 | 1.23 | −12.66 | 1 |
| 6 | 1R8Q | 0.84 | −10.31 | 3 | 0.98 | −9.90 | 1 |
| 7 | 1UU3 | 1.27 | −11.16 | 1 | 1.00 | −11.51 | 1 |
| 8 | 1W96 | 0.69 | −12.27 | 1 | 0.45 | −12.07 | 1 |
| 9 | 2C6H | 0.79 | −9.69 | 5 | 0.58 | −10.15 | 1 |
| 10 | 2E9U | 0.79 | −8.98 | 1 | 0.82 | −8.70 | 1 |
| 11 | 2IYA | 0.98 | −16.08 | 1 | 1.23 | −14.99 | 1 |
| 12 | 2VWC | 0.79 | −9.36 | 1 | 0.70 | −9.27 | 1 |
| 13 | 2XBK | 1.72 | −19.73 | 1 | 1.19 | −17.10 | 1 |
| 14 | 2XX5 | 1.74 | −10.42 | 43 | 1.59 | −10.52 | 4 |
| 15 | 3DV1 | 0.92 | −12.80 | 6 | 0.97 | −12.45 | 1 |
| 16 | 3DV5 | 0.67 | −14.14 | 8 | 1.05 | −13.92 | 1 |
| 17 | 3EKS | 0.71 | −12.97 | 1 | 1.14 | −12.44 | 1 |
| 18 | 3QTF | 0.81 | −11.14 | 9 | 0.98 | −11.99 | 1 |
| 19 | 3UYK | 1.56 | −9.77 | 10 | 2.23 | −9.36 | 1 |
| 20 | 4DRU | 1.31 | −12.56 | 1 | 1.07 | −13.20 | 1 |
| mean | 0.97 ± 0.08 | 1.05 ± 0.09 | |||||
| SD | 0.34 | 0.39 | |||||
| median | 0.87 | 1.03 | |||||
| DOCK 6.5 | |||||
| Re-Scoring | Re-Scoring | ||||
| RMSD | GBSA | RMSD | Amber | ||
| 7 | 1UU3 | 1.69 | −77.37 | 1.10 | −58.20 |
| 15 | 3DV1 | 1.44 | −70.39 | 1.42 | −40.49 |
| 19 | 3UYK | 2.30 | −43.23 | 1.39 | −41.89 |
| Glide | |||||
| Re-Scoring | Re-Scoring | ||||
| RMSD | XP | RMSD | MM-GBSA | ||
| 2 | 1FKD | 1.35 | −9.15 | 1.47 | −108.69 |
| 9 | 2C6H | 1.11 | −7.00 | 1.49 | −113.55 |
| 12 | 2VWC | 0.95 | −6.80 | 0.95 | −91.98 |
| 13 | 2XBK | 1.04 | −14.54 | 0.83 | −153.96 |
| 14 | 2XX5 | 1.10 | −10.13 | 1.10 | −97.36 |
| 19 | 3UYK | 1.93 | −12.30 | 1.71 | −90.04 |
© 2017 by the authors. Licensee MDPI, Basel, Switzerland. This article is an open access article distributed under the terms and conditions of the Creative Commons Attribution (CC-BY) license ( http://creativecommons.org/licenses/by/4.0/).
Share and Cite
Castro-Alvarez, A.; Costa, A.M.; Vilarrasa, J. The Performance of Several Docking Programs at Reproducing Protein–Macrolide-Like Crystal Structures. Molecules 2017, 22, 136. https://doi.org/10.3390/molecules22010136
Castro-Alvarez A, Costa AM, Vilarrasa J. The Performance of Several Docking Programs at Reproducing Protein–Macrolide-Like Crystal Structures. Molecules. 2017; 22(1):136. https://doi.org/10.3390/molecules22010136
Chicago/Turabian StyleCastro-Alvarez, Alejandro, Anna M. Costa, and Jaume Vilarrasa. 2017. "The Performance of Several Docking Programs at Reproducing Protein–Macrolide-Like Crystal Structures" Molecules 22, no. 1: 136. https://doi.org/10.3390/molecules22010136
APA StyleCastro-Alvarez, A., Costa, A. M., & Vilarrasa, J. (2017). The Performance of Several Docking Programs at Reproducing Protein–Macrolide-Like Crystal Structures. Molecules, 22(1), 136. https://doi.org/10.3390/molecules22010136