
Quantification of Oxidized and Unsaturated Bile Alcohols in Sea Lamprey Tissues by Ultra-High Performance Liquid Chromatography-Tandem Mass Spectrometry

Abstract
:1. Introduction
2. Results and Discussion
2.1. Method Development
2.2. Calibration and Method Validation
2.3. Matrix Effects
2.4. Quantitative Analysis of Sulfated BAs in Tissues
3. Experimental Section
3.1. Chemicals and Reagents
3.2. Preparation of Calibration Standards, Quality Control, and Internal Standard Solutions
3.3. Quantitative Conditions by UHPLC-MS/MS
3.4. Tissue Sample Preparation, Extraction, and Quantification
3.5. Method Validation
3.6. Data Analysis and Statistics
4. Conclusions
Acknowledgments
Author Contributions
Conflicts of Interest
References
- Li, W.; Scott, A.P.; Siefkes, M.J.; Yan, H.; Liu, Q.; Yun, S.-S.; Gage, D.A. Bile acid secreted by male sea lamprey that acts as a sex pheromone. Science 2002, 296, 138–141. [Google Scholar] [CrossRef] [PubMed]
- Johnson, N.S.; Yun, S.-S.; Thompson, H.T.; Brant, C.O.; Li, W. A synthesized pheromone induces upstream movement in female sea lamprey and summons them into traps. Proc. Natl. Acad. Sci. USA 2009, 106, 1021–1026. [Google Scholar] [CrossRef] [PubMed]
- Xi, X.; Johnson, N.S.; Brant, C.O.; Yun, S.-S.; Chambers, K.L.; Jones, A.D.; Li, W. Quantification of a male sea lamprey pheromone in tributaries of Laurentian Great Lakes by liquid chromatography-tandem mass spectrometry. Environ. Sci. Technol. 2011, 45, 6437–6443. [Google Scholar] [CrossRef] [PubMed]
- Li, K.; Wang, H.; Brant, C.O.; Ahn, S.; Li, W. Multiplex quantification of lamprey specific bile acid derivatives in environmental water using UHPLC-MS/MS. J. Chromatogr. B 2011, 879, 3879–3886. [Google Scholar] [CrossRef] [PubMed]
- Johnson, N.S.; Yun, S.-S.; Li, W. Investigations of novel unsaturated bile salts of male sea lamprey as potential chemical cues. J. Chem. Ecol. 2014, 40, 1152–1160. [Google Scholar] [CrossRef] [PubMed]
- Muto, A.; Takei, H.; Unno, A.; Murai, T.; Kurosawa, T.; Ogawa, S.; Iida, T.; Ikegawa, S.; Mori, J.; Ohtake, A.; et al. Detection of Δ4–3-oxo-steroid 5β-reductase deficiency by LC-ESI-MS/MS measurement of urinary bile acids. J. Chromatogr. B 2012, 900, 24–31. [Google Scholar] [CrossRef] [PubMed]
- Kakiyama, G.; Muto, A.; Takei, H.; Nittono, H.; Murai, T.; Kurosawa, T.; Hofmann, A.F.; Pandak, W.M.; Bajaj, J.S. A simple and accurate HPLC method for fecal bile acid profile in healthy and cirrhotic subjects: Validation by GC-MS and LC-MS. J. Lipid Res. 2014, 55, 978–990. [Google Scholar] [CrossRef] [PubMed]
- Ikegawa, S.; Yanagihara, T.; Murao, N.; Watanabe, H.; Goto, J.; Niwa, T. Separatory determination of bile acid 3-Sulfates by liquid chromatography/electrospray ionization mass spectrometry. J. Mass Spectrom. 1997, 32, 401–407. [Google Scholar] [CrossRef]
- Goto, T.; Myint, K.T.; Sato, K.; Wada, O.; Kakiyama, G.; Iida, T.; Hishinuma, T.; Mano, N.; Goto, J. LC/ESI-tandem mass spectrometric determination of bile acid 3-sulfates in human urine: 3β-Sulfooxy-12α-hydroxy-5β-cholanoic acid is an abundant nonamidated sulfate. J. Chromatogr. B 2007, 846, 69–77. [Google Scholar] [CrossRef] [PubMed]
- Huang, J.; Bathena, S.P.R.; Csanaky, I.L.; Alnouti, Y. Simultaneous characterization of bile acids and their sulfate metabolites in mouse liver, plasma, bile, and urine using LC-MS/MS. J. Pharm. Biomed. Anal. 2011, 55, 1111–1119. [Google Scholar] [CrossRef] [PubMed]
- Bathena, S.P.R.; Mukherjee, S.; Olivera, M.; Alnouti, Y. The profile of bile acids and their sulfate metabolites in human urine and serum. J. Chromatogr. B 2013, 942–943, 53–62. [Google Scholar] [CrossRef] [PubMed]
- Alnouti, Y. Bile acid sulfation: a pathway of bile acid elimination and detoxification. Toxicol. Sci. 2009, 108, 225–246. [Google Scholar] [CrossRef] [PubMed]
- Bian, H.S.; Ngo, S.Y.Y.; Tan, W.; Wong, C.H.; Boelsterli, U.A.; Tan, T.M.C. Induction of human sulfotransferase 1A3 (SULT1A3) by glucocorticoids. Life Sci. 2007, 81, 1659–1667. [Google Scholar] [CrossRef] [PubMed]
- Li, K.; Brant, C.O.; Siefkes, M.J.; Kruckman, H.G.; Li, W. Characterization of a novel bile alcohol sulfate released by sexually mature male sea lamprey (Petromyzon marinus). PLoS ONE 2013, 8, e68157. [Google Scholar] [CrossRef] [PubMed]
- New, L.-S.; Chan, E.C. Evaluation of BEH C18, BEH HILIC, and HSS T3 (C18) column chemistries for the UPLC-MS-MS analysis of glutathione, glutathione disulfide, and ophthalmic acid in mouse liver and human plasma. J. Chromatogr. Sci. 2008, 46, 209–214. [Google Scholar] [CrossRef] [PubMed]
- Cunliffe, J.M.; Maloney, T.D. Fused-core particle technology as an alternative to sub-2-μm particles to achieve high separation efficiency with low backpressure. J. Sep. Sci. 2007, 30, 3104–3109. [Google Scholar] [CrossRef] [PubMed]
- De Villiers, A.; Lestremau, F.; Szucs, R.; Gélébart, S.; David, F.; Sandra, P. Evaluation of ultra performance liquid chromatography: Part I. Possibilities and limitations. J. Chromatogr. A 2006, 1127, 60–69. [Google Scholar] [CrossRef] [PubMed]
- Lim, C.; Peters, T. Ammonium acetate: A general purpose buffer for clinical applications of high-performance liquid chromatography. J. Chromatogr. A 1984, 316, 397–406. [Google Scholar] [CrossRef]
- Li, K.; Buchinger, T.J.; Bussy, U.; Fissette, S.D.; Johnson, N.S.; Li, W. Quantification of 15 bile acids in lake charr feces by ultra-high performance liquid chromatography-tandem mass spectrometry. J. Chromatogr. B 2015, 1001, 27–34. [Google Scholar] [CrossRef] [PubMed]
- Naritaka, N.; Suzuki, M.; Sato, H.; Takei, H.; Murai, T.; Kurosawa, T.; Iida, T.; Nittono, H.; Shimizu, T. Profile of bile acids in fetal gallbladder and meconium using liquid chromatography-tandem mass spectrometry. Clin. Chim. Acta 2015, 446, 76–81. [Google Scholar] [CrossRef] [PubMed]
- Mi, S.; Lim, D.W.; Turner, J.M.; Wales, P.W.; Curtis, J.M. Determination of bile acids in piglet bile by solid phase extraction and liquid chromatography-electrospray tandem mass spectrometry. Lipids 2016, 51, 359–372. [Google Scholar] [CrossRef] [PubMed]
- Scherer, M.; Gnewuch, C.; Schmitz, G.; Liebisch, G. Rapid quantification of bile acids and their conjugates in serum by liquid chromatography-tandem mass spectrometry. J. Chromatogr. B 2009, 877, 3920–3925. [Google Scholar] [CrossRef] [PubMed]
- Hagio, M.; Matsumoto, M.; Fukushima, M.; Hara, H.; Ishizuka, S. Improved analysis of bile acids in tissues and intestinal contents of rats using LC/ESI-MS. J. Lipid Res. 2009, 50, 173–180. [Google Scholar] [CrossRef] [PubMed]
- Perwaiz, S.; Tuchweber, B.; Mignault, D.; Gilat, T.; Yousef, I.M. Determination of bile acids in biological fluids by liquid chromatography-electrospray tandem mass spectrometry. J. Lipid Res. 2001, 42, 114–119. [Google Scholar] [PubMed]
- Tagliacozzi, D.; Mozzi, A.F.; Casetta, B.; Bertucci, P.; Bernardini, S.; Di Ilio, C.; Urbani, A.; Federici, G. Quantitative analysis of bile acids in human plasma by liquid chromatography-electrospray tandem mass spectrometry: A simple and rapid one-step method. Clin. Chem. Lab. Med. 2003, 41, 1633–1641. [Google Scholar] [CrossRef] [PubMed]
- Burkard, I.; von Eckardstein, A.; Rentsch, K.M. Differentiated quantification of human bile acids in serum by high-performance liquid chromatography-tandem mass spectrometry. J. Chromatogr. B Anal. Technol. Biomed. Life Sci. 2005, 826, 147–159. [Google Scholar] [CrossRef] [PubMed]
- Goto, T.; Shibata, A.; Sasaki, D.; Suzuki, N.; Hishinuma, T.; Kakiyama, G.; Iida, T.; Mano, N.; Goto, J. Identification of a novel conjugate in human urine: Bile acid acyl galactosides. Steroids 2005, 70, 185–192. [Google Scholar] [CrossRef] [PubMed]
- Ando, M.; Kaneko, T.; Watanabe, R.; Kikuchi, S.; Goto, T.; Iida, T.; Hishinuma, T.; Mano, N.; Goto, J. High sensitive analysis of rat serum bile acids by liquid chromatography/electrospray ionization tandem mass spectrometry. J. Pharm. Biomed. Anal. 2006, 40, 1179–1186. [Google Scholar] [CrossRef] [PubMed]
- Minato, K.; Suzuki, M.; Nagao, H.; Suzuki, R.; Ochiai, H. Development of analytical method for simultaneous determination of five rodent unique bile acids in rat plasma using ultra-performance liquid chromatography coupled with time-of-flight mass spectrometry. J. Chromatogr. B 2015, 1002, 399–410. [Google Scholar] [CrossRef] [PubMed]
- Han, J.; Liu, Y.; Wang, R.X.; Yang, J.C.; Ling, V.; Borchers, C.H. Metabolic profiling of bile acids in human and mouse blood by LC-MS/MS in combination with phospholipid-depletion solid-phase extraction. Anal. Chem. 2015, 87, 1127–1136. [Google Scholar] [CrossRef] [PubMed]
- FDA. Guidance for Industry: Bioanalytical Method Validation; US Department of Health and Human Services, Food and Drug Administration, Center for Drug Evaluation and Research, Center for Veterinary Medicine: Silver Spring, MD, USA, 2001.
- Sample Availability: Samples of the compounds are available from the authors.

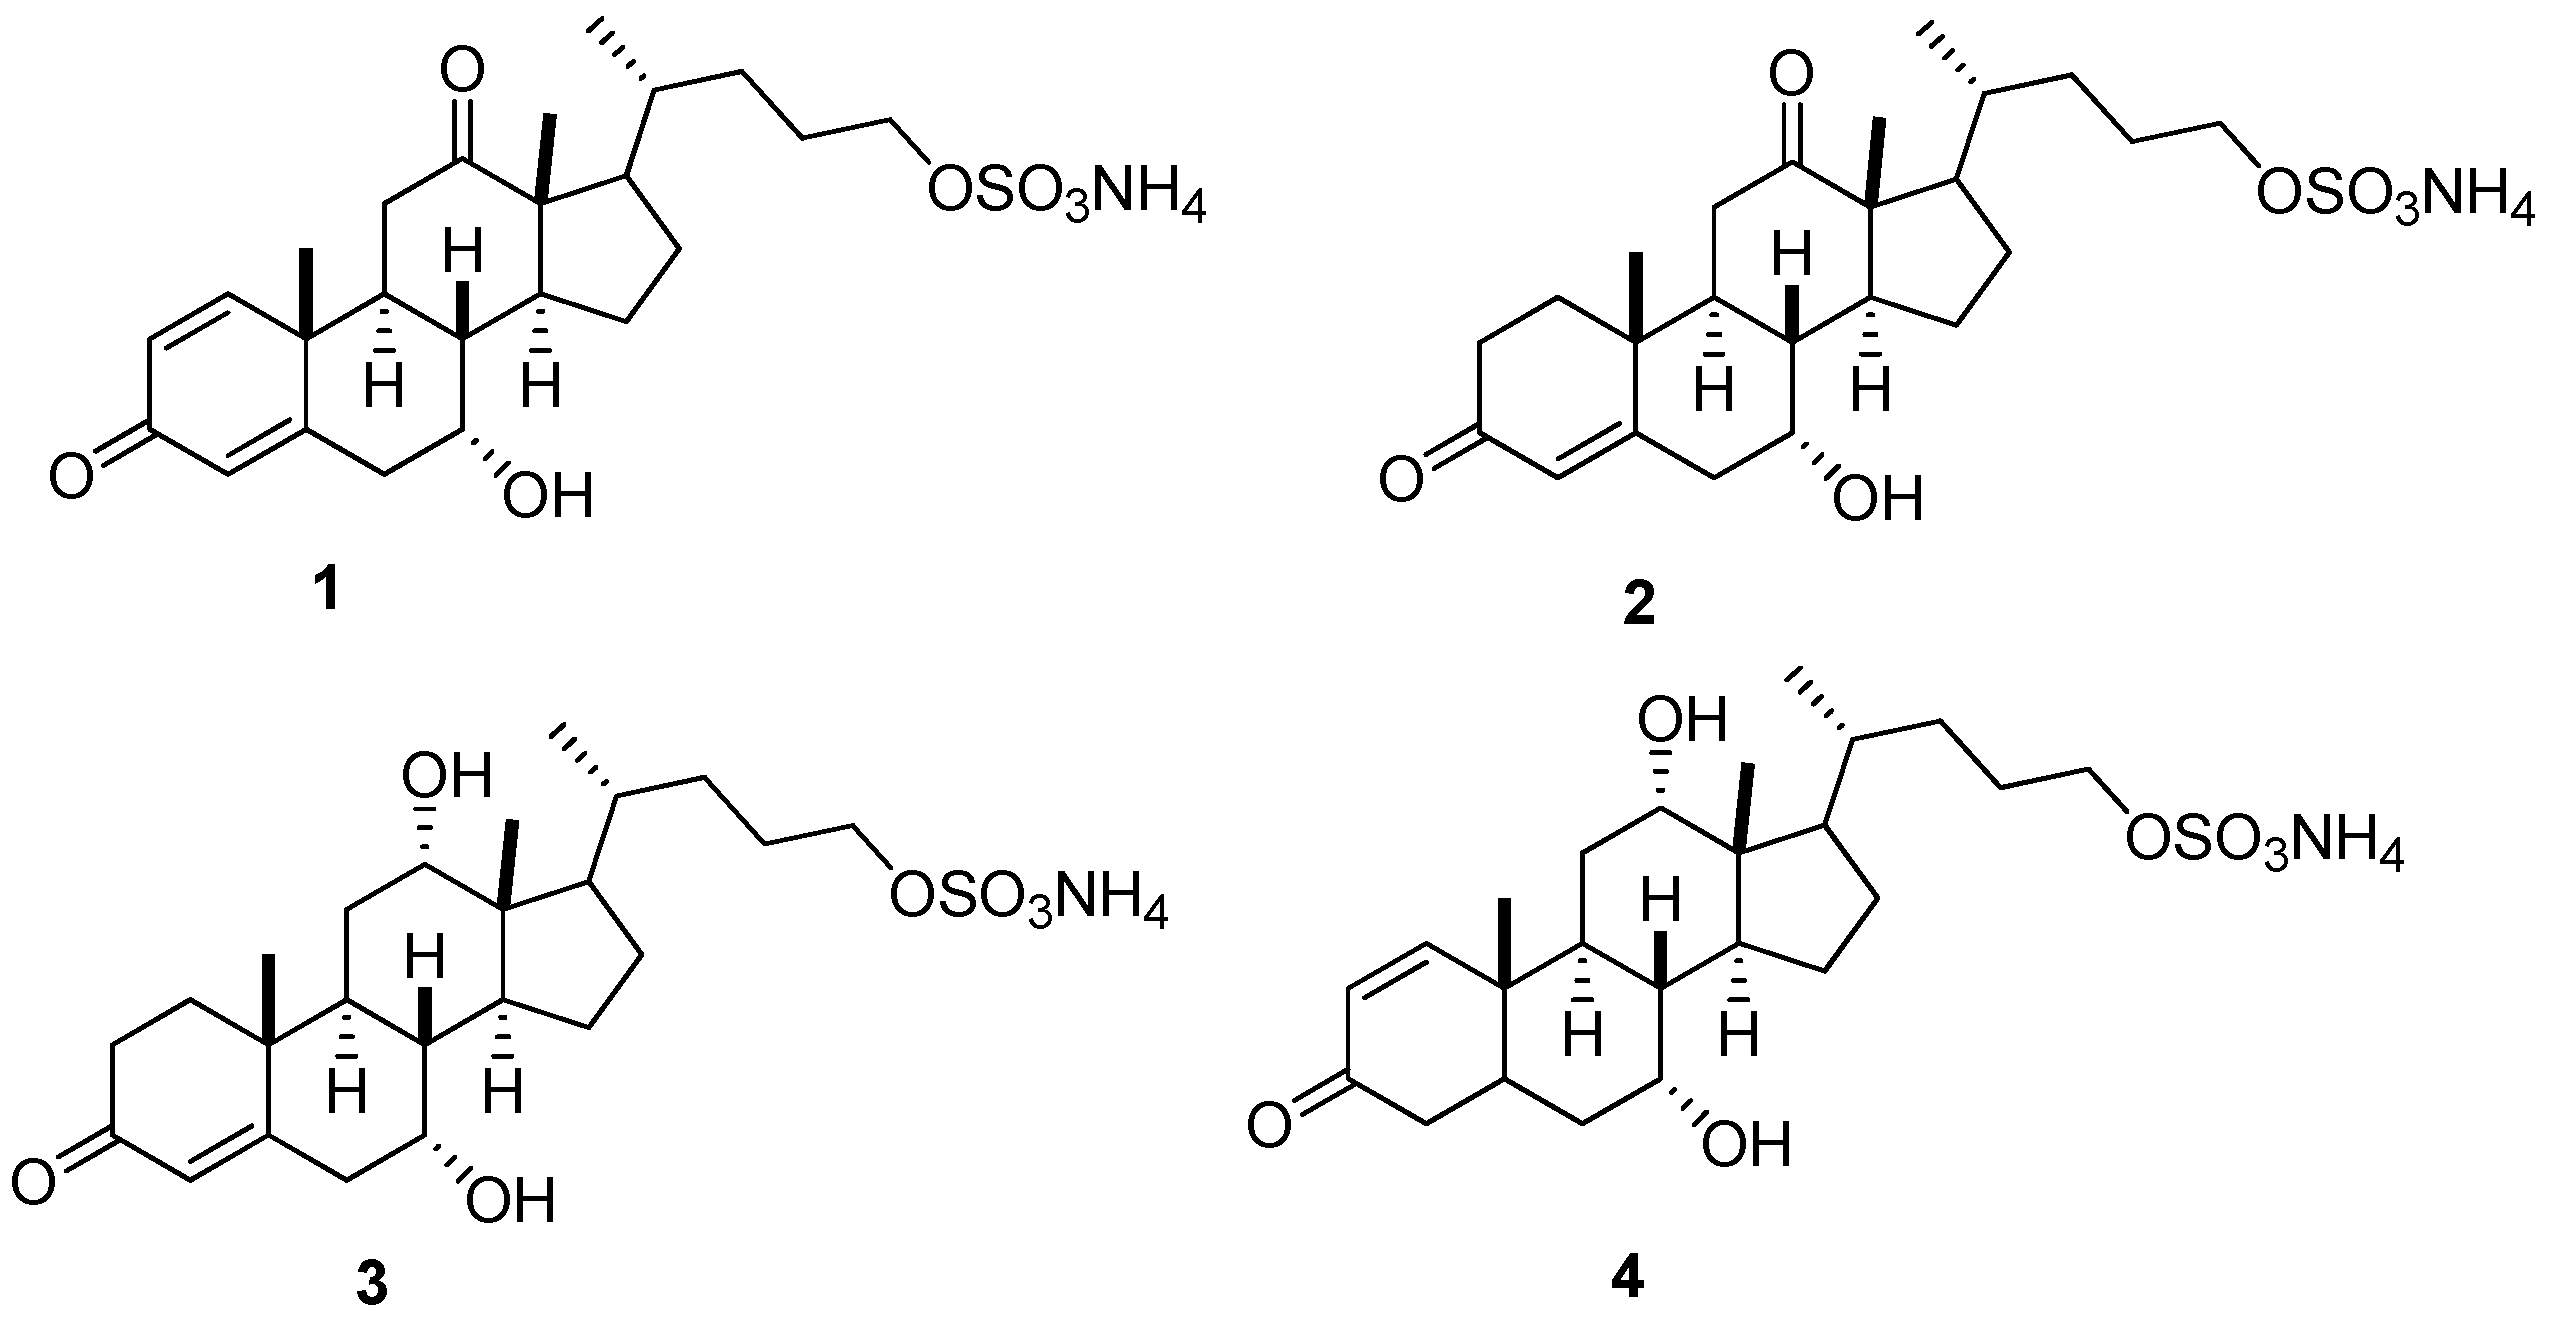
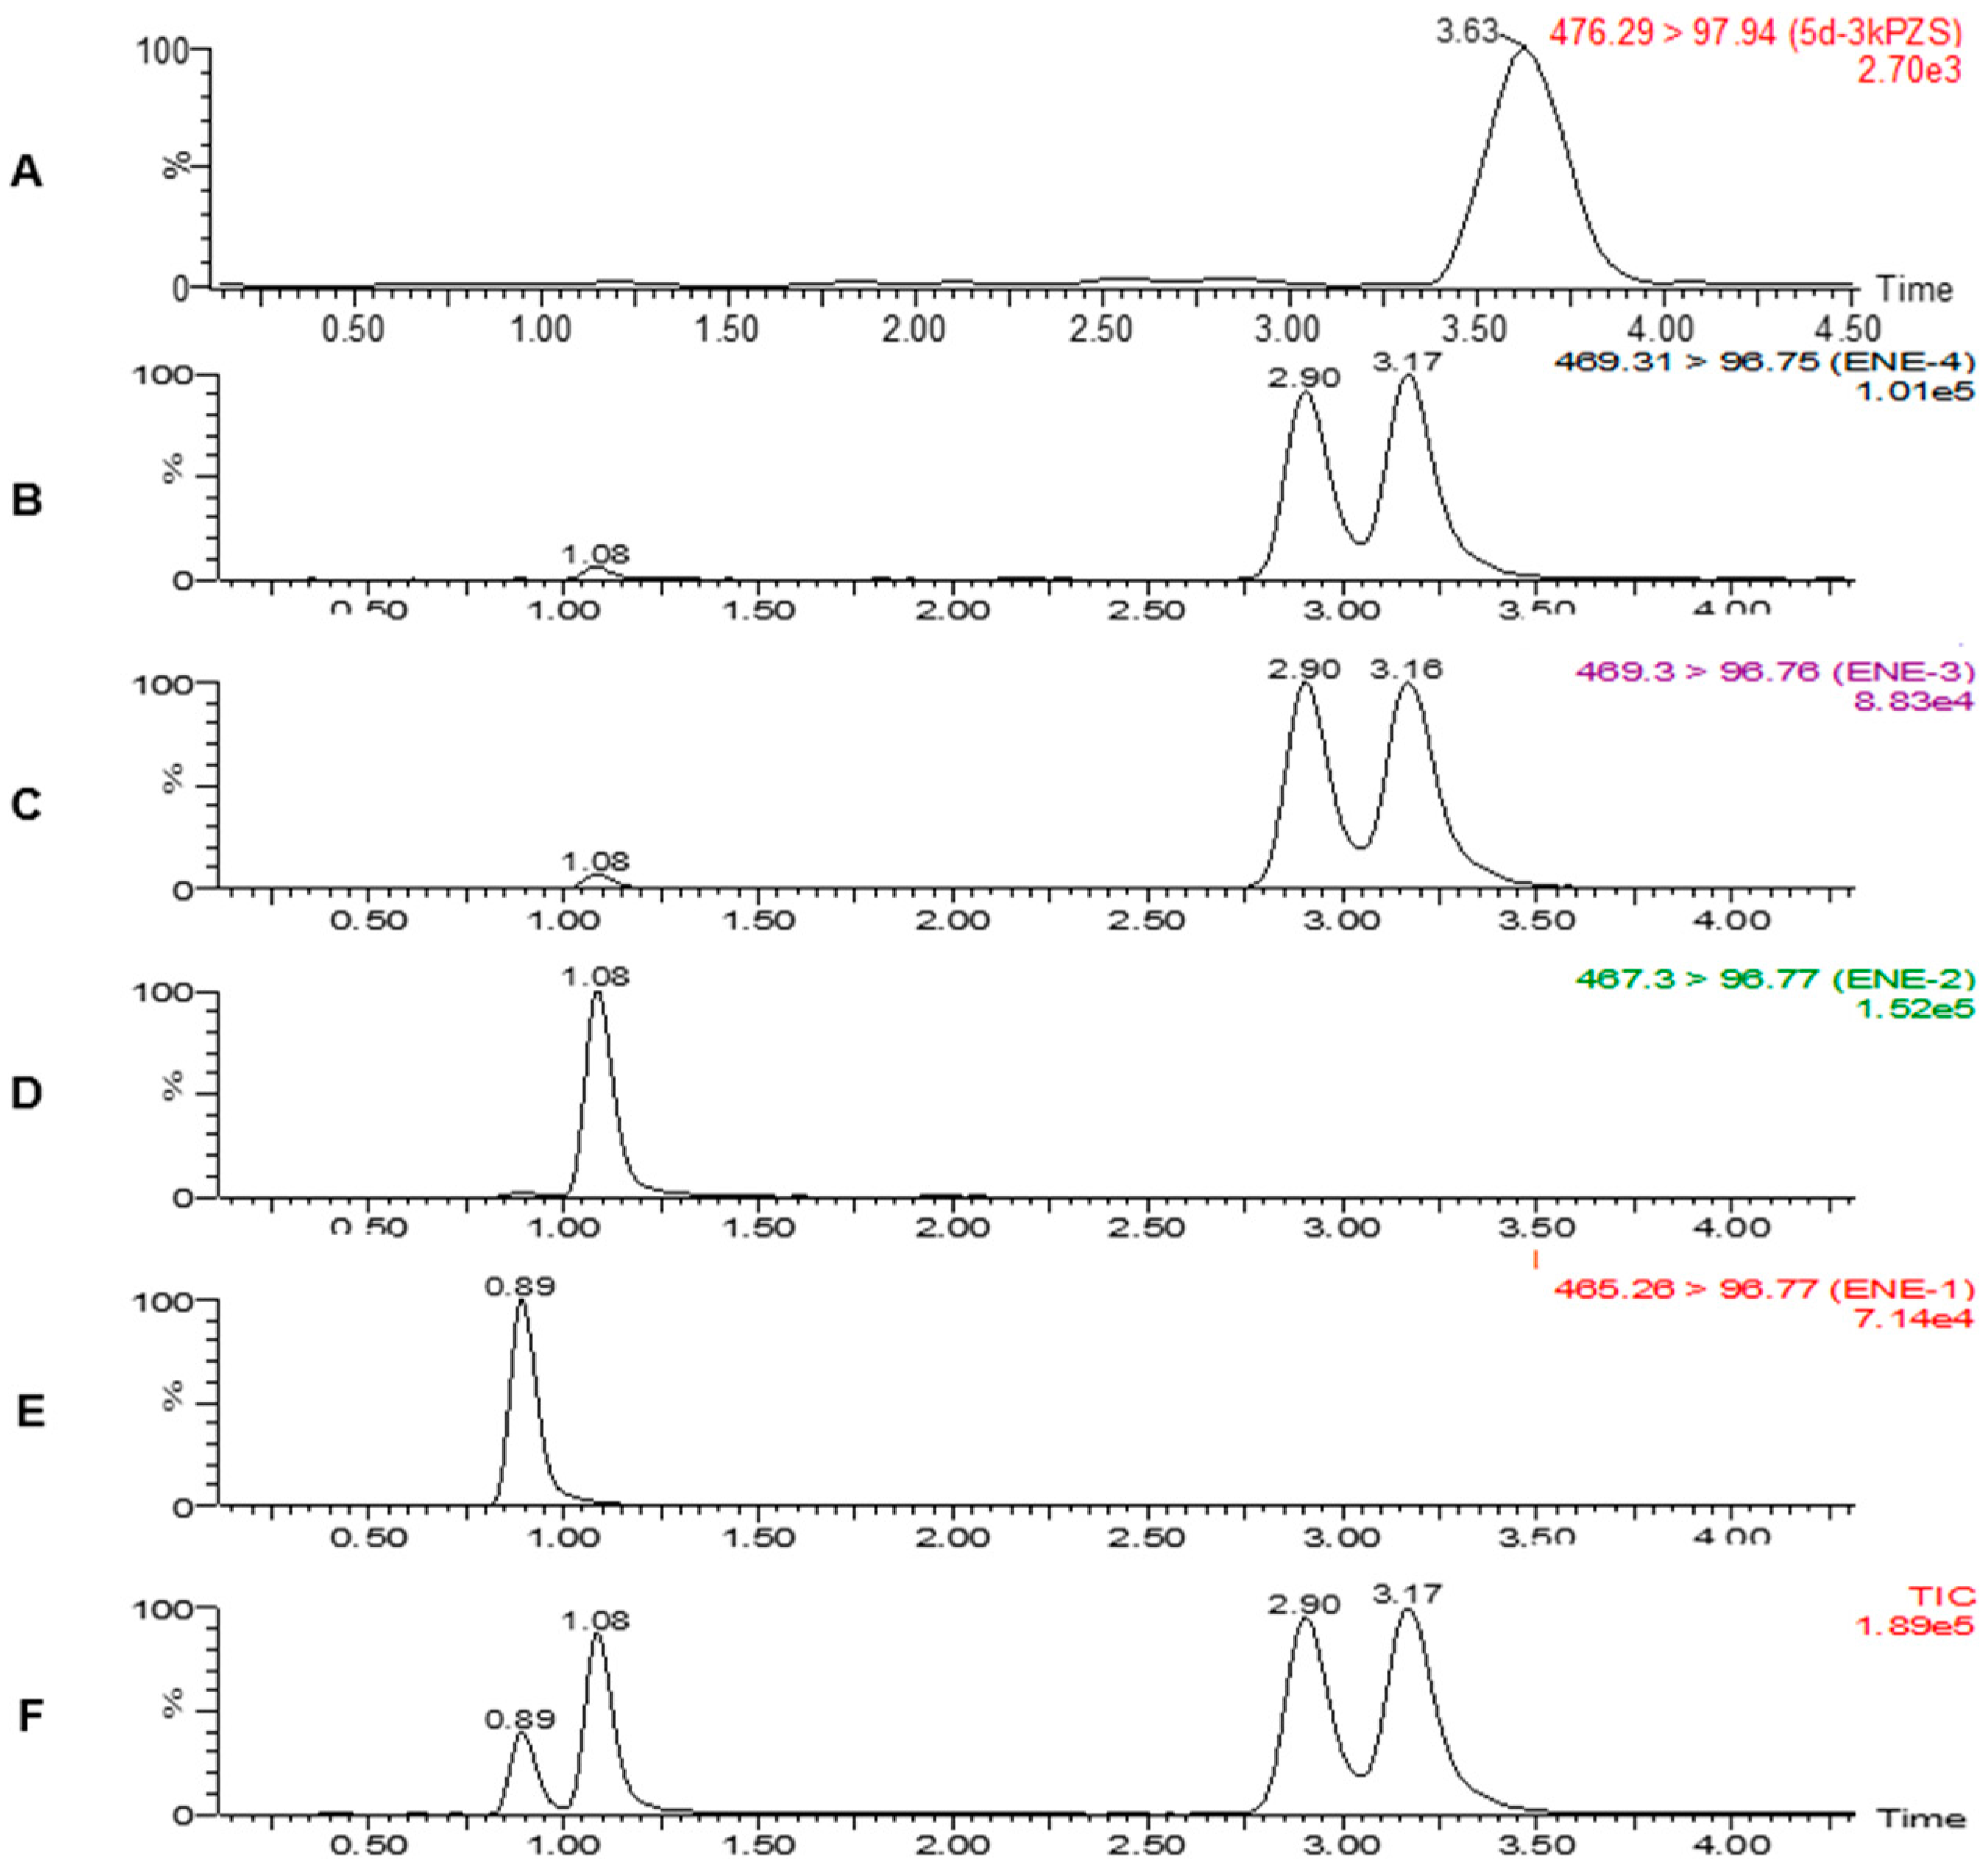
| Compounds | [M − H]− m/z | MRM m/z | CV (V) | CE (eV) | RT (min) | LR | R2 | LOD (ng/g) | LOQ (ng/g) |
|---|---|---|---|---|---|---|---|---|---|
| 1 | 465.2 | 465.2 > 96.7 | 49 | 40 | 0.89 | 0.1–1000 | 0.9918 | 0.10 | 0.33 |
| 2 | 467.3 | 467.3 > 96.7 | 23 | 40 | 1.08 | 0.1–1000 | 0.9924 | 0.10 | 0.33 |
| 3 | 469.3 | 469.3 > 96.7 | 36 | 40 | 2.90 | 0.2–1000 | 0.9973 | 0.20 | 0.66 |
| 4 | 469.3 | 469.3 > 96.7 | 23 | 40 | 3.16 | 0.2–1000 | 0.9952 | 0.20 | 0.66 |
| [2H5]-3kPZS | 476.3 | 476.3 > 96.7 | 100 | 23 | 3.05 | 0.5–1000 | 0.9986 | 0.30 | 0.99 |
| Analyte | NC (ng/g) | Intra-Day (n = 6) | Inter-Day (n = 6) | ||||
|---|---|---|---|---|---|---|---|
| MC (Mean ± SD, ng/mL) | Accuracy (DEV %) | Precision (RSD %) | MC (Mean ± SD, ng/mL) | Accuracy (DEV %) | Precision (RSD %) | ||
| 1 | 2.5 | 2.4 ± 0.03 | 96.9 | 1.24 | 2.4 ± 0.11 | 95.2 | 4.80 |
| 25 | 24.1 ± 0.50 | 96.5 | 2.07 | 24.1 ± 1.22 | 96.4 | 5.05 | |
| 250 | 248.2 ± 1.18 | 99.3 | 0.48 | 245.8 ± 5.84 | 98.3 | 2.38 | |
| 2 | 2.5 | 2.4 ± 0.03 | 95.5 | 1.22 | 2.5 ± 0.10 | 101.1 | 4.29 |
| 25 | 24.1 ± 0.72 | 96.3 | 2.99 | 25.0 ± 1.03 | 100.1 | 4.12 | |
| 250 | 243.6 ± 5.10 | 97.4 | 2.09 | 247.3 ± 3.77 | 98.9 | 1.52 | |
| 3 | 2.5 | 2.4 ± 0.05 | 97.1 | 1.96 | 2.4 ± 0.04 | 95.7 | 1.81 |
| 25 | 24.1 ± 0.89 | 96.4 | 3.70 | 25.2 ± 1.06 | 100.8 | 4.21 | |
| 250 | 248.3 ± 2.03 | 99.3 | 0.82 | 247.3 ± 4.25 | 98.9 | 1.72 | |
| 4 | 2.5 | 2.41 ± 0.04 | 96.3 | 1.67 | 2.4 ± 0.04 | 97.03 | 1.87 |
| 25 | 24.6 ± 0.99 | 98.3 | 4.03 | 25.2 ± 0.93 | 100.6 | 3.69 | |
| 250 | 247.5 ± 0.76 | 99.0 | 0.31 | 250.3 ± 13.21 | 100.1 | 5.28 | |
| Matrix | Analyte | Mean Extraction Recovery (%) | Matrix Effect (%) | ||||
|---|---|---|---|---|---|---|---|
| Low | Medium | High | Low | Medium | High | ||
| Liver | 1 | 96.3 (2.3) | 95.6 (3.1) | 92.9 (1.5) | 97.3 (4.1) | 99.3 (3.2) | 96.3 (2.9) |
| 2 | 92.3 (1.8) | 95.2 (2.0) | 91.3 (3.2) | 90.3 (3.2) | 92.3 (2.9) | 92.6 (2.1) | |
| 3 | 87.9 (3.1) | 89.6 (2.7) | 88.6 (3.4) | 89.6 (3.5) | 87.9 (3.2) | 88.6 (2.8) | |
| 4 | 92.3 (2.6) | 86.3 (2.5) | 84.3 (2.7) | 85.9 (1.6) | 95.6 (2.7) | 89.6 (2.2) | |
| Kidney | 1 | 96.3 (2.5) | 95.8 (1.4) | 95.6 (3.2) | 98.6 (2.3) | 96.3 (4.2) | 95.8 (4.9) |
| 2 | 95.3 (2.4) | 95.6 (2.5) | 94.3 (4.5) | 88.9 (3.1) | 87.6 (2.2) | 89.6 (1.8) | |
| 3 | 86.9 (3.0) | 89.6 (1.9) | 92.3 (3.1) | 87.9 (3.8) | 86.9 (2.7) | 89.6 (3.6) | |
| 4 | 91.2 (2.0) | 89.6 (1.7) | 93.2 (2.9) | 92.3 (1.1) | 85.6 (1.9) | 86.9 (1.7) | |
| Intestine | 1 | 96.3 (3.3) | 95.3 (2.7) | 94.2 (2.5) | 95.3 (3.6) | 94.3 (2.8) | 95.6 (1.9) |
| 2 | 94.2 (2.9) | 95.3 (3.1) | 92.3 (2.9) | 93.6 (4.0) | 92.7 (3.8) | 93.5 (2.5) | |
| 3 | 86.3 (3.2) | 87.5 (4.1) | 89.6 (1.9) | 87.9 (3.5) | 85.9 (1.8) | 89.6 (1.7) | |
| 4 | 92.5 (3.4) | 95.6 (2.9) | 91.5 (3.2) | 95.2 (1.3) | 93.2 (2.7) | 94.3 (1.6) | |
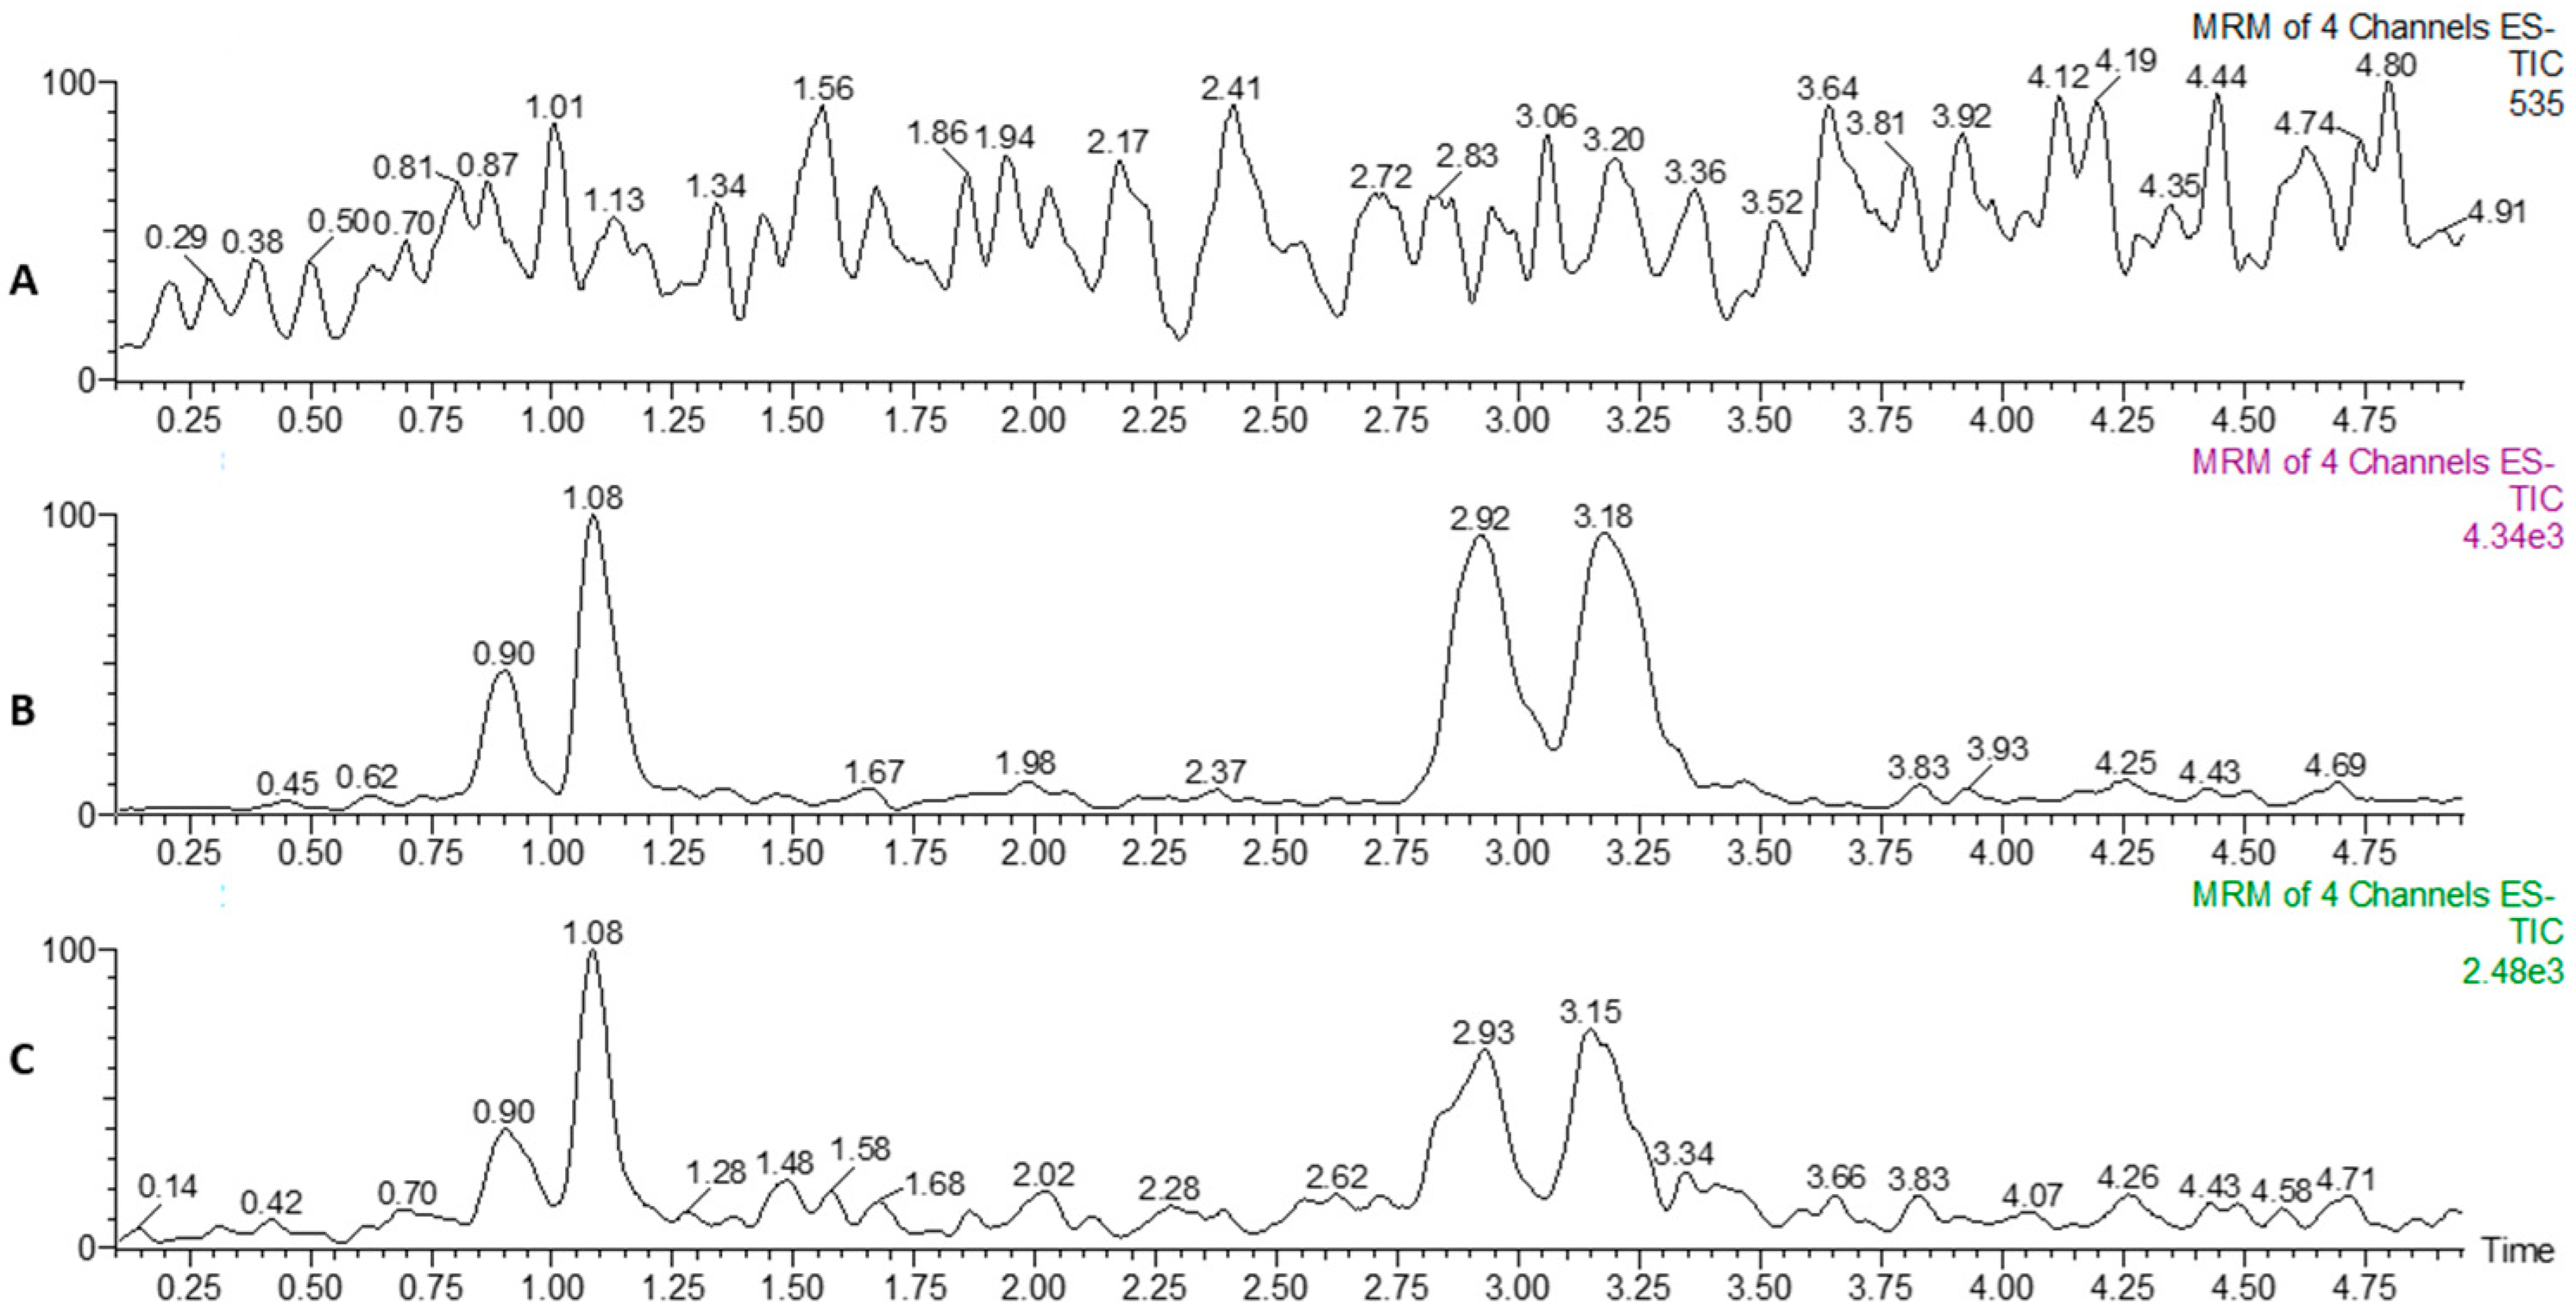
| Sample | Concentration (ng/g) | |||
|---|---|---|---|---|
| 1 | 2 | 3 | 4 | |
| Kidney | N.D | N.D | N.D | N.D |
| Intestine | N.D | N.D | 0.85 | 0.74 |
| Liver extract | N.D | N.D | 0.81 | 0.92 |
© 2016 by the authors. Licensee MDPI, Basel, Switzerland. This article is an open access article distributed under the terms and conditions of the Creative Commons Attribution (CC-BY) license ( http://creativecommons.org/licenses/by/4.0/).
Share and Cite
Li, K.; Scott, A.M.; Chung-Davidson, Y.-W.; Bussy, U.; Patel, T.; Middleton, Z.E.; Li, W. Quantification of Oxidized and Unsaturated Bile Alcohols in Sea Lamprey Tissues by Ultra-High Performance Liquid Chromatography-Tandem Mass Spectrometry. Molecules 2016, 21, 1119. https://doi.org/10.3390/molecules21091119
Li K, Scott AM, Chung-Davidson Y-W, Bussy U, Patel T, Middleton ZE, Li W. Quantification of Oxidized and Unsaturated Bile Alcohols in Sea Lamprey Tissues by Ultra-High Performance Liquid Chromatography-Tandem Mass Spectrometry. Molecules. 2016; 21(9):1119. https://doi.org/10.3390/molecules21091119
Chicago/Turabian StyleLi, Ke, Anne M. Scott, Yu-Wen Chung-Davidson, Ugo Bussy, Trinkal Patel, Zoe E. Middleton, and Weiming Li. 2016. "Quantification of Oxidized and Unsaturated Bile Alcohols in Sea Lamprey Tissues by Ultra-High Performance Liquid Chromatography-Tandem Mass Spectrometry" Molecules 21, no. 9: 1119. https://doi.org/10.3390/molecules21091119
APA StyleLi, K., Scott, A. M., Chung-Davidson, Y.-W., Bussy, U., Patel, T., Middleton, Z. E., & Li, W. (2016). Quantification of Oxidized and Unsaturated Bile Alcohols in Sea Lamprey Tissues by Ultra-High Performance Liquid Chromatography-Tandem Mass Spectrometry. Molecules, 21(9), 1119. https://doi.org/10.3390/molecules21091119