1. Introduction
Rhizoma Coptidis (
RC), the dried rhizome of
Coptis deltoidea C. Y. Cheng et Hsiao (
CCY),
Coptis chinensis Franch (
CF), or
Coptis teeta Wall, the species in the genus Coptis (family Ranunculaceae), has been used in China for thousands of years [
1] and is recorded with the Chinese name of “Huang Lian” in more than thirty classical Chinese medicine books [
2]. In Traditional Chinese Medicine (TCM) it could “clear the damp-heat, quench the fire, and counteract the poison” [
3], while recent studies have indicated that
RC can be used to treat hypertension and hyperlipidemia, dysentery and gastroenteritis, liver and hepatobiliary diseases, etc. [
4,
5]
CCY, commonly known as “Ya Lian”, may have a lower yield due to the long growth period and other physiological characteristics, make it scarce [
6].
CF often referred to as ”Wei Lian”, has been more widely used as the major ingredient in many Chinese herbal formulas such as oral liquid “shuang huanglian” [
7]. This plant is mainly produced in the Chongqing, Hubei, Guizhou, Shanxi provinces of China. Furthermore, differences in kinds and content of alkaloid components exist between
CCY and
CF [
8], which are caused by the differences in their growth conditions, storage, and processing of the herb.
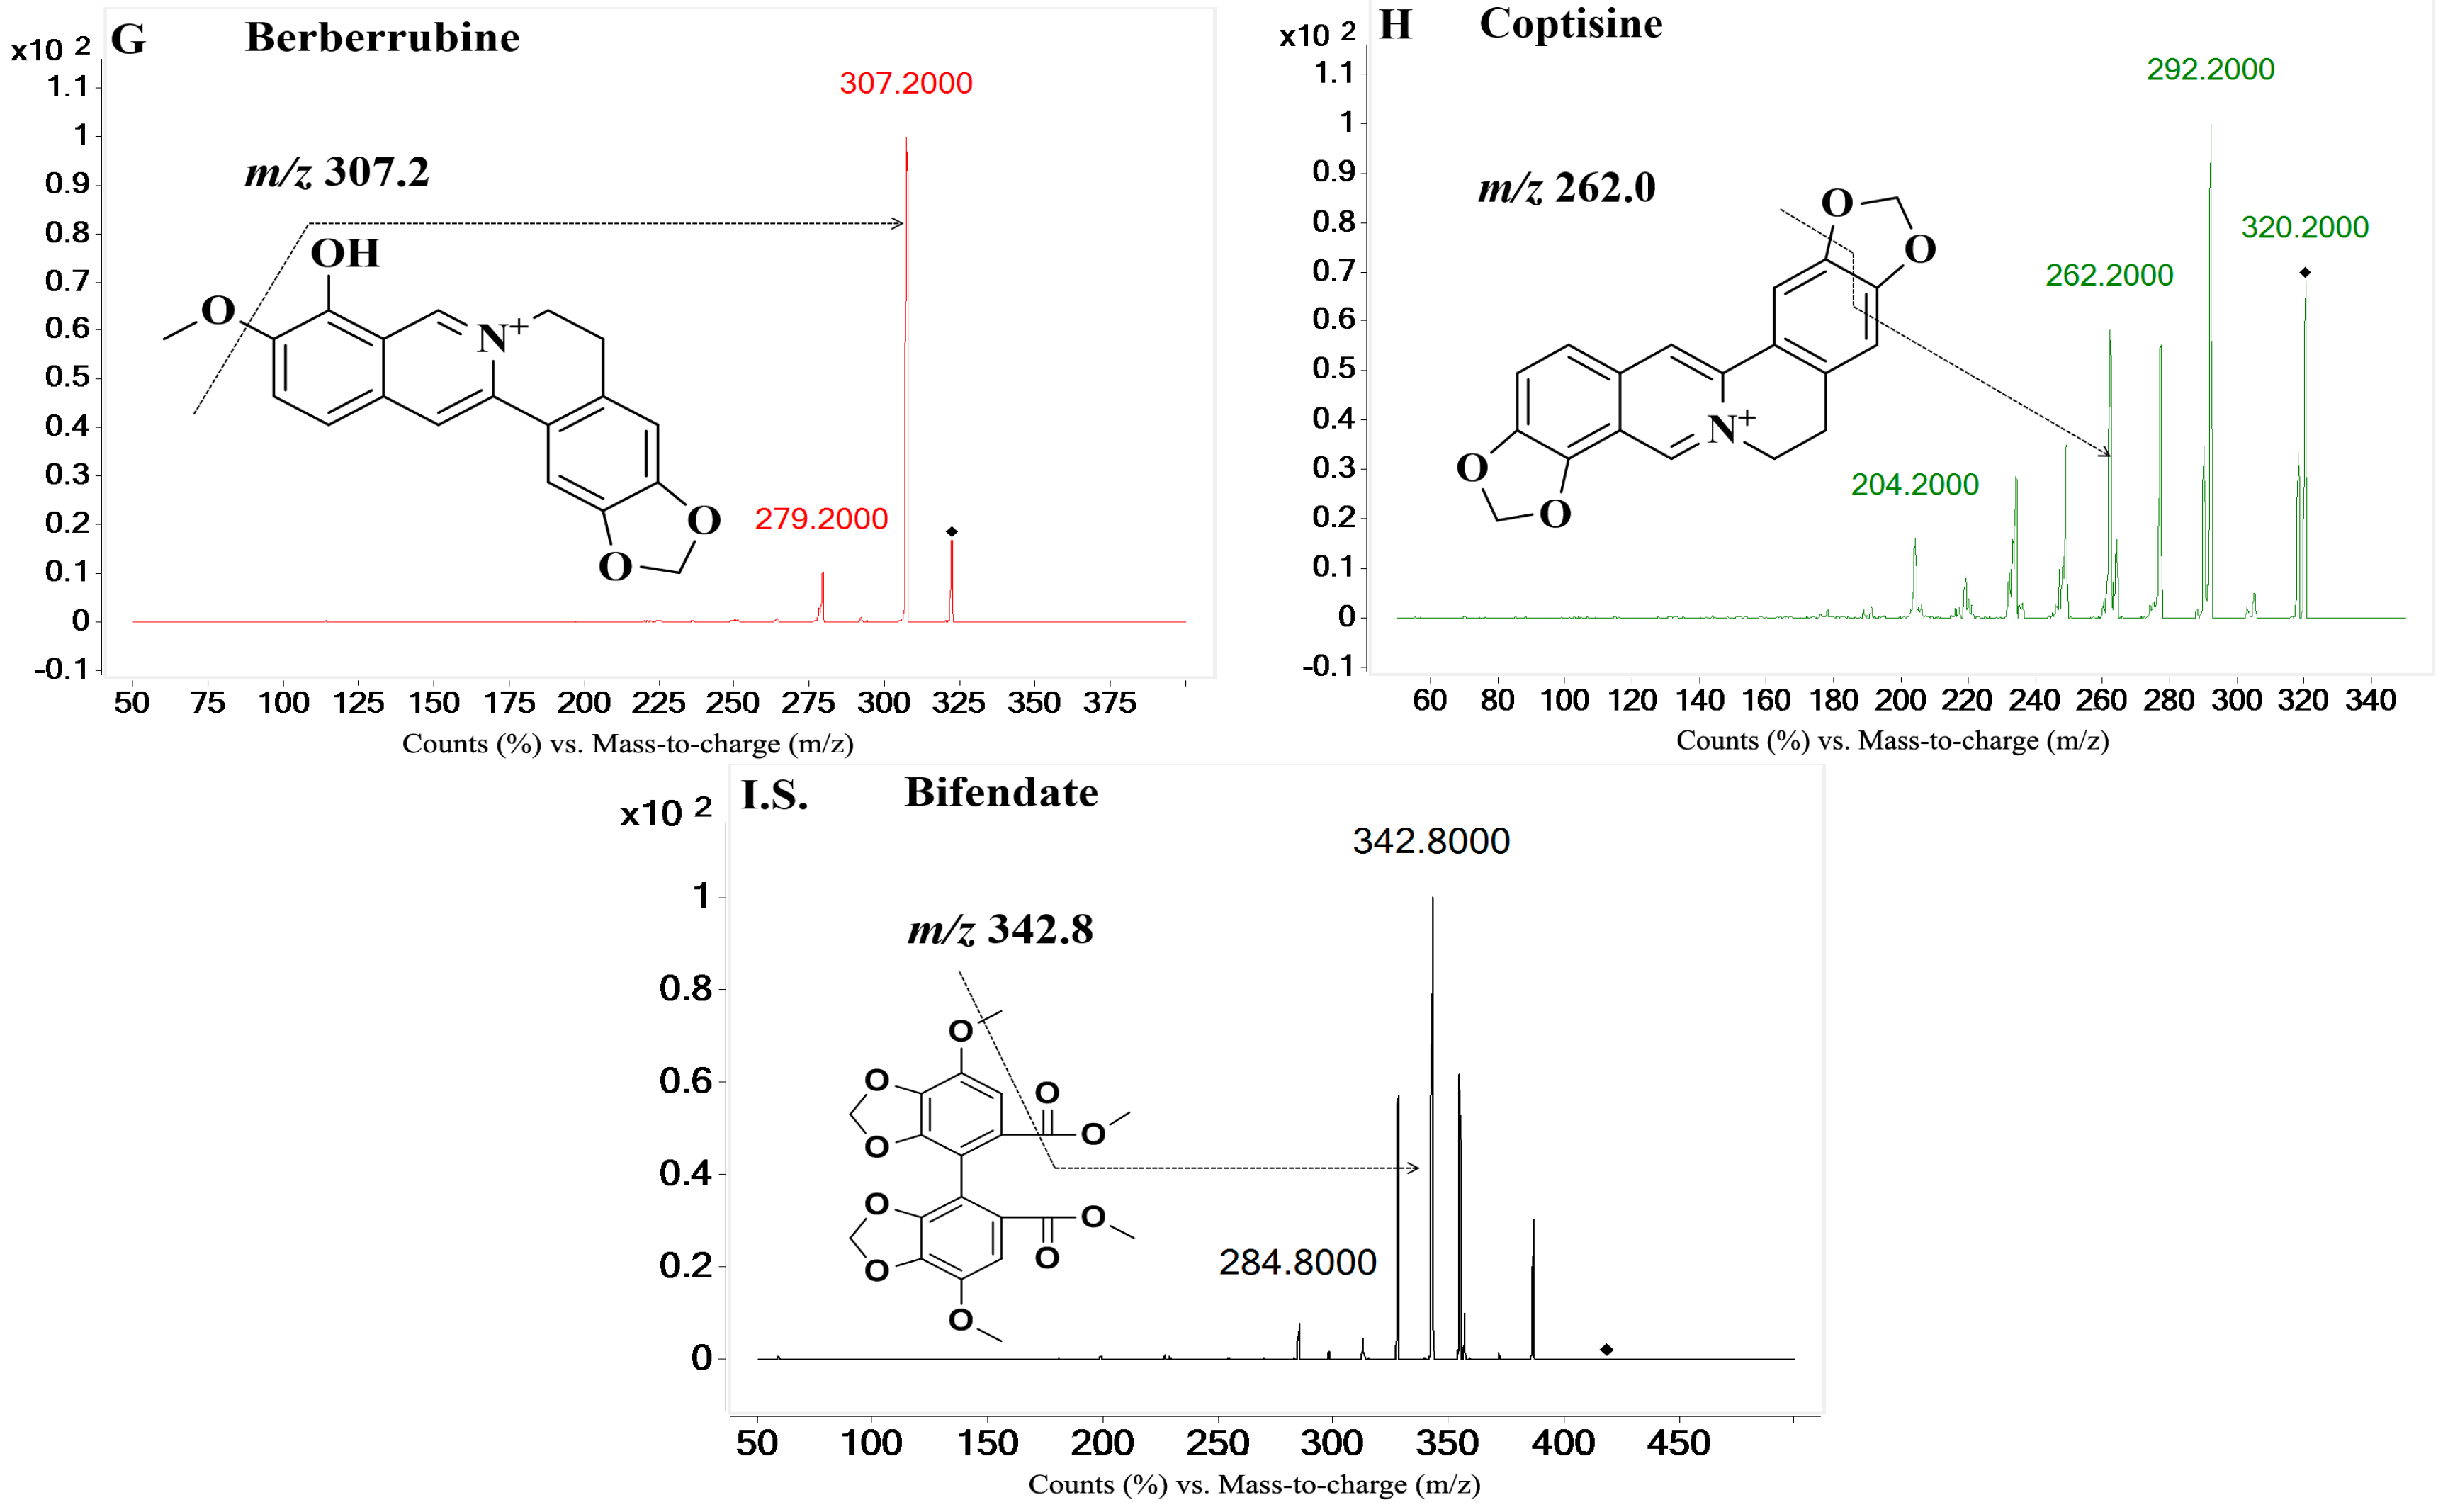
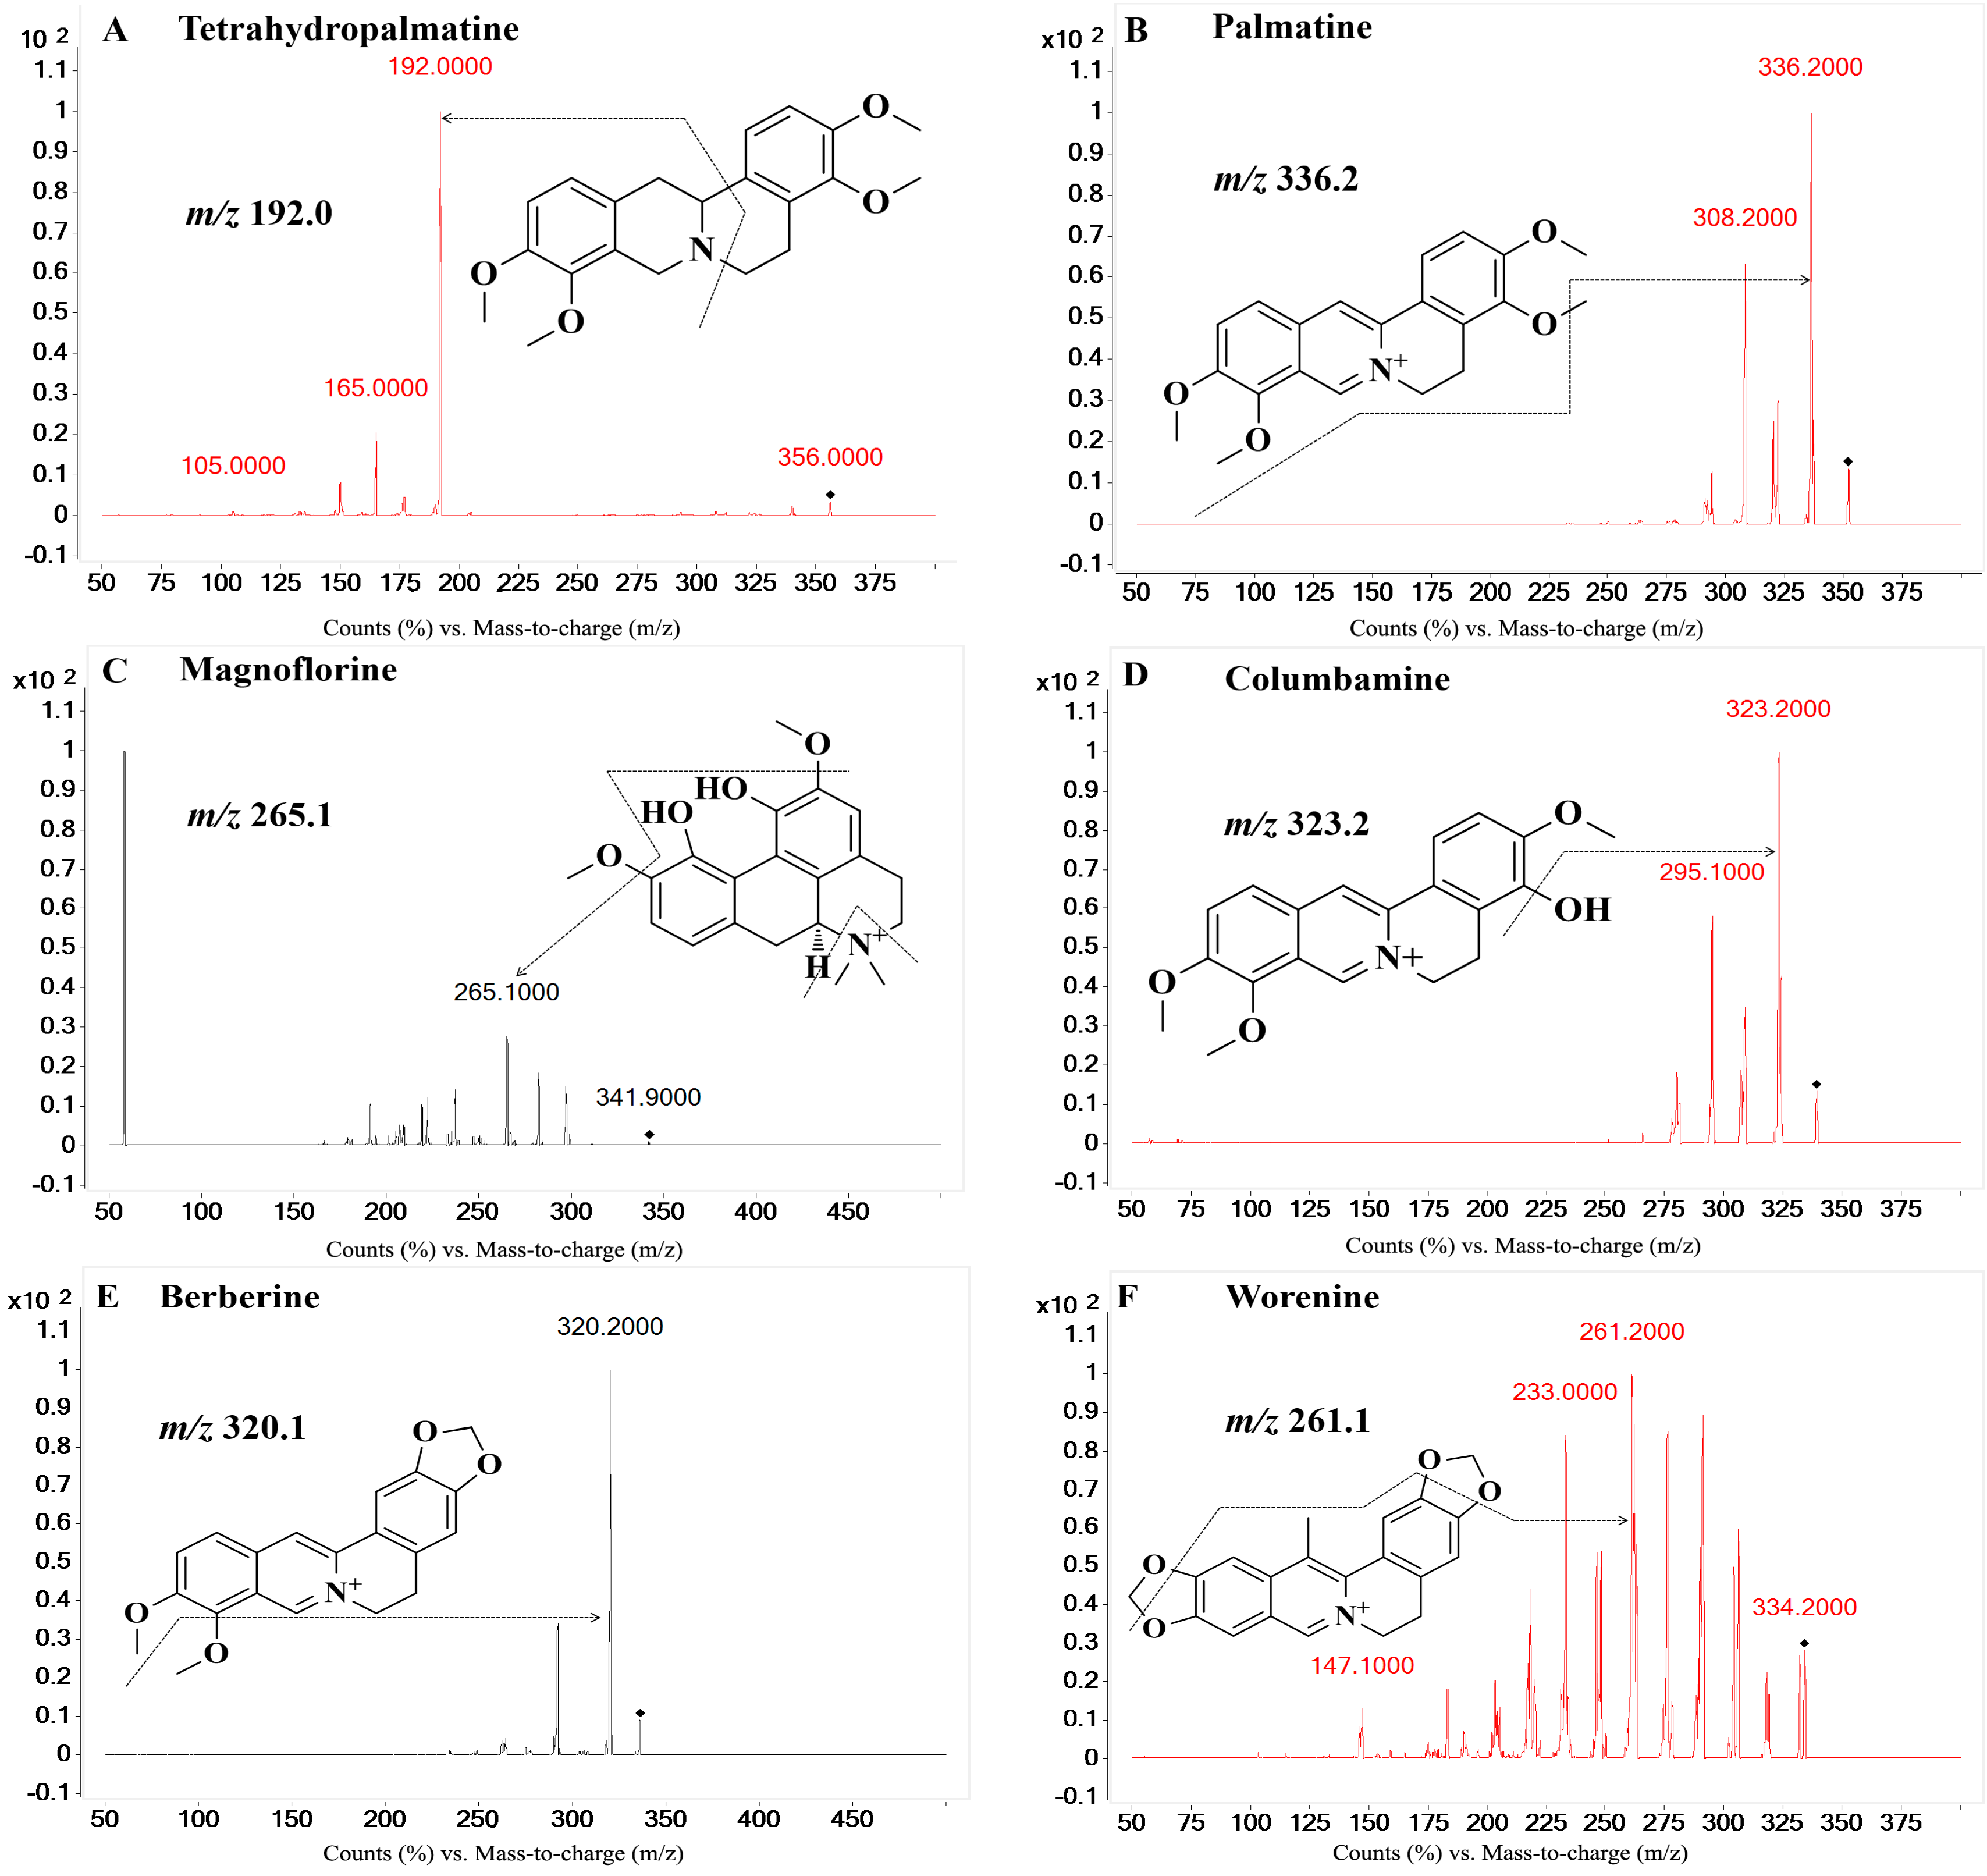
On the basis of previous studies, the major active constituents in
CCY and
CF are alkaloids, including tetrahydropalmatine (
A); palmatine (
B); magnoflorine (
C); columbamine (
D); berberine (
E); worenine (
F); berberrubine (
G) and coptisine (
H) (
Figure 1), etc. In recent years, various biological activities of these components have been reported, such as antimicrobial [
9], anticancer [
10,
11], anti-oxidative [
12] and cardioprotective [
13] effects, etc. For example, berberine significantly reduced myocardial ischemia/reperfusion-induced myocardial infarct size, improved cardiac function, and suppressed myocardial apoptosis and oxidative damage [
14]. It is found that five major alkaloids in
RC prevented body weight gain, reduced the serum total cholesterol, and increased the high-density lipoprotein cholesterol of hamsters [
15]. As for the other analytes, coptisine, palmatine, magnoflorine and berberrubine, have been reported to have antimicrobial or anti-inflammatory properties [
16,
17]. Nevertheless, to the best of our knowledge, little research has addressed the pharmacokinetics of other alkaloids including magnoflorine, worenine, berberrubine from
CCY and
CF, which also showed a wide range of useful biological activities, such as antifungal [
18], anti-inflammatory [
19], and antitumor activities [
20].
Earlier publications have described methods, including high-performance liquid chromatography with ultra-violet detection [
21], high-performance liquid chromatography with DAD detection [
22], and high-performance liquid chromatography-electrospray ionization-tandem mass spectrometry [
23,
24] that have been used in the qualitative or quantitative analysis of alkaloids from the genus Coptis, single herb or herbs used together in couples (Coptis-Evodia herb couple [
25], scutellaria-coptis herb couple [
26]), at most six or seven alkaloids simultaneously. However, to date, there are few publications concerning
CCY, especially the pharmacokinetics. Therefore, it is of great importance to develop a specific, sensitive and simple method to simultaneously determine the main components of
CCY and
CF in biological samples which could be applied in compare the pharmacokinetic characteristics of
CCY and
CF in follow-up studies.
In this study, a rapid and sensitive high-performance liquid chromatography-electrospray ionization tandem mass spectrometry was developed for the simultaneous determination of eight alkaloids in rat plasma. The method we developed should be useful in pharmacokinetics studies after oral administration of CCY and CF which could provide important and valuable information for improving RC clinical therapeutic efficacy as well as a better understanding of the differences and efficacy of these two drugs. This will be the next program of our research team.
3. Experimental Section
3.1. Material and Regents
The eight reference standards (A–H, purity 98.0%) were all obtained from the Chengdu Pufei De Biotech Co., Ltd. (Chengdu, Sichuan, China). The I.S. (bifendate) with a purity of 99.9% was purchased from the National Institutes for Food and Drug Control (Beijing, China). Water (H2O) was purified by a Milli-Q system (Millipore, Billerica, MA, USA) in our laboratory. HPLC-grade methanol and acetonitrile were purchased from Amethyst Chemicals (Beijing, China). HPLC-grade acetic acid was purchased from CNW Technologies (Düsseldorf, Germany). All other reagents were analytical-grade.
CF was the dried rhizome of the
Coptis chinensis Franch which was purchased from Bozhou Medicinal Material Company (Anhui, China) and authenticated by Professor Zhenyue Wang in Heilongjiang University of Chinese Medicine.
CCY was the dried rhizome of the
Coptis deltoidea C. Y. cheng et Hsiao which was collected from Hongya County, Meishan City, Sichuan Province, China, which is protected as a vulnerable plant in China [
31], and also authenticated by Professor Zhenyue Wang.
3.2. Preparation of CCY Extract and CF Extract
CCY and CF were crushed to pieces before use. A dried powder sample of each (100 g) was extracted three times (1 h each time) under reflux with 70% ethanol at a material:liquid ratio of 1:10 and finally the extracted solution was concentrated. The residue was reconstituted in water to obtain a concentration equivalent to 0.285 g/mL of the CCY extract and 0.345 g/mL of the CF extract. The eight analytes′ contents in both extracts were measured quantitatively by HPLC-DAD. The contents of A–H in CCY extract were 0.046, 0.640, 0.269, 0.865, 1.637, 0.022, 0.230 and 1.073 mg/mL, respectively. Meanwhile, the contents of A–H in CF extract were 0.013, 0.840, 0.475, 1.598, 1.868, 0.038, 1.254 mg/mL and 1.766 mg/mL, respectively.
3.3. Instrumental and Chromatographic Conditions
The UHPLC-MS/MS system consisted of an Agilent series 1290 system (Agilent, Santa Clara, CA, USA) connected online to a 6430 triple-quadrupole mass spectrometer with an electrospray ionization (ESI) interface (Agilent). Chromatographic separation was performed on an Agilent SB-C
18 column (1.8 µm, 150 mm × 2.1 mm; Agilent) at a flow rate of 0.25 mL/min. The mobile phases were 0.3% acetic acid aqueous solution (A) and acetonitrile (B) with gradient elution program listed in
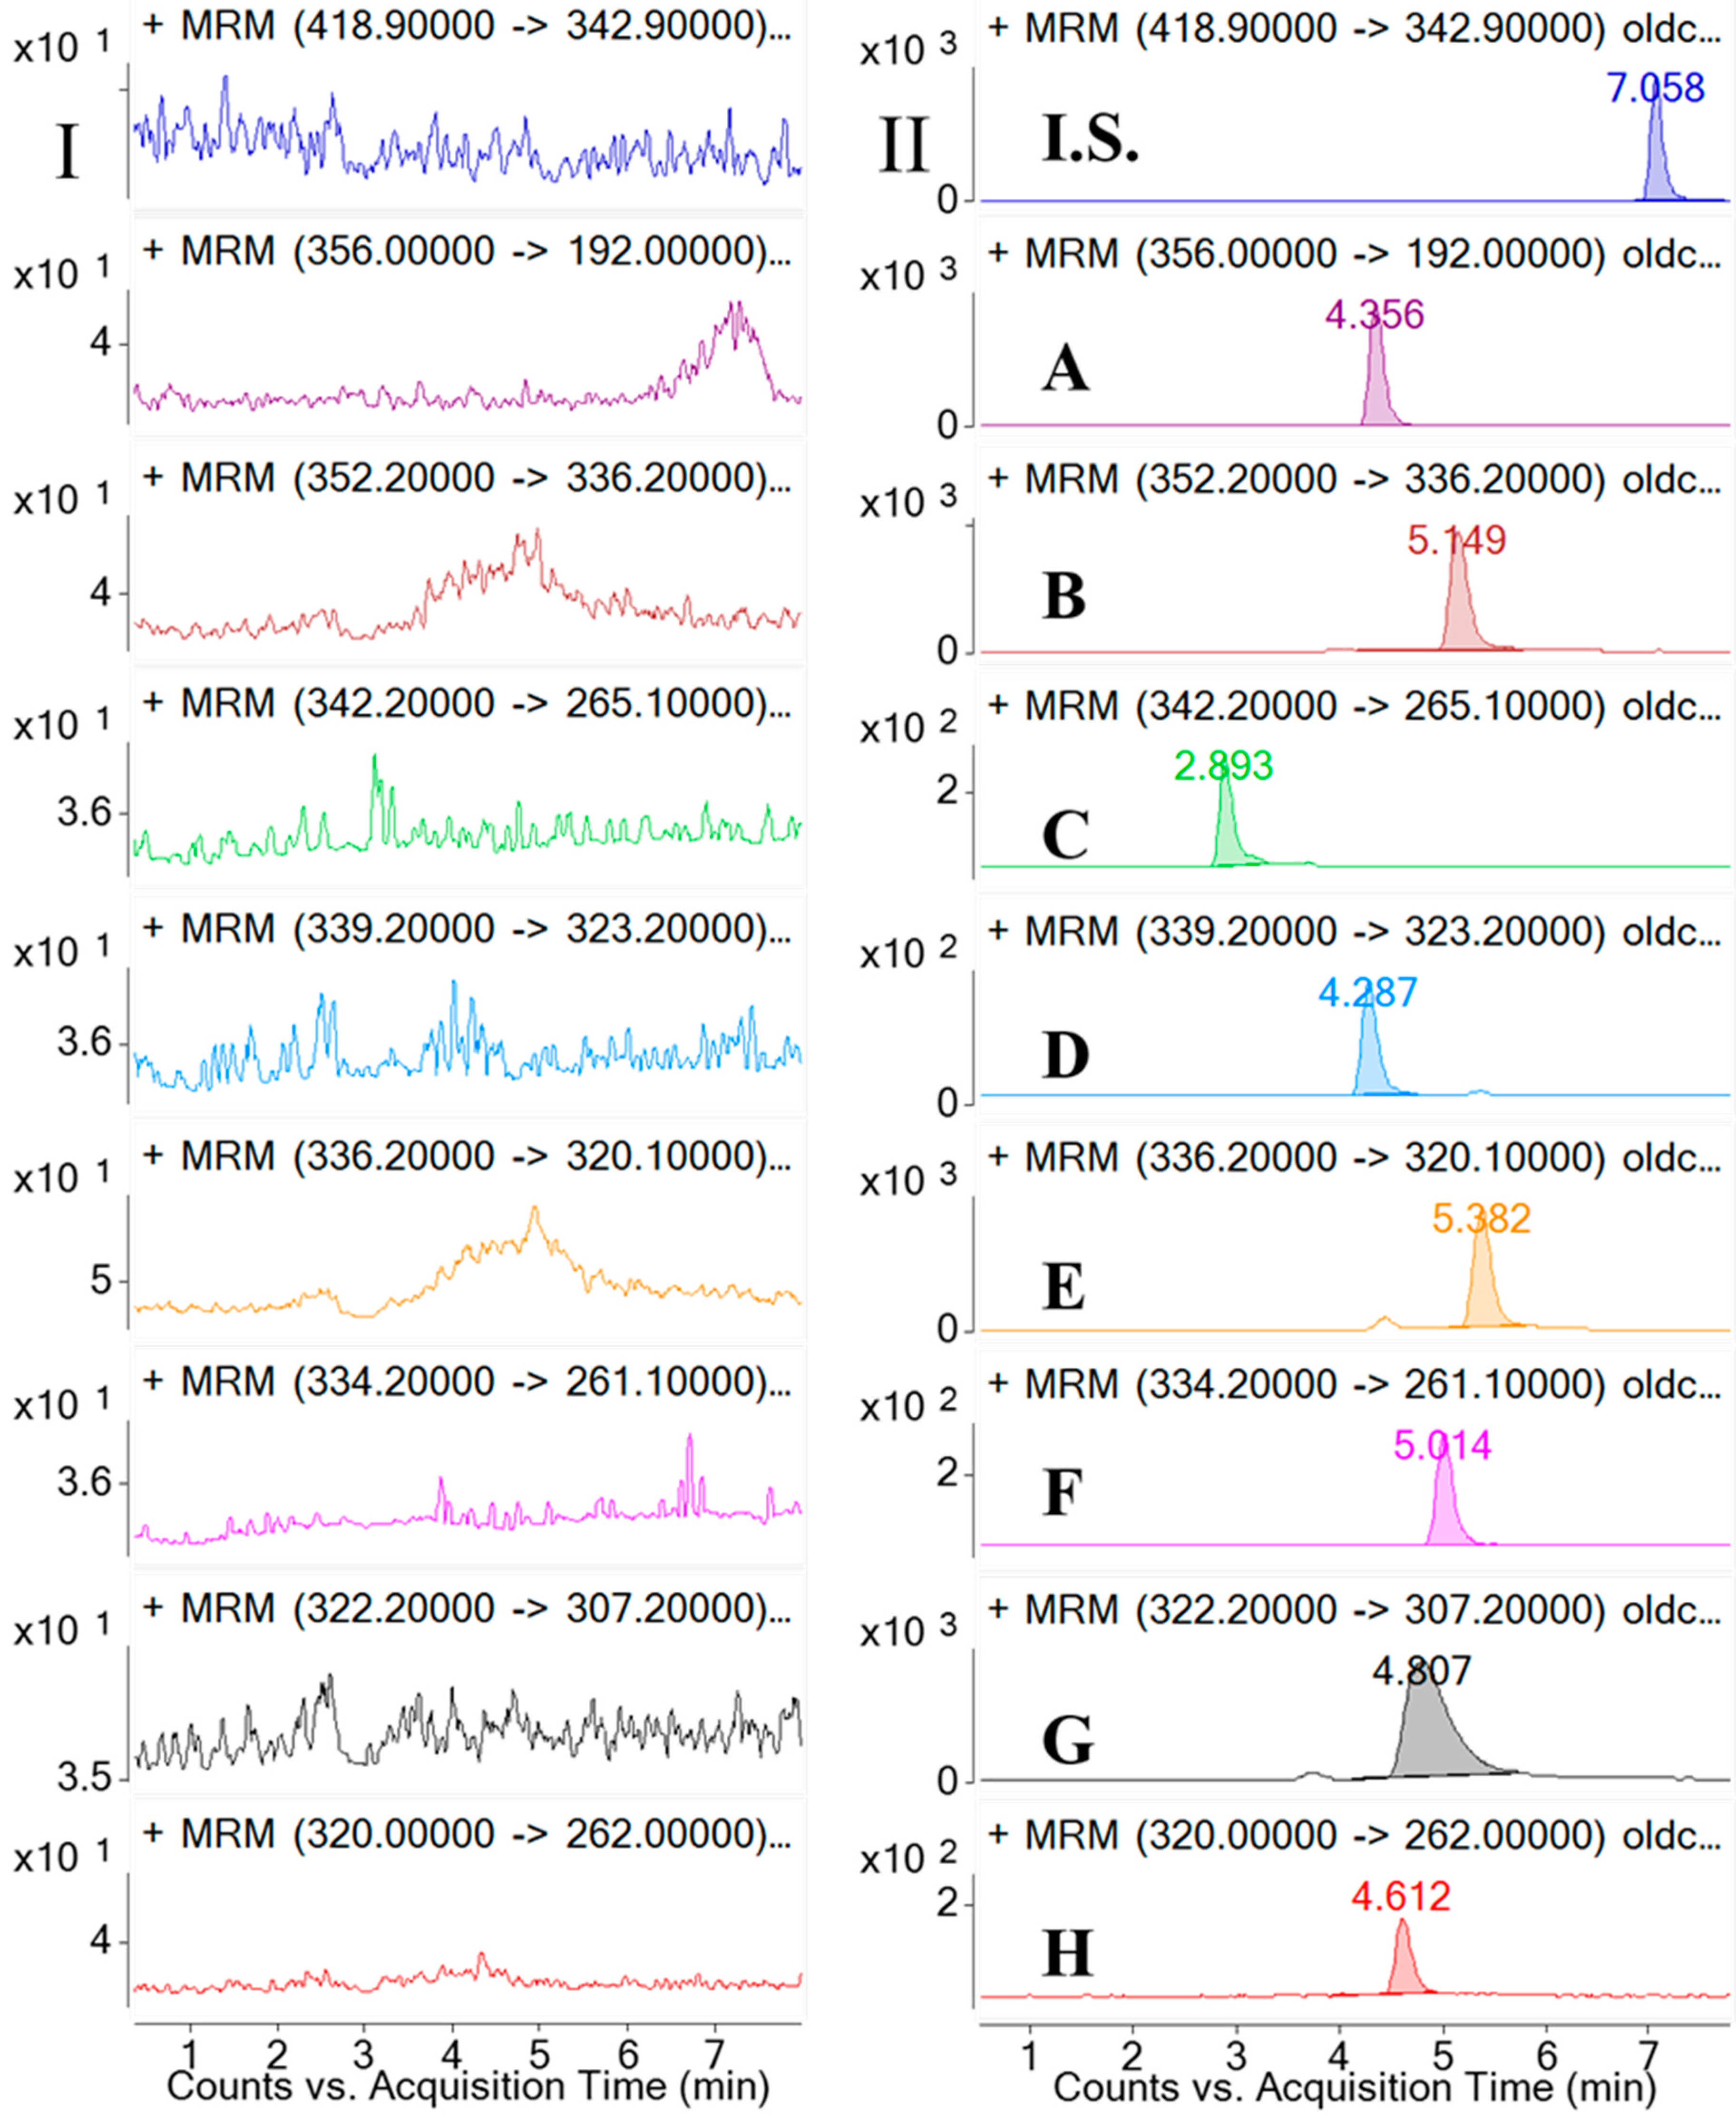
Table 2. The injection volume was 10 µL and the column temperature was 40 °C. Eight analytes and the I.S. were monitored using multiple reaction monitoring (MRM) mode in the positive ionization mode with the following settings after optimization: source voltage of 4.0 kV, drying gas flow rate of 11 L/min, nebulizer pressure of 20 psi, source temperature (TEM) of 300 °C. Gases were 99.999% nitrogen. The MRM transitions, qualifier ions and other MS parameters were listed in
Table 1.
3.4. Preparation of Calibration Standards and Quality Control Samples
Compounds A–H were accurately weighed and dissolved in methanol to make up the stock solutions (1014, 107, 216, 223, 108, 222, 221, 100 µg/mL) which were kept at −4 °C when not in use. A 2 µg/mL solution for the I.S. was also prepared in methanol. The mixed standard stock solution were prepared by dilutions of the stock solution with methanol to obtain a final mixed standard solution containing 2028 ng/mL of A, 428 ng/mL of B, 4320 ng/mL of C, 2230 ng/mL of D, 442 ng/mL of E, 2220 ng/mL of F, 4420 ng/mL of G, 800 ng/mL of H, respectively. And then further diluted in pattern of 1:4:2.5:4:2.5:4:2.5 to produce the working solutions with a series of concentrations. Calibration standards were prepared by spiking appropriate amounts of the mixture standard working solutions into the blank rat plasma to give the nominal concentration range of 0.5–2028 ng/mL for A, 0.1–428 ng/mL for B, 1.1–4320 ng/mL for C, 0.6–2230 ng/mL for D, 0.1–442.0 ng/mL for E, 0.6–2220 ng/mL for F, 1.1–4420 ng/mL for G, 0.2–800 ng/mL for H, respectively. Three levels of the QC samples (2.0, 50.7 and 1622 ng/mL for A, 0.4, 10.7 and 342 ng/mL for B, 4.3, 108 and 3456 ng/mL for C, 2.2, 55.8 and 1784 ng/mL for D, 0.4, 11.1 and 354 ng/mL for E, 2.2, 55.5 and 1776 ng/mL for F, 4.4, 111 and 3536 ng/mL for G, 0.8, 20.0 and 640 ng/mL for H) in drug-free plasma were prepared in the same way as the calibration standards.
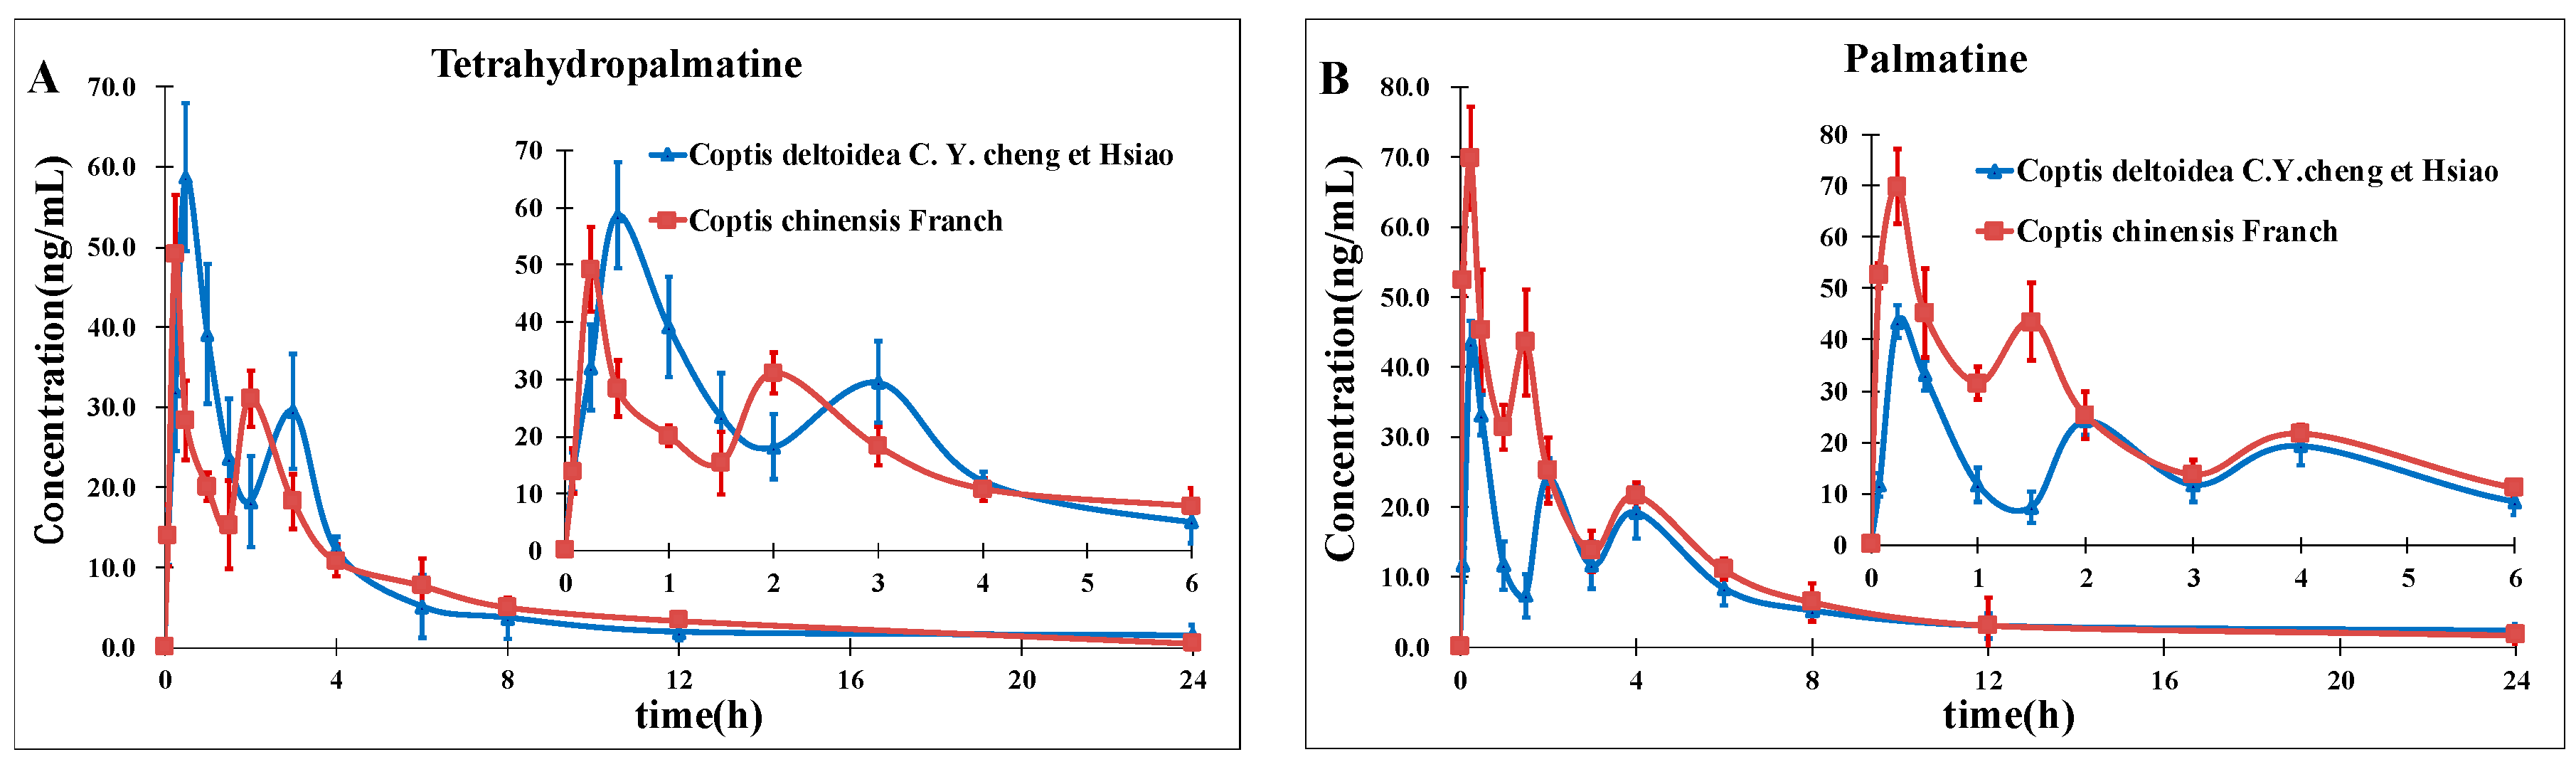
3.5. Animals and Sample Preparation
Blood samples from male Wistar rats which were divided into two groups (body weight 200 ± 15 g) were obtained at specific time points after the oral administration of
CCY (0.148 g/kg) and
CF (0.179 g/kg), which is equal to the dosage of original herbs of 0.09 g per rat (220 g body weight) [
32]. The rats were supplied by Center for Drug Safety Evaluation of Heilongjiang University of Chinese Medicine (Harbin, Heilongjiang, China) and bred under standard laboratory conditions (temperature, 21 ± 1 °C; relative humidity, 60% ± 5%) with free access to chow and water. All rats were fasted overnight with free water supply before experiments, and they had access to water during the experiment. All experimental procedures conducted according to the European Community guidelines for the use of experimental animals [
33]. We have received an animal ethical approval before our experimentation from animal ethics committee of Harbin Medical University. The title of the animal ethical approval was “The pharmacokinetics study of
Rhizoma Coptidis” and this study was approved by the ethics committee of Harbin Medical University on 15 December 2015. For each animal, after the oral administration of
CCY and
CF extracts, 0.25 mL blood samples were withdrawn from the retinal venous plexus into heparinized tubes at several time points. The rat blood samples were processed to obtain plasma by centrifugation at 12,000 rpm for 10 min at −4 °C. 100 µL plasma sample and 50 µL I.S. were transferred to a 10 mL glass tube and vortexed for 60 s, and extracted with 3 mL acetone vortex-mixing for 120 s. After centrifugation at 3800 rpm for 5 min, the upper organic layer was transferred to another tube and evaporated to dryness under a gentle stream of nitrogen at 40 °C. The residue was reconstituted with 100 µL of the mobile phase, vortexed for 60 s and filtered by a 0.22 µm membrane. A 10 µL aliquot of the solution was injected into the LC-ESI-MS/MS system for analysis.
3.6. Method Validation
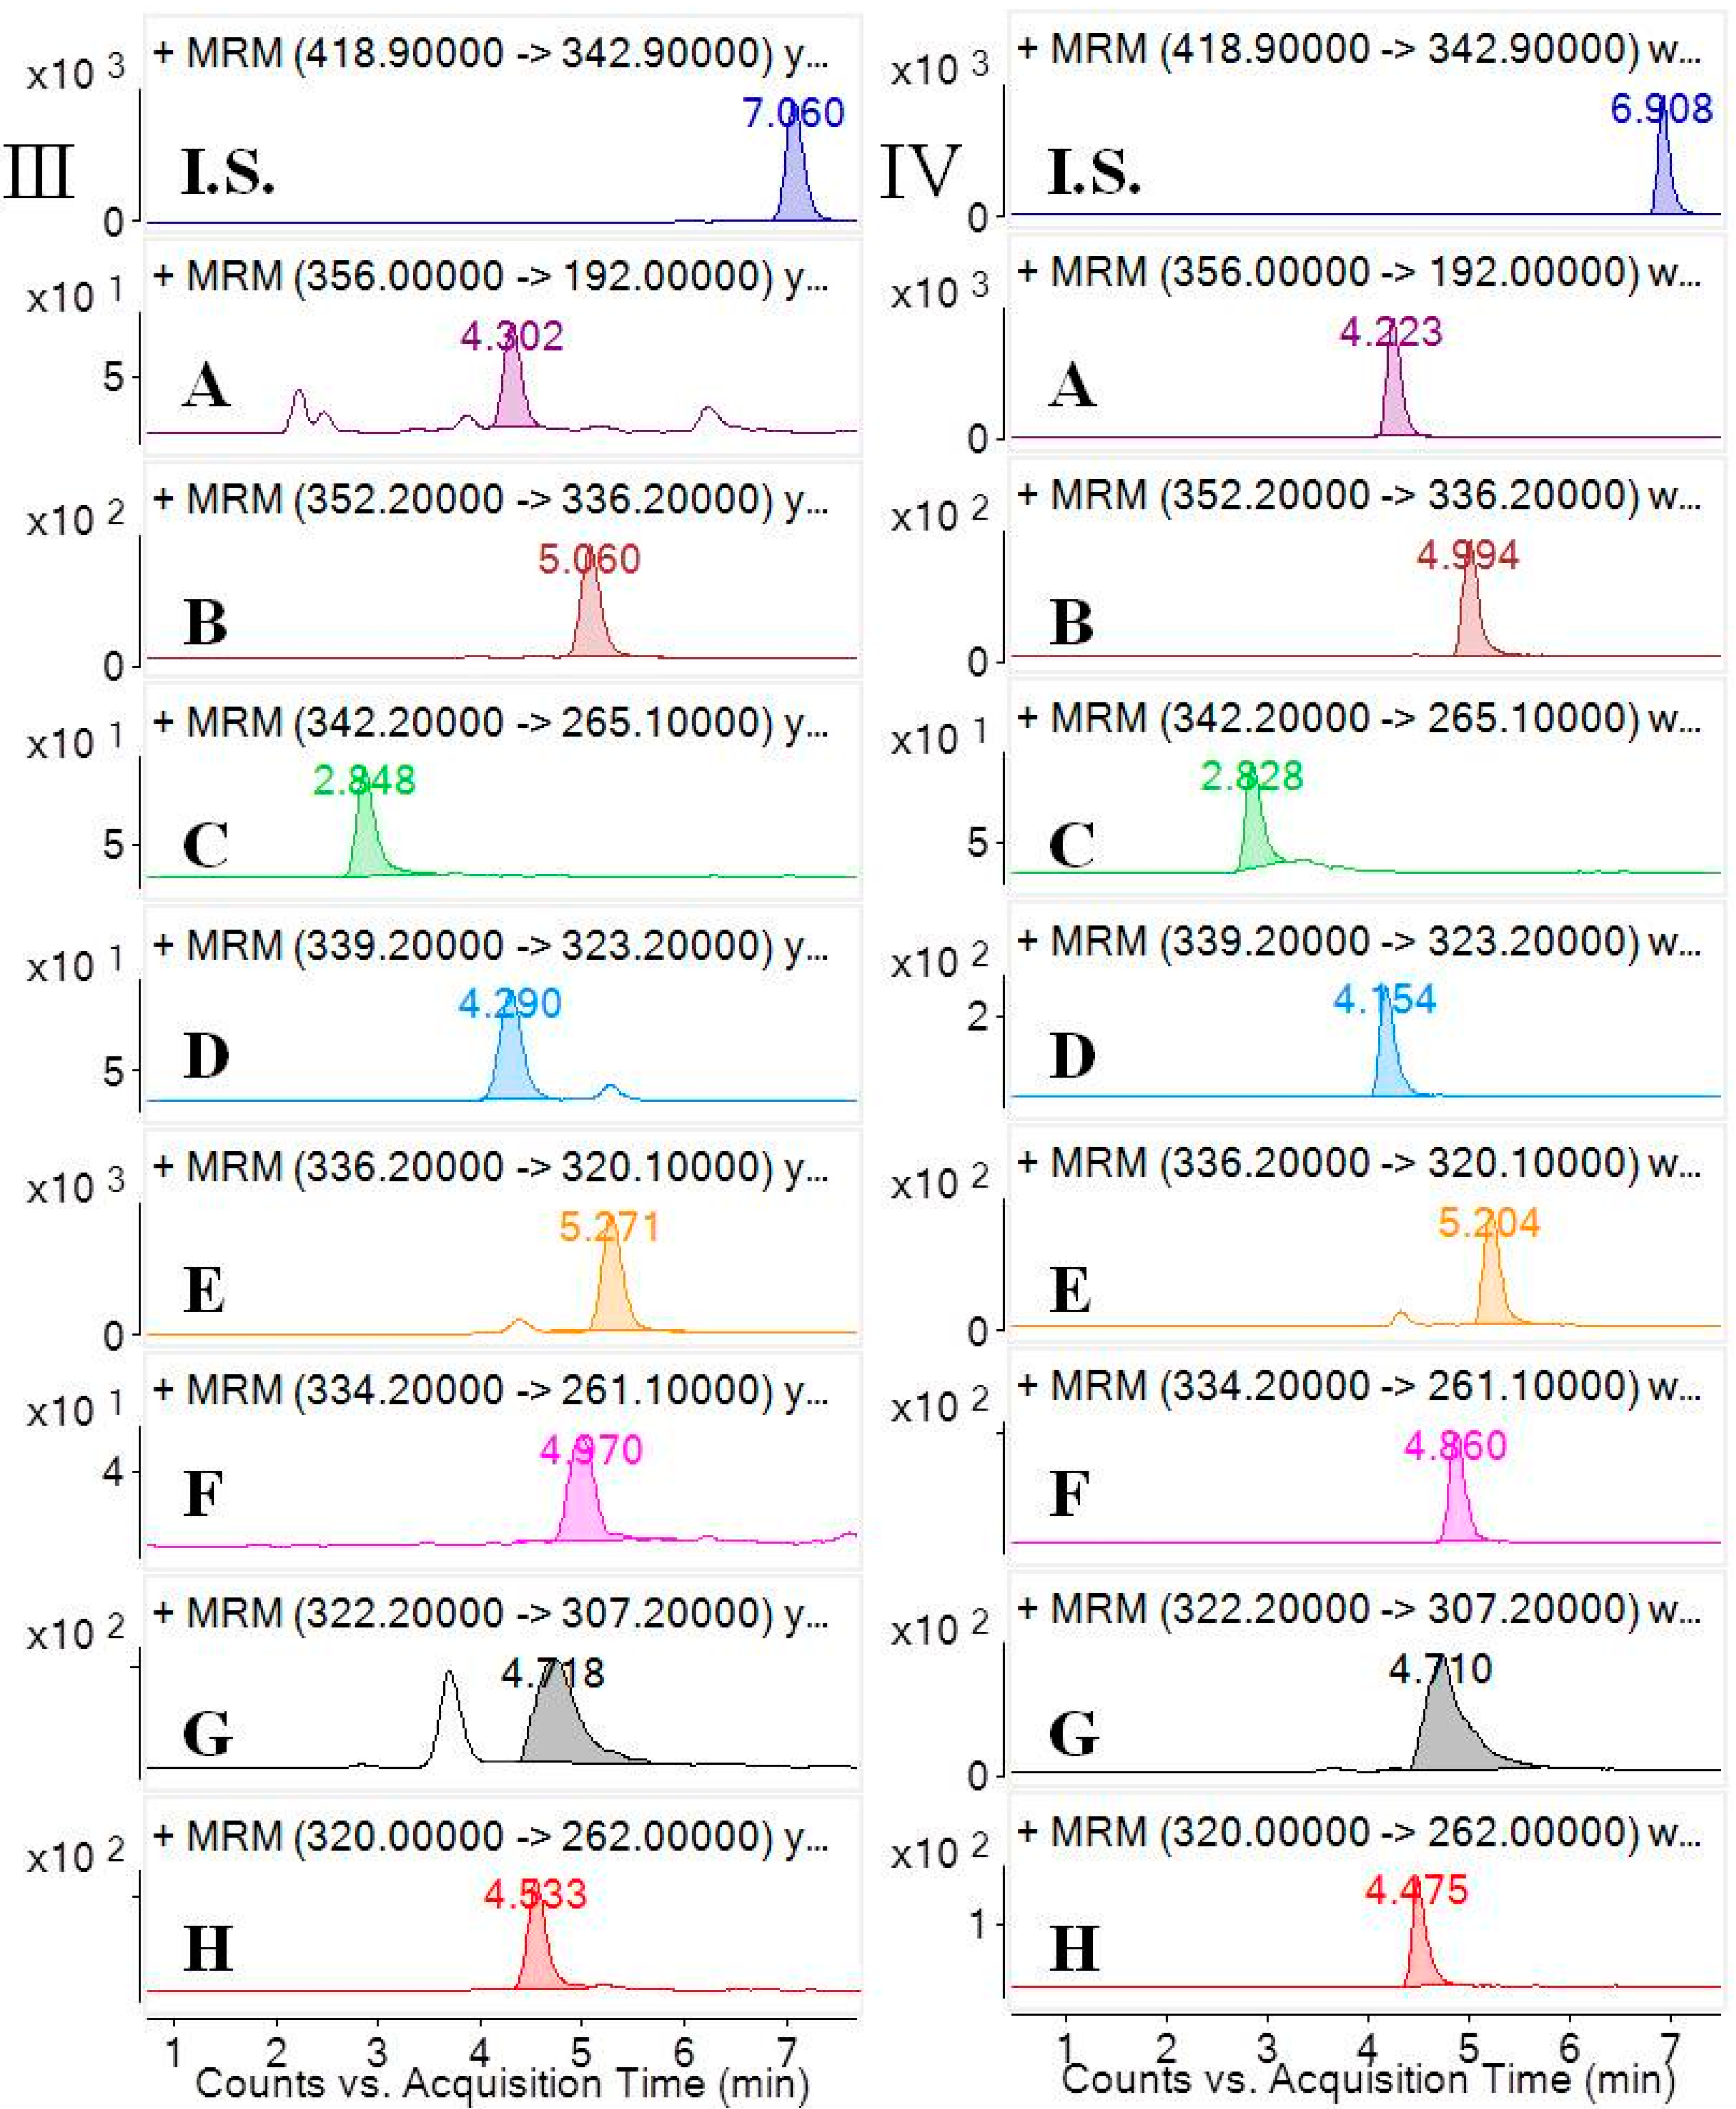
3.6.1. Selectivity and Specificity
Selectivity was investigated by analyzing blank samples from fourteen different batches of rat plasma. The representative MRM chromatograms of blank plasma and corresponding blank plasma spiked with the eight analytes and the I.S., and the plasma samples from the rats after oral administration of the
CCY and
CF extract were compared. The selectivity of these analytes are shown in
Figure 2. Specificity refers to the ability of analytical method to differentiate and quantify the analytes in the presence of other components.
3.6.2. Linearity and Lower Limit of Quantification
The calibration curves were determined by plotting the peak area ratio (Y) of the analytes to the I.S. versus the nominal concentration (X) of analytes with weighted (1/X2) least square linear regression. The LLOQ for analytes of the assay was defined as the lowest concentrations of the calibration curve that could be quantitated with the S/N of at least 10 with sufficient precision (±20%) and accuracy (80%–120%).
3.6.3. Precision and Accuracy
Intra- and inter-day precision and accuracy were investigated by determining LLOQ and QC samples at three concentration levels (six replicates for each concentration level) on three consecutive days. The concentrations of the QC samples were determined from the standard calibration curve and were analysed on the same day. Precision was expressed as the relative standard deviation (RSD%) and the accuracy was defined as the percentage relative error (RE%), both required to be within ±15% except at the LLOQ where ≤20% was acceptable.
3.6.4. Recovery and Matrix Effect
The extraction recoveries of the eight analytes were assessed by comparing the mean peak areas of blank matrix samples spiked before and after extraction of the three QC samples (n = 6). The matrix effects of the eight analytes were assessed by comparing the mean peak areas of QC samples spiked after sample preparation with the mean peak areas of the unextracted samples (n = 6).
3.6.5. Stability
The stability was investigated by assessing six replicates of the QC samples at three concentration levels in different conditions. These conditions included freeze-thaw stability (frozen at −20 °C and thaw cycles), room temperature stability (storage for 4 hours at ambient temperature), long term stability (storage for 2 weeks at −20 °C), and post-preparation stability (storage for 12 h after sample preparation at 4 °C). The samples were considered stable if the RE% was within 15% of the actual value.


