
Ethyl Acetate Abatement on Copper Catalysts Supported on Ceria Doped with Rare Earth Oxides

 ,
,  ,
,  , ,
, ,
Abstract
:
1. Introduction
2. Results
2.1. Textural Characterization
2.2. XRD
2.3. H2-TPR
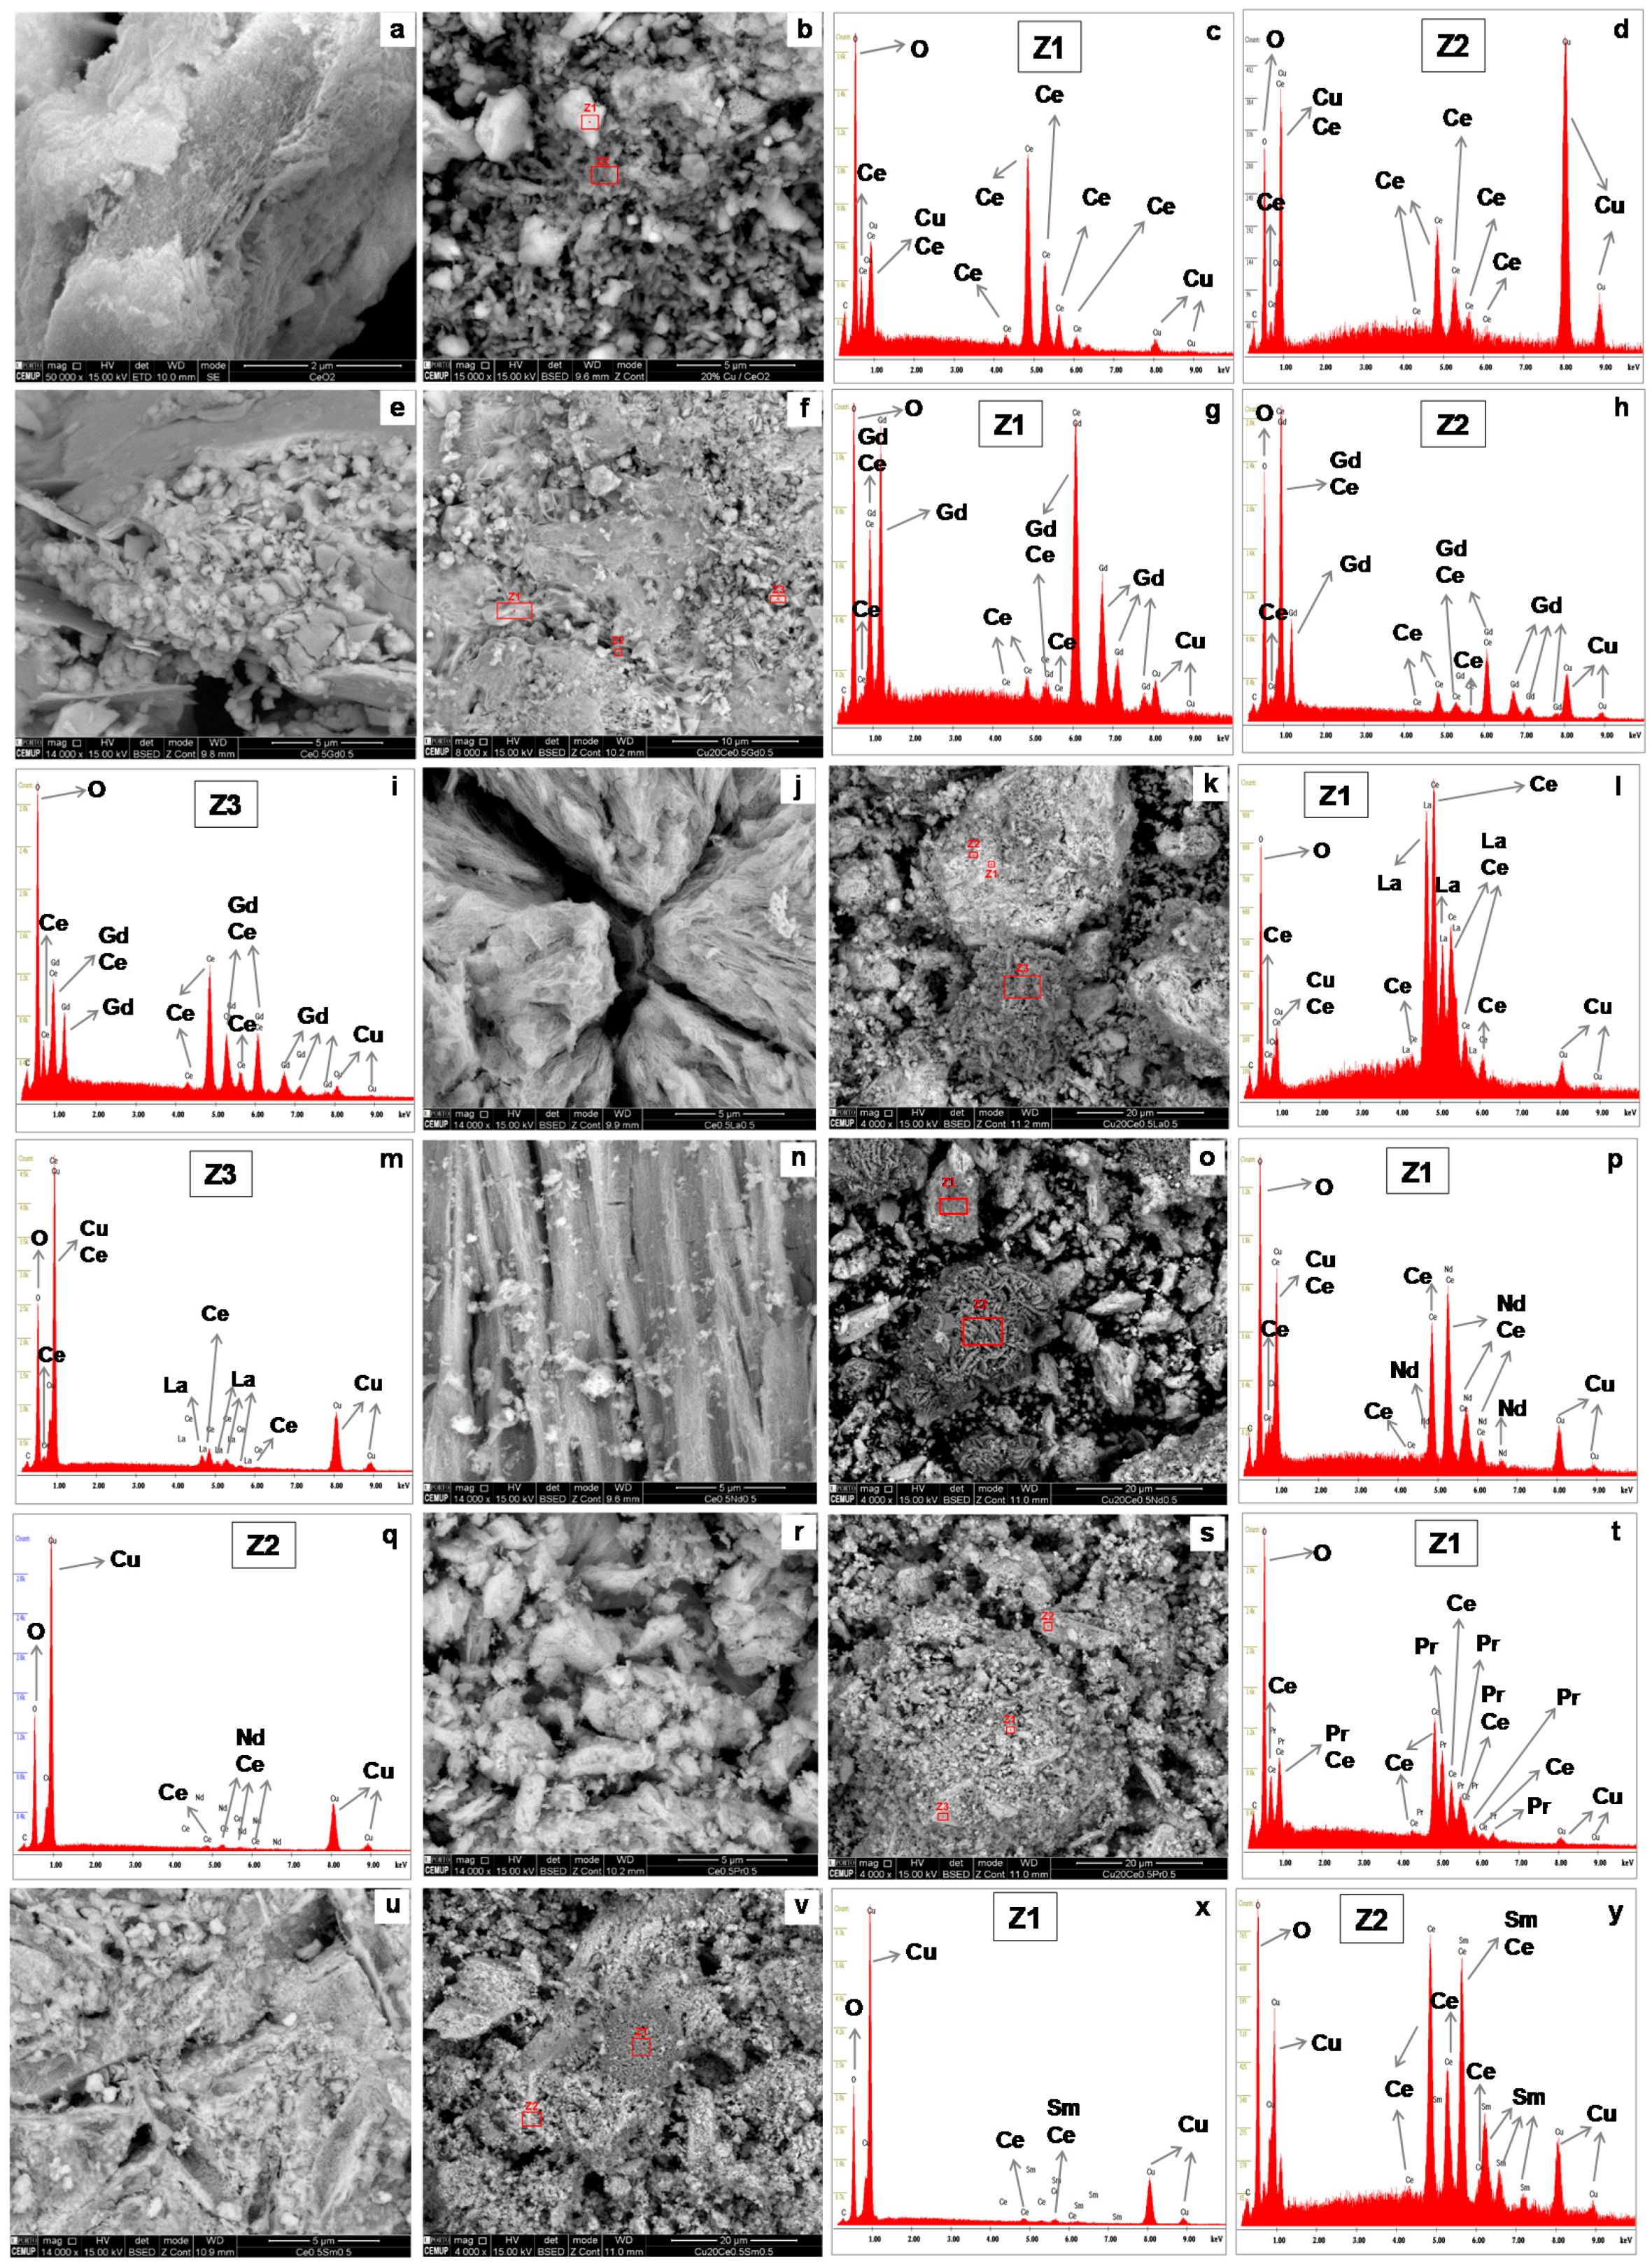
2.4. SEM/EDS
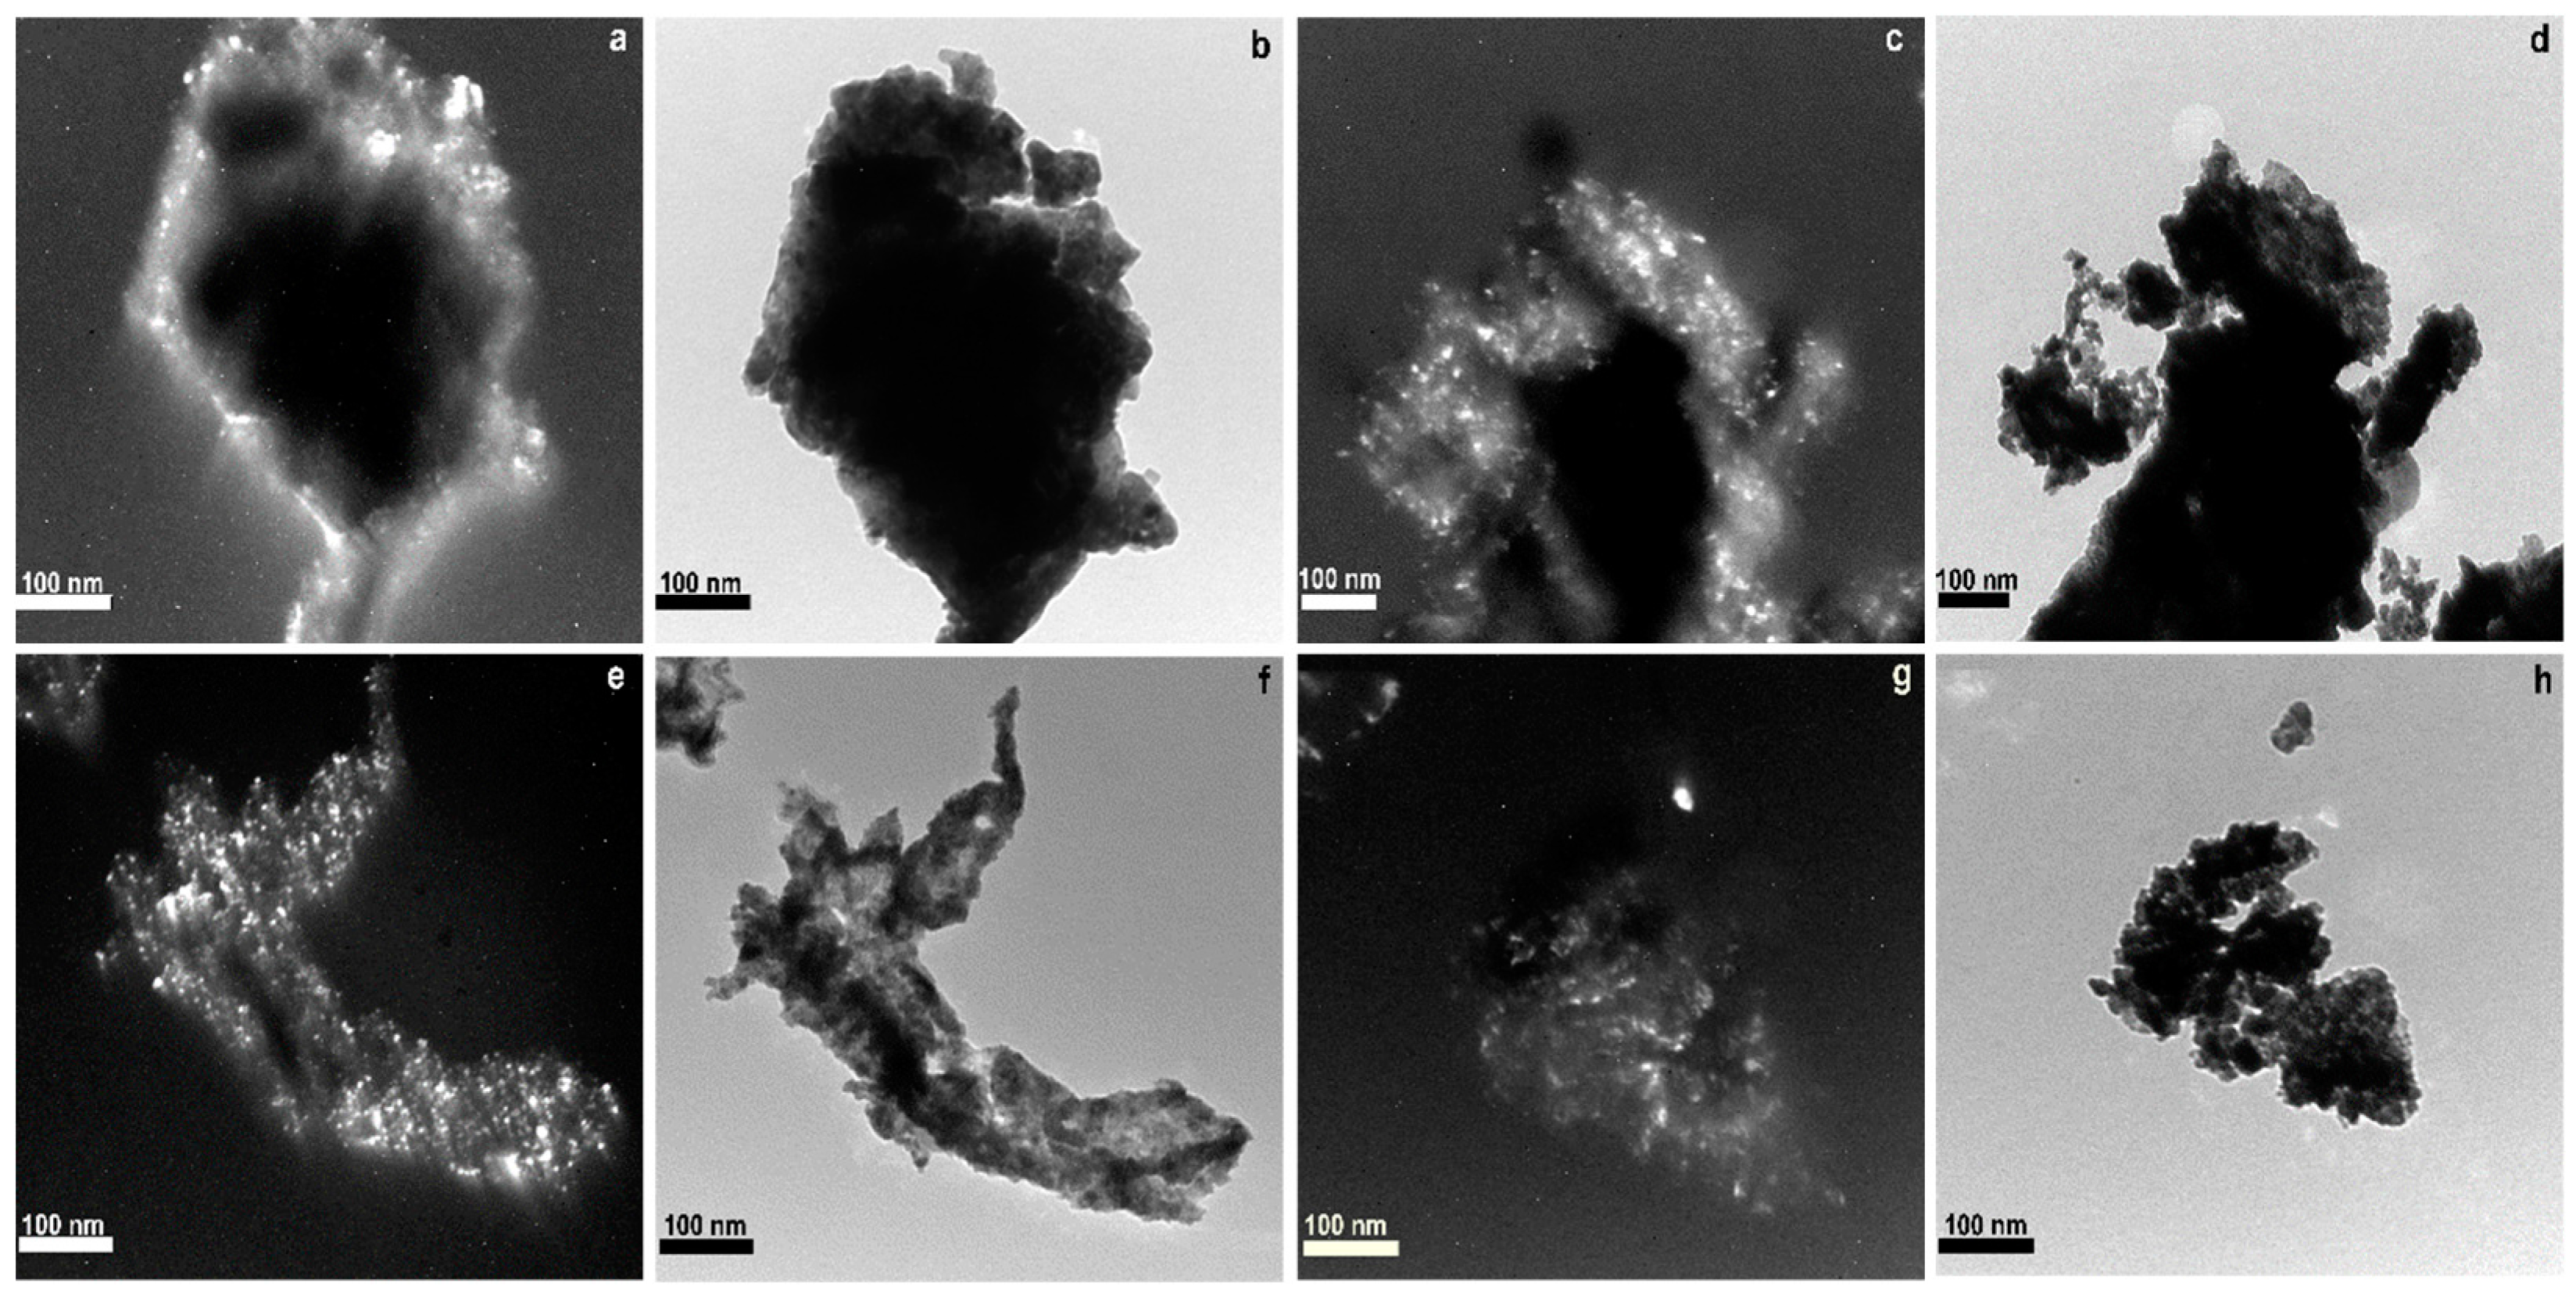
2.5. TEM
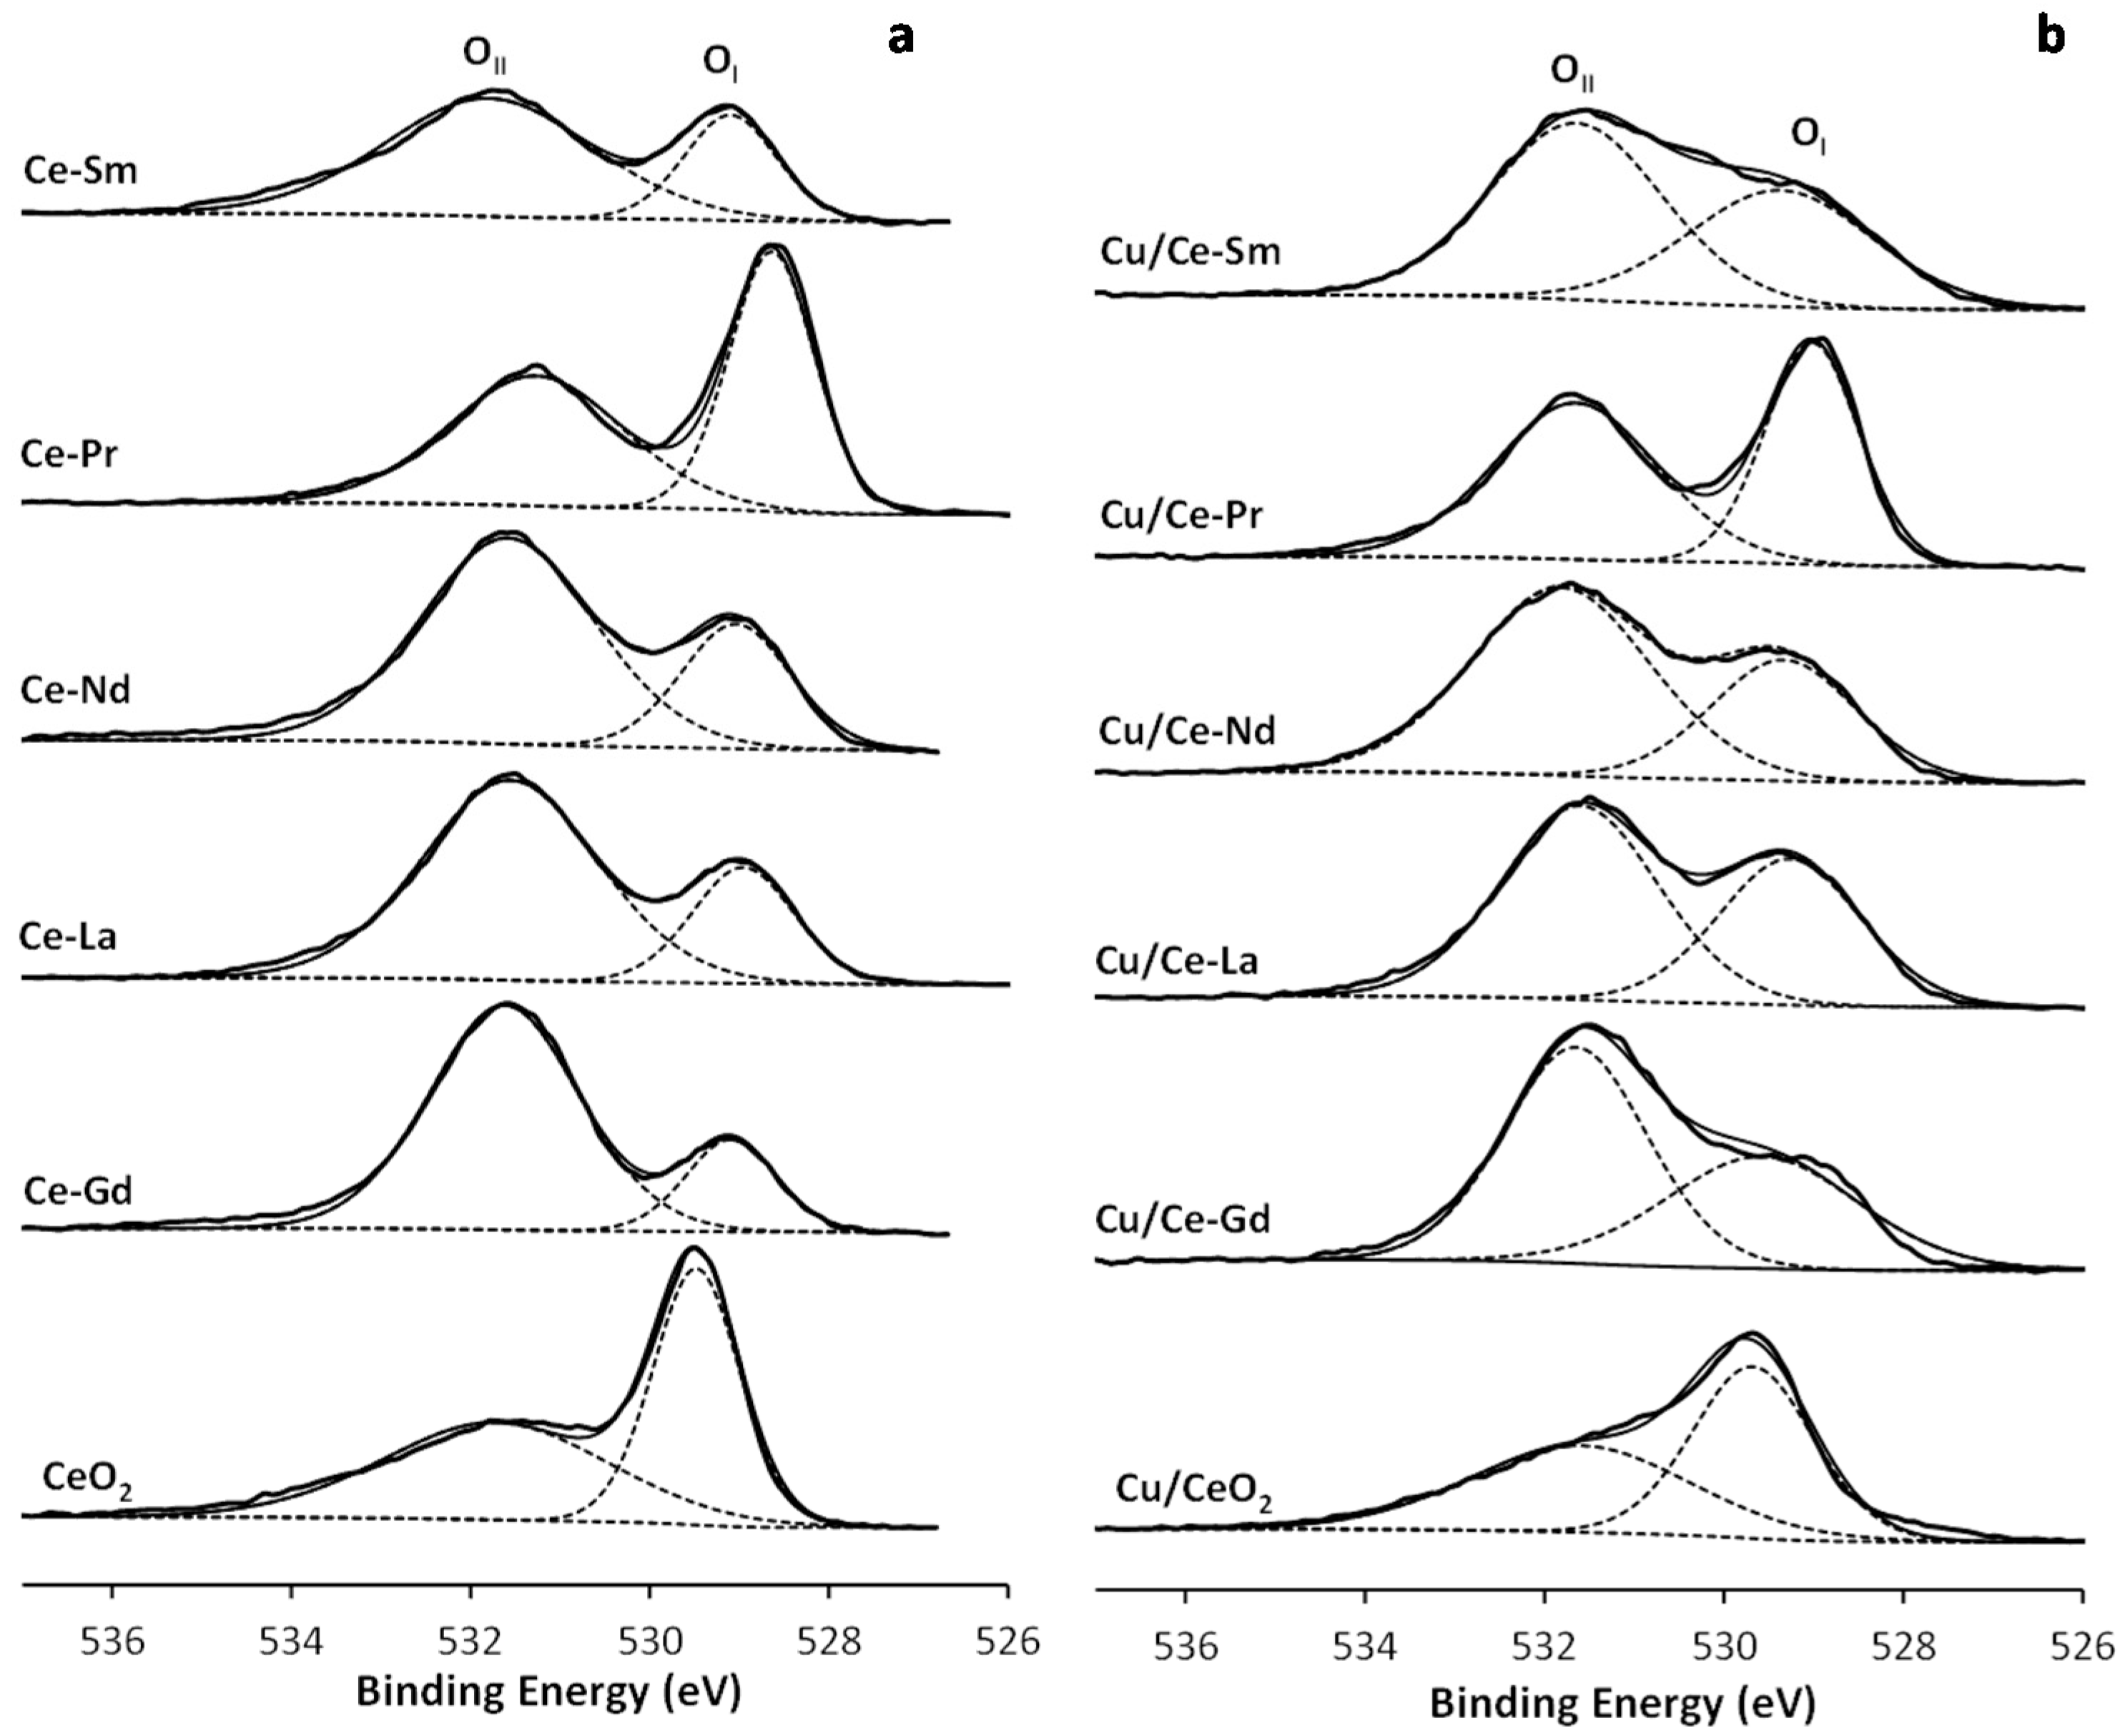
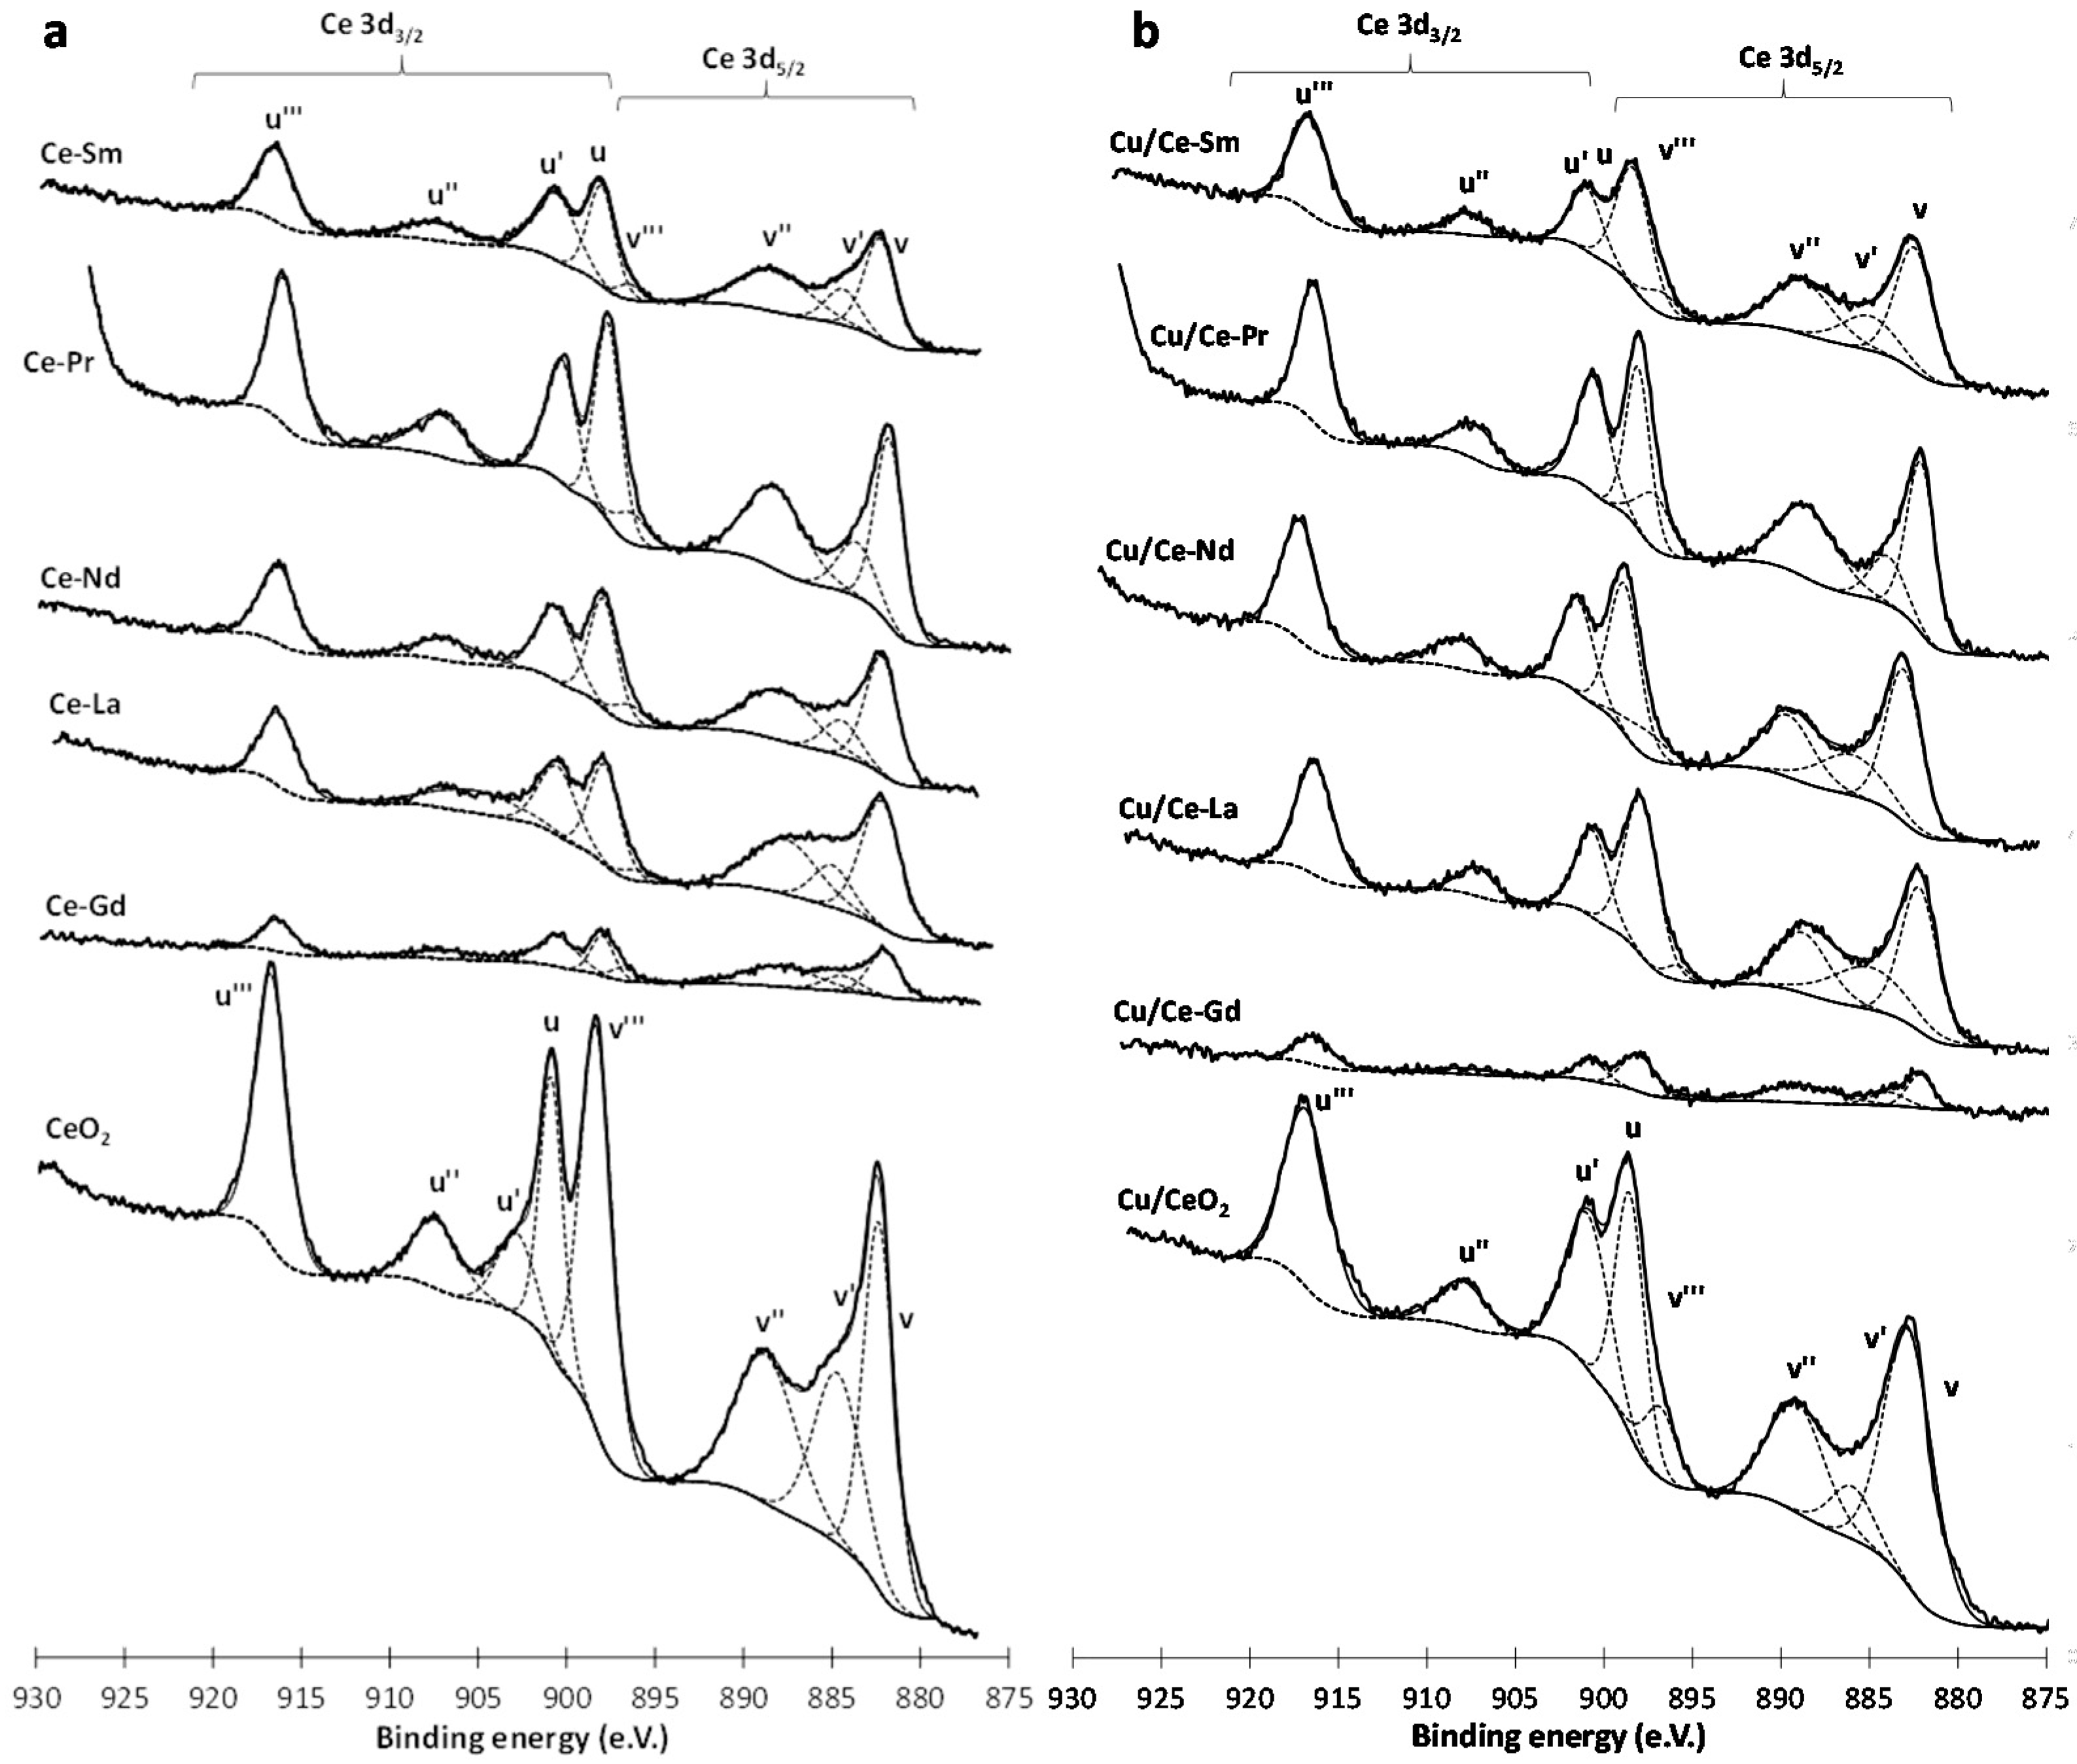
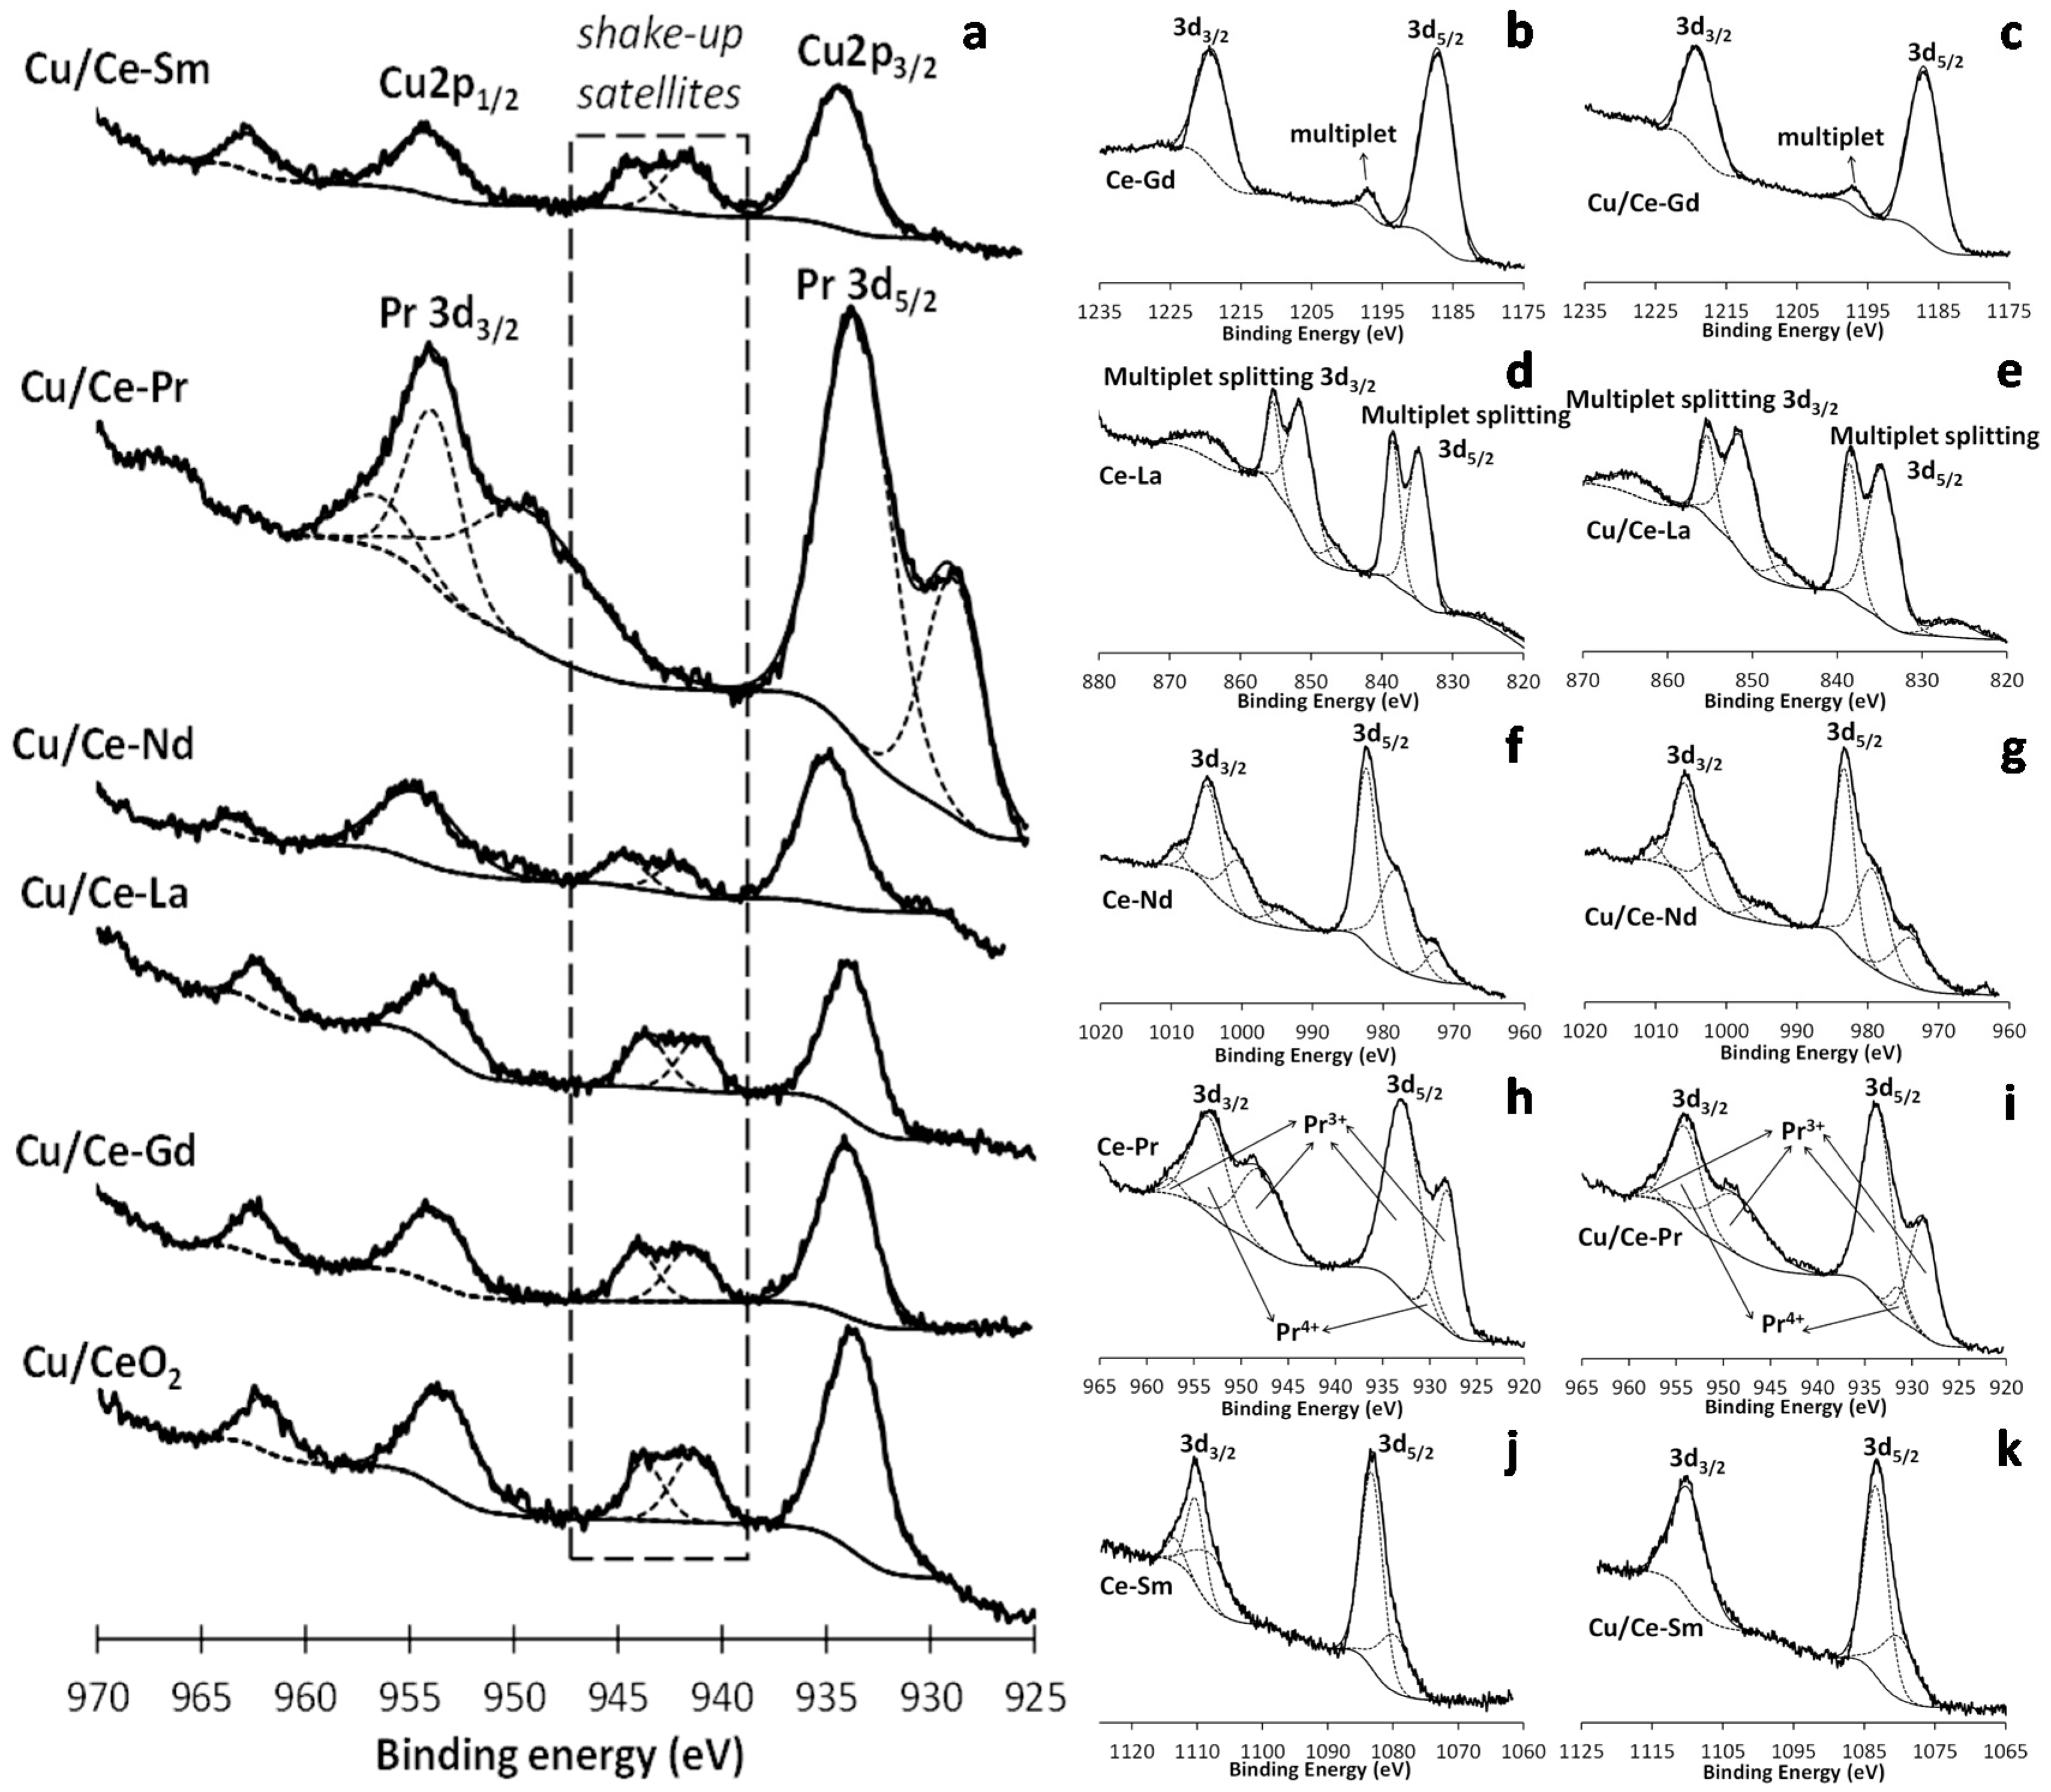
2.6. XPS
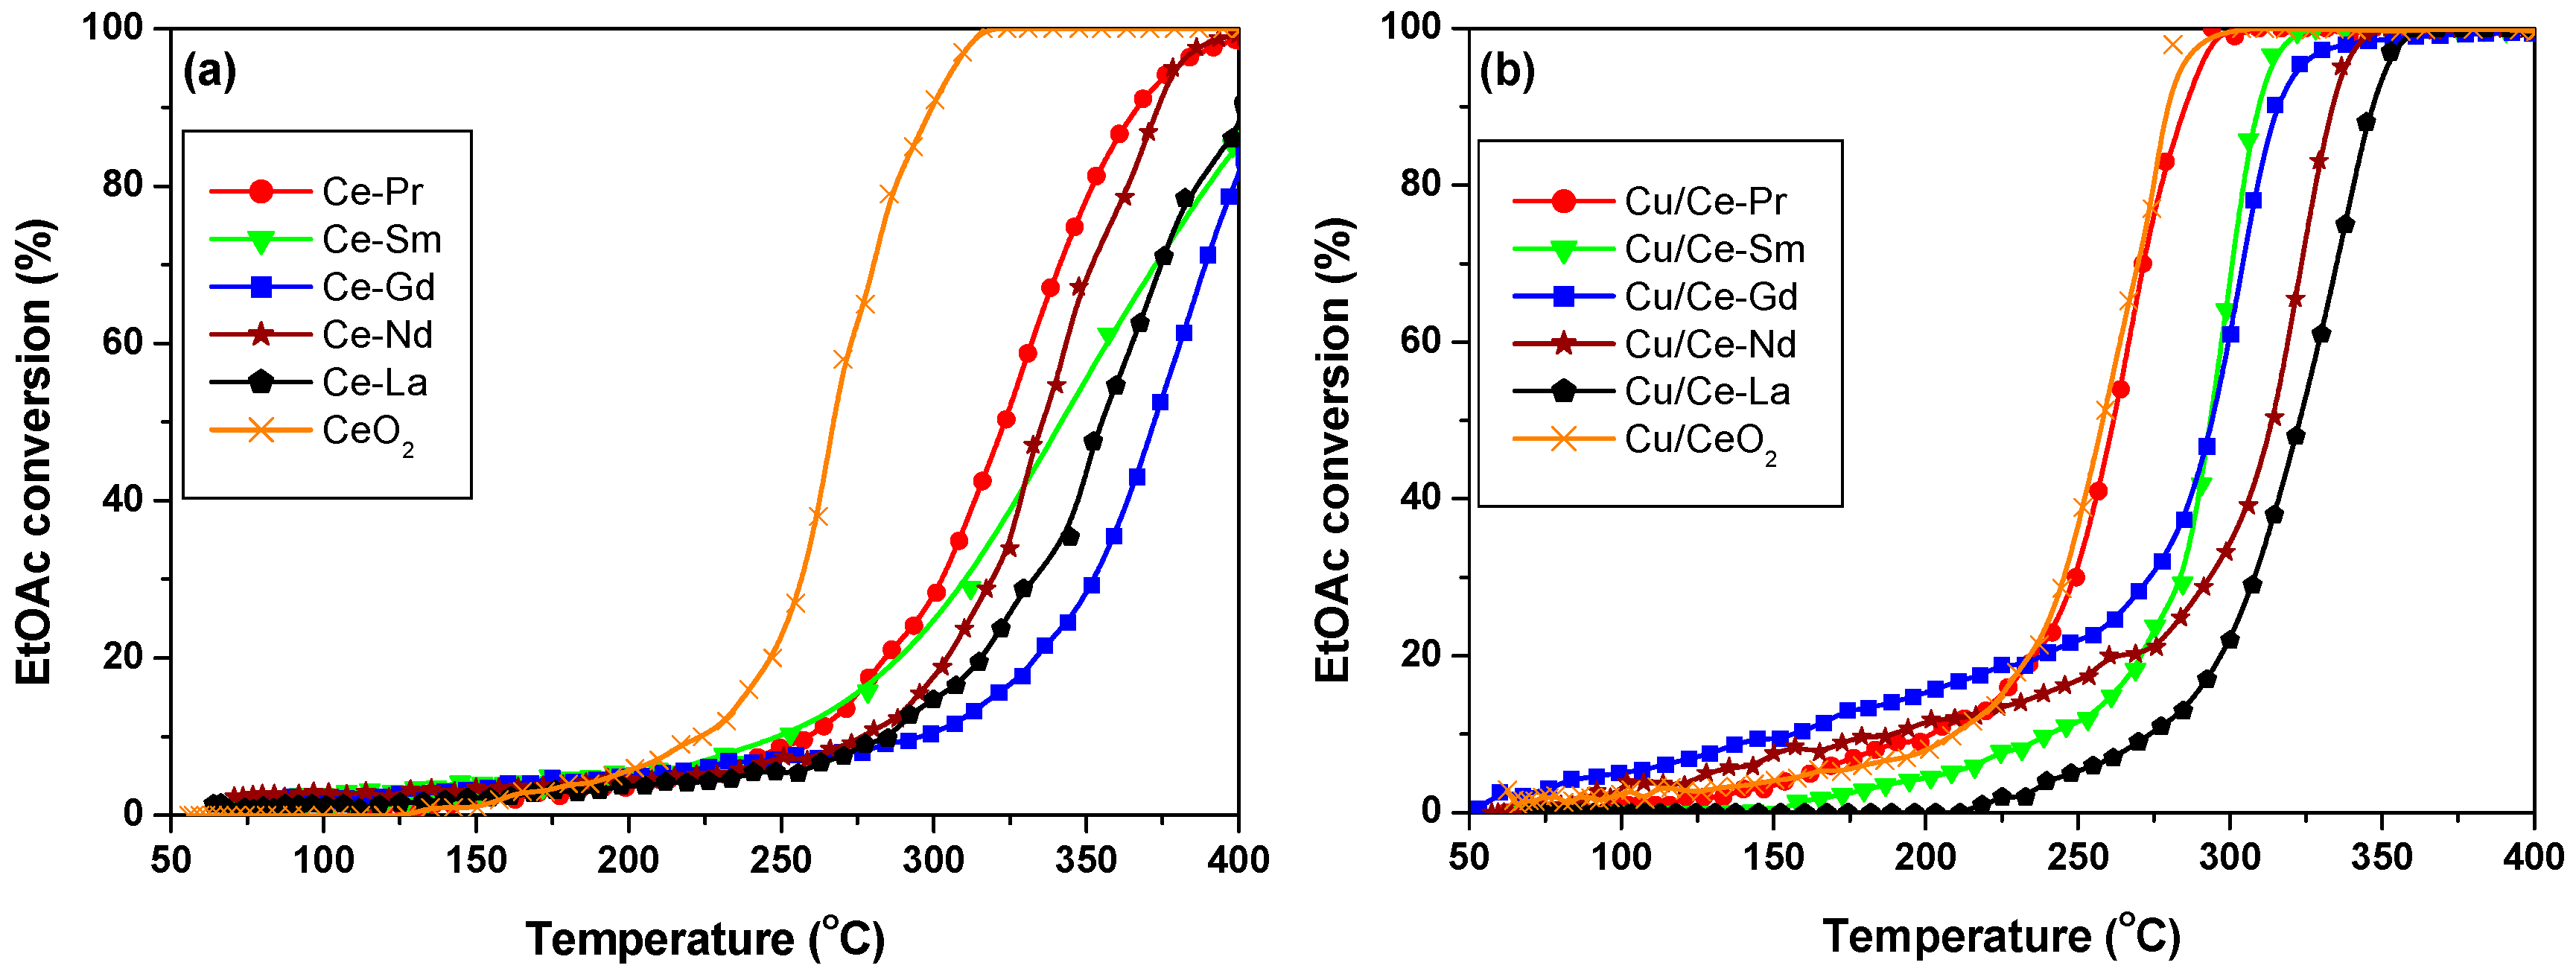
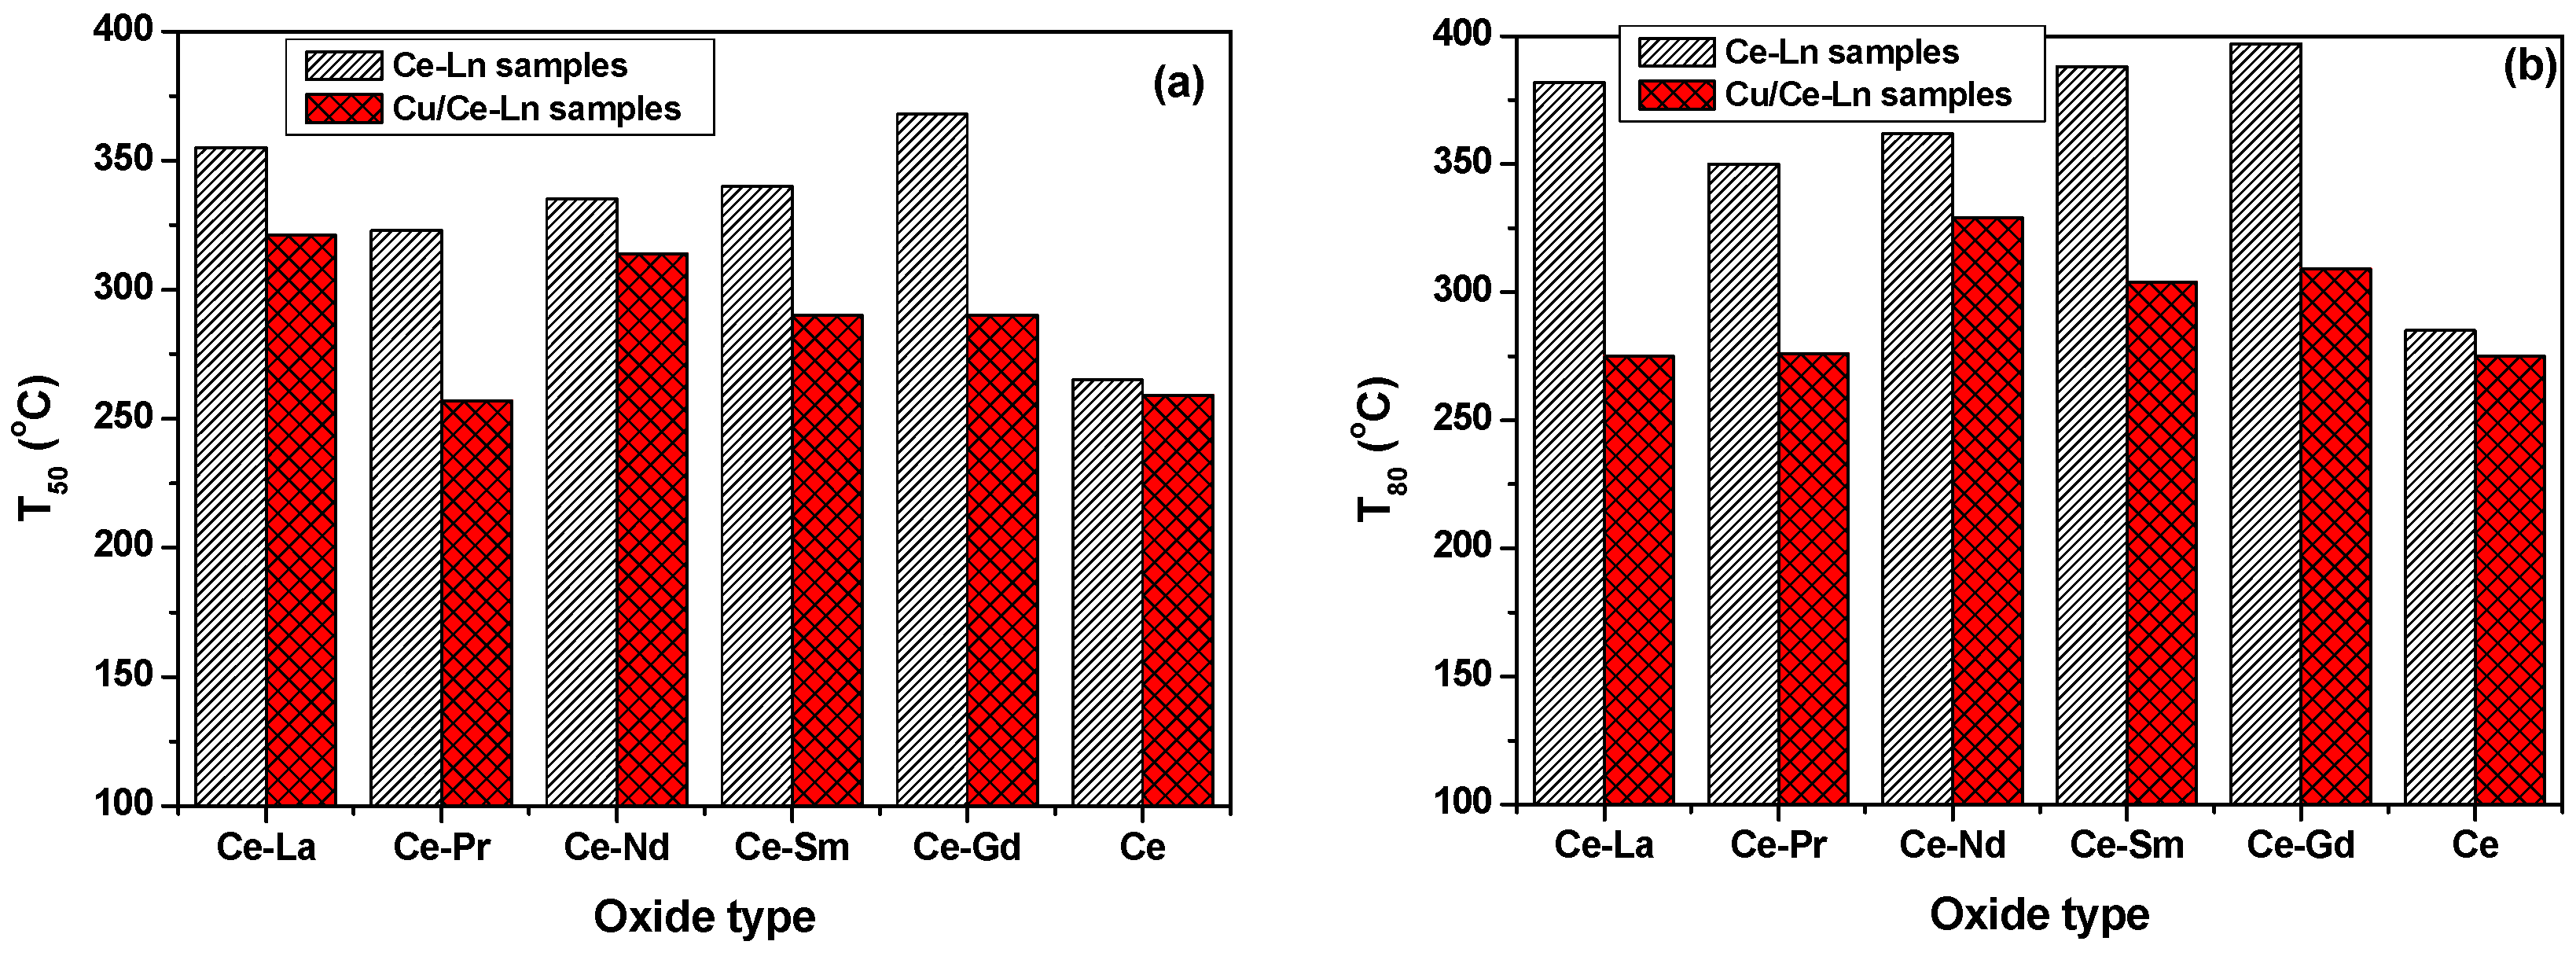
2.7. Catalytic Oxidation of EtOAc
3. Discussion
4. Materials and Methods
4.1. Material Synthesis
4.2. Characterization Studies
4.2.1. Textural Characterization
4.2.2. XRD
4.2.3. TPR
4.2.4. SEM
4.2.5. TEM
4.2.6. XPS
4.3. Catalytic Activity Measurements
5. Conclusions
Acknowledgments
Author Contributions
Conflicts of Interest
References
- Tucker, W.G. Volatile Organic Compounds. In Indoor Air Quality Handbook; Digital Engineering Library @ McGraw-Hill: New York, NY, USA, 2004. [Google Scholar]
- Khan, F.I.; Ghoshal, A.K. Removal of Volatile Organic Compounds from Polluted Air. J. Loss Prev. Process Ind. 2000, 13, 527–545. [Google Scholar] [CrossRef]
- Garcia, T.; Solsona, B.; Taylor, S.H. The oxidative destruction of hydrocarbon volatile organic compounds using palladium–vanadia–titania catalysts. Catal. Lett. 2004, 97, 99–103. [Google Scholar] [CrossRef]
- Huang, Y.-C.; Luo, C.-H.; Yang, S.; Lin, Y.-C.; Chuang, C.-Y. Improved Removal of Indoor Volatile Organic Compounds by Activated Carbon Fiber Filters Calcined with Copper Oxide Catalyst. Clean Soil Air Water 2010, 38, 993–997. [Google Scholar] [CrossRef]
- Heynderickx, P.M.; Thybaut, J.W.; Poelman, H.; Poelman, D.; Marin, G.B. The total oxidation of propane over supported Cu and Ce oxides: A comparison of single and binary metal oxides. J. Catal. 2010, 272, 109–120. [Google Scholar] [CrossRef]
- Wyrwalski, F.; Lamonier, J.F.; Perez-Zurita, M.J.; Siffert, S.; Aboukaïs, A. Influence of the Ethylenediamine Addition on the Activity, Dispersion and Reducibility of Cobalt Oxide Catalysts Supported over ZrO2 for Complete VOC Oxidation. Catal. Lett. 2006, 108, 87–95. [Google Scholar] [CrossRef]
- Pooperasupong, S.; Caussat, B.; Damronglerd, S. Air Pollution Control by Oxidation of Aromatic Hydrocarbon over Supported Metal Oxide. ScienceAsia 2008, 34, 119–122. [Google Scholar] [CrossRef]
- Moretti, E.C. Reduce VOC and HAP Emissions. Chem. Eng. Prog. 2002, 98, 30–40. [Google Scholar]
- Ojala, S.; Lassi, U.; Harkonen, M.; Maunula, T.; Silvonen, R.; Keiski, R. Durability of VOC catalysts in solvent emission oxidation. Chem. Eng. J. 2006, 120, 11–16. [Google Scholar] [CrossRef]
- Santos, V.P.; Carabineiro, S.A.C.; Tavares, P.B.; Pereira, M.F.R.; Órfão, J.J.M.; Figueiredo, J.L. Oxidation of CO, ethanol and toluene over TiO2 supported noble metal catalysts. Appl. Catal. B Environ. 2010, 99, 198–205. [Google Scholar] [CrossRef]
- Minicò, S.; Scirè, S.; Crisafulli, C.; Maggiore, R.; Galvagno, S. Catalytic combustion of volatile organic compounds on gold/iron oxide catalysts. Appl. Catal. B Environ. 2000, 28, 245–251. [Google Scholar] [CrossRef]
- Centeno, M.A.; Paulis, M.; Montes, M.; Odriozola, J.A. Catalytic combustion of volatile organic compounds on Au/CeO2/Al2O3 and Au/Al2O3 catalysts. Appl. Catal. A Gen. 2002, 234, 65–78. [Google Scholar] [CrossRef]
- Carabineiro, S.A.C.; Thompson, D.T. Catalytic Applications for Gold Nanotechnology. In Nanocatalysis; Heiz, U., Landman, U., Eds.; Springer Berlin Heidelberg: Berlin, Germany, 2007; pp. 377–489. [Google Scholar]
- Solsona, B.; Garcia, T.; Aylón, E.; Dejoz, A.M.; Vázquez, I.; Agouram, S.; Davies, T.E.; Taylor, S.H. Promoting the activity and selectivity of high surface area Ni–Ce–O mixed oxides by gold deposition for VOC catalytic combustion. Chem. Eng. J. 2011, 175, 271–278. [Google Scholar] [CrossRef]
- Bastos, S.S.T.; Carabineiro, S.A.C.; Órfão, J.J.M.; Pereira, M.F.R.; Delgado, J.J.; Figueiredo, J.L. Total oxidation of ethyl acetate, ethanol and toluene catalyzed by exotemplated manganese and cerium oxides loaded with gold. Catal. Today 2012, 180, 148–154. [Google Scholar] [CrossRef]
- Carabineiro, S.A.C.; Chen, X.; Martynyuk, O.; Bogdanchikova, N.; Avalos-Borja, M.; Pestryakov, A.; Tavares, B.; Orfao, J.J.M.; Pereira, M.F.R.; Figueiredo, J.L. Gold supported on metal oxides for volatile organic compounds total oxidation. Catal. Today 2015, 244, 103–114. [Google Scholar] [CrossRef]
- Solsona, B.E.; Garcia, T.; Jones, C.; Taylor, S.H.; Carley, A.F.; Hutchings, G.J. Supported gold catalysts for the total oxidation of alkanes and carbon monoxide. Appl. Catal. A Gen. 2006, 312, 67–76. [Google Scholar] [CrossRef]
- Pozan, G.S. Effect of support on the catalytic activity of manganese oxide catalyts for toluene combustion. J. Hazard. Mater. 2012, 221, 124–130. [Google Scholar] [CrossRef] [PubMed]
- Chen, X.; Carabineiro, S.A.C.; Bastos, S.S.T.; Tavares, P.B.; Órfão, J.J.M.; Pereira, M.F.R.; Figueiredo, J.L. Exotemplated copper, cobalt, iron, lanthanum and nickel oxides for catalytic oxidation of ethyl acetate. J. Environ. Chem. Eng. 2013, 1, 795–804. [Google Scholar] [CrossRef]
- Krishnamoorthy, S.; Rivas, J.A.; Amiridis, M.D. Catalytic Oxidation of 1,2-Dichlorobenzene over Supported Transition Metal Oxides. J. Catal. 2000, 193, 264–272. [Google Scholar] [CrossRef]
- Garcia, T.; Agouram, S.; Sanchez-Royo, J.F.; Murillo, R.; Mastral, A.M.; Aranda, A.; Vazquez, I.; Dejoz, A.; Solsona, B. Deep oxidation of volatile organic compounds using ordered cobalt oxides prepared by a nanocasting route. Appl. Catal. A Gen. 2010, 386, 16–27. [Google Scholar] [CrossRef]
- García, T.; Dejoz, A.M.; Puértolas, B.; Solsona, B.E. Cobalt Oxide, Co3O4, as a Catalyst for Environmental Applications. In Cobalt: Characteristics, Compounds and Applications; Vidmar, L.J., Ed.; Nova Science Publishers Inc: New York, NY, USA, 2011; pp. 163–186. [Google Scholar]
- Delimaris, D.; Ioannides, T. VOC oxidation over MnOx–CeO2 catalysts prepared by a combustion method. Appl. Catal. B Environ. 2008, 84, 303–312. [Google Scholar] [CrossRef]
- Delimaris, D.; Ioannides, T. VOC oxidation over CuO–CeO2 catalysts prepared by a combustion method. Appl. Catal. B Environ. 2009, 89, 295–302. [Google Scholar] [CrossRef]
- Zhang, Z.; Wan, H.; Guan, G. Catalytic Combustion of Methyl Acetate over Cu-Mn Mixed Oxide Catalyst. In Proceedings of the International Conference on Computer Distributed Control and Intelligent Environmental Monitoring (CDCIEM), Changsha, China, 19–20 February 2011; pp. 1994–1997.
- Konsolakis, M.; Carabineiro, S.A.C.; Tavares, P.B.; Figueiredo, J.L. Redox properties and VOC oxidation activity of Cu catalysts supported on Ce1-xSmxO delta mixed oxides. J. Hazard. Mater. 2013, 261, 512–521. [Google Scholar] [CrossRef] [PubMed]
- Chen, X.; Carabineiro, S.A.C.; Bastos, S.S.T.; Tavares, P.B.; Orfao, J.J.M.; Pereira, M.F.R.; Figueiredo, J.L. Catalytic oxidation of ethyl acetate on cerium-containing mixed oxides. Appl. Catal. A Gen. 2014, 472, 101–112. [Google Scholar] [CrossRef]
- Chen, X.; Carabineiro, S.A.C.; Tavares, P.B.; Órfão, J.J.M.; Pereira, M.F.R.; Figueiredo, J.L. Catalytic oxidation of ethyl acetate over La-Co and La-Cu oxides. J. Environ. Chem. Eng. 2014, 2, 344–355. [Google Scholar] [CrossRef]
- Carabineiro, S.A.C.; Chen, X.; Konsolakis, M.; Psarras, A.C.; Tavares, P.B.; Órfão, J.J.M.; Pereira, M.F.R.; Figueiredo, J.L. Catalytic oxidation of toluene on Ce-Co and La-Co mixed oxides synthesized by exotemplating and evaporation methods. Catal. Today 2015, 244, 161–171. [Google Scholar] [CrossRef]
- Seiyama, T. Total Oxidation of Hydrocarbons on Perovskite Oxides. Catal. Rev. 1992, 34, 281–300. [Google Scholar] [CrossRef]
- Kieûlinga, D.; Schneidera, R.; Kraakb, P.; Haftendornb, M.; Wendta, G. Perovskite-type oxides—Catalysts for the total oxidation of chlorinated hydrocarbons. Appl. Catal. B Environ. 1998, 19, 143–151. [Google Scholar]
- Merino, N.A.; Barbero, B.P.; Ruiz, P.; Cadús, L.E. Synthesis, characterisation, catalytic activity and structural stability of LaCo1−yFeyO3±λ perovskite catalysts for combustion of ethanol and propane. J. Catal. 2006, 240, 245–257. [Google Scholar] [CrossRef]
- Bastos, S.S.T.; Órfão, J.J.M.; Freitas, M.M.A.; Pereira, M.F.R.; Figueiredo, J.L. Manganese oxide catalysts synthesized by exotemplating for the total oxidation of ethanol. Appl. Catal. B Environ. 2009, 93, 30–37. [Google Scholar] [CrossRef]
- Santos, V.P.; Bastos, S.S.T.; Pereira, M.F.R.; Órfão, J.J.M.; Figueiredo, J.L. Stability of a cryptomelane catalyst in the oxidation of toluene. Catal. Today 2010, 154, 308–311. [Google Scholar] [CrossRef]
- Santos, V.P.; Pereira, M.F.R.; Órfão, J.J.M.; Figueiredo, J.L. The role of lattice oxygen on the activity of manganese oxides towards the oxidation of volatile organic compounds. Appl. Catal. B Environ. 2010, 99, 353–363. [Google Scholar] [CrossRef]
- Konsolakis, M.; Ioakeimidis, Z. Surface/structure functionalization of copper-based catalysts by metal-support and/or metal–metal interactions. Appl. Surf. Sci. 2014, 320, 244–255. [Google Scholar] [CrossRef]
- Yang, Y.; Xu, X.; Sun, K. Catalytic combustion of ethyl acetate on supported copper oxide catalysts. J. Hazard. Mater. 2007, 139, 140–145. [Google Scholar] [CrossRef] [PubMed]
- Luo, M.-F.; Ma, J.-M.; Lu, J.-Q.; Song, Y.-P.; Wang, Y.-J. High-surface area CuO–CeO2 catalysts prepared by a surfactant-templated method for low-temperature CO oxidation. J. Catal. 2007, 246, 52–59. [Google Scholar] [CrossRef]
- Gamarra, D.; Hornés, A.; Koppány, Z.; Schay, Z.; Munuera, G.; Soria, J.; Martínez-Arias, A. Catalytic processes during preferential oxidation of CO in H2-rich streams over catalysts based on copper–ceria. J. Power Sources 2007, 169, 110–116. [Google Scholar] [CrossRef]
- Hu, C.; Zhu, Q.; Jiang, Z.; Chen, L.; Wu, R. Catalytic combustion of dilute acetone over Cu-doped ceria catalysts. Chem. Eng. J. 2009, 152, 583–590. [Google Scholar] [CrossRef]
- Liotta, L.F.; Di Carlo, G.; Pantaleo, G.; Venezia, A.M.; Deganello, G. Co3O4/CeO2 composite oxides for methane emissions abatement: Relationship between Co3O4–CeO2 interaction and catalytic activity. Appl. Catal. B Environ. 2006, 66, 217–227. [Google Scholar] [CrossRef]
- Liotta, L.F.; Ousmane, M.; Di Carlo, G.; Pantaleo, G.; Deganello, G.; Marcì, G.; Retailleau, L.; Giroir-Fendler, A. Total oxidation of propene at low temperature over Co3O4–CeO2 mixed oxides: Role of surface oxygen vacancies and bulk oxygen mobility in the catalytic activity. Appl. Catal. A Gen. 2008, 347, 81–88. [Google Scholar] [CrossRef] [Green Version]
- Liu, J.; Zhao, Z.; Wang, J.; Xu, C.; Duan, A.; Jiang, G.; Yang, Q. The highly active catalysts of nanometric CeO2-supported cobalt oxides for soot combustion. Appl. Catal. B Environ. 2008, 84, 185–195. [Google Scholar] [CrossRef]
- Trovarelli, A. Catalysis by Ceria and Related Materials; Imperial College Press: London, UK, 2002; Volume 2. [Google Scholar]
- Trawczyński, J.; Bielak, B.; Miśta, W. Oxidation of ethanol over supported manganese catalysts—Effect of the carrier. Appl. Catal. B Environ. 2005, 55, 277–285. [Google Scholar] [CrossRef]
- Aranda, A.; Agouram, S.; López, J.M.; Mastral, A.M.; Sellick, D.R.; Solsona, B.; Taylor, S.H.; García, T. Oxygen defects: The key parameter controlling the activity and selectivity of mesoporous copper-doped ceria for the total oxidation of naphthalene. Appl. Catal. B Environ. 2012, 127, 77–88. [Google Scholar] [CrossRef]
- Kundakovic, L.; Flytzani-Stephanopoulos, M. Reduction characteristics of copper oxide in cerium and zirconium oxide systems. Appl. Catal. A Gen. 1998, 171, 13–29. [Google Scholar] [CrossRef]
- Konsolakis, M.; Sgourakis, M.; Carabineiro, S.A.C. Surface and redox properties of cobalt-ceria binary oxides: On the effect of Co content and pretreatment conditions. Appl. Surf. Sci. 2015, 341, 48–54. [Google Scholar] [CrossRef]
- Yu, Q.; Liu, L.; Dong, L.; Li, D.; Liu, B.; Gao, F.; Sun, K.; Dong, L.; Chen, Y. Effects of Ce/Zr ratio on the reducibility, adsorption and catalytic activity of CuO/CexZr1−xO2/γ-Al2O3 catalysts for NO reduction by CO. Appl. Catal. B Environ. 2010, 96, 350–360. [Google Scholar] [CrossRef]
- Li, S.; Hao, Q.; Zhao, R.; Liu, D.; Duan, H.; Dou, B. Highly efficient catalytic removal of ethyl acetate over Ce/Zr promoted copper/ZSM-5 catalysts. Chem. Eng. J. 2016, 285, 536–543. [Google Scholar] [CrossRef]
- De Rivas, B.; Guillén-Hurtado, N.; López-Fonseca, R.; Coloma-Pascual, F.; García-García, A.; Gutiérrez-Ortiz, J.I.; Bueno-López, A. Activity, selectivity and stability of praseodymium-doped CeO2 for chlorinated VOCs catalytic combustion. Appl. Catal. B Environ. 2012, 121, 162–170. [Google Scholar] [CrossRef]
- Andreeva, D.; Idakiev, V.; Tabakova, T.; Ilieva, L.; Falaras, P.; Bourlinos, A.; Travlos, A. Low-temperature water-gas shift reaction over Au/CeO2 catalysts. Catal. Today 2002, 72, 51–57. [Google Scholar] [CrossRef]
- Fu, Q.; Kudriavtseva, S.; Saltsburg, H.; Flytzani-Stephanopoulos, M. Gold-ceria catalysts for low-temperature water-gas shift reaction. Chem. Eng. J. 2003, 93, 41–53. [Google Scholar] [CrossRef]
- Jacobs, G.; Chenu, E.; Patterson, P.M.; Williams, L.; Sparks, D.; Thomas, G.; Davis, B.H. Water-gas shift: comparative screening of metal promoters for metal/ceria systems and role of the metal. Appl. Catal. A Gen. 2004, 258, 203–214. [Google Scholar] [CrossRef]
- Fu, Q.; Deng, W.; Saltsburg, H.; Flytzani-Stephanopoulos, M. Activity and stability of low-content gold–cerium oxide catalysts for the water–gas shift reaction. Appl. Catal. B Environ. 2005, 56, 57–68. [Google Scholar] [CrossRef]
- Venezia, A.M.; Pantaleo, G.; Longo, A.; Di Carlo, G.; Casaletto, M.P.; Liotta, F.L.; Deganello, G. Relationship between Structure and CO Oxidation Activity of Ceria-Supported Gold Catalysts. J. Phys. Chem. B 2005, 109, 2821–2827. [Google Scholar] [CrossRef] [PubMed]
- Carabineiro, S.A.C.; Bastos, S.S.T.; Orfao, J.J.M.; Pereira, M.F.R.; Delgado, J.L.; Figueiredo, J.L. Exotemplated ceria catalysts with gold for CO oxidation. Appl. Catal. A Gen. 2010, 381, 150–160. [Google Scholar] [CrossRef]
- Carabineiro, S.A.C.; Silva, A.M.T.; Drazic, G.; Tavares, P.B.; Figueiredo, J.L. Gold nanoparticles on ceria supports for the oxidation of carbon monoxide. Catal. Today 2010, 154, 21–30. [Google Scholar] [CrossRef]
- Carabineiro, S.A.C.; Silva, A.M.T.; Drazic, G.; Tavares, P.B.; Figueiredo, J.L. Effect of chloride on the sinterization of Au/CeO2 catalysts. Catal. Today 2010, 154, 293–302. [Google Scholar] [CrossRef]
- Carabineiro, S.A.C.; Bogdanchikova, N.; Avalos-Borja, M.; Pestryakov, A.; Tavares, P.B.; Figueiredo, J.L. Gold Supported on Metal Oxides for Carbon Monoxide Oxidation. Nano Res. 2011, 4, 180–193. [Google Scholar] [CrossRef]
- Haneda, M.; Kintaichi, Y.; Hamada, H. Surface reactivity of prereduced rare earth oxides with nitric oxide: New approach for NO decomposition. Phys. Chem. Chem. Phys. 2002, 4, 3146–3151. [Google Scholar] [CrossRef]
- Kang, J.-G.; Min, B.-K.; Sohn, Y. Synthesis and characterization of Gd(OH)3 and Gd2O3 nanorods. Ceram. Int. 2015, 41, 1243–1248. [Google Scholar] [CrossRef]
- Zhang, F.; Wang, P.; Koberstein, J.; Khalid, S.; Chan, S.-W. Cerium oxidation state in ceria nanoparticles studied with X-ray photoelectron spectroscopy and absorption near edge spectroscopy. Surf. Sci. 2004, 563, 74–82. [Google Scholar] [CrossRef]
- Siokou, A.; Ntais, S.; Dracopoulos, V.; Papaefthimiou, S.; Leftheriotis, G.; Yianoulis, P. Substrate related structural, electronic and electrochemical properties of evaporated CeOx ion storage layers. Thin Sol. Film. 2006, 514, 87–96. [Google Scholar] [CrossRef]
- Paunovic, N.; Dohcevic-Mitrovic, Z.; Scurtu, R.; Askrabic, S.; Prekajski, M.; Matovic, B.; Popovic, Z.V. Suppression of inherent ferromagnetism in Pr-doped CeO2 nanocrystals. Nanoscale 2012, 4, 5469–5476. [Google Scholar] [CrossRef] [PubMed]
- Liu, W.; Flytzani-Stephanopoulos, M. Total Oxidation of Carbon-Monoxide and Methane over Transition Metal Fluorite Oxide Composite Catalysts: II. Catalyst Characterization and Reaction-Kinetics. J. Catal. 1995, 153, 317–332. [Google Scholar] [CrossRef]
- Lamonier, C.; Bennani, A.; D’Huysser, A.; Aboukais, A.; Wrobel, G. Evidence for different copper species in precursors of copper-cerium oxide catalysts for hydrogenation reactions. An X-ray diffraction, EPR and X-ray photoelectron spectroscopy study. J. Chem. Soc. Faraday Trans. 1996, 92, 131–136. [Google Scholar] [CrossRef]
- Martı́nez-Arias, A.; Fernández-Garcı́a, M.; Soria, J.; Conesa, J.C. Spectroscopic Study of a Cu/CeO2Catalyst Subjected to Redox Treatments in Carbon Monoxide and Oxygen. J. Catal. 1999, 182, 367–377. [Google Scholar] [CrossRef]
- Mai, H.; Zhang, D.; Shi, L.; Yan, T.; Li, H. Highly active Ce1−xCuxO2 nanocomposite catalysts for the low temperature oxidation of CO. Appl. Surf. Sci. 2011, 257, 7551–7559. [Google Scholar] [CrossRef]
- Ayastuy, J.L.; Gurbani, A.; González-Marcos, M.P.; Gutiérrez-Ortiz, M.A. Selective CO oxidation in H2 streams on CuO/CexZr1−xO2 catalysts: Correlation between activity and low temperature reducibility. Int. J. Hydrog. Energy 2012, 37, 1993–2006. [Google Scholar] [CrossRef]
- Biesinger, M.C.; Hart, B.R.; Polack, R.; Kobe, B.A.; Smart, R.S.C. Analysis of mineral surface chemistry in flotation separation using imaging XPS. Miner. Eng. 2007, 20, 152–162. [Google Scholar] [CrossRef]
- Biesinger, M.C.; Lau, L.W.M.; Gerson, A.R.; Smart, R.S.C. Resolving surface chemical states in XPS analysis of first row transition metals, oxides and hydroxides: Sc, Ti, V, Cu and Zn. Appl. Surf. Sci. 2010, 257, 887–898. [Google Scholar] [CrossRef]
- Konsolakis, M.; Carabineiro, S.A.C.; Papista, E.; Marnellos, G.E.; Tavares, P.B.; Moreira, J.A.; Romaguera-Barcelay, Y.; Figueiredo, J.L. Effect of preparation method on the solid state properties and the deN2O performance of CuO-CeO2 oxides. Catal. Sci. Technol. 2015, 5, 3714–3727. [Google Scholar] [CrossRef]
- Raiser, D.; Deville, J.P. Study of XPS photoemission of some gadolinium compounds. J. Electron. Spectrosc. Relat. Phenom. 1991, 57, 91–97. [Google Scholar] [CrossRef]
- Teterin, Y.A.; Teterin, A.Y. Structure of X-ray photoelectron spectra of lanthanide compounds. Russ. Chem. Rev. 2002, 71, 347–381. [Google Scholar] [CrossRef]
- Luo, N.; Tian, X.; Yang, C.; Xiao, J.; Hu, W.; Chen, D.; Li, L. Ligand-free gadolinium oxide for in vivo T1-weighted magnetic resonance imaging. Phys. Chem. Chem. Phys. 2013, 15, 12235–12240. [Google Scholar] [CrossRef] [PubMed]
- Moulder, J.F.; Chastain, J. Handbook of X-ray Photoelectron Spectroscopy: A Reference Book of Standard Spectra for Identification and Interpretation of XPS Data; Physical Electronics Division, Perkin-Elmer Corporation: Waltham, MA, USA, 1992. [Google Scholar]
- Wu, Q.-H.; Liu, M.; Jaegermann, W. X-ray photoelectron spectroscopy of La0.5Sr0.5MnO3. Mater. Lett. 2005, 59, 1980–1983. [Google Scholar] [CrossRef]
- Bouras, K.; Schmerber, G.; Rinnert, H.; Aureau, D.; Park, H.; Ferblantier, G.; Colis, S.; Fix, T.; Park, C.; Kim, W.K.; et al. Structural, optical and electrical properties of Nd-doped SnO2 thin films fabricated by reactive magnetron sputtering for solar cell devices. Sol. Energy Mater. Sol. Cells 2016, 145 Pt 2, 134–141. [Google Scholar] [CrossRef]
- Grassmann, A.; Ströbei, J.; Klauda, M.; Schlötterer, J.; Saemann-Ischenko, G. Electronic Structure of Nd2−x CexCuO4−δ Studied by Photoelectron Spectroscopy. EPL (Europhys. Lett.) 1989, 9, 827. [Google Scholar] [CrossRef]
- Jin, F.; Shen, Y.; Wang, R.; He, T. Double-perovskite PrBaCo2/3Fe2/3Cu2/3O5+δ as cathode material for intermediate-temperature solid-oxide fuel cells. J. Power Sources 2013, 234, 244–251. [Google Scholar] [CrossRef]
- Juel, M.; Samuelsen, B.T.; Kildemo, M.; Raaen, S. Valence variations of Sm on polycrystalline Ag. Surf. Sci. 2006, 600, 1155–1159. [Google Scholar] [CrossRef]
- Zhu, J.; Ma, Y.; Zhuang, S. Exploring the role of samarium in the modification of rhodium catalysts through surface science approach. Surf. Sci. 2009, 603, 1802–1811. [Google Scholar] [CrossRef]
- Hardacre, C.; Roe, G.M.; Lambert, R.M. Structure, composition and thermal properties of cerium oxide films on platinum {111}. Surf. Sci. 1995, 326, 1–10. [Google Scholar] [CrossRef]
- Varga, E.; Pusztai, P.; Óvári, L.; Oszkó, A.; Erdőhelyi, A.; Papp, C.; Steinrück, H.P.; Kónya, Z.; Kiss, J. Probing the interaction of Rh, Co and bimetallic Rh-Co nanoparticles with the CeO2 support: catalytic materials for alternative energy generation. Phys. Chem. Chem. Phys. 2015, 17, 27154–27166. [Google Scholar] [CrossRef] [PubMed]
- Vári, G.; Óvári, L.; Papp, C.; Steinrück, H.-P.; Kiss, J.; Kónya, Z. The Interaction of Cobalt with CeO2(111) Prepared on Cu(111). J. Phys. Chem. C 2015, 119, 9324–9333. [Google Scholar] [CrossRef]
- Gómez-Sainero, L.M.; Baker, R.T.; Metcalfe, I.S.; Sahibzada, M.; Concepción, P.; López-Nieto, J.M. Investigation of Sm2O3–CeO2-supported palladium catalysts for the reforming of methanol: The role of the support. Appl. Catal. A Gen. 2005, 294, 177–187. [Google Scholar] [CrossRef]
- Menon, U.; Galvita, V.V.; Marin, G.B. Reaction network for the total oxidation of toluene over CuO–CeO2/Al2O3. J. Catal. 2011, 283, 1–9. [Google Scholar] [CrossRef]
- Akram, S.; Wang, Z.; Chen, L.; Wang, Q.; Shen, G.; Han, N.; Chen, Y.; Ge, G. Low-temperature efficient degradation of ethyl acetate catalyzed by lattice-doped CeO2–CoOx nanocomposites. Catal. Commun. 2016, 73, 123–127. [Google Scholar] [CrossRef]
- Sample Availability: Not available.


| Samples | BET Analysis | XRD Analysis | TPR Analysis | |||
|---|---|---|---|---|---|---|
| SBET (m2/g) | Total Pore Volume (cm3/g) | Phase Detected (%v/v) b | Crystallite Size (nm) | Lattice Parameter (Å) c | Peak Temperatures (°C) a | |
| CeO2 | 72 | 0.27 | CeO2 cerianite | 15.9 ± 0.5 | 5.41 | 164, 507, 780 |
| Cu/CeO2 | 45 | 0.15 | CeO2 cerianite (55.2%) | 13.2 ± 0.2 | 5.41 | 139, 180, 220, 232, 836 |
| CuO tenorite (44.8%) | 70 ± 1 | |||||
| Ce-Gd | 5 | 0.09 | CeO2 cerianite (81.7%) | 16 ± 1 | 5.43 | 420, 654 |
| Gd1-xCexOy cubic (18.3%) | 31 ± 5 | 5.62 | ||||
| Cu/Ce-Gd | 3 | 0.05 | CeO2 cerianite (48.8%) | 25 ± 2 | 5.42 | 233, 293, 310, 402 |
| Gd1-xCexOy cubic (21.9%) | 51 ± 5 | 5.47 | ||||
| CuO tenorite (29.3%) | 10 ± 1 | |||||
| Ce-La | 25 | 0.14 | CeO2 cerianite (35.2%) | 18 ± 1 | 5.43 | 424, 551, 644 |
| La1-xCexOy (64.8%) | 34 ± 1 | 5.56 | ||||
| Cu/Ce-La | 23 | 0.08 | La1-xCexOy (66.2%) | 23 ± 2 | 5.51 | 281, 326, 343, 364 |
| La2CuO4 cubic (8.6%) | 49 ± 7 | 5.36 | ||||
| CuO tenorite (25.2%) | 11 ± 2 | |||||
| Ce-Pr | 22 | 0.15 | Pr1-xCexOy | 13 ± 1 | 5.43 | 312, 457, 484, 566 |
| Cu/Ce-Pr | 13 | 0.08 | CeO2 cerianite (87.8%) | 19 ± 1 | 5.41 | 207, 308, 328, 347 |
| CuO tenorite (12.2%) | 48 ± 5 | |||||
| Ce-Nd | 35 | 0.18 | Nd1-x CexOy * | 9 ± 1 | 5.49 | 390, 551, 810 |
| Cu/Ce-Nd | 33 | 0.08 | Nd1-x CexOy (62.7%) | 11 ± 1 | 5.47 | 280, 325, 358, 370 |
| Nd4Cu2O7 (7.9%) | 52 ± 5 | |||||
| CuO tenorite (29.4%) | 11 ± 1 | |||||
| Ce-Sm | 21 | 0.17 | CeO2 cerianite (77.8%) | 18 ± 1 | 5.44 | 429, 598 |
| Sm1-xCexOy (22.2%) | 20 ± 5 | 5.64 | ||||
| Cu/Ce-Sm | 19 | 0.08 | CeO2 cerianite (53.3%) | 15 ± 1 | 5.45 | 255, 295, 326, 348 |
| Sm2CuO4 tetragonal (9.2%) | 39 ± 5 | |||||
| Sm1-xCexOy cubic x ≈ 0.5 (7.5%) | 5 ± 1 | 5.65 | ||||
| CuO tenorite (30.0%) | 12 ± 1 | |||||
| Samples | XPS Atomic Ratios a | Relative Concentrations (%) c | |||||
|---|---|---|---|---|---|---|---|
| Cu/Ce + Ln (0.70) b | Ce/Ce + Ln (0.50) b | Ln/Ce + Ln (0.50) b | Cu+ | Ce3+ | OI | OI/OII | |
| CeO2 | - | 1 | - | - | 17.82 | 50.37 | 1.01 |
| Cu/CeO2 | 0.62 | 1 | - | 13.20 | 18.79 | 52.02 | 0.90 |
| Ce-Gd | - | 0.04 | 0.96 | - | 23.13 | 19.89 | 0.25 |
| Cu/Ce-Gd | 0.08 | 0.02 | 0.98 | 6.41 | 18.27 | 41.14 | 0.41 |
| Ce-La | - | 0.43 | 0.57 | - | 20.12 | 25.34 | 0.34 |
| Cu/Ce-La | 0.29 | 0.40 | 0.60 | <1 | 23.53 | 35.10 | 0.54 |
| Ce-Pr | - | 0.40 | 0.60 | - | 20.06 | 44.93 | 0.92 |
| Cu/Ce-Pr | 0.94 | 0.59 | 0.41 | d | 20.60 | 45.01 | 0.82 |
| Ce-Nd | - | 0.21 | 0.79 | - | 20.92 | 27.53 | 0.37 |
| Cu/Ce-Nd | 0.17 | 0.26 | 0.74 | 29.20 | 22.26 | 34.30 | 0.49 |
| Ce-Sm | - | 0.34 | 0.66 | - | 23.20 | 28.46 | 0.40 |
| Cu/Ce-Sm | 0.69 | 0.31 | 0.69 | <1 | 18.38 | 41.39 | 0.63 |
© 2016 by the authors. Licensee MDPI, Basel, Switzerland. This article is an open access article distributed under the terms and conditions of the Creative Commons Attribution (CC-BY) license ( http://creativecommons.org/licenses/by/4.0/).
Share and Cite
Carabineiro, S.A.C.; Konsolakis, M.; Marnellos, G.E.-N.; Asad, M.F.; Soares, O.S.G.P.; Tavares, P.B.; Pereira, M.F.R.; Órfão, J.J.d.M.; Figueiredo, J.L. Ethyl Acetate Abatement on Copper Catalysts Supported on Ceria Doped with Rare Earth Oxides. Molecules 2016, 21, 644. https://doi.org/10.3390/molecules21050644
Carabineiro SAC, Konsolakis M, Marnellos GE-N, Asad MF, Soares OSGP, Tavares PB, Pereira MFR, Órfão JJdM, Figueiredo JL. Ethyl Acetate Abatement on Copper Catalysts Supported on Ceria Doped with Rare Earth Oxides. Molecules. 2016; 21(5):644. https://doi.org/10.3390/molecules21050644
Chicago/Turabian StyleCarabineiro, Sónia Alexandra Correia, Michalis Konsolakis, George Emmanouil-Nontas Marnellos, Muhammad Faizan Asad, Olívia Salomé Gonçalves Pinto Soares, Pedro Bandeira Tavares, Manuel Fernando Ribeiro Pereira, José Joaquim de Melo Órfão, and José Luís Figueiredo. 2016. "Ethyl Acetate Abatement on Copper Catalysts Supported on Ceria Doped with Rare Earth Oxides" Molecules 21, no. 5: 644. https://doi.org/10.3390/molecules21050644