
Ligustrazine-Oleanolic Acid Glycine Derivative, G-TOA, Selectively Inhibited the Proliferation and Induced Apoptosis of Activated HSC-T6 Cells

 , and
, and 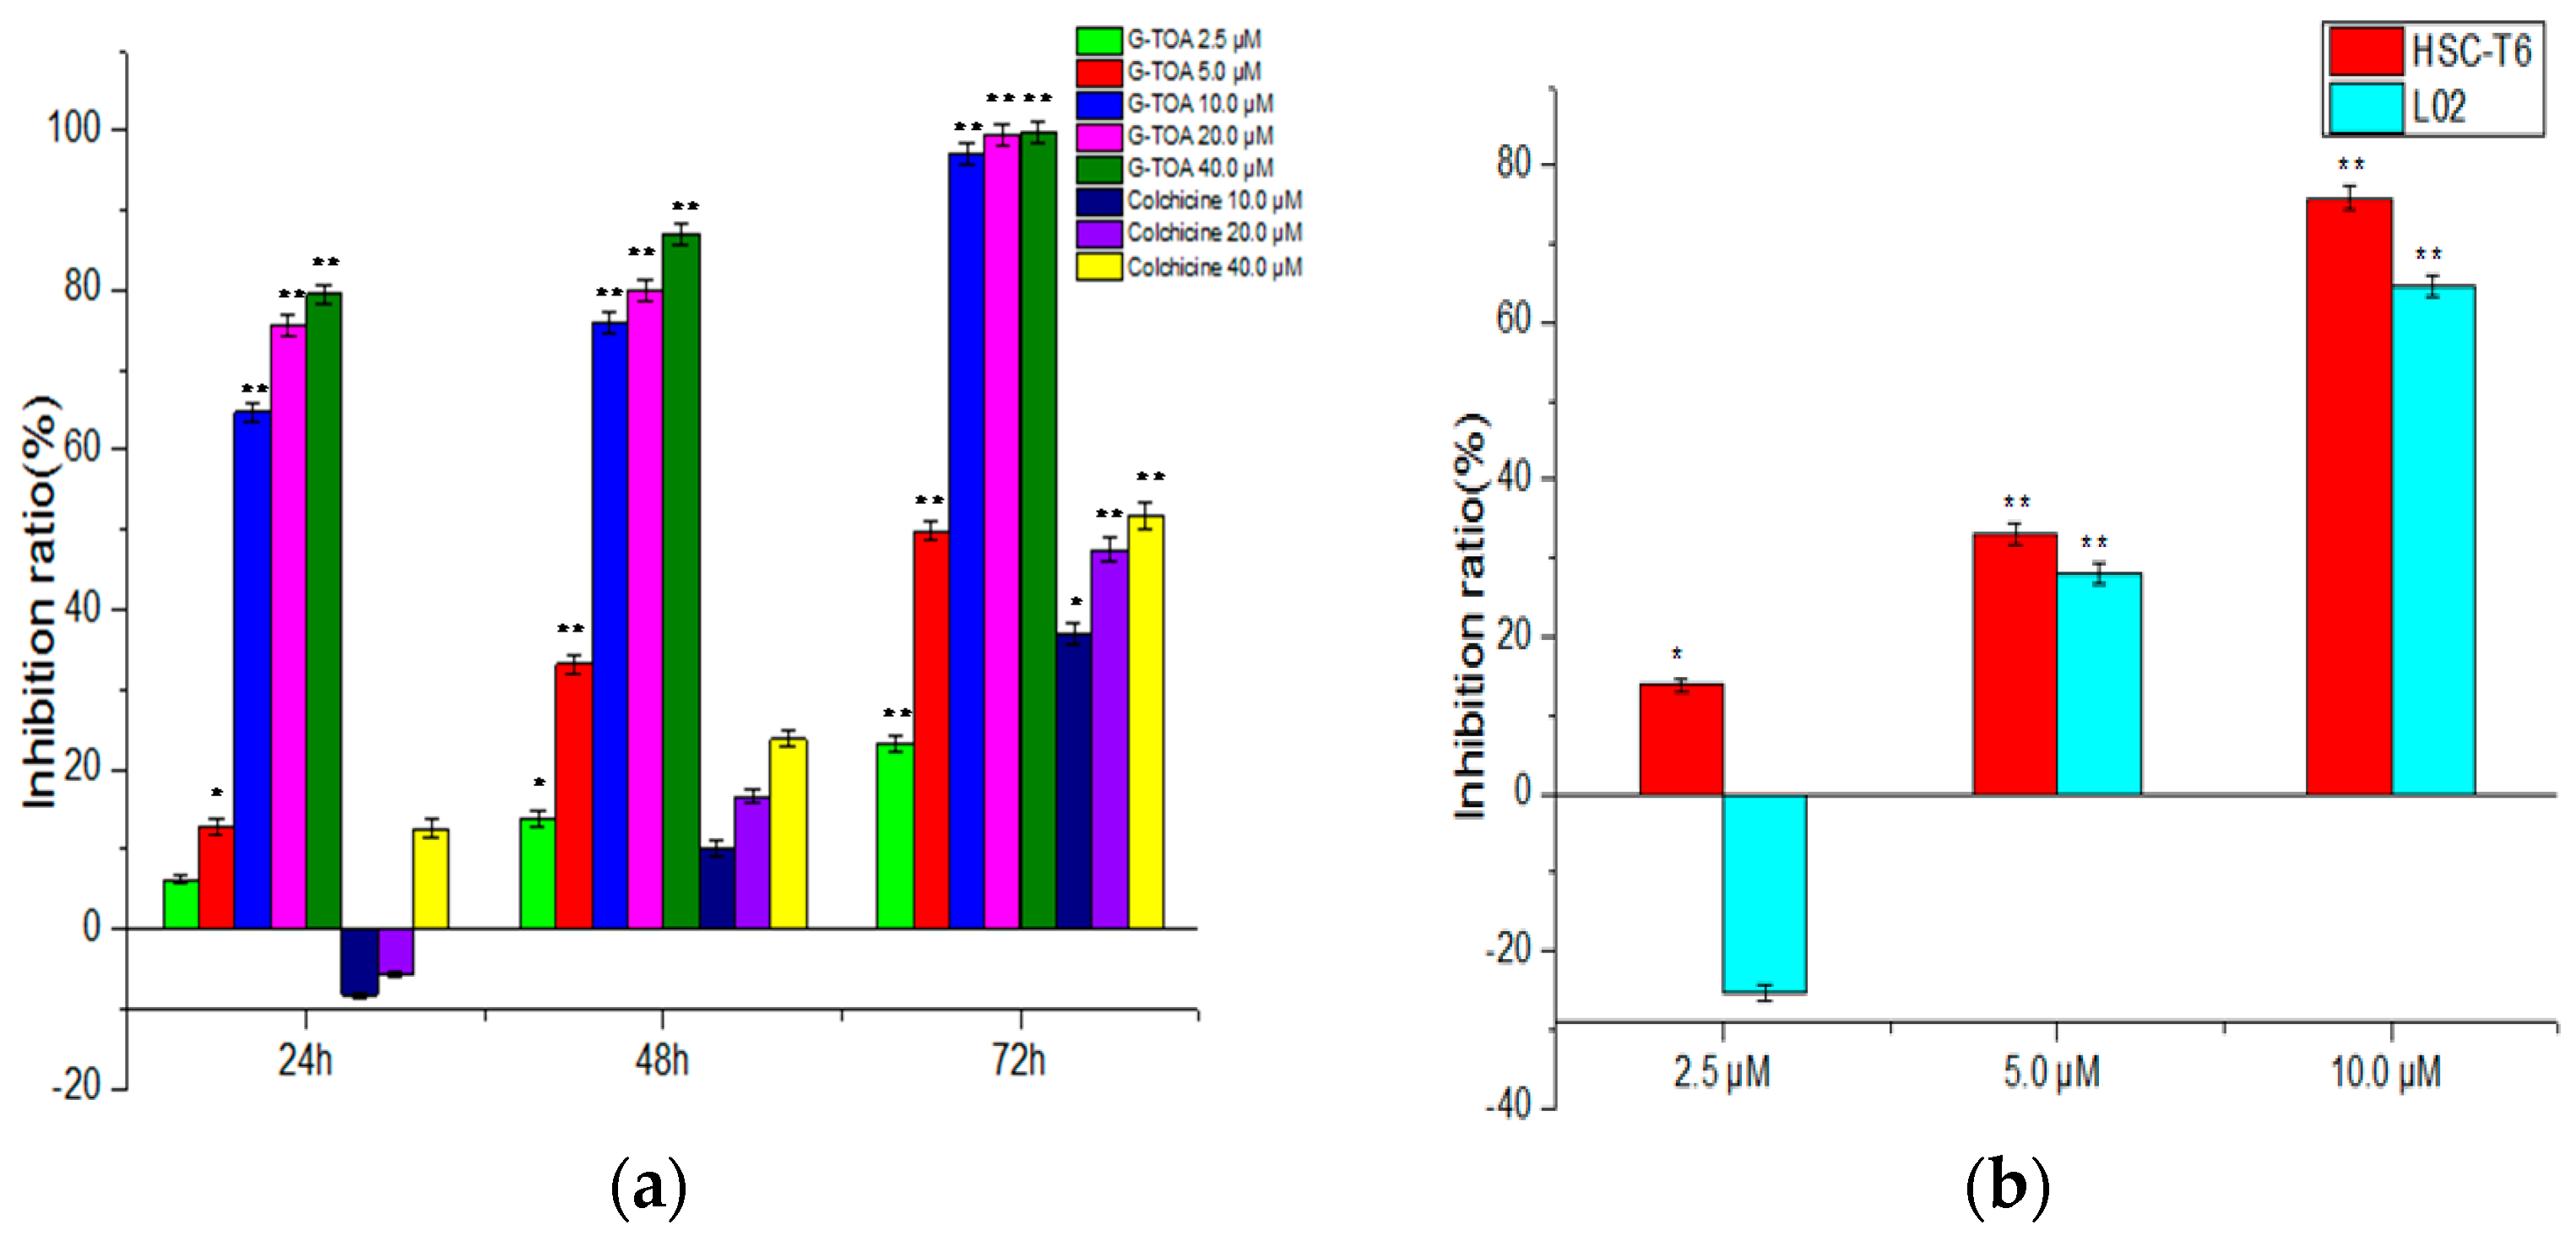
Abstract
:1. Introduction
2. Results
2.1. Inhibition of Cell Proliferation
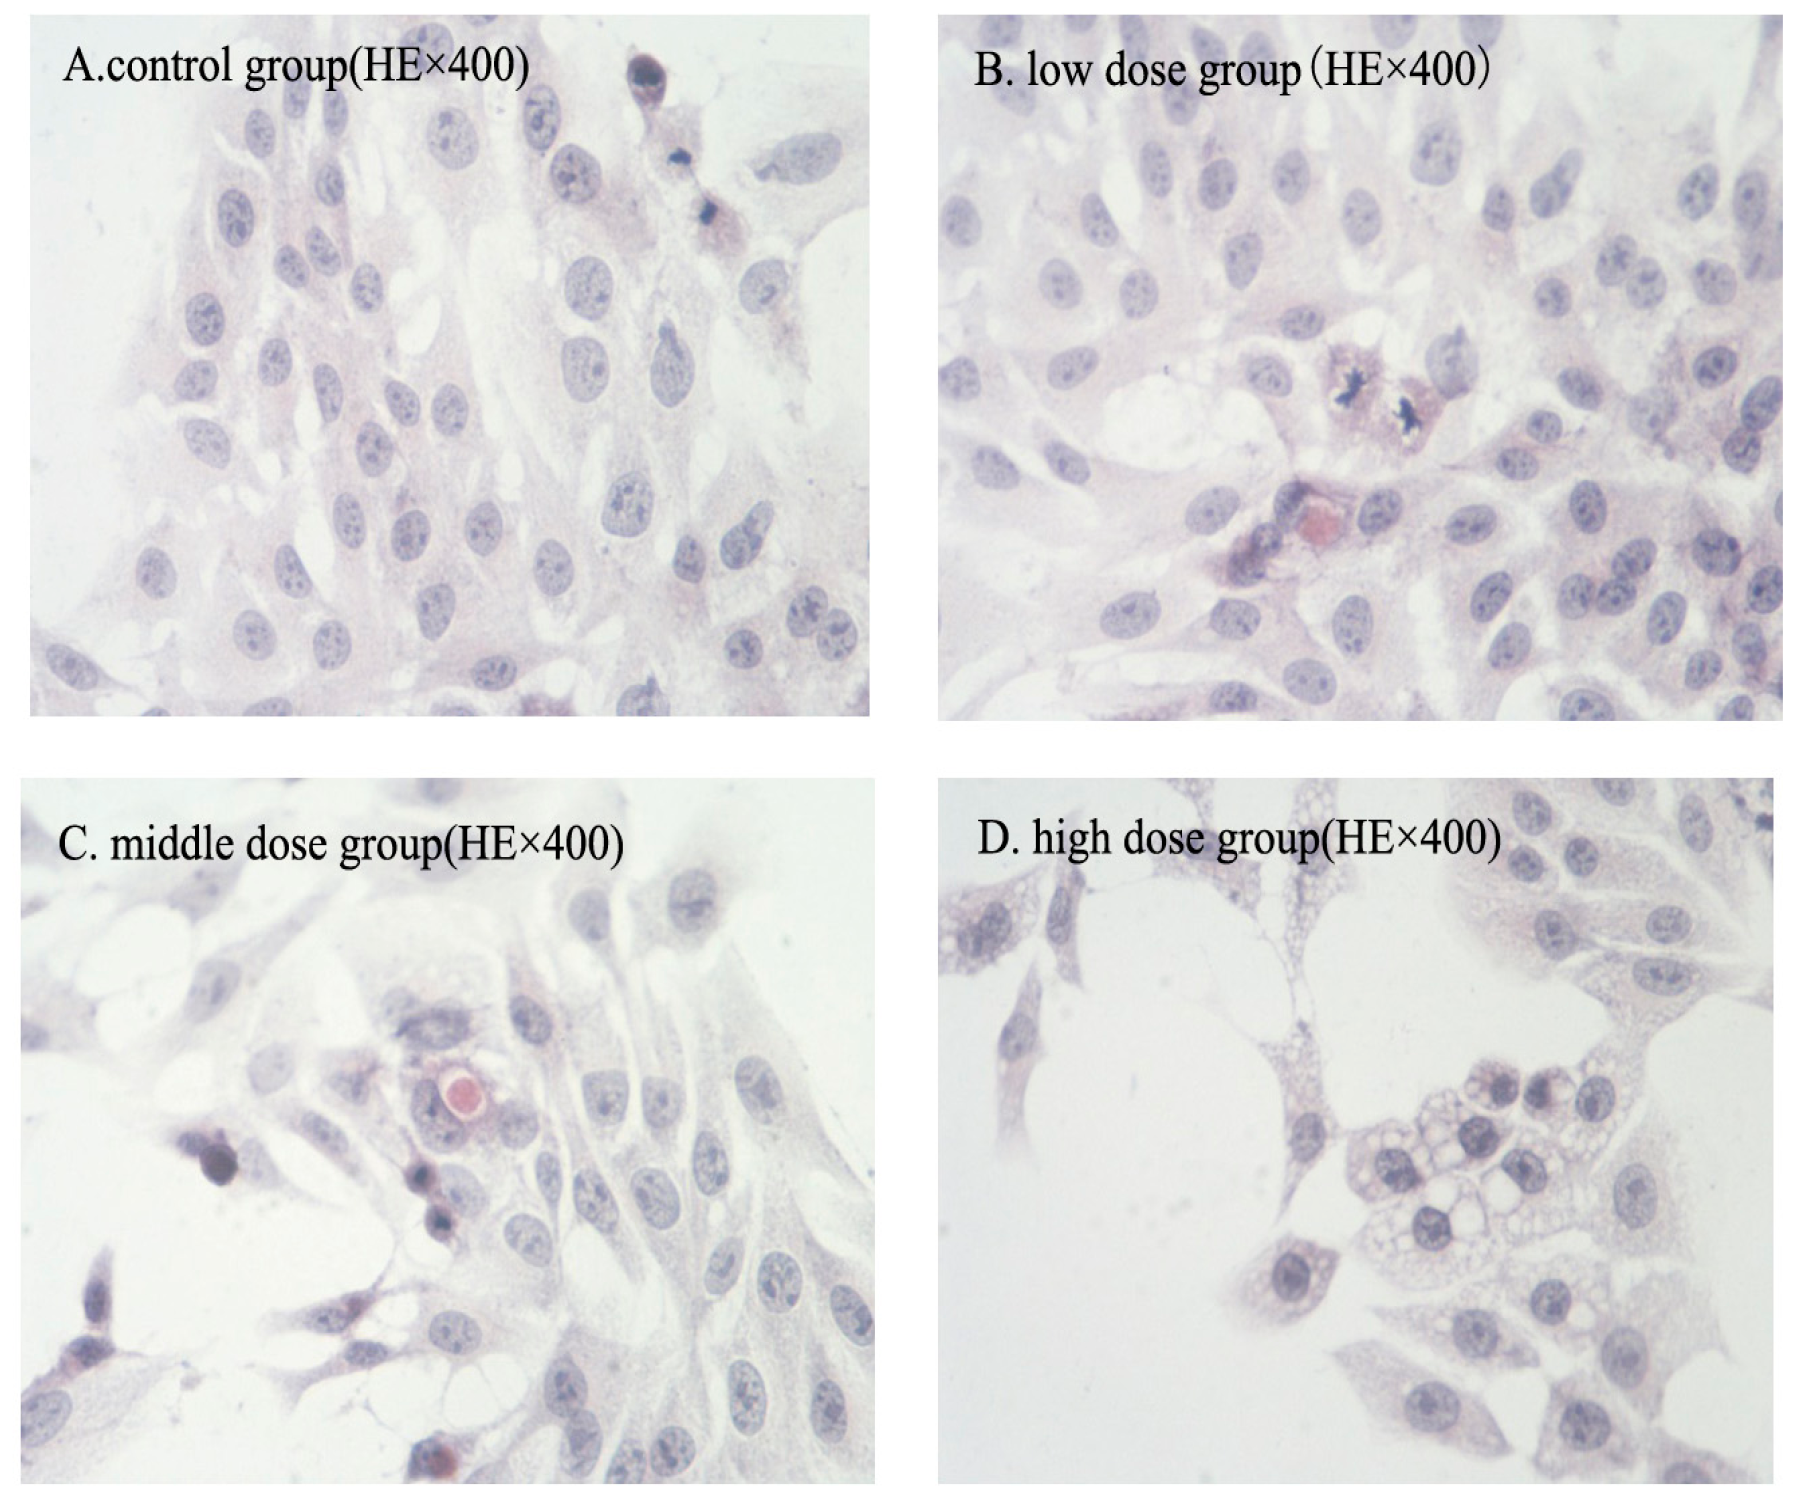
2.2. Morphologic Changes
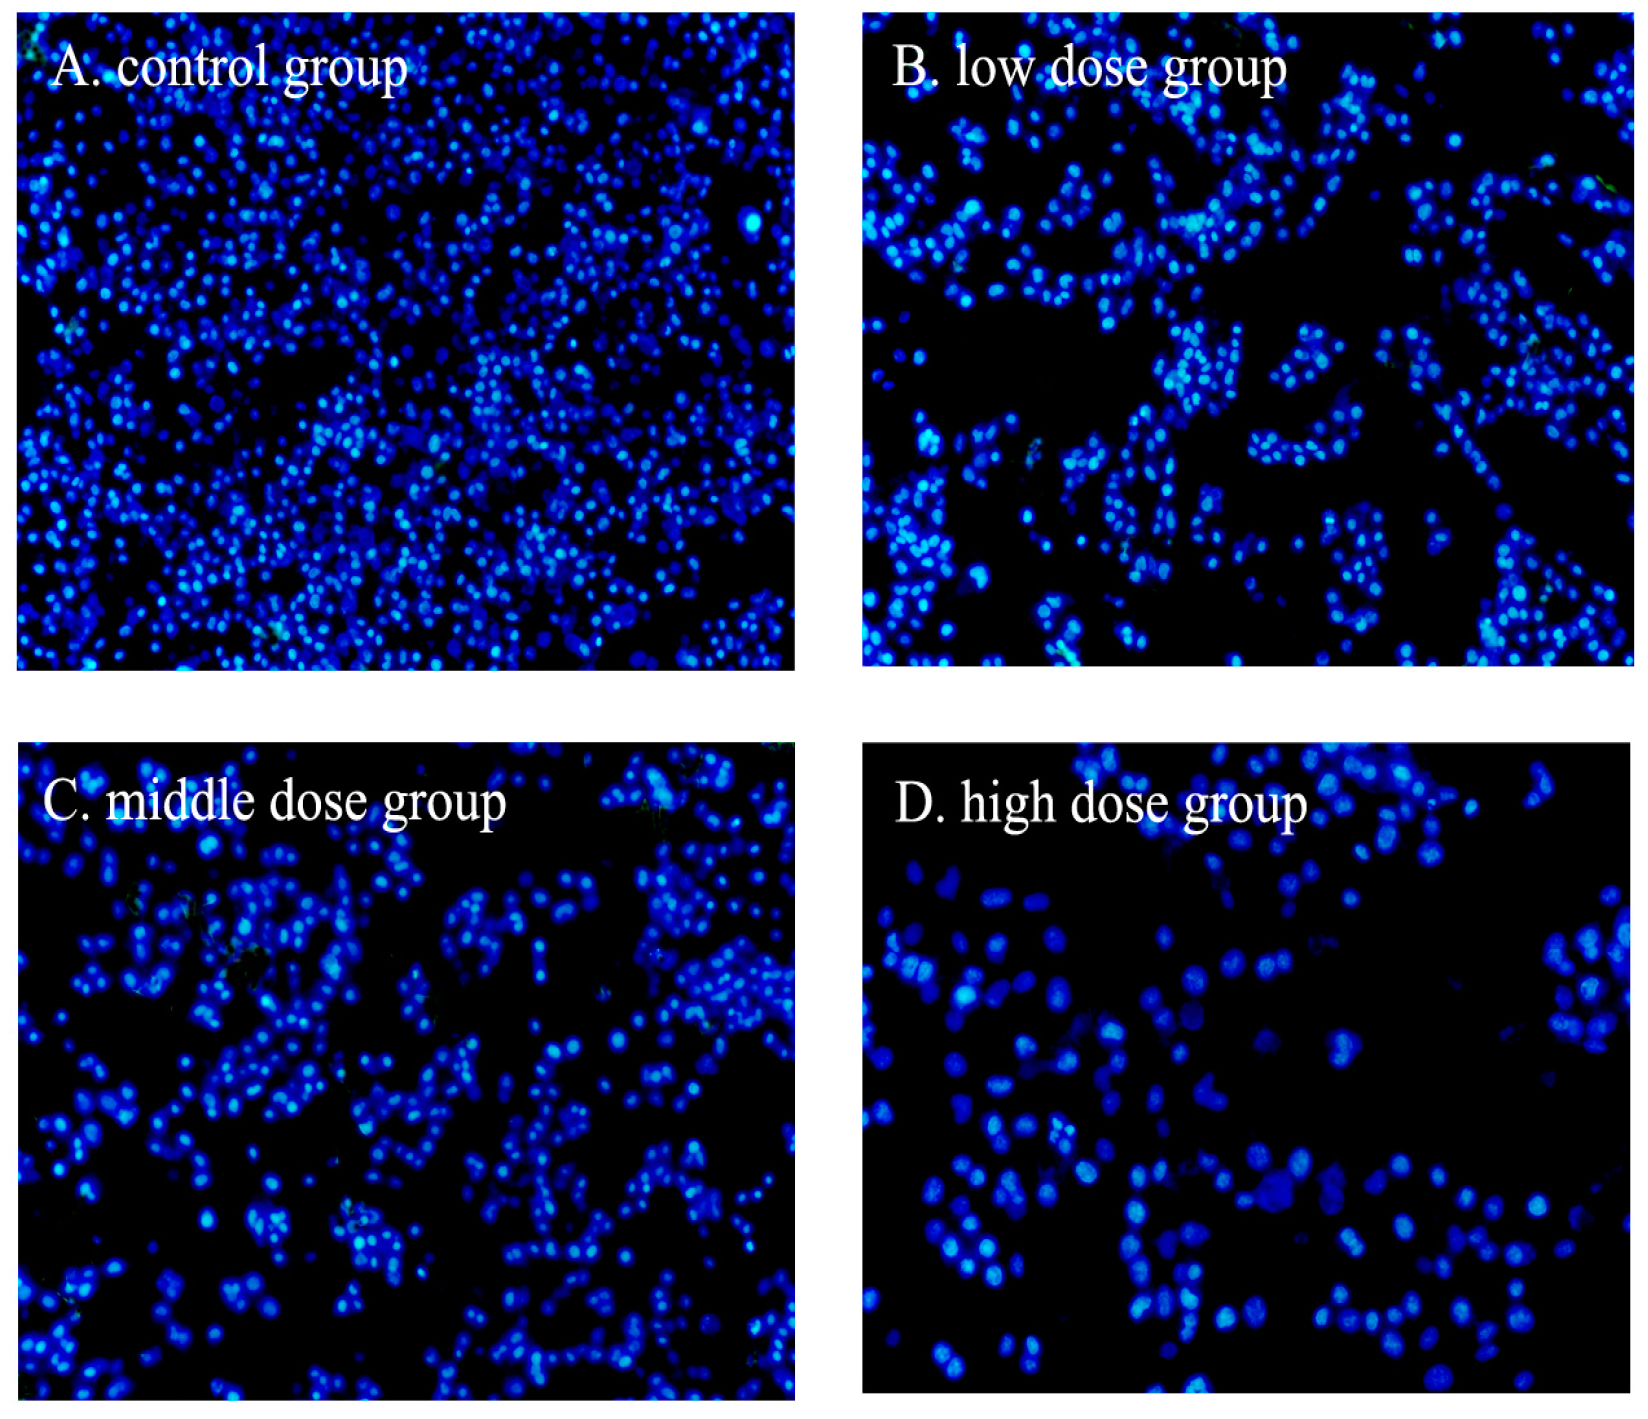
2.3. Nuclear Fragmentation
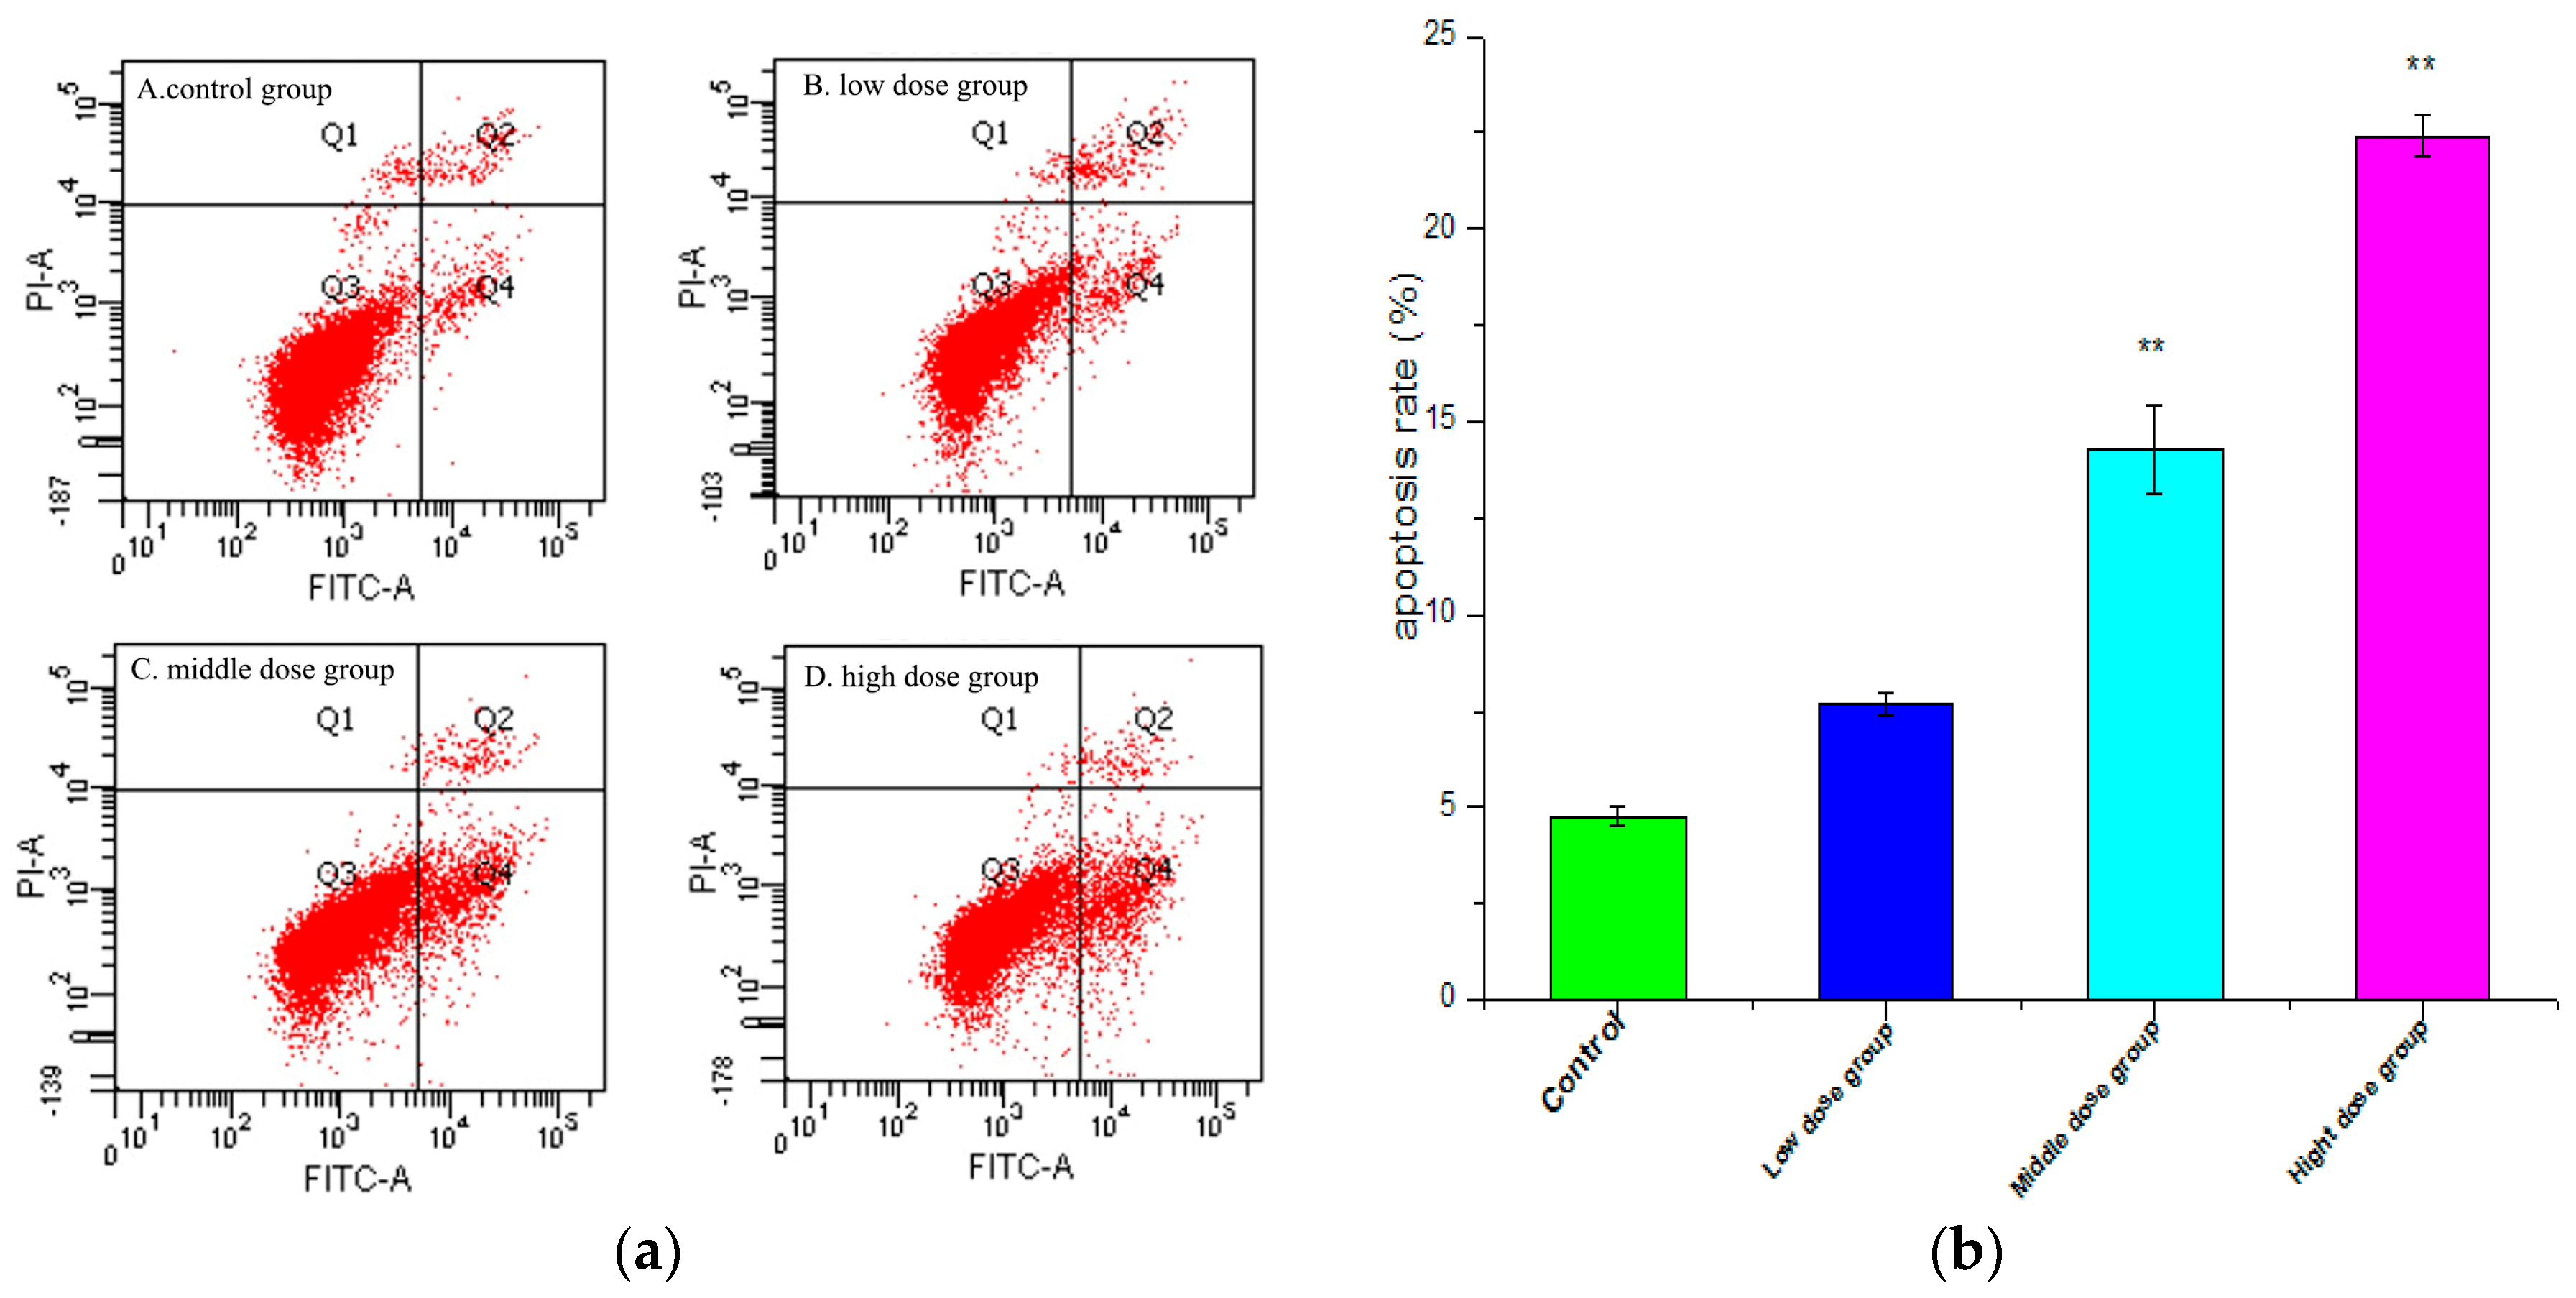
2.4. Apoptosis Analysis
2.5. Cell Cycle Measurement
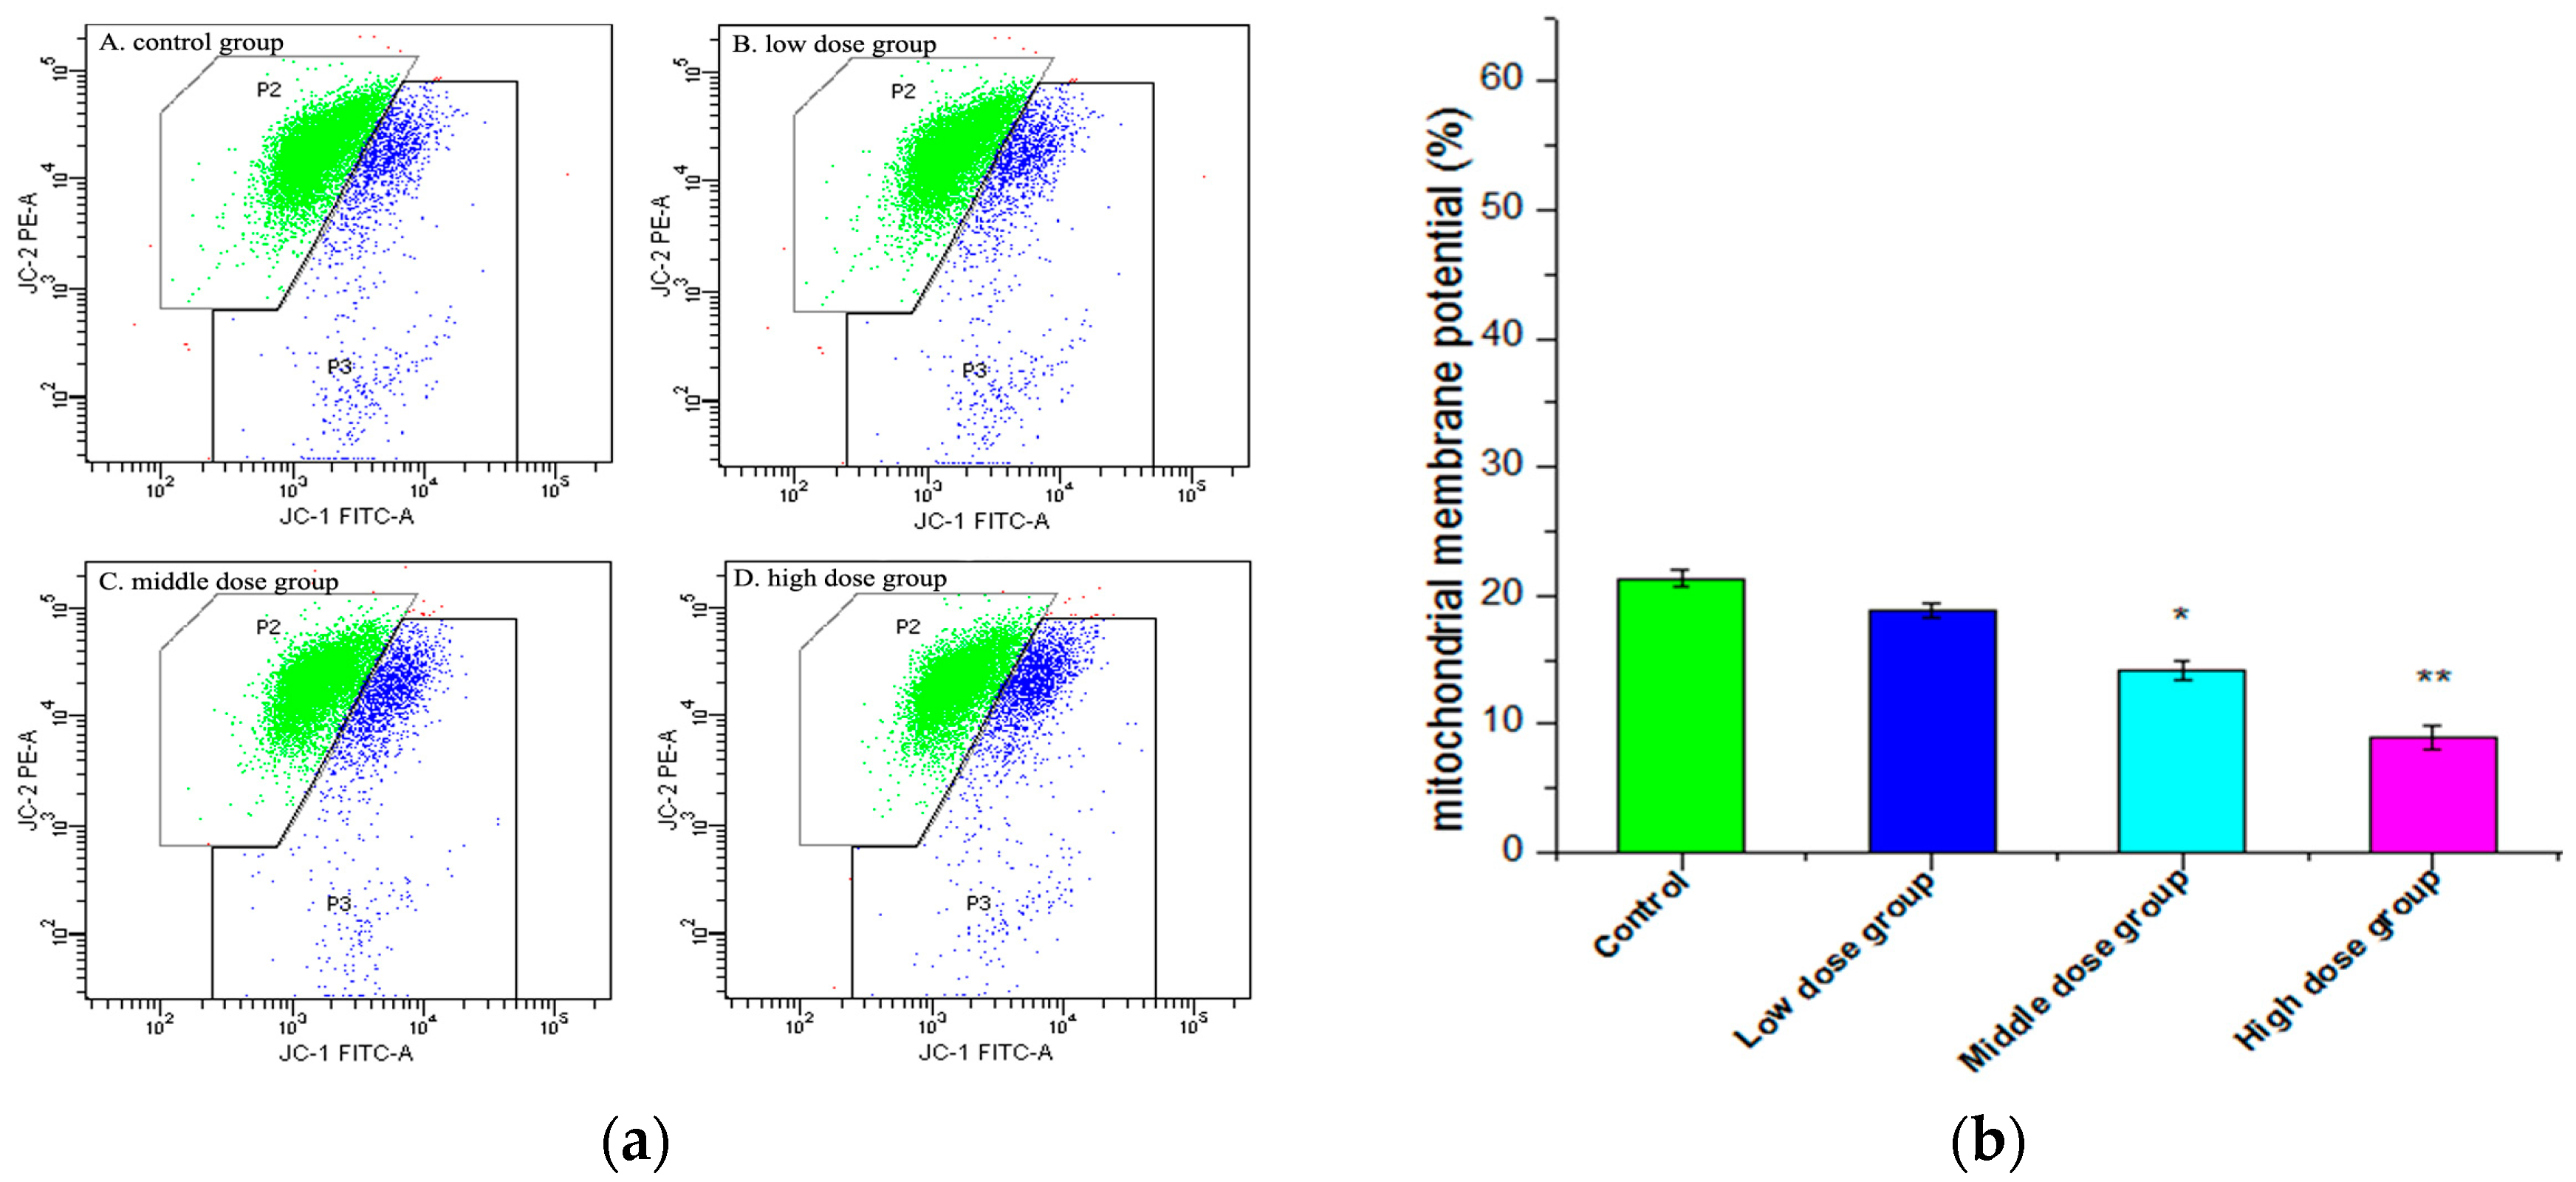
2.6. Changes in Mitochondrial Membrane Potential (∆ψm)
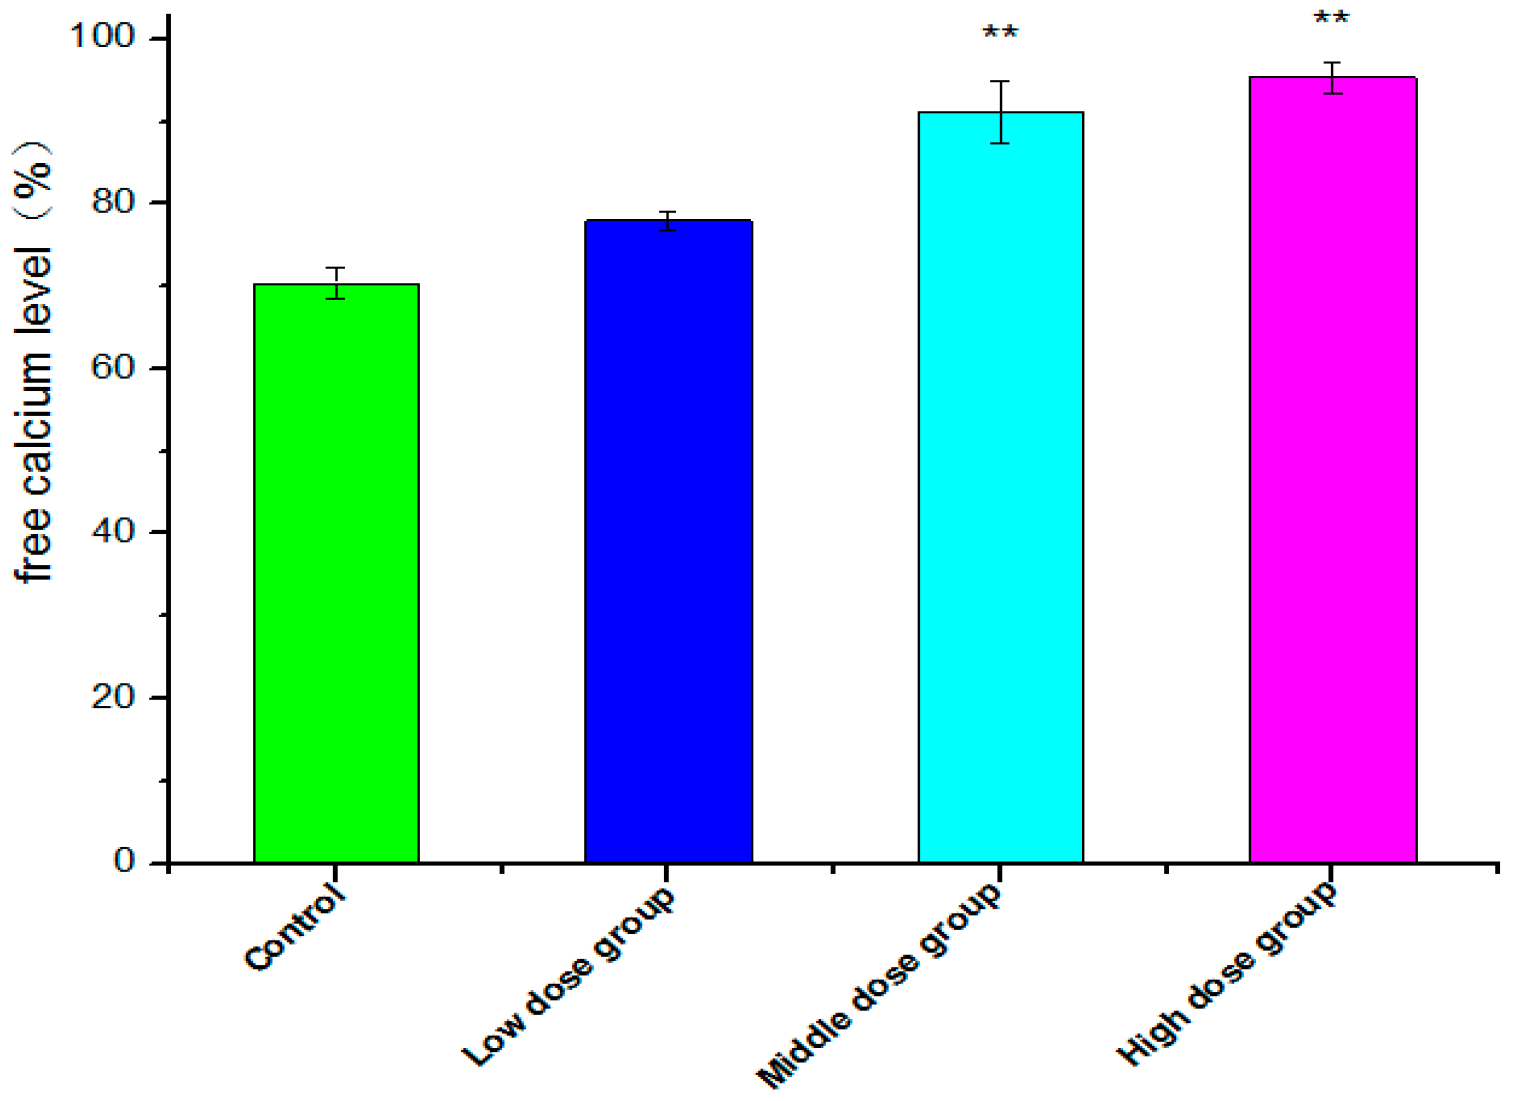
2.7. Intracellular Free Ca2+ Detection
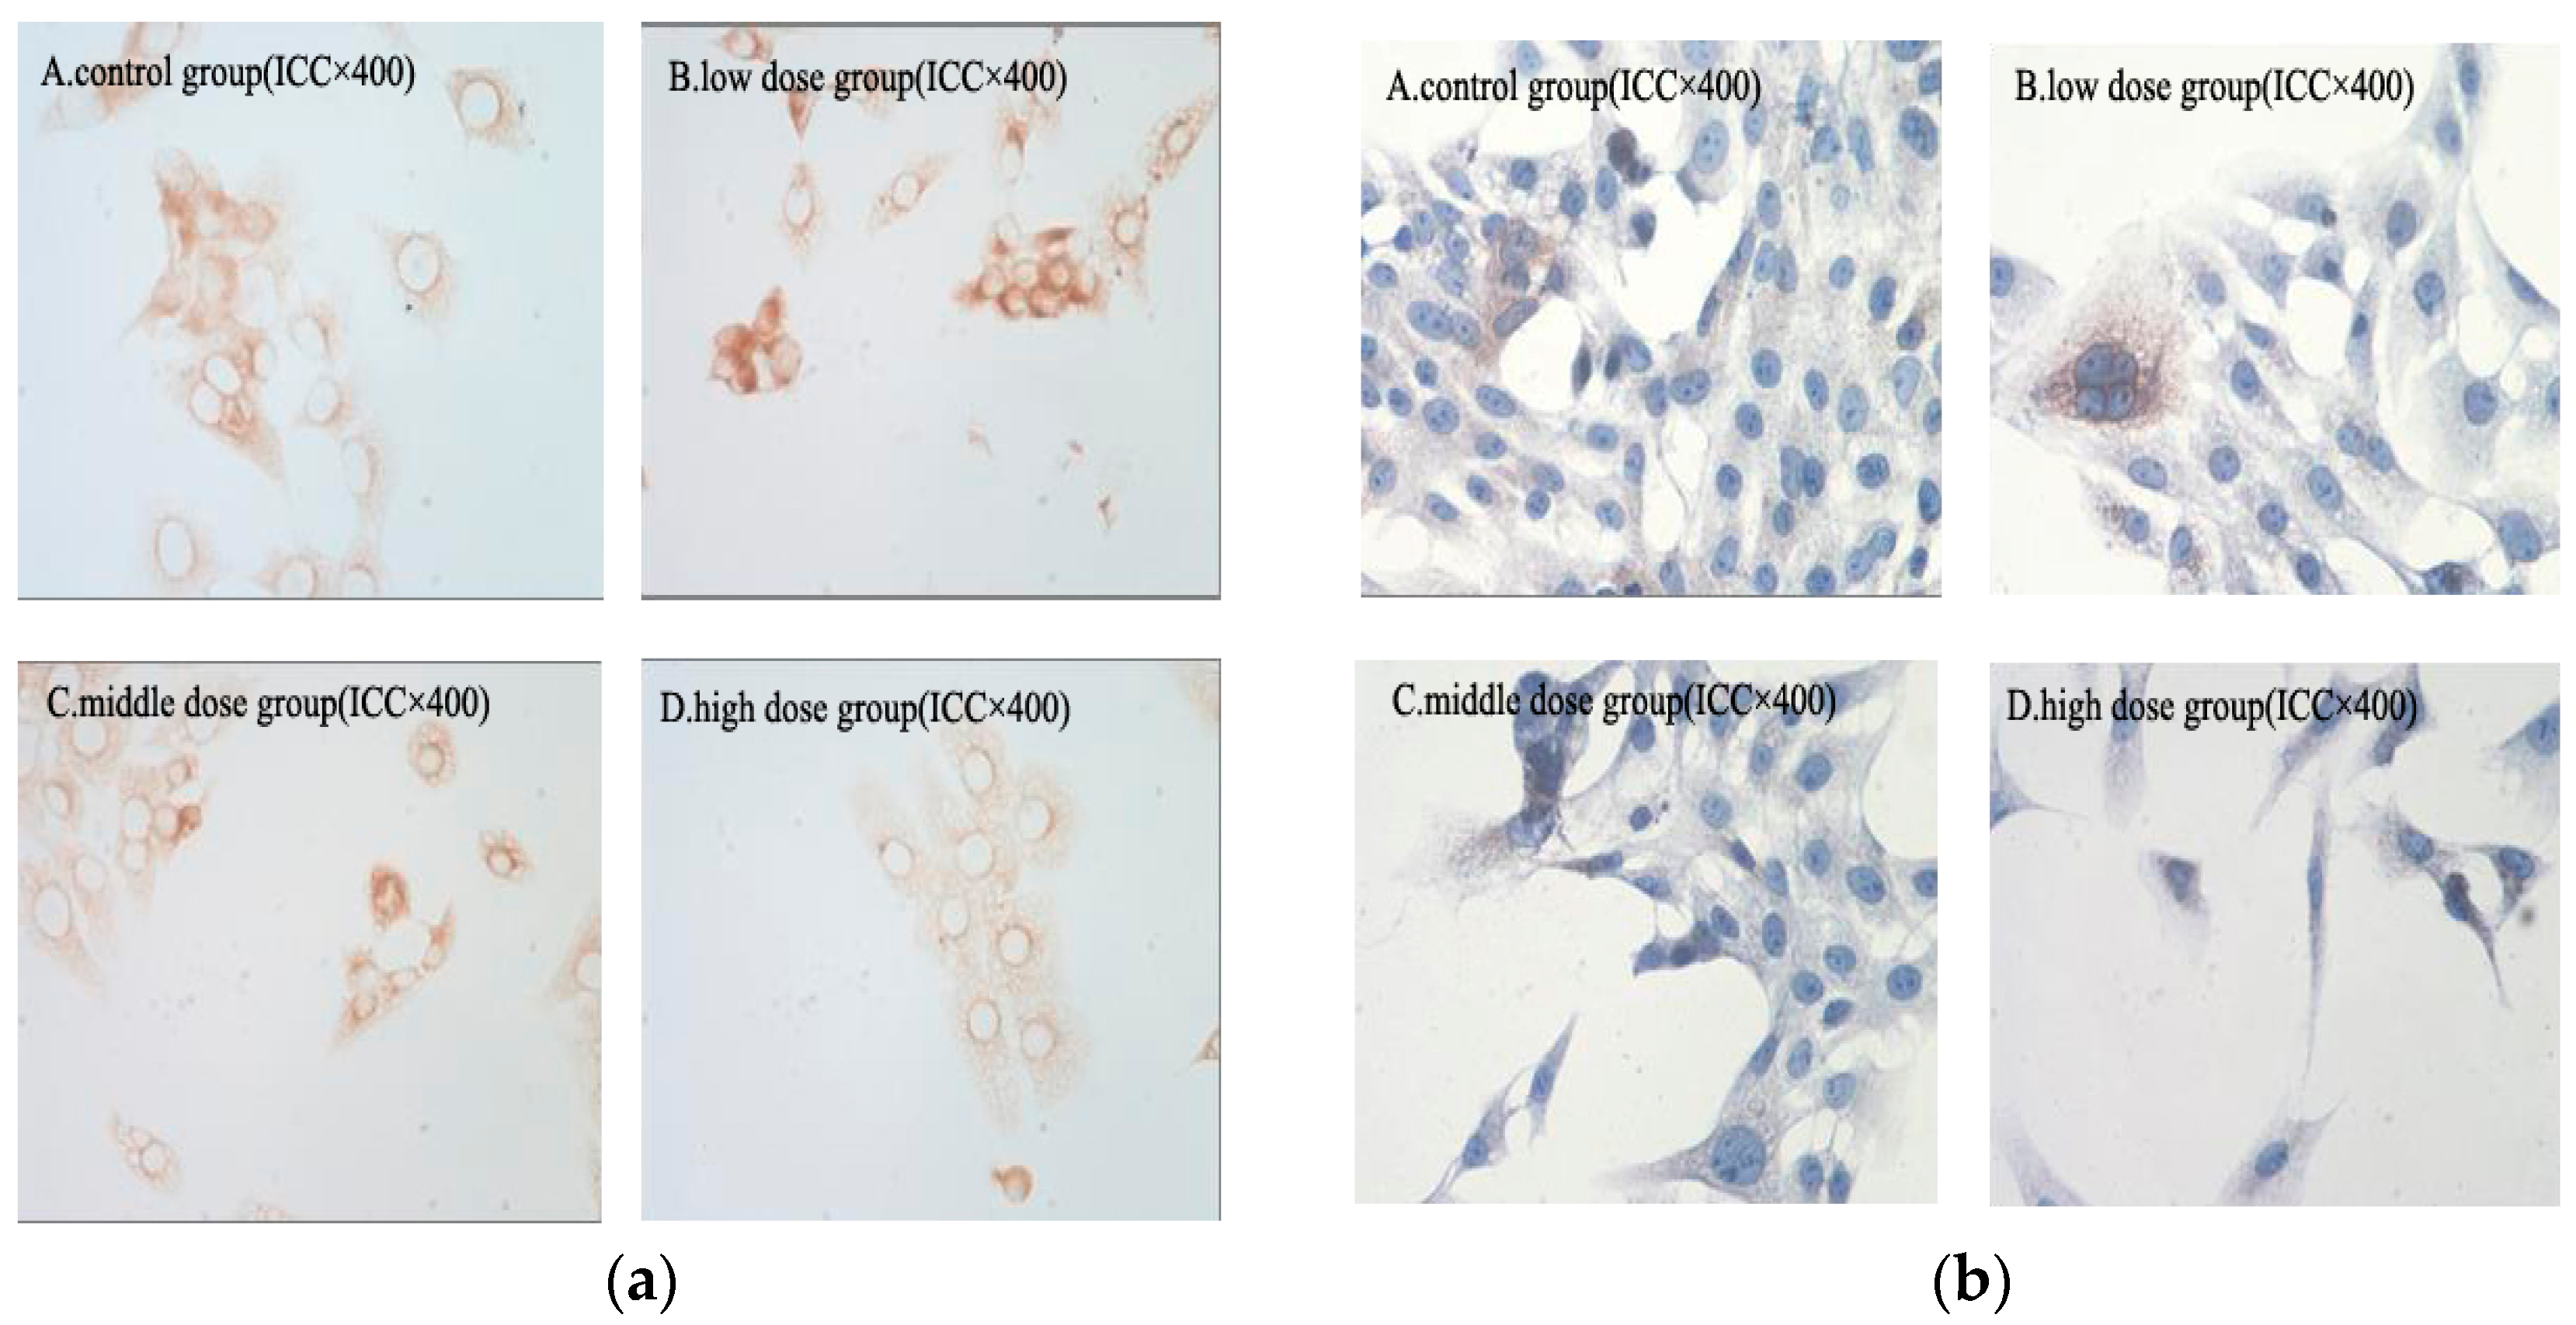
2.8. Immunohistochemical Analysis
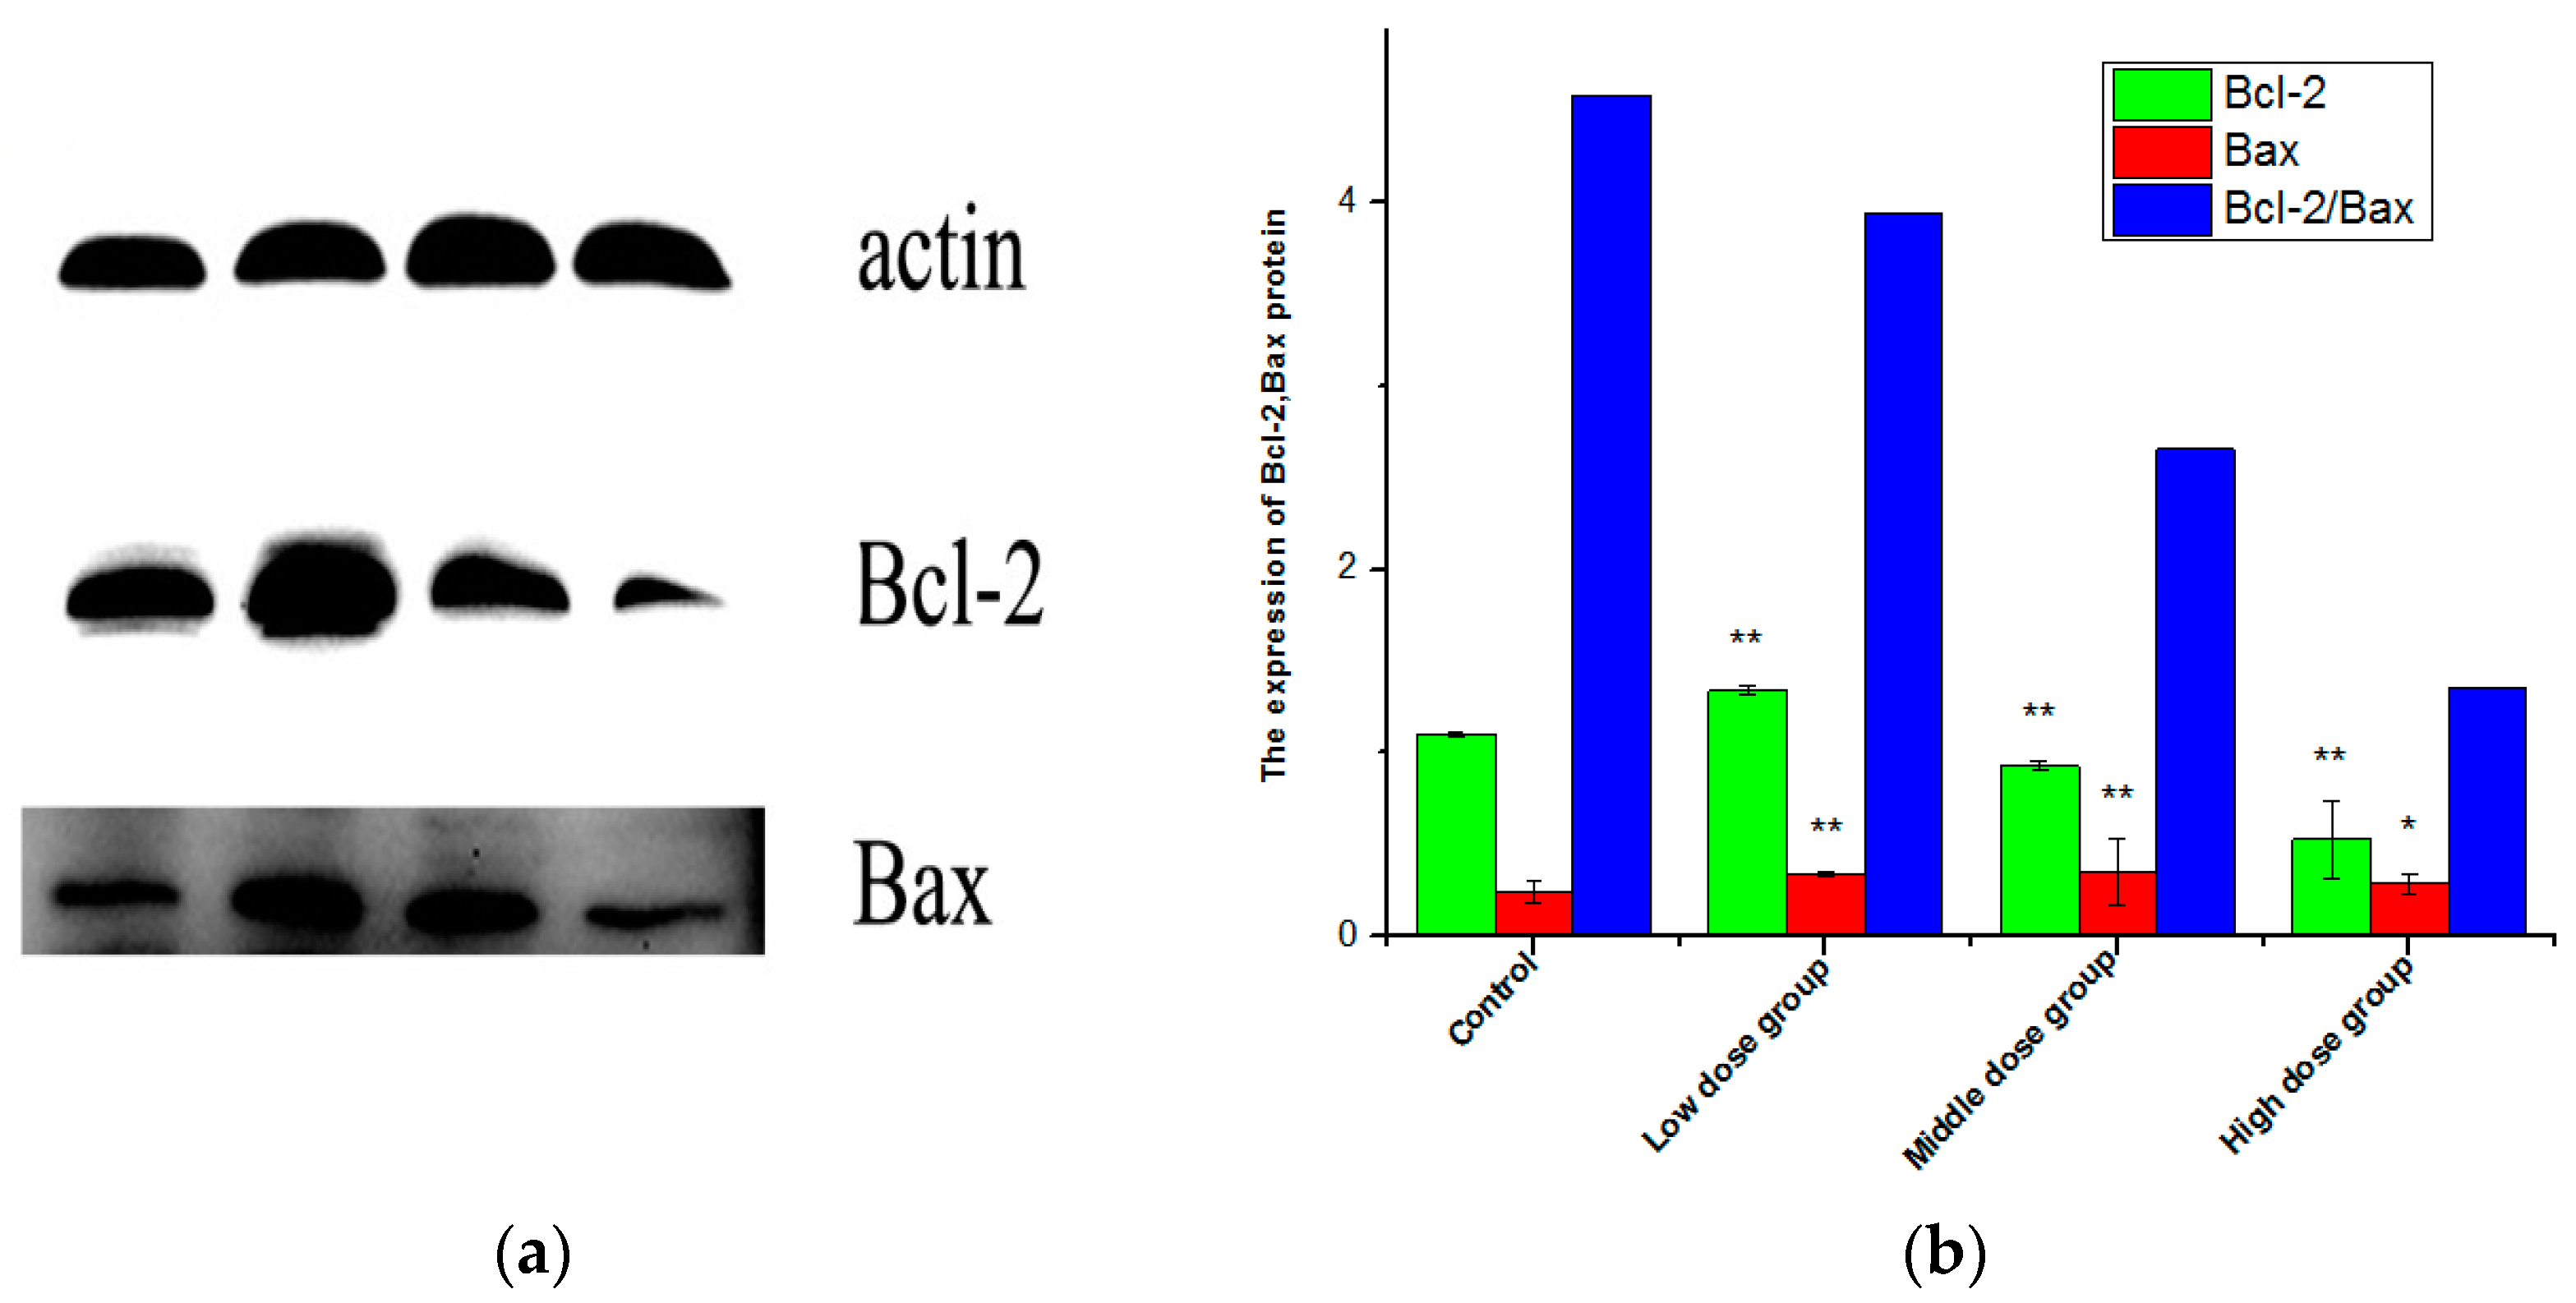
2.9. Expression of Bax, Bcl-2, and the Ratio of Bcl-2/Bax
3. Discussion
4. Materials and Methods
4.1. Inhibition of Cell Proliferation
4.2. The Morphologic Change
4.3. DAPI Staining
4.4. Apoptosis Analysis
4.5. Cell Cycle Measurements
4.6. Intracellular Free Ca2+ Detection
4.7. Mitochondrial Membrane Potential Assay
4.8. Immunohistochemical Staining
4.9. Expression of Bax, Bcl-2, and the Ratio of Bcl-2/Bax
4.10. Statistics
Acknowledgments
Author Contributions
Conflicts of Interest
References
- Wu, J.; Zern, M.A. Hepatic stellate cells: A target for the treatment of liver fibrosis. J. Gastroenterol. 2000, 35, 665–672. [Google Scholar] [CrossRef] [PubMed]
- Schon, H.T.; Bartneck, M.; Borkham-Kamphorst, E.; Nattermann, J.; Lammers, T.; Tacke, F.; Weiskirchen, R. Pharmacological intervention in hepatic stellate cell activation and hepatic fibrosis. Front. Pharmacol. 2016, 7, 1–22. [Google Scholar] [CrossRef] [PubMed]
- Luedde, T.; Schwabe, R.F. NF-κB in the liver—Linking injury, fibrosis and hepatocellular carcinoma. Nat. Rev. Gastroenterol. Hepatol. 2011, 8, 108–118. [Google Scholar] [CrossRef] [PubMed]
- Philips, G.M.; Chan, I.S.; Swiderska, M.; Schroder, V.T.; Guy, C.; Karaca, G.F.; Moylan, C.; Venkatraman, T.; Feuerlein, S.; Syn, W.K.; et al. Hedgehog signaling antagonist promotes regression of both liver fibrosis and hepatocellular carcinoma in a murine model of primary liver cancer. PLoS ONE 2011, 6, e23943. [Google Scholar] [CrossRef] [PubMed]
- Ramachandran, P.; Iredale, J.P. Liver fibrosis: A bidirectional model of fibrogenesis and resolution. QJM 2012, 105, 813–817. [Google Scholar] [CrossRef] [PubMed]
- Iredale, J.P. Models of liver fibrosis: Exploring the dynamic nature of inflammation and repair in a solid organ. J. Clin. Investig. 2007, 117, 539–548. [Google Scholar] [CrossRef] [PubMed]
- Iredale, J.P. Cirrhosis: New research provides a basis for rational and targeted treatments. Br. Med. J. 2003, 327, 143–147. [Google Scholar] [CrossRef] [PubMed]
- Czaja, A.J. Hepatic inflammation and progressive liver fibrosis in chronic liver disease. World J. Gastroenterol. 2014, 20, 2515–2532. [Google Scholar] [CrossRef] [PubMed]
- Yin, C.; Evason, K.J.; Asahina, K.; Stainier, D.Y. Hepatic stellate cells in liver development, regeneration, and cancer. J. Clin. Investig. 2013, 123, 1902–1910. [Google Scholar] [CrossRef] [PubMed]
- Kisseleva, T.; Cong, M.; Paik, Y.H.; Scholten, D.; Jiang, C.; Benner, C.; Iwaisako, K.; Moore-Morris, T.; Scott, B.; Tsukamoto, H. Myofibroblasts revert to an inactive phenotype during regression of liver fibrosis. Proc. Natl. Acad. Sci. USA 2012, 109, 9448–9453. [Google Scholar] [CrossRef] [PubMed]
- Troeger, J.S.; Mederacke, I.; Gwak, G.Y.; Dapito, D.H.; Mu, X.; Hsu, C.C.; Pradere, J.P.; Friedman, R.A.; Schwabe, R.F. Deactivation of hepatic stellate cells during liver fibrosis resolution in mice. Gastroenterology 2012, 143, 1073–1083. [Google Scholar] [CrossRef] [PubMed]
- Krizhanovsky, V.; Yon, M.; Dickins, R.A.; Hearn, S.; Simon, J.; Miething, C.; Yee, H.; Zender, L.; Lowe, S.W. Senescence of activated stellate cells limits liver fibrosis. Cell 2008, 134, 657–667. [Google Scholar] [CrossRef] [PubMed]
- Liu, J. Oleanolic acid and ursolic acid: Research perspectives. J. Ethnopharmacol. 2005, 100, 92–94. [Google Scholar] [CrossRef] [PubMed]
- Xu, K.; Chu, F.; Li, G.; Xu, X.; Wang, P.; Song, J.; Zhou, S.; Lei, H. Oleanolic acid synthetic oligoglycosides: A review on recent progress in biological activities. Die Pharm. Int. J. Pharm. Sci. 2014, 69, 483–495. [Google Scholar]
- Rufino-Palomares, E.E.; Perez-Jimenez, A.; Reyes-Zurita, F.J.; Garcia Salguero, L.; Mokhtari, K.; Herreramerchan, A.; Medina, P.P.; Peragon, J.; Lupianez, J.A. Anti-cancer and anti-angiogenic properties of various natural pentacyclic triterpenoids and some of their chemical derivatives. Curr. Org. Chem. 2015, 19, 919–947. [Google Scholar] [CrossRef]
- Reyeszurita, F.J.; Medinao’Donnell, M.; Ferrermartín, R.M.; Rufinopalomares, E.E.; Martinfonseca, S.; Rivas, F.; Martinez, A.; Garcia-Granados, A.; Perez-Jimenez, A.; GarciaSalguero, L.; et al. The oleanolic acid derivative, 3-O-succinyl-28-O-benzyl oleanolate, induces apoptosis in B16-F10 melanoma cells via the mitochondrial apoptotic pathway. RSC Adv. 2016, 6, 93590–93601. [Google Scholar] [CrossRef]
- Medina-O’Donnell, M.; Rivas, F.; Reyes-Zurita, F.J.; Martinez, A.; Martin-Fonseca, S.; Garcia-Granados, A.; Ferrer-Martín, R.M.; Lupiañez, J.A.; Parra, A. Semi-synthesis and antiproliferative evaluation of PEGylated pentacyclic triterpenes. Eur. J. Med. Chem. 2016, 118, 64–78. [Google Scholar]
- Fang, Y.; Yang, Z.; Ouyang, H.; Wang, R.; Li, J.; Huang, H.; Jin, Y.; Feng, Y.; Yang, S. Synthesis and biological evaluation of Hederacolchiside A 1 derivatives as anticancer agents. Bioorg. Med. Chem. Lett. 2016, 26, 4576–4579. [Google Scholar] [CrossRef] [PubMed]
- Wei, G.; Luan, W.; Wang, S.; Cui, S.; Li, F.; Liu, Y.; Liu, Y.; Cheng, M. A library of 1,2,3-triazole-substituted oleanolic acid derivatives as anticancer agents: Design, synthesis, and biological evaluation. Org. Biomol. Chem. 2015, 13, 1507–1514. [Google Scholar] [CrossRef] [PubMed]
- Parra, A.; Martin-Fonseca, S.; Rivas, F.; Reyes-Zurita, F.J.; Medina-O'Donnell, M.; Martinez, A.; Garcia-Granados, A.; Lupiañez, J.A.; Albericio, F. Semi-synthesis of acylated triterpenes from olive-oil industry wastes for the development of anticancer and anti-HIV agents. Eur. J. Med. Chem. 2014, 74, 278–301. [Google Scholar] [CrossRef] [PubMed]
- Fu, L.; Lin, Q.X.; Liby, K.T.; Sporn, M.B.; Gribble, G.W. An efficient synthesis of methyl 2-cyano-3,12-dioxoursol-1,9-dien-28-oate (CDDU-methyl ester): Analogues, biological activities, and comparison with oleanolic acid derivatives. Org. Biomol. Chem. 2014, 12, 5192–5200. [Google Scholar] [CrossRef] [PubMed]
- Huang, Z.; Fu, J.; Liu, L.; Sun, Y.; Lai, Y.; Ji, H.; Knaus, E.E.; Tian, J.; Zhang, Y. Glycosylated diazeniumdiolate-based oleanolic acid derivatives: Synthesis, in vitro and in vivo biological evaluation as anti-human hepatocellular carcinoma agents. Org. Biomol. Chem. 2012, 10, 3882–3891. [Google Scholar] [CrossRef] [PubMed]
- Wu, L.M.; Wu, X.X.; Sun, Y.; Kong, X.W.; Zhang, Y.H.; Xu, Q. A novel synthetic oleanolic acid derivative (CPU-II2) attenuates liver fibrosis in mice through regulating the function of hepatic stellate cells. J. Biomed. Sci. 2008, 15, 251–259. [Google Scholar] [CrossRef] [PubMed]
- Wang, P.; She, G.; Yang, Y.; Li, Q.; Zhang, H.; Liu, J.; Cao, Y.; Xu, X.; Lei, H. Synthesis and biological evaluation of new ligustrazine derivatives as anti-tumor agents. Molecules 2012, 17, 4972–4985. [Google Scholar] [CrossRef] [PubMed]
- Zhang, C.; Yan, W.; Li, B.; Xu, B.; Gong, Y.; Chu, F.; Zhang, Y.; Yao, Q.; Wang, P.; Lei, H. A new ligustrazine derivative-selective cytotoxicity by suppression of NF-κB/p65 and COX-2 expression on human hepatoma cells. Part 3. Int. J. Mol. Sci. 2015, 16, 16401–16413. [Google Scholar] [CrossRef] [PubMed]
- Wang, P.; Zhang, Y.; Xu, K.; Li, Q.; Zhang, H.; Guo, J.; Pang, D.; Cheng, Y.; Lei, H. A new ligustrazine derivative—Pharmacokinetic evaluation and antitumor activity by suppression of NF-κB/p65 and COX-2 expression in S180 mice. Die Pharm. 2013, 68, 782–789. [Google Scholar]
- Zhang, F.; Kong, D.S.; Zhang, Z.L.; Lei, N.; Zhu, X.J.; Zhang, X.P.; Chen, L.; Lu, Y.; Zheng, S.Z. Tetramethylpyrazine induces G0/G1 cell cycle arrest and stimulates mitochondrial-mediated and caspase-dependent apoptosis through modulating ERK/p53 signaling in hepatic stellate cells in vitro. Apoptosis 2013, 18, 135–149. [Google Scholar] [CrossRef] [PubMed]
- Zhang, X.; Zhang, F.; Kong, D.; Wu, X.; Lian, N.; Chen, L.; Lu, Y.; Zheng, S. Tetramethylpyrazine inhibits angiotensin II-induced activation of hepatic stellate cells associated with interference of platelet-derived growth factor β receptor pathways. FEBS J. 2014, 281, 2754–2768. [Google Scholar] [CrossRef] [PubMed]
- Wu, X.; Zhang, F.; Xiong, X.; Lu, C.; Lian, N.; Lu, Y.; Zheng, S. Tetramethylpyrazine reduces inflammation in liver fibrosis and inhibits inflammatory cytokine expression in hepatic stellate cells by modulating NLRP3 inflammasome pathway. IUBMB Life 2015, 67, 312–321. [Google Scholar] [CrossRef] [PubMed]
- Lin, C.; Wen, X.; Sun, H. Oleanolic acid derivatives for pharmaceutical use: A patent review. Expert. Opin. Ther. Pat. 2016, 26, 643–655. [Google Scholar] [CrossRef] [PubMed]
- Zheng, X.; Zheng, Q.; Bo, S.; Zeng, X.; Wei, Y.; Lei, S.; Xiao, X.; Xiao, J.; Wang, Z. Advances in research on hepatoprotective activity and synthesis of oleanolic acid derivatives. J. Appl. Biopharm. Pharmacokinet. 2015, 3, 27–33. [Google Scholar] [CrossRef]
- Xu, K.; Xu, X.; Chu, F.; Wang, M.; Wang, P.; Li, G.; Song, J.; Zhang, Y.; Lei, H. Synthesis and biological evaluation of T-OA analogues as the cytotoxic agents. Res. Chem. Intermed. 2015, 41, 6257–6269. [Google Scholar] [CrossRef]
- Chu, F.; Xu, X.; Li, G.; Gu, S.; Xu, K.; Gong, Y.; Xu, B.; Wang, M.; Zhang, H.; Zhang, Y.; et al. Amino acid derivatives of ligustrazine-oleanolic acid as new cytotoxic agents. Molecules 2014, 19, 18215–18231. [Google Scholar] [CrossRef] [PubMed]
- Wang, M.; Ruan, Y.; Chen, Q.; Li, S.; Wang, Q.; Cai, J. Curcumin induced HepG2 cell apoptosis-associated mitochondrial membrane potential and intracellular free Ca2+ concentration. Eur. J. Pharmacol. 2011, 650, 41–47. [Google Scholar] [CrossRef] [PubMed]
- Liu, Z.; Gong, L.; Li, X.; Ye, L.; Wang, B.; Liu, J.; Qiu, J.; Jiao, H.; Zhang, W.; Chen, J.; et al. Infrasound increases intracellular calcium concentration and induces apoptosis in hippocampi of adult rats. Mol. Med. Rep. 2012, 5, 73–77. [Google Scholar] [CrossRef] [PubMed]
- Kucharczak, J.; Simmons, M.J.; Fan, Y.; Gélinas, C. To be, or not to be: NF-κB is the answer–role of Rel/NF-κB in the regulation of apoptosis. Oncogene 2003, 22, 8961–8982. [Google Scholar] [CrossRef] [PubMed]
- Von Rahden, B.H.A.; Stein, H.J.; Pühringer, F.; Koch, I.; Langer, R.; Piontek, G.; Siewert, J.R.; Höfler, H.; Sarbia, M. Coexpression of cyclooxygenases (COX-1, COX-2) and vascular endothelial growth factors (VEGF-A, VEGF-C) in esophageal adenocarcinoma. Cancer Res. 2005, 65, 5038–5044. [Google Scholar] [CrossRef] [PubMed]
- Costa, C.; Soares, R.; Reis-Filho, J.S.; Leitão, D.; Amendoeira, I.; Schmitt, F.C. Cyclo-oxygenase 2 expression is associated with angiogenesis and lymph node metastasis in human breast cancer. J. Clin. Pathol. 2002, 55, 429–434. [Google Scholar] [CrossRef] [PubMed]
- Cory, S.; Adams, J.M. The Bcl2 family: Regulators of the cellular life-or-death switch. Nat. Rev. Cancer 2002, 2, 647–656. [Google Scholar] [CrossRef] [PubMed]
- Borner, C. The Bcl-2 protein family: Sensors and checkpoints for life-or-death decisions. Mol. Immunol. 2003, 39, 615–647. [Google Scholar] [CrossRef]
- Bataller, R.; Brenner, D.A. Hepatic stellate cells as a target for the treatment of liver fibrosis. Semin. Liver Dis. 2001, 21, 437–451. [Google Scholar] [CrossRef] [PubMed]
- Bruce, A.; Alexander, J.; Julian, L.; David, M.; Martin, R.; Keith, R.; Peter, W. Molecular Biology of the Cell, 6th ed.; Garland Science: New York, NY, USA, 2015; pp. 2, 1023, 1024, 1029, 1032. ISBN 978-0815344322. [Google Scholar]
- Green, D.R.; Reed, J.C. Mitochondria and apoptosis. Science 1998, 281, 1309. [Google Scholar] [CrossRef] [PubMed]
- Desagher, S.; Martinou, J.C. Mitochondria as the central control point of apoptosis. Trends Cell Biol. 2000, 10, 369–377. [Google Scholar] [CrossRef]
- Ly, J.D.; Grubb, D.R.; Lawen, A. The mitochondrial membrane potential (Δψm) in apoptosis; an update. Apoptosis 2003, 8, 115–128. [Google Scholar] [CrossRef] [PubMed]
- Vayssiere, J.-L.; Petit, P.X.; Risler, Y.; Mignotte, B. Commitment to apoptosis is associated with changes in mitochondrial biogenesis and activity in cell lines conditionally immortalized with simian virus 40. Proc. Natl. Acad. Sci. USA 1994, 91, 11752–11756. [Google Scholar] [CrossRef] [PubMed]
- Zoratti, M.; Szabo, I. The mitochondrial permeability transition. Biochim. Biophys. Acta 1995, 1241, 139–176. [Google Scholar] [CrossRef]
- Kroemer, G.; Reed, J.C. Mitochondrial control of cell death. Nat. Med. 2000, 6, 513–519. [Google Scholar] [CrossRef] [PubMed]
- Xu, X.; Chen, D.; Ye, B.; Zhong, F.; Chen, G. Curcumin induces the apoptosis of non-small cell lung cancer cells through a calcium signaling pathway. Int. J. Mol. Med. 2015, 35, 1610–1616. [Google Scholar] [CrossRef] [PubMed]
- Li, J.H.; Yue, W.; Huang, Z.; Chen, Z.; Zhan, Q.; Ren, F.; Liu, J.; Fu, S. Calcium overload induces C6 rat glioma cell apoptosis in sonodynamic therapy. Int. J. Radiat. Biol. 2011, 87, 1061–1066. [Google Scholar] [CrossRef] [PubMed]
- Seo, S.R.; Seo, J.T. Calcium overload is essential for the acceleration of staurosporine induced cell death following neuronal differentiation in PC12 cells. Exp. Mol. Med. 2009, 41, 269–276. [Google Scholar] [CrossRef] [PubMed]
- Hajnóczky, G.; Davies, E.; Madesh, M. Calcium signaling and apoptosis. Biochem. Biophys. Res. Commun. 2003, 304, 445–454. [Google Scholar] [CrossRef]
- Hu, J.; Zhao, T.Z.; Chu, W.H.; Luo, C.X.; Tang, W.H.; Yi, L.; Feng, H. Protective effects of 20-hydroxyecdysone on CoCl2-induced cell injury in PC12 cells. J. Cell. Biochem. 2010, 111, 1512–1521. [Google Scholar] [CrossRef] [PubMed]
- Sun, B.; Karin, M. NF-κB signaling, liver disease and hepatoprotective agents. Oncogene 2008, 27, 6228–6244. [Google Scholar] [CrossRef] [PubMed]
- Shishodia, S.; Amin, H.M.; Lai, R.; Aggarwal, B.B. Curcumin (diferuloylmethane) inhibits constitutive NF-κB activation, induces G1/S arrest, suppresses proliferation, and induces apoptosis in mantle cell lymphoma. Biochem. Pharmacol. 2005, 70, 700–713. [Google Scholar] [CrossRef] [PubMed]
- Elsharkawy, A.M.; Wright, M.C.; Hay, R.T.; Arthur, M.J.; Hughes, T.; Bahr, M.J.; Degitz, K. Persistent activation of nuclear factor-κB in cultured rat hepatic stellate cells involves the induction of potentially novel rel-like factors and prolonged changes in the expression of IκB family proteins. Hepatology 1999, 30, 761–769. [Google Scholar] [CrossRef] [PubMed]
- Lang, A.; Schoonhoven, R.; Tuvia, S.; Rippe, R.A. Nuclear factor κB in proliferation, activation, and apoptosis in rat hepatic stellate cells. J. Hepatol. 2000, 33, 49–58. [Google Scholar] [CrossRef]
- Gallois, C.; Habib, A.; Tao, J.; Moulin, S.; Maclouf, J.; Mallat, A.; Lotersztajn, S. Role of NF-κB in the Antiproliferative Effect of Endothelin-1 and Tumor Necrosis Factor-α in Human Hepatic Stellate Cells Involvement of Cyclooxygenase-2. J. Biol. Chem. 1998, 273, 23183–23190. [Google Scholar] [CrossRef] [PubMed]
- Bitencourt, S.; de Mesquita, F.C.; Caberlon, E.; da Silva, G.V.; Basso, B.S.; Ferreira, G.A.; de Oliveira, J.R. Capsaicin induces de-differentiation of activated hepatic stellate cell. Biochem. Cell Biol. 2012, 90, 683–690. [Google Scholar] [CrossRef] [PubMed]
- Efsen, E.; Bonacchi, A.; Pastacaldi, S.; Valente, A.J.; Wenzel, U.O.; Tosti-Guerra, C.; Pinzani, M.; Laffi, G.; Abboud, H.E.; Gentilini, P. Agonist-specific regulation of monocyte chemoattractant protein-1 expression by cyclooxygenase metabolites in hepatic stellate cells. Hepatology 2001, 33, 713–721. [Google Scholar] [CrossRef] [PubMed]
- Jeong, S.W.; Jang, J.Y.; Lee, S.H.; Kim, S.G.; Cheon, Y.K.; Kim, Y.S.; Cho, Y.D.; Kim, H.S.; Lee, J.S.; Jin, S. Increased expression of cyclooxygenase-2 is associated with the progression to cirrhosis. Korean J. Intern. Med. 2010, 25, 364–371. [Google Scholar] [CrossRef] [PubMed]
- Zhao, Y.; Wang, Y.; Wang, Q.; Liu, Z.; Liu, Q.; Deng, X. Hepatic stellate cells produce vascular endothelial growth factor via phospho-p44/42 mitogen–activated protein kinase/cyclooxygenase-2 pathway. Mol. Cell. Biochem. 2012, 359, 217–223. [Google Scholar] [CrossRef] [PubMed]
- Ren, Z.L.; Zuo, P.P. Neural regeneration: Role of traditional Chinese medicine in neurological diseases treatment. J. Pharmacol. Sci. 2012, 120, 139–145. [Google Scholar] [CrossRef] [PubMed]
- Chan, J.K.C. The Wonderful Colors of the Hematoyxlin–Eosin Stain in Diagnostic Surgical Pathology. Int. J. Surg. Pathol. 2014. [Google Scholar] [CrossRef] [PubMed]
- Sample Availability: Samples of the compound GTOA are available from the authors.


© 2016 by the authors. Licensee MDPI, Basel, Switzerland. This article is an open access article distributed under the terms and conditions of the Creative Commons Attribution (CC-BY) license ( http://creativecommons.org/licenses/by/4.0/).
Share and Cite
Bi, S.; Chu, F.; Wang, M.; Li, B.; Mao, P.; Zhang, H.; Wang, P.; Guo, W.; Xu, L.; Ren, L.; et al. Ligustrazine-Oleanolic Acid Glycine Derivative, G-TOA, Selectively Inhibited the Proliferation and Induced Apoptosis of Activated HSC-T6 Cells. Molecules 2016, 21, 1599. https://doi.org/10.3390/molecules21111599
Bi S, Chu F, Wang M, Li B, Mao P, Zhang H, Wang P, Guo W, Xu L, Ren L, et al. Ligustrazine-Oleanolic Acid Glycine Derivative, G-TOA, Selectively Inhibited the Proliferation and Induced Apoptosis of Activated HSC-T6 Cells. Molecules. 2016; 21(11):1599. https://doi.org/10.3390/molecules21111599
Chicago/Turabian StyleBi, Siling, Fuhao Chu, Mina Wang, Bi Li, Pei Mao, Huazheng Zhang, Penglong Wang, Wenbo Guo, Liang Xu, Liwei Ren, and et al. 2016. "Ligustrazine-Oleanolic Acid Glycine Derivative, G-TOA, Selectively Inhibited the Proliferation and Induced Apoptosis of Activated HSC-T6 Cells" Molecules 21, no. 11: 1599. https://doi.org/10.3390/molecules21111599